Abstract
To address the challenge of detecting tiny flaws in tile defect detection, a lightweight algorithm for identifying minor defects in tile images has been developed, referred to as CTDD-YOLO. Firstly, CAACSPELAN is proposed as the core component of the backbone network for extracting features of tile defects; secondly, full-dimensional dynamic convolution ODConv is introduced at the end of the backbone network to enhance the model’s ability to deal with tiny defects; next, a new neck network, CGRFPN, is proposed to improve the model’s ability to represent multi-scale features and enhance the model’s ability to recognize small targets in the context of large formats; finally, MPNWD is proposed to optimize the loss function to improve the model’s detection accuracy further. Experiments on the Ali Tianchi tile defect detection dataset show that the CTDD-YOLO model not only has a lower number of parameters than the original YOLOv8n but also improves the mAP by 7.2 percentage points, i.e., the proposed model can more accurately recognize and deal with minor surface defects of tiles and can significantly improve the detection effect while maintaining the light weight.
1. Introduction
China is the world’s most extensive tile production base and exporting country. Therefore, the quality of China’s ceramic tile affects the international building ceramics industry. The continuous development of the national economy has resulted in an increasing demand for ceramic tiles, prompting enhancements in both manufacturing processes and equipment. China’s ceramic tile enterprises in the production, processing, and other aspects of automation have been realized [1].
The production process of ceramic tile includes the following main steps: grinding clay, quartz, and other raw materials in the ball mill into uniform fine mud and then removing large particles and impurities through the sieve to improve the uniformity and quality of the mud. Then, the static mud undergoes a stale process so that the water and mineral composition is evenly distributed, improving the plasticity and stability. Then, the material is formed into a brick embryo, dried after the glaze and printing, and then through the high-temperature firing to form the final ceramic tile. Then, the ceramic tile is polished and undergoes further processing. The defects of the tiles mainly appear in the firing stage, since firing temperature, time, cellar humidity, cellar density, and so on easily cause surface defects to the tiles. To meet the needs of people for the tile’s own strength quality and surface quality, finished tiles must be finished before entering the market for grading and classification. Although the production and processing of ceramic tiles in China has been automated, surface detection still relies on manual inspection methods. This approach depends on the high-intensity work of assembly line workers, whose prolonged exposure to bright lighting leads to visual fatigue.
Furthermore, variability in personal subjective judgment affects the efficiency and stability of the detection process. As a result, the outcomes often fail to meet industrial demands [2]. Therefore, it is of great theoretical and practical value to propose a detection algorithm with strong generalization ability for ceramic tiles and apply it to the automated ceramic tile defect detection equipment.
Over the past few years, significant progress has been made by both domestic and international researchers in the study of algorithms for tile defect detection: among them, Sameer Ahamad [3] et al. performed morphological manipulation on images and used fuzzy rules to classify defects in tiles, Putri et al. [4] developed a method using fuzzy logic to detect defects in ceramics, and Matic et al. [5] introduced a real-time algorithm for segmenting cookie tiles, capable of efficiently distinguishing the cookie tiles from the background. This approach has been implemented in the production line of cookie tiles [6]. Designing a method based on the combination of a sliding filter and region auto-growth to divide the preprocessed ceramic tile defect image into two regions and removing the spurious interference points by morphological operation, extracting the ceramic tile crack feature parameters to give the results of the three-dimensional ceramic tile defect structure detection under the interference of the complex background; Quan Xiaoxia et al. [7] using the detection algorithm of local variance weighted information firstly, the initial step involves calculating the discrepancy between the tile image under test and the reference tile image, so as to obtain the difference image of the standard tile, and then the overall contour information of the defective area is preliminarily extracted by using the calculation of the local variance between the pixel points; at last, the defective area is adjusted by the weighted average information firstly, and the detailed information of the defective area is emphasized, thus to show the precise defective region of the tiles; Wang [8] proposed a YOLOv5s (You Only Look Once version 5 Small)-based, single-stage algorithm for detecting defects on tile surfaces, which introduces backbone extraction and attention mechanisms, and employs a depth-separable convolutional model to deepen the network’s ability to characterize defects on small targets and improve detection accuracy; Cao et al. [9] introduced a YOLOv5-based balanced multi-scale target scoring network for detecting tile surface defects which integrates content-aware feature reorganization and a dynamic attention mechanism to improve detection performance.
The methods above have yielded some results in detecting surface imperfections in tiles. However, due to the large format of the tiles, the small size of defects, the complex background, and the minimal color differences between defects and the background, it is easy to miss the defect features of white and dark spots during local feature extraction. Additionally, in the process of feature fusion, defects with slight differences from the background are prone to the loss of semantic information; in addition, the automatic production line has specific requirements for the ceramic tile detection speed and hardware adaptation, so it is necessary to reduce the number of parameters and calculation quantity as much as possible when meeting the accuracy requirements. The detection of minor target defects on tile surfaces remains challenging under these constraints. To address the aforementioned issues, this paper introduces a method for detecting tile surface defects using an enhanced version of YOLOv8, with the following main contributions:
- To address the characteristics of small and challenging-to-extract local features associated with white point and dark point block defects in tile defect detection, CAACSPELAN (Context Anchor Attention Network Cross-Stage Partial Efficient Layer Aggregation Network) is proposed as a replacement for C2f (Concatenate 2-factor), and ODConv (Omni-Dimensional et al.) [10] is employed to substitute part of the traditional convolution;
- To address the problem that the semantic information of defective targets is lost during the process of feature fusion, the neck network part is redesigned to use the CGRFPN (Context-Guided Spatial Feature Reconstruction for Feature Pyramid Networks) to facilitate the fusion of information using features at various levels and scales so that the model can fully understand and distinguish different types of defects;
- The proposed MPNWD (Minimum Points Normalized Wasserstein Distance) optimized loss function enables the model to detect tiny defects that are usually difficult to capture, thus improving the overall detection accuracy and reliability.
2. Materials and Methods
2.1. YOLOv8 Algorithm
YOLOv8 [11] is a single-stage detection model introduced by Ultralytics 8.0.201 in 2023, which improves on YOLOv5 with better detection speed and accuracy performance and more flexibility than the previous version. The architecture of YOLOv8 comprises three primary components: the backbone, the neck, and the head. Among them, the backbone network performs operations such as convolution and feature extraction on the feature map, which gathers contextual information and extracts high-level semantic features from the input image. Feature maps of varying dimensions are then merged at the neck to combine high-level and low-level feature information, enhancing the detection of targets across different sizes and scales. Ultimately, these fused feature maps at various scales are sent to the detection head to perform target detection, accurately identifying the classification and location of objects of various sizes.
2.2. CTDD-YOLO Network Model
Due to the complexity of tile images and extensive data, invoking a large amount of computational resources for processing is usually necessary. Considering the impact of the computational power limitation on terminal deployment, the problem of lower accuracy of tile defect detection in the face of its unique defective features and more considerable model computation needs to be actively addressed. Therefore, this paper proposes a lightweight large-format tile defect detection method based on the YOLOv8 improvement, named CTDD-YOLO, with the structure shown in Figure 1. The improvement of the method mainly focuses on four aspects: first, considering the diversity and complexity of tile surface textures and patterns, the CAACSPELAN module is proposed to be added to the backbone network; this improves the model’s capacity to detect and analyze intricate textures and flaws on tile surfaces; second, the CGRFPN network is proposed to improve detection accuracy, an improvement that reduces computational complexity and facilitates multi-scale feature fusion; third, given the complexity of the tile background texture and its visual similarity to defects, ODConv is utilized to substitute the traditional convolutional module at the terminal of the backbone network, aiming to improve the model’s capacity to detect minor defects; finally, MPNWD is proposed to optimize the loss function; thus, the model’s detection performance is further enhanced in environments with complex defects.
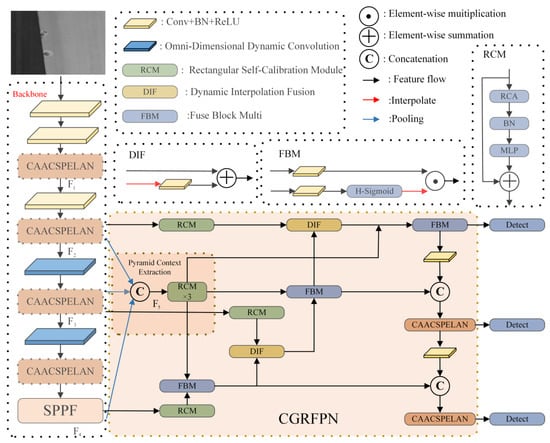
Figure 1.
Structure of CTDD-YOLO.
2.2.1. Improvement of the Backbone Network
To strengthen the model’s capability to capture the impact of complex textures and patterns on tile defect detection, the CAACSPELAN module is introduced to replace the C2f module of the backbone network. Drawing inspiration from the RepNCSPELAN4 (Reparameterized Network Cross-Stage Partial Efficient Layer Aggregation Network 4) module of YOLOv9 [12] and the PKINet (Poly Kernel Inception Network) [13], CAACSPELAN employs Context Anchor Attention to capture distant contextual information and improve the extraction of features related to tiny defects in tiles. Additionally, in the deeper layers of the backbone network, full-dimensional dynamic convolutional ODConv is applied to enhance the model’s ability to handle minor defects and enrich feature representation.
As illustrated in Figure 2, the CAACSPELAN module processes the input data through an initial 1 × 1 convolution followed by a splitting operation, creating two separate streams. One stream retains the original information and proceeds directly to the concatenation step, while the other undergoes further splitting and processing. This latter stream is passed sequentially through a 1 × 1 convolution and the CAACSP (Context Anchor Attention Network Cross-Stage Partial) module. Thanks to the ELAN mechanism, the branches and outputs of each CAACSP are preserved and ultimately merged.
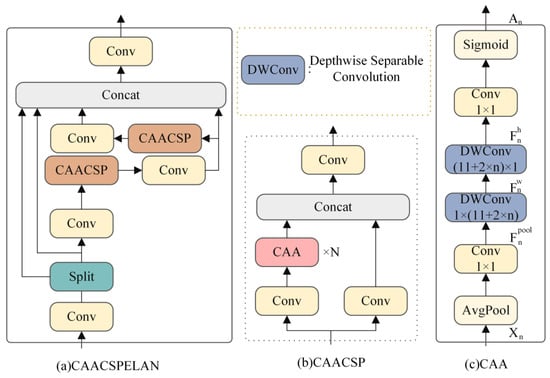
Figure 2.
CAACSPELAN module.
Figure 2b shows the CAACSP structure. The input sequence first undergoes channel expansion via a 1 × 1 convolution. One stream is left unprocessed, retaining the information after convolution, while the other stream passes through an N×CAA operation. A final 1 × 1 pointwise convolution reduces the number of channels to mitigate any information loss caused by CAA.
CAA (Context Anchor Attention), shown in Figure 2c, is designed to capture contextual interdependencies between distant pixels while enhancing central features. Local area features are extracted through average pooling followed by a 1 × 1 convolution.
where denotes the average pooling operation; n is the nth CAACSPELAN module in the backbone network, . We then apply two deep strip convolutions as an approximation to the standard large kernel deep convolution:
Our choice of deep strip convolution is based on two primary considerations. First, strip convolution is lightweight. In contrast to conventional 2D depth convolution, comparable results can be attained by reducing parameters using a pair of 1D depth kernels. Second, strip convolution can facilitate the recognition and extraction of features of elongated objects, such as edge cracks and missing corner defects in tiles. In order to increase the receptive domain of the CAACSPELAN touch block to which the CAA module belongs, we set , i.e., we compute the kernel size as a function of the CAACSPELAN block depth n; e.g., the last CAACSPELAN block in the backbone network is set to , and in order to avoid introducing a significant computational overhead due to larger kernel-size convolutions, the CAACSPELAN modules in the CGRFPN are all set to . This design improves the backbone network’s capability to connect long-range pixels while maintaining computational efficiency, as the strip depth design does not substantially raise the computational cost.
Finally, our CAA module obtains an attention mechanism weight:
Here, the function guarantees that is in the range (0, 1).
In the deeper layers of the network, where features related to tile defects may be lost due to convolutional operations across multiple levels, we introduce ODConv. Using a parallel approach, ODConv employs a multidimensional attention mechanism to learn complementary attention across four dimensions of the kernel space. By progressively applying convolution with various attention mechanisms along the dimensions of position, channel, filter, and kernel, the convolution operation is tailored for each input dimension, enhancing its ability to capture extensive contextual information. The following equation can express the output of ODConv:
where denotes the four attentions and the convolution kernel is a variable that represents the multiplication of the convolution kernel along different dimensions in the space.
2.2.2. Loss Function Optimization
To assign higher weights to the regions containing tiny defects in tiles and to help the model learn the features of these defects more effectively, thereby improving the accuracy of defect detection, we propose applying the NWD (Normalized Wasserstein Distance) [14] loss function in conjunction with MPDIoU (Minimum Points Distance Intersection over Union) [15]. The CIoU loss function of MPNWD, optimized for YOLOv8, is obtained through a proportional combination. The specific design procedure of MPNWD is as follows:
For the loss function, there exists a real bounding box as well as a predicted bounding box , , , the input image width and height, the original IoU represents the ratio of the intersection area to the joint area of the predicted and the true bounding box, as shown in Figure 3, and can be expressed as follows:
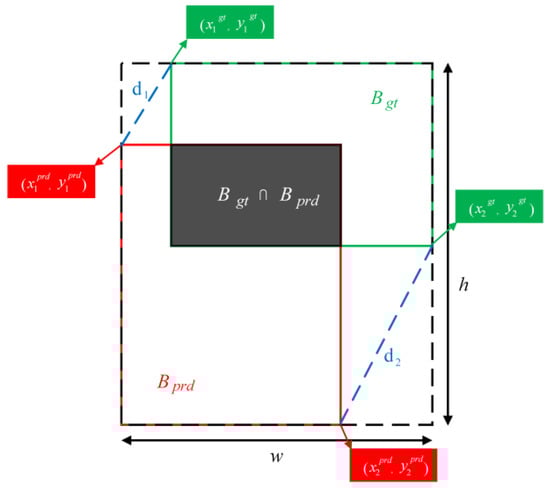
Figure 3.
The IoU calculation factors.
The CIoU loss function in YOLOv8 considers three essential factors: the overlap region, centroid distance, and aspect ratio; however, it does not account for the center position. This limitation prevents the model from accurately capturing the bounding box of tiny targets, thereby reducing detection accuracy. To address this issue, MPDIoU is introduced, and its expression is as follows:
The MPDIoU loss function considers the width and height of the bounding box and its center when performing bounding box regression. For small targets, this loss function can mitigate the challenge of distinguishing defects from the background by applying regression at multiple scales, as the bounding box for small targets is inherently small.
If the predicted bounding box does not overlap with the real bounding box, then the MPDIoU loss function dramatically reduces the model’s ability to update the parameters during backpropagation. The similarity between the mutually contained predicted box and the real box is difficult to compute, so the NWD loss function is introduced. The NWD represents the bounding box by a two-dimensional Gaussian distribution and calculates the similarity between the predicted and actual boxes by its corresponding Gaussian distribution. Its calculation formula is (8) and (9).
where C is a constant, is the second-order Wasserstein distance between the predicted frame and the real frame with two-dimensional Gaussian distributions and . and are the center coordinates of the prediction frame and the real frame, respectively. is the width and height of the predicted frame and is the width and height of the real frame.
Even if tiny defects constitute only a small portion of an image, NWD can effectively capture these defects by calculating the differences in probability distributions. This is because the Wasserstein distance is based on probability matching rather than pixel matching. As a result, the challenges associated with slight differences between defects and the background are mitigated; thus, even minimal defects can be measured and optimized by NWD, provided the model can capture them at the probability distribution level.
The new loss function, MPNWD, is formed by proportionally combining MPDIoU with NWD, as shown in Equation (10). These improvements to the loss function assist the model in learning the features of tiny defects more effectively and better distinguish between defects and the background, thereby enhancing the detection accuracy of tiny defects in tiles.
where is the scale factor, .
2.2.3. CGRFPN
Inspired by the CGRSeg (Context-Guided Spatial Feature Reconstruction for Efficient Semantic Segmentation) [16] network, CGRFPN is designed. It consists of a Pyramid Context Extraction module (Pyramid Context Extraction) as well as Dynamic Interpolation Fusion and Fuse Block Multi and CAACSPELAN modules. The Pyramid Context Extraction module integrates feature information from various levels to improve the model’s contextual awareness. By employing dynamic interpolation and multi-feature fusion techniques, this module further enhances the model’s multi-scale feature representation and boosts its capability to recognize targets in intricate contexts.
- Pyramid Context Extraction
The Rectangular Self-Calibration Module (RCM) is employed to extract pyramid context and utilizes both horizontal and vertical pooling to capture axial context in both dimensions. Additionally, the RCM incorporates the MLP technique to further refine feature representation. As illustrated in Figure 2, the proposed model leverages the backbone network to produce features at various scales, including resolutions such as and . To optimize the network’s efficiency, the largest-scale features, , are discarded. The smaller-scale features, , , and , are downsampled to a size through average pooling and then concatenated to form the pyramid features . These pyramid features are fed into multiple stacked RCMs, where pyramid feature interactions occur, leading to the extraction of scale-aware semantic features. After the pyramid feature extraction, the resulting features are segmented and upsampled back to their original scale. This process is represented as follows:
Here, represents average pooling, which downsamples the features by a given factor. represents the features containing pyramidal context.
To enhance the network’s focus on minor defects, spatial features were reconstructed using the RCM. This process involved fusing low-level spatial features from the backbone network with high-level features at corresponding scales of the PCE through the multi-feature fusion module FBM. The resulting fused features were then represented using the dynamic interpolation technique DIF. The RCM captures the global axial context to model the critical rectangular region, and the shape self-calibration function is subsequently applied to fine-tune the attention region to address minor defects. The detailed process is illustrated in Equation (12).
where CGR represents a feature that has undergone context-guided reconstruction.
- Rectangular Self-Calibration Module
The Rectangular Self-Calibration Module (RCM) emphasizes minor defects and captures the pyramidal context within the axial global context. As illustrated in Figure 1, the module comprises Rectangular Self-Calibration Attention (RCA), batch normalization (BN), and a multi-layer perceptron (MLP).
RCA employs horizontal and vertical pooling to capture the axial global context in two directions, producing two separate axis vectors. By applying broadcast addition to these vectors, RCA effectively models the rectangular region of interest. A shape self-calibration function is introduced to refine this region, aligning it more closely with the foreground object. This process involves independently using two large-kernel strip convolutions to calibrate the attention maps in the horizontal and vertical directions. Initially, horizontal strip convolution is applied to adjust each row of elements, bringing the horizontal shape closer to the foreground object. Following this, the features are normalized using Batch Normalization (BN), and nonlinearities are processed through ReLU. The vertical shape is then calibrated using vertical band convolution, ensuring that convolutions in both directions are decoupled and adaptable to various shapes.
3. Experimental Results and Analysis
3.1. Description of the Experiment
3.1.1. Experimental Environment and Parameter Settings
The experiments were conducted using an NVIDIA GeForce RTX 4090 graphics (The manufacturer of the ROG-STRIX-RTX4090 D-24G-BTF-GAMING graphics card is ASUS. ASUS is headquartered in Taiwan, China.) processor for acceleration within the PyTorch deep learning framework. The input image size was configured to 800 × 800 pixels, and training was performed for 300 iterations. As determined by the experimental setup, a batch size of eight was employed. The SGD optimizer was utilized, with an initial learning rate of 0.001 for the first 200 iterations, which was subsequently reduced to 0.0001 for the final 100 iterations.
3.1.2. Tile Defects Dataset
Most of the defects appearing in the tiles are shown in Figure 4c,e, which are white point defects and dark color point defects, and due to the upgrading of the production line, large-scale defects in tiles do not appear in the production. Given that it is difficult to obtain the tile defects dataset, in this paper, we use the tile surface defects detection dataset of the Ali Tianchi Race (https://tianchi.aliyun.com/dataset/110088, accessed on 10 February 2024) to conduct the study. The dataset has a total of 5388 images. Each image contains one or more different defect targets, which cover a wide range of problems that may occur in the tile production process: edge anomaly, angular anomaly, white dot defect, light block defect, dark dot block defect, and aperture defect, as shown in Figure 4.
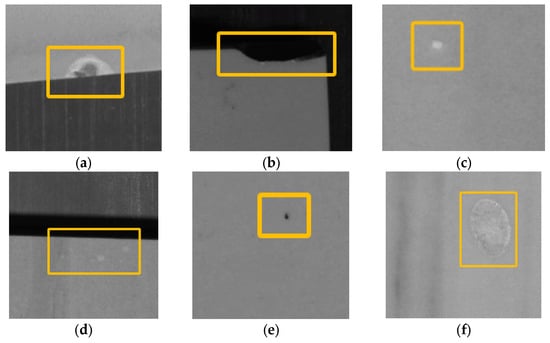
Figure 4.
Visualization of Tile defects. (a) Edge anomaly; (b) Angular anomaly; (c) White dot defect; (d) Light block defect; (e) Dark dot block defect; (f) Aperture defect.
3.1.3. Performance Evaluation and Indicators
This study uses average precision (), precision , and recall as the primary evaluation metrics. Precision and recall are defined in Equation (13), where represents the number of correctly identified object samples, denotes the number of falsely identified object samples, and indicates the number of missed object samples. Average precision () is calculated as described in Equation (14), with representing the total number of prediction categories.
3.2. Data Preprocessing
Given that tile images are characterized by high resolution, and many tile defects are relatively small, this paper adopts a slicing strategy to input high-resolution tile image data into the YOLOv8 model without losing minor target defects due to scaling or missed detection. The original tile image is sliced using a sliding window of 800 × 800 pixels, moving from the upper left corner of the large-format tile image. The step size is smaller than the window size to avoid missing defects at the edges of the sliding window, thus preventing defect leakage.
During image slicing, defects within the current sliding window are determined by comparing the defect positions labeled in the original dataset. This ensures that only image slices containing defects are retained, while background slices without defect information are discarded. Subsequently, the processed image slices are input into the model for training. During prediction, a sliding window of the same size is applied to the original image for detection, followed by result fusion.
Simultaneously, an analysis of the dataset revealed that defect categories and sizes are unevenly distributed. To address this imbalance, the proportions of each defect type and scale in both the training and test sets were maintained to reflect the distribution in the overall dataset. Specifically, the data were randomly split into training and test sets in an 8:2 ratio based on the unique identification number of each tile product. This method ensures that both datasets include a representative sample of all defect types and sizes, allowing for a more comprehensive evaluation of the model’s performance across different datasets and enhancing its ability to learn and generalize across various tile defect scenarios.
3.3. Experimental Results Analysis
3.3.1. Analysis of Pre-Treatment Experiments
In this study, we utilized the YOLOv8n model to conduct experiments. The original and preprocessed datasets were each split into training and test sets in an 8:2 ratio. The original dataset exhibits a complete inability to recognize defect categories such as white dot defects, light-colored block defects, dark-colored dot block defects, and aperture defects, resulting in a meager overall recognition rate. In contrast, the preprocessed dataset demonstrates significantly improved performance, clearly validating the effectiveness of data preprocessing. This approach helps prevent the loss of small target defect information due to scaling when feeding tile images into the YOLOv8n model, thereby reducing missed detections. A comparison of accuracy before and after data preprocessing is presented in Table 1, while Table 2 shows the accuracy following data partitioning. Additionally, the accuracy across all defect categories is relatively balanced.

Table 1.
Comparison of accuracy before and after data preprocessing.
Table 2.
Accuracy of the data after division.
To explore the effect of the sliding window slicing method on the experimental results, comparative experiments will be conducted using CTDD-YOLO on the original dataset, the dataset after data slicing, and the dataset after data partitioning (both complete map slicing and sliding window slicing), as shown in Table 3. As illustrated in Table 3, the accuracy of processing the dataset using the whole map slicing method is significantly worse than that of the sliding window slicing method for minor defects such as white spot defects and dark spots. Furthermore, the accuracy for more extensive defects, such as edge and angle abnormalities, shows only minimal improvement when using the whole map slicing method compared to the sliding window slicing method. The sliding window slicing method is more suitable for processing the dataset.
Table 3.
Effect of data preprocessing on CTDD-YOLO.
3.3.2. Ablation Experiments for Optimization Strategies
Ablation experiments were designed in this study, based on the original YOLOv8 model, to assess the influence of each enhancement module on the tile defect detection system. The model obtained by replacing C2f with CAACSPELAN in the YOLOv8 network is denoted as YOLOv8-1. The network model incorporating the MPNWD loss function in the YOLOv8-1 experimental group is called YOLOv8-2. The network model obtained by adding ODConv to the YOLOv8-2 experimental group is denoted as YOLOv8-3. Finally, the network model obtained by adding CGRFPN to YOLOv8-3 is called CTDD-YOLO.
To verify the effectiveness of the optimization strategy, five algorithms—YOLOv8, YOLOv8-1, YOLOv8-2, YOLOv8-3, and CTDD-YOLO—were analyzed in the ablation experiments using the Ali Tianchi tile defect detection dataset. The outcomes of these experiments are presented in Table 4.
Table 4.
Ablation experiment.
Firstly, we replace C2f with lightweight CAACSPELAN, which improves the overall accuracy by 1.7% and reduces the parameter quantity by 0.7 M. Then, we optimize the loss function using MPNWD, resulting in a 1.4% improvement in overall accuracy. Following this, ODConv is introduced at the end of the backbone network, leading to a qualitative enhancement with a 2.7% increase in accuracy while only adding 0.1 M to the parameter count. Finally, adding CGRFPN only increases the number of parameters by 0.3 M, and the overall accuracy is improved by 1.4%. Finally, CTDD-YOLO reduces the GFLOP by 3.3 G compared to the YOLOv8n network, which reduces the computational cost.
3.3.3. CAACSPELAN Analysis
In this subsection, we perform ablation studies on the CAACSPELAN module. By default, we use CTDD-YOLO in all the experiments—different computational blocks. We first perform ablation experiments on the CAACSPELAN module using various computational blocks from other advanced YOLO models in Table 5; as seen in Table 4, our CAACSPELAN has not only lower parametric counts but also higher accuracy than C3, C2f, and ELAN [17]. Compared with RepNELAN4, the accuracy is 1.6% higher with essentially the same number of parameters and slightly higher GFLOPs.
Table 5.
Effect of different computational blocks on CTDD-YOLO.
3.3.4. CGRFPN Analysis
In this section, we showcase CGRFPN’s plug-and-play functionality by substituting the neck structure with various algorithms in different experiments.
The results in Table 6 show that we first replaced PAFPN [18] with CGRFPN in the mainstream single-stage detector YOLOv5n and changed the number of channels to make the model smaller.YOLOv5n-CGRFPN used fewer epochs (200 epochs), increased the parameters by only 0.2 M, and obtained a 1.6% mAP improvement, reflecting the excellent performance of CGRFPN. In addition, we validated the effectiveness of CGRFPN using RT-DETR-R18 [19].
Table 6.
Performance of CGRFPN in other object detectors.
3.3.5. Comparison Results of Different Models
A comparative analysis was conducted against other target detection models to evaluate the models’ performance in this study thoroughly. All models were tested on the same dataset under identical conditions. To enhance the model’s adaptability in resource-limited environments, this research emphasizes the model’s lightweight nature, aiming to boost performance while maintaining or reducing the number of parameters whenever feasible. The study compares the proposed models with the current popular detection algorithms, including newer algorithms such as Gold-YOLO [20], proposed by Huawei, and some lightweight, improved YOLOv8 algorithms. The improved CTDD-YOLO models introduced in this paper outperform most models in terms of evaluation metrics.
Notably, lightweight models like YOLOv8-MobileNetV4 [21], YOLOv8-StarNet [22], and YOLOv8-RepViT [23]—which modify the YOLOv8n backbone—achieve parameter and computational complexity reductions. However, these improvements result in a slight decrease in accuracy. Despite this, the CTDD-YOLO model demonstrates a clear advantage over Gold-YOLO. Compared with a larger model, YOLOv8l, CTDD-YOLO achieves a parameter count of roughly one-tenth that of YOLOv8l, although its accuracy is 1.1% lower, thus improving model efficiency.
While the enhanced CTDD-YOLO model does not fully achieve state-of-the-art results in terms of accuracy and FPS, this trade-off is balanced by gains in resource efficiency and deployment flexibility. Despite the relative increase in computational burden, the overall detection accuracy has improved. Although the inference speed is slightly slower than other models, the model still achieves an FPS of 356, representing an overall solid performance. The comparative effect of different algorithms is shown in Table 7.
Table 7.
Comparison of results of different algorithms.
3.3.6. Visualization Experiments
The detection outcomes illustrated in Figure 5 show that the enhanced model achieves superior accuracy in identifying defects across different tile scenarios, outperforming the original model. The unimproved model captures fewer tile defects than CTDD-YOLO.
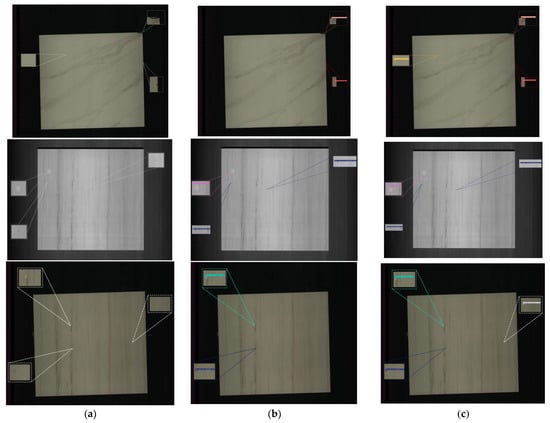
Figure 5.
Visual comparison of detection performance. (a) Original figure; (b) Baseline; (c) CTDD-YOLO.
3.3.7. The Generalization of the Experiment
Using the PCB_DATASET, NEU surface defect dataset (NEU-DET), and Ali Tianchi Contest open aluminum surface defect dataset as experimental subjects, this chapter highlights the generalizability of the proposed algorithms by comparing the detection performance of YOLOv8n and CTDD-YOLO. The PCB_DATASET comprises six types of PCB surface defects, with mouse bite marks and burr defects characterized by small targets and minimal contrast with the background. The detection challenges in the tile, NEU-DET, and aluminum surface defect datasets arise from the diversity in target sizes and numerous minor defects, making them well-suited for evaluating the universality of the algorithms. The experimental results are presented in Table 8.
Table 8.
The generalization of the experiment.
Table 8 indicates that the algorithm’s precision (P), recall (R), and mean average precision (mAP) values surpass those of the benchmark algorithm across three different datasets. Notably, in the NEU-DET dataset, the algorithm’s mAP exceeds that of the benchmark by 5.7%, reaching 78.9%. This demonstrates that the algorithm performs robust generalization and detects datasets with large-scale variations and minor defects.
4. Conclusions
In this study, preprocessing was conducted based on the defect characteristics of tiles, with targeted improvements made to the single-stage defect detection algorithm YOLOv8n. The experimental results demonstrate that the improved model is more specialized and adaptable, achieving higher detection accuracy while maintaining a relatively low number of parameters and computational load. This approach significantly enhances both the accuracy and efficiency of tile defect detection. However, despite the improvements in overall accuracy, challenges remain in achieving consistent detection performance, particularly for minor white and black point defects. In future work, we aim to enhance the model’s accuracy further and implement it on edge devices for real-world industrial applications.
Author Contributions
Conceptualization, D.W. and J.P.; methodology, S.L.; software, D.W.; validation, D.W., J.P. and W.F.; formal analysis, S.L.; investigation, D.W.; resources, J.P.; data curation, D.W.; writing—original draft preparation, D.W.; writing—review and editing, D.W.; visualization, D.W.; supervision, J.P.; project administration, W.F.; funding acquisition, S.L. All authors have read and agreed to the published version of the manuscript.
Funding
This work was supported by the Fuxiaquan National Independent Innovation Demonstration Zone High end Flexible Intelligent Packaging Equipment Collaborative Innovation Platform Project (2023-P-006); 2022 Fujian Provincial Key Project for Science and Technology Innovation (2022G02007).
Data Availability Statement
The data presented in this study are available on request from the corresponding author. The data are not publicly available due to privacy concerns.
Conflicts of Interest
The authors declare no conflicts of interest.
References
- Chen, X.C. Discussion on the Causes and Solutions of Surface Defects in Ceramic Tile Products. Foshan Ceram. 2016, 26, 44–47+57. [Google Scholar]
- Hanzaei, S.H.; Afshar, A.; Barazandeh, F. Automatic detection and classification of the ceramic tiles’ surface defects. Pattern Recognit. 2017, 66, 174–189. [Google Scholar] [CrossRef]
- Sameer Ahamad, N.; Bhaskara Rao, J. Analysis and detection of surface defects in ceramic tile using image processing techniques. In Microelectronics, Electromagnetics and Telecommunications: Proceedings of ICMEET 2015; Springer: Delhi, India, 2016. [Google Scholar]
- Putri, A.P.; Rachmat, H.; Atmaja, D.S.E. Design of automation system for ceramic surface quality control using fuzzy logic method at Balai Besar Keramik (BBK). In MATEC Web of Conferences; EDP Sciences: Les Ulis, France, 2017. [Google Scholar]
- Matić, T.; Aleksi, I.; Hocenski, Ž.; Kraus, D. Real-time biscuit tile image segmentation method based on edge detection. ISA Trans. 2018, 76, 246–254. [Google Scholar] [CrossRef] [PubMed]
- Li, X.L.; Zeng, S.G.; Zheng, S.; Xiao, Y.S.; Zhang, S.W.; Li, Q. Surface crack detection of ceramic tile based on sliding filter and automatic region growth. Laser Optoelectron. Prog. 2019, 56, 211003. [Google Scholar]
- Quan, X.X.; Li, J.H.; Wang, Y.L. Ceramic tile surface defect detection based on local variance weighted information entropy. Chin. Ceram. 2019, 55, 46–55. [Google Scholar]
- Wan, G.; Fang, H.; Wang, D.; Yan, J.; Xie, B. Ceramic tile surface defect detection based on deep learning. Ceramics International. 2022, 48, 11085–11093. [Google Scholar] [CrossRef]
- Cao, T.; Song, K.; Xu, L.; Feng, H.; Yan, Y.; Guo, J. Balanced multi-scale target score network for ceramic tile surface defect detection. Measurement 2024, 224, 113914. [Google Scholar] [CrossRef]
- Li, C.; Zhou, A.; Yao, A. Omni-dimensional dynamic convolution. arXiv 2022, arXiv:2209.07947. [Google Scholar]
- Jocher, G.; Chaurasia, A.; Qiu, J. YOLO by Ultralytics. 2023. Available online: https://github.com/ultralytics/ultralytics (accessed on 11 November 2023).
- Wang, C.Y.; Yeh, I.H.; Liao, H.Y.M. YOLOv9: Learning What You Want to Learn Using Programmable Gradient Information. arXiv 2024, arXiv:2402.13616. [Google Scholar]
- Cai, X.; Lai, Q.; Wang, Y.; Wang, W.; Sun, Z.; Yao, Y. Poly kernel inception network for remote sensing detection. In Proceedings of the IEEE/CVF Conference on Computer Vision and Pattern Recognition, Seattle, WA, USA, 16–22 June 2024. [Google Scholar]
- Wang, J.; Xu, C.; Yang, W.; Yu, L. A normalized Gaussian Wasserstein distance for tiny object detection. arXiv 2021, arXiv:2110.13389. [Google Scholar]
- Ma, S.; Xu, Y. Mpdiou: A loss for efficient and accurate bounding box regression. arXiv 2023, arXiv:2307.07662. [Google Scholar]
- Ni, Z.; Chen, X.; Zhai, Y.; Tang, Y.; Wang, Y. Context-Guided Spatial Feature Reconstruction for Efficient Semantic Segmentation. arXiv 2024, arXiv:2405.06228. [Google Scholar]
- Wang, C.Y.; Bochkovskiy, A.; Liao, H.Y.M. YOLOv7: Trainable bag-of-freebies sets new state-of-the-art for real-time object detectors. In Proceedings of the IEEE/CVF Conference on Computer Vision and Pattern Recognition, Vancouver, BC, Canada, 17–24 June 2023. [Google Scholar]
- Liu, S.; Qi, L.; Qin, H.; Shi, J.; Jia, J. Path aggregation network for instance segmentation. In Proceedings of the IEEE Conference on Computer Vision and Pattern Recognition, Salt Lake City, UT, USA, 18–22 June 2018. [Google Scholar]
- Zhao, Y.; Lv, W.; Xu, S.; Wei, J.; Wang, G.; Dang, Q.; Liu, Y.; Chen, J. Detrs beat yolos on real-time object detection. In Proceedings of the IEEE/CVF Conference on Computer Vision and Pattern Recognition, Seattle, WA, USA, 16–22 June 2024. [Google Scholar]
- Wang, C.; He, W.; Nie, Y.; Guo, J.; Liu, C.; Wang, Y.; Han, K. Gold-YOLO: Efficient object detector via gather-and-distribute mechanism. Adv. Neural Inf. Process. Syst. 2024, 36. [Google Scholar]
- Qin, D.; Leichner, C.; Delakis, M.; Fornoni, M.; Luo, S.; Yang, F.; Wang, W.; Banbury, C.; Ye, C.; Akin, B.; et al. MobileNetV4-Universal Models for the Mobile Ecosystem. arXiv 2024, arXiv:2404.10518. [Google Scholar]
- Ma, X.; Dai, X.; Bai, Y.; Wang, Y.; Fu, Y. Rewrite the Stars. In Proceedings of the IEEE/CVF Conference on Computer Vision and Pattern Recognition, Seattle, WA, USA, 16–22 June 2024. [Google Scholar]
- Wang, A.; Chen, H.; Lin, Z.; Han, J.; Ding, G. Repvit: Revisiting mobile cnn from vit perspective. In Proceedings of the IEEE/CVF Conference on Computer Vision and Pattern Recognition, Seattle, WA, USA, 16–22 June 2024. [Google Scholar]
Disclaimer/Publisher’s Note: The statements, opinions and data contained in all publications are solely those of the individual author(s) and contributor(s) and not of MDPI and/or the editor(s). MDPI and/or the editor(s) disclaim responsibility for any injury to people or property resulting from any ideas, methods, instructions or products referred to in the content. |
© 2024 by the authors. Licensee MDPI, Basel, Switzerland. This article is an open access article distributed under the terms and conditions of the Creative Commons Attribution (CC BY) license (https://creativecommons.org/licenses/by/4.0/).