

Hybrid Time Series Model for Advanced Predictive Analysis in COVID-19 Vaccination


 , ,
, ,
Abstract
:1. Introduction
- Investigate different time series analysis techniques based on temporal patterns in COVID-19 vaccination data.
- Propose a Hybrid Harvest model based on ARIMA and Prophet models for Forecasting COVID-19 Vaccination trends.
- Evaluate and validate the performance of proposed model based on RMSE and MSE. Compare the results of Hybrid Harvest model with other commonly used time series models such as LSTM and Prophet.
- Identify the most accurate time series model for forecasting COVID-19 vaccination trends and provide insights for future planning.
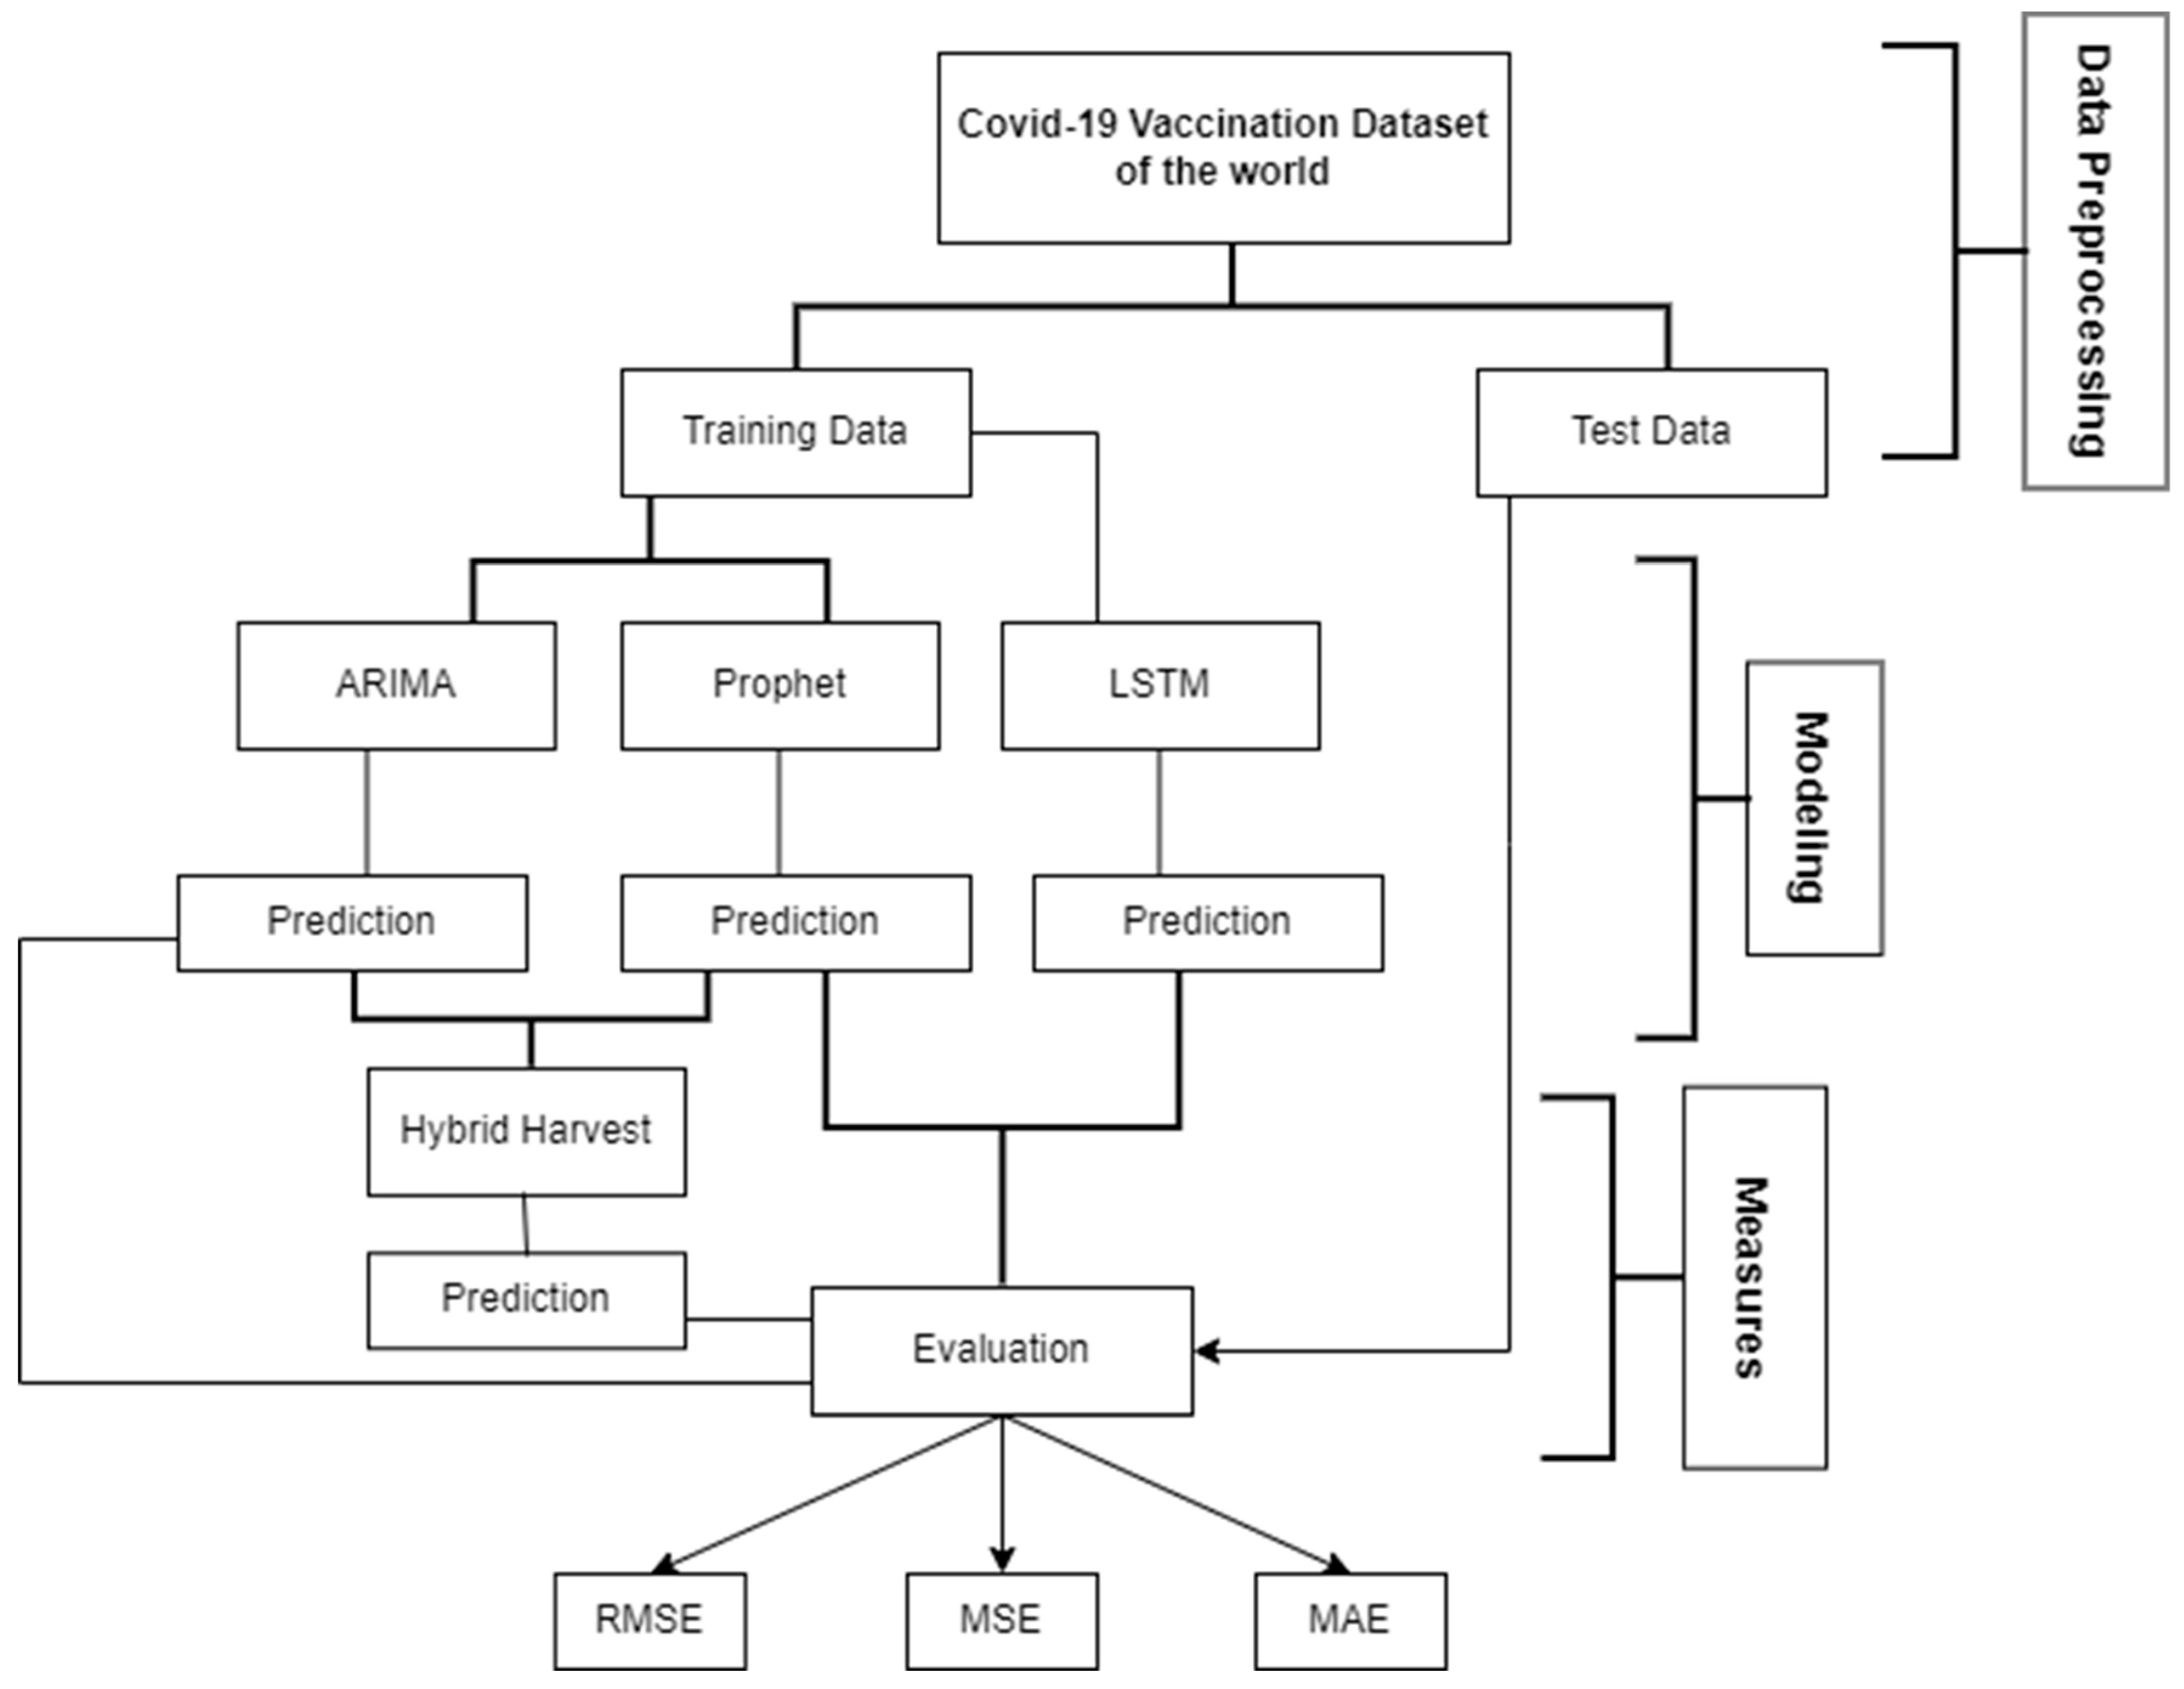
2. Materials and Methods
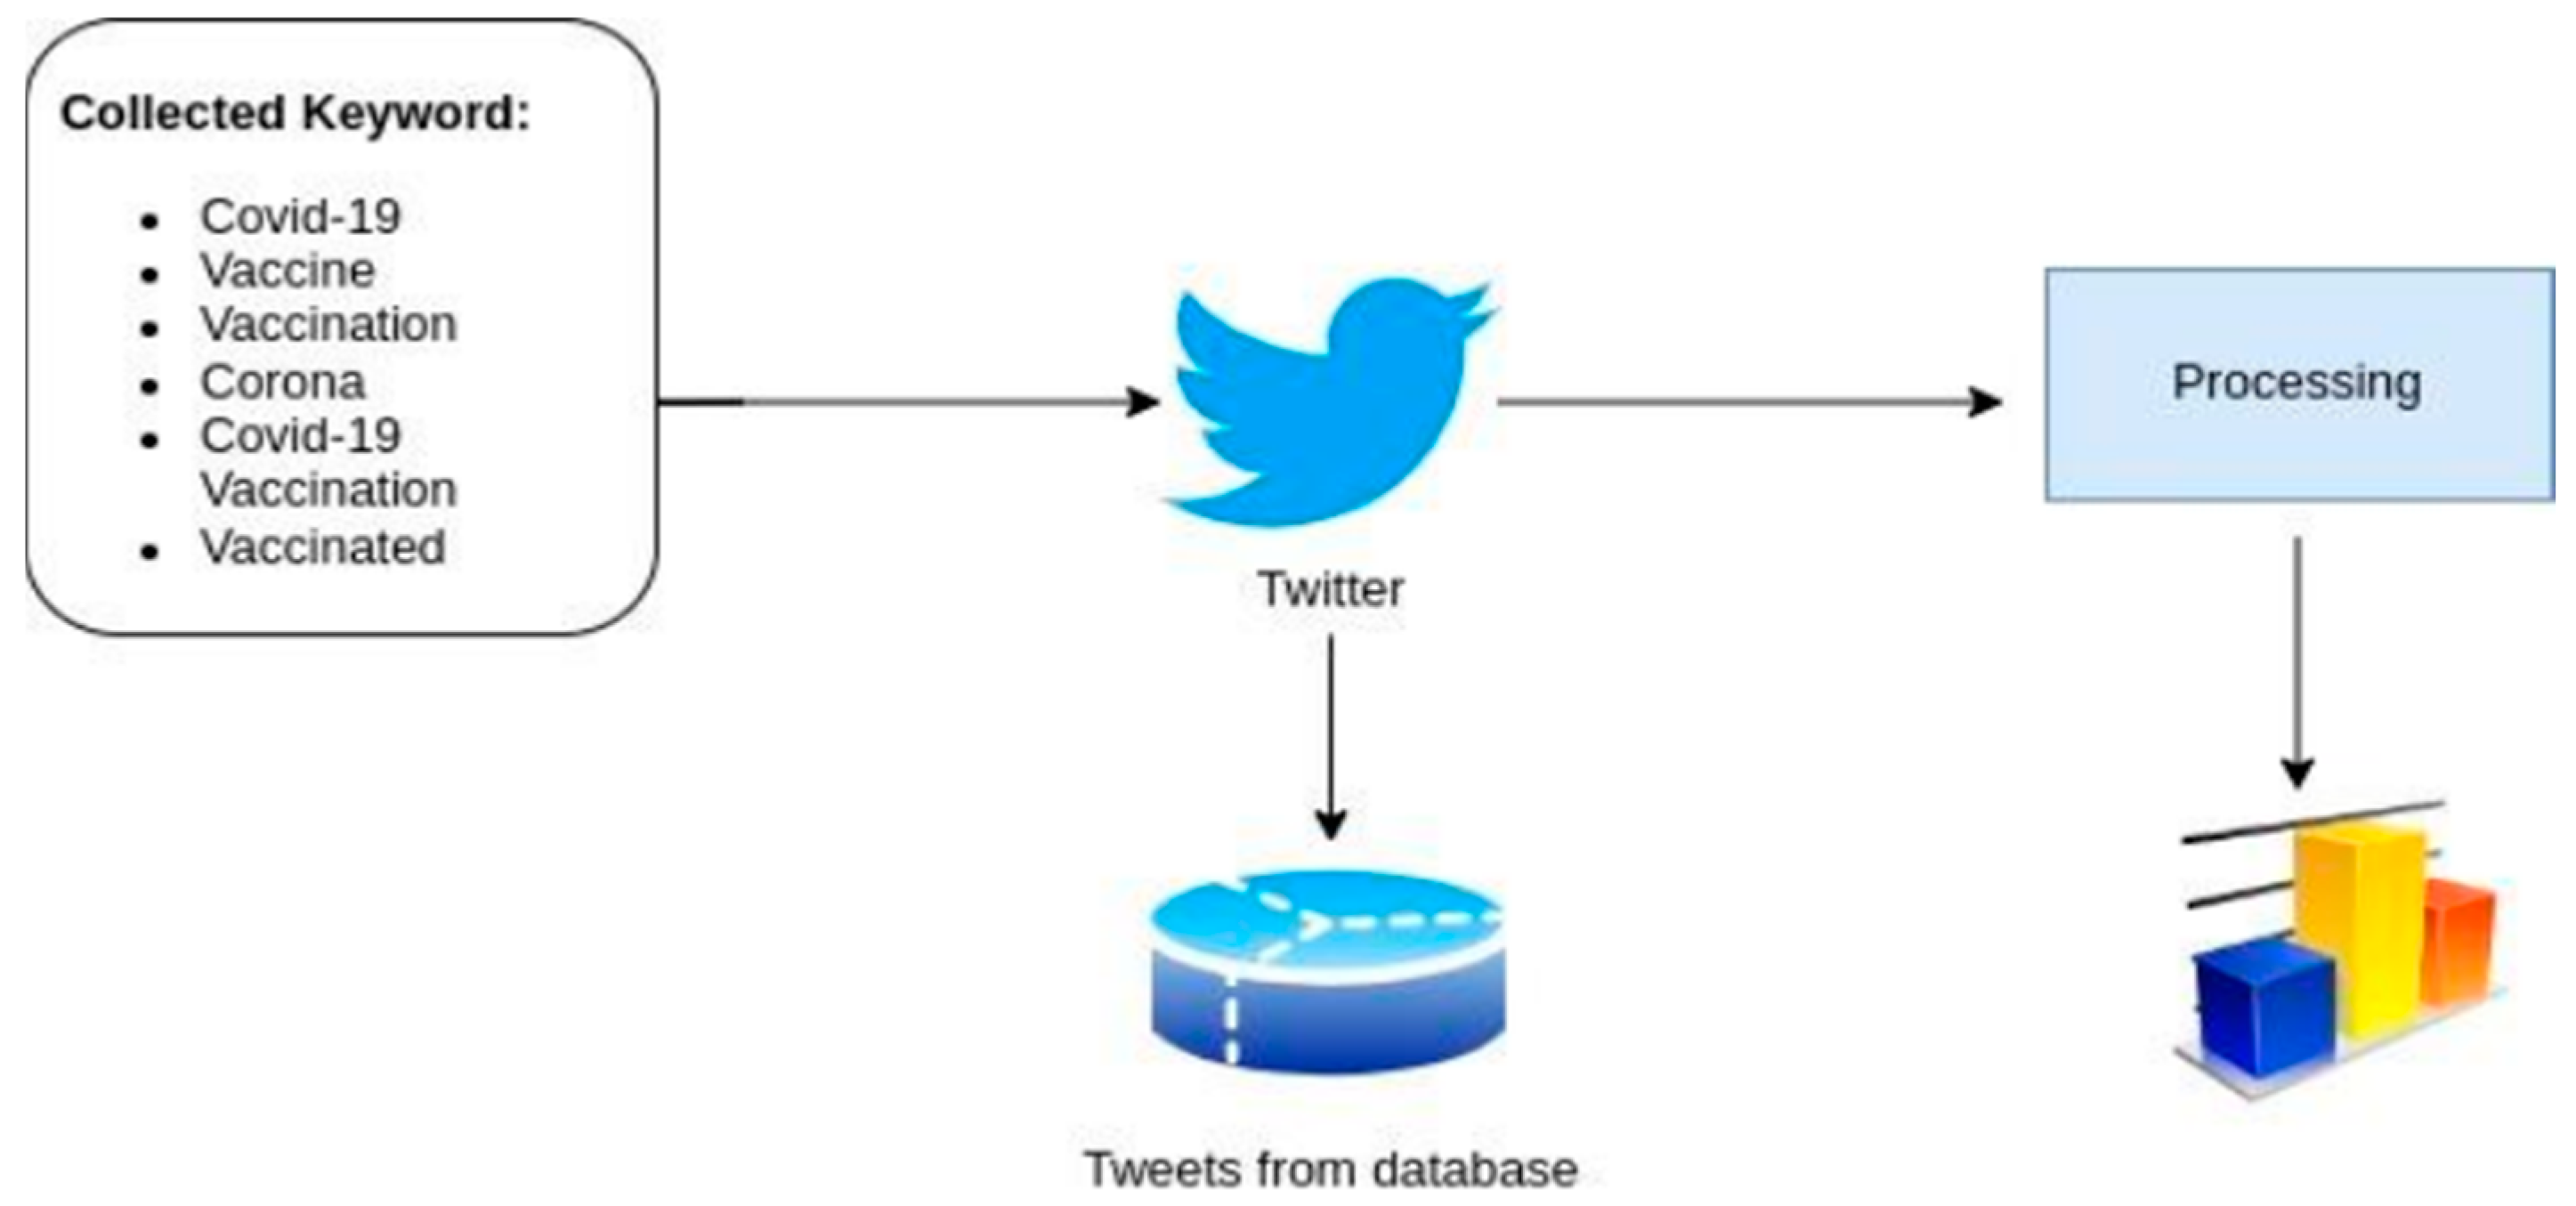
2.1. Data Collection
2.2. Data Preprocessing
2.3. Data Cleaning
2.3.1. Removal of Duplicates
2.3.2. Handling Missing Values
2.3.3. Outlier Detection
2.3.4. Normalization
2.4. Data Modeling and Splitting
3. Method
Proposed Hybrid-Harvest Model
- AutoRegression (AR): Uses the dependency between an observation and a number of lagged observations (p).
- Integrated (I): Differencing of observations to make the time series stationary (d).
- Moving Average (MA): Uses dependency between an observation and a residual error from a moving average model applied to lagged observations (q).
- (t)g(t) is the trend function.
- (t)s(t) is the seasonal component.
- h(t)h(t) represents the effects of holidays.
- ϵtϵt is the error term.
- ARIMA excels in capturing linear patterns and short-term dependencies.
- Prophet is effective in modeling seasonality and holiday effects.
| Algorithm 1. Hybrid Time Series Model for Predictive Analysis |
| 1. Initialize the time series dataset. 2. Preprocess the data: a. Handle missing values. b. Normalize the dataset. 3. Split the data into training and testing sets. 4. Apply the hybrid model: a. Train the ARIMA model on the training set. b. Extract residuals from the ARIMA model. c. Train the LSTM model on the residuals. 5. Combine the predictions from ARIMA and LSTM: a. Generate ARIMA predictions on the test set. b. Generate LSTM predictions on the residuals. c. Sum the ARIMA and LSTM predictions to obtain the final forecast. 6. Evaluate the model performance: a. Calculate performance metrics (e.g., RMSE, MAE). 7. Output the final predictive results and performance metrics. |
- Fit the ARIMA model to the time series data to capture linear patterns.
- Extract the residuals from the ARIMA model.
- Fit the Prophet model to the residuals to capture non-linear patterns and seasonality.
- Combine the predictions from both models to generate the final forecast.
- ARIMA Model Implementation:
- AR: AutoRegressive part which regresses the variable on its own lagged values.
- I: Integrated part which makes the time series stationary through differencing.
- MA: Moving Average part which models the error of the variable.
- Prophet Model Implementation:
- Trend component modeled with piecewise linear or logistic growth curve.
- Seasonal component modeled with Fourier series.
- Combination of Models:
- Residuals from the ARIMA model are used as input to the Prophet model.
- The final forecast is obtained by combining the predictions from both models.
4. Results
4.1. Quantitative Results
4.2. Ablation Studies
4.3. Qualitative Analysis
5. Conclusions
Author Contributions
Funding
Data Availability Statement
Conflicts of Interest
References
- Ye, J.; Hai, J.; Wang, Z.; Wei, C.; Song, J. Leveraging natural language processing and geospatial time series model to analyze COVID-19 vaccination sentiment dynamics on Tweets. JAMIA Open 2023, 6, ooad023. [Google Scholar] [CrossRef]
- Ranjbar, M.; Mousavi, S.M.; Madadizadeh, F.; Dargani, N.H.; Iraji, S.; Angell, B.; Assefa, Y. Effect of the COVID-19 pandemic on utilization of essential health services in Iran evidence from an interrupted time series analysis. BMC Public Health 2024, 24, 1006. [Google Scholar] [CrossRef]
- Shah, A.; Shah, S.; Rand, B.; Champon, X. The Celebrity Factor: Exploring the Impact of Influencers on COVID-19 Vaccine Sentiment through Bayesian Modeling of Time Series. J. South. Assoc. Inf. Syst. 2024, 11, 31–52. [Google Scholar] [CrossRef]
- Chen, Y.; Yuan, J.; You, Q.; Luo, J. Twitter sentiment analysis via bi-sense emoji embedding and attention-based LSTM. In Proceedings of the 26th ACM international conference on Multimedia, Seoul, Republic of Korea, 22–26 October 2018; pp. 117–125. [Google Scholar]
- Reddy, D.M.; Reddy, D.N.V. Twitter sentiment analysis using distributed word and sentence representation. arXiv 2019, arXiv:1904.12580. [Google Scholar]
- Xue, J.; Chen, J.; Chen, C.; Zheng, C.; Li, S.; Zhu, T. Public discourse and sentiment during the COVID-19 pandemic: Using Latent Dirichlet Allocation for topic modeling on Twitter. PLoS ONE 2020, 15, e0239441. [Google Scholar] [CrossRef] [PubMed]
- Sanders, A.C.; White, R.C.; Severson, L.S.; Ma, R.; McQueen, R.; Paulo, H.C.A.; Zhang, Y.; Erickson, J.S.; Bennett, K.P. Unmasking the conversation on masks: Natural language processing for topical sentiment analysis of COVID-19 Twitter discourse. AMIA Summits Transl. Sci. Proc. 2021, 2021, 555. [Google Scholar]
- Araujo, F.H.A.; Fernandes, L.H.S. Lighting the populational impact of COVID-19 vaccines in brazil. Fractals 2022, 30, 2250066. [Google Scholar] [CrossRef]
- El-Shabasy, R.M.; Nayel, M.A.; Taher, M.M.; Abdelmonem, R.; Shoueir, K.R.; Kenawy, E.R. Three wave changes, new variant strains, and vaccination effect against COVID-19 pandemic. Int. J. Biol. Macromol. 2022, 204, 161–168. [Google Scholar] [CrossRef]
- Said, A.B.; Erradi, A.; Aly, H.A.; Mohamed, A. Predicting COVID-19 cases using bidirectional LSTM on multivariate time series. Environ. Sci. Pollut. Res. 2021, 28, 56043–56052. [Google Scholar] [CrossRef]
- Anand, S.; Mishra, D. Empirical Study and Comparison of Models via Multiclass Classification of COVID-19 Tweets using Natural Language Processing. Int. J. Mod. Dev. Eng. Sci. 2022, 1, 9–17. [Google Scholar]
- Fang, Z.-G.; Yang, S.-Q.; Lv, C.-X.; An, S.-Y.; Wu, W. Application of a data-driven XGBoost model for the prediction of COVID-19 in the USA: A time-series study. BMJ Open 2022, 12, e056685. [Google Scholar] [CrossRef] [PubMed]
- Ndwandwe, D.; Wiysonge, C.S. COVID-19 vaccines. Curr. Opin. Immunol. 2021, 71, 111–116. [Google Scholar] [CrossRef] [PubMed]
- Glowacki, E.M.; Wilcox, G.B.; Glowacki, J.B. Identifying# addiction concerns on twitter during the COVID-19 pandemic: A text mining analysis. Subst. Abus. 2021, 42, 39–46. [Google Scholar] [PubMed]
- Thorakkattle, M.N.; Farhin, S.; Khan, A.A. Forecasting the trends of COVID-19 and causal impact of vaccines using bayesian structural time series and ARIMA. Ann. Data Sci. 2022, 9, 1025–1047. [Google Scholar] [CrossRef] [PubMed]
- Corey, L.; Mascola, J.R.; Fauci, A.S.; Collins, F.S. A strategic approach to COVID-19 vaccine R&D. Science 2020, 368, 948–950. [Google Scholar] [PubMed]
- Jabłońska, K.; Aballéa, S.; Toumi, M. The real-life impact of vaccination on COVID-19 mortality in Europe and Israel. Public Health 2021, 198, 230–237. [Google Scholar] [CrossRef] [PubMed]
- Walkey, A.J.; Law, A.; Bosch, N.A. Lottery-based incentive in Ohio and COVID-19 vaccination rates. JAMA 2021, 326, 766–767. [Google Scholar] [CrossRef] [PubMed]
- Salgotra, R.; Gandomi, M.; Gandomi, A.H. Time series analysis and forecast of the COVID-19 pandemic in India using genetic programming. Chaos Solitons Fractals 2020, 138, 109945. [Google Scholar] [CrossRef] [PubMed]
- Tandon, H.; Ranjan, P.; Chakraborty, T.; Suhag, V. Coronavirus (COVID-19): ARIMA based time-series analysis to forecast near future. J. Health Manag. 2020, 24, 373–388. [Google Scholar] [CrossRef]
- Mathieu, E.; Ritchie, H.; Ortiz-Ospina, E.; Roser, M.; Hasell, J.; Appel, C.; Giattino, C.; Rodés-Guirao, L. A global database of COVID-19 vaccinations. Nat. Hum. Behav. 2021, 5, 947–953. [Google Scholar] [CrossRef]
- Isah, A.; Shin, H.; Oh, S.; Oh, S.; Aliyu, I.; Um, T.-W.; Kim, J. Digital Twins Temporal Dependencies-Based on Time Series Using Multivariate Long Short-Term Memory. Electronics 2023, 12, 4187. [Google Scholar] [CrossRef]
- Zhong, B.; Huang, Y.; Liu, Q. Mental health toll from the coronavirus: Social media usage reveals Wuhan residents’ depression and secondary trauma in the COVID-19 outbreak. Comput. Hum. Behav. 2021, 114, 106524. [Google Scholar] [CrossRef]
- Aslim, E.G.; Fu, W.; Liu, C.-L.; Tekin, E. Vaccination Policy, Delayed Care, and Health Expenditures; National Bureau of Economic Research: Cambridge, MA, USA, 2022. [Google Scholar]
- Chen, X.; Huang, H.; Ju, J.; Sun, R.; Zhang, J. Impact of vaccination on the COVID-19 pandemic in US states. Sci. Rep. 2022, 12, 1554. [Google Scholar] [CrossRef] [PubMed]
- Drummond, J.; Hasnine, M.S. Did the COVID-19 vaccine rollout impact transportation demand? A case study in New York City. J. Transp. Health 2023, 28, 101539. [Google Scholar] [CrossRef] [PubMed]
- Available online: https://www.kaggle.com/datasets/gpreda/all-COVID-19-vaccines-tweets (accessed on 13 June 2022).
- Cryer, J.D. Time Series Analysis; Duxbury Press: Boston, MA, USA, 1986; Volume 286. [Google Scholar]
- Nelson, B.K. Time series analysis using autoregressive integrated moving average (ARIMA) models. Acad. Emerg. Med. 1998, 5, 739–744. [Google Scholar] [CrossRef]
- Siami-Namini, S.; Tavakoli, N.; Namin, A.S. A comparison of ARIMA and LSTM in forecasting time series. In Proceedings of the 2018 17th IEEE International Conference on Machine Learning and Applications (ICMLA), Orlando, FL, USA, 17–20 December 2018; pp. 1394–1401. [Google Scholar]
- Satrio, C.B.A.; Darmawan, W.; Nadia, B.U.; Hanafiah, N. Time series analysis and forecasting of coronavirus disease in Indonesia using ARIMA model and PROPHET. Procedia Comput. Sci. 2021, 179, 524–532. [Google Scholar] [CrossRef]


| Source | Models | Contribution |
|---|---|---|
| [23] | CERC and HBM | Social media usage in Wuhan during COVID-19 |
| [24] | Instrumental variable (IV) which is a type of regression model | Assumption and observation vaccination data |
| [25] | SIR (Susceptible) infected recovered model | Vaccination Predictions depend on the assumption and parameters |
| [26] | ARIMA model | Looks time periods (pre- and post-vaccine) |
| [21] | Interrupted time series analysis model | Time Series Analysis on vaccine uptake |
| Current Study | Hybrid Harvest Model | Analysis of different time series forecasting models for COVID-19 vaccination data trends. This study also fills a gap in the existing literature by providing new insights into the temporal patterns in COVID-19 vaccination data. |
| Features | Description |
|---|---|
| Date | The date when vaccinations were administered |
| Total_vaccinations | Total vaccinations administered at a given location and date. |
| People_vaccinated | This feature shows the total number of people vaccinated at a given location. |
| Daily_vaccinations | This feature represents the number of vaccinations administered on a daily basis |
| Location | This feature represents the location where the vaccinations |
| Epochs | Time | Loss |
|---|---|---|
| Epoch1 | 2 s | 0.8893 |
| Epoch2 | 25 ms | 0.8366 |
| Epoch3 | 27 ms | 0.7841 |
| Epoch4 | 27 ms | 0.7318 |
| Epoch5 | 29 ms | 0.6795 |
| Epoch6 | 26 ms | 0.6264 |
| Epoch7 | 30 ms | 0.5725 |
| Epoch8 | 28 ms | 0.5171 |
| Epoch9 | 36 ms | 0.4588 |
| Epoch10 | 35 ms | 0.3969 |
| Epoch11 | 25 ms | 0.3306 |
| Epoch12 | 25 ms | 0.2606 |
| Epoch13 | 32 ms | 0.1877 |
| Epoch14 | 24 ms | 0.1136 |
| Epoch15 | 26 ms | 0.0459 |
| Epoch16 | 26 ms | 0.0031 |
| Epoch17 | 28 ms | 0.0207 |
| Epoch18 | 25 ms | 0.0938 |
| Epoch19 | 25 ms | 0.1159 |
| Epoch20 | 25 ms | 0.0829 |
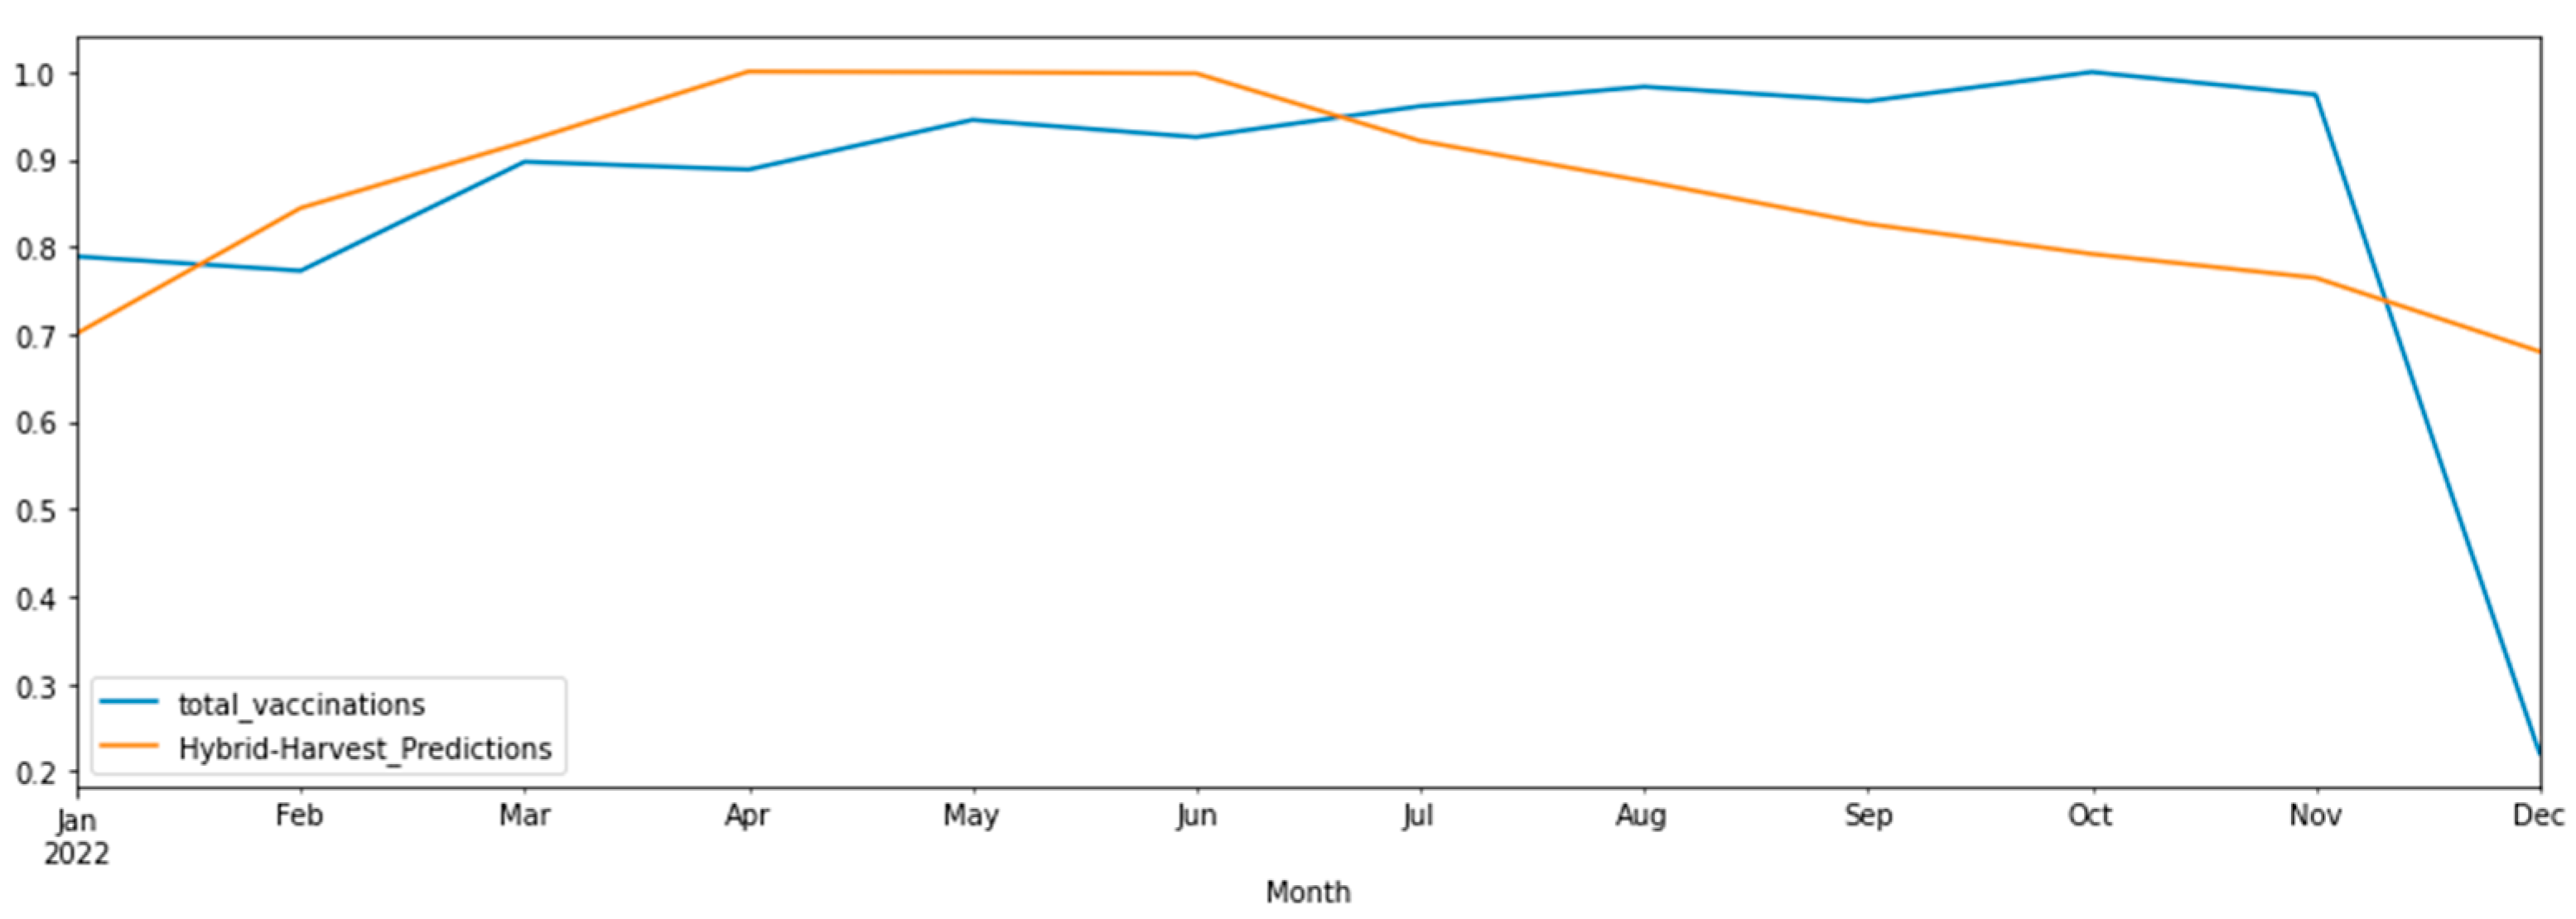
| Month | Total Vaccinations | ARIMA Predictions | LSTM Predictions | Prophet Predictions | Hybrid Harvest Predictions |
|---|---|---|---|---|---|
| 1 January 2022 | 0.788998 | 0.786037 | 1.151888 | 0.717512 | 0.700948 |
| 1 February 2022 | 0.772674 | 0.876809 | 1.451874 | 0.782367 | 0.844516 |
| 1 March 2022 | 0.897380 | 0.943666 | 1.914707 | 0.840946 | 0.920159 |
| 1 April 2022 | 0.888432 | 1.016778 | 2.673512 | 0.905802 | 1.000663 |
| 1 May 2022 | 0.945290 | 1.065485 | 4.027120 | 0.968565 | 0.999839 |
| 1 June 2022 | 0.925579 | 1.115655 | 6.738361 | 1.033420 | 0.998414 |
| 1 July 2022 | 0.960983 | 1.142993 | 12.814659 | 1.096183 | 0.921279 |
| 1 August 2022 | 0.983265 | 1.180686 | 26.756876 | 1.161039 | 0.875297 |
| 1 September 2022 | 0.966707 | 1.217538 | 57.782985 | 1.225894 | 0.826311 |
| 1 October 2022 | 1.000000 | 1.256825 | 128.419337 | 1.288657 | 0.791844 |
| 1 November 2022 | 0.974238 | 1.299761 | 293.872168 | 1.353513 | 0.764587 |
| 1 December 2022 | 0.220636 | 1.325104 | 692.579314 | 1.416276 | 0.680327 |
| Models | RMSE Errors | MSE Errors |
|---|---|---|
| ARIMA | 0.365928 | 0.133903 |
| LSTM | 220.882020 | 48,788.8668 |
| Prophet | 0.386722 | 0.149554 |
| Hybrid Harvest | 0.30488 | 0.132321 |
| Model | RMSE | MAE | MAPE |
|---|---|---|---|
| ARIMA | 2.34 | 1.89 | 3.12% |
| Prophet | 2.10 | 1.65 | 2.98% |
| ETS | 2.45 | 1.95 | 3.25% |
| Hybrid (ARIMA + Prophet) | 1.85 | 1.42 | 2.75% |
Disclaimer/Publisher’s Note: The statements, opinions and data contained in all publications are solely those of the individual author(s) and contributor(s) and not of MDPI and/or the editor(s). MDPI and/or the editor(s) disclaim responsibility for any injury to people or property resulting from any ideas, methods, instructions or products referred to in the content. |
© 2024 by the authors. Licensee MDPI, Basel, Switzerland. This article is an open access article distributed under the terms and conditions of the Creative Commons Attribution (CC BY) license (https://creativecommons.org/licenses/by/4.0/).
Share and Cite
Khalil, A.; Awan, M.J.; Yasin, A.; Kousar, T.; Rahman, A.; Youssef, M.S. Hybrid Time Series Model for Advanced Predictive Analysis in COVID-19 Vaccination. Electronics 2024, 13, 2468. https://doi.org/10.3390/electronics13132468
Khalil A, Awan MJ, Yasin A, Kousar T, Rahman A, Youssef MS. Hybrid Time Series Model for Advanced Predictive Analysis in COVID-19 Vaccination. Electronics. 2024; 13(13):2468. https://doi.org/10.3390/electronics13132468
Chicago/Turabian StyleKhalil, Amna, Mazhar Javed Awan, Awais Yasin, Tanzeela Kousar, Abdur Rahman, and Mohamed Sebaie Youssef. 2024. "Hybrid Time Series Model for Advanced Predictive Analysis in COVID-19 Vaccination" Electronics 13, no. 13: 2468. https://doi.org/10.3390/electronics13132468
APA StyleKhalil, A., Awan, M. J., Yasin, A., Kousar, T., Rahman, A., & Youssef, M. S. (2024). Hybrid Time Series Model for Advanced Predictive Analysis in COVID-19 Vaccination. Electronics, 13(13), 2468. https://doi.org/10.3390/electronics13132468