Abstract
When utilizing high-dimensional chaotic signals for frequency modulation, achieving a uniformly distributed power spectrum is a challenging task. This paper addresses this challenge by proposing a power spectrum homogenization strategy based on distribution transformation. The strategy transforms the task of achieving a uniformly distributed power spectrum in frequency modulation of high-dimensional chaotic signals to solve and equalize the probability density function of the chaotic signals, thereby further enhancing the ability of high-dimensional chaotic signals to suppress electromagnetic interference. Firstly, the difficulty of obtaining a smooth probability density function of chaotic modulation signals is solved using the kernel density estimation algorithm. Then, a distribution transformation algorithm is proposed to convert non-uniformly distributed chaotic modulation signals into uniformly distributed chaotic modulation signals. By using uniformly distributed chaotic modulation signals for frequency modulation, the objective of power spectrum equalization is achieved. Finally, taking the Chua’s chaotic signal as an example, the effectiveness of the proposed strategy is verified using an experimental platform based on a digital signal processor-controlled active clamping flyback converter.
1. Introduction
With the widespread application of wide bandgap devices like SiC and GaN [1,2,3,4], the switching frequency of offline power converters is on the rise, resulting in more severe electromagnetic interference (EMI) issues [5,6]. Offline power converters serve as significant sources of supraharmonics, introducing EMI into the grid through conduction and presenting challenges in addressing supraharmonics in the grid [7,8]. Therefore, investigating strategies to suppress EMI [9,10] in offline power converters holds practical significance, whether in improving the electromagnetic compatibility performance of these converters or enhancing the power quality of power systems [11].
In the industrial sector, the most common EMI suppression strategy involves using EMI filters, including passive [12], active [13], and hybrid types [14,15,16,17]. However, as switching frequencies increase, the sizes of EMI filters also increase significantly, which is highly detrimental to improving converter power density. Additionally, hardware-based strategies such as soft-switching techniques [18] and optimized circuit layouts [19] are used for EMI suppression. However, soft-switching techniques require additional components, hindering cost reduction and the increase in power density. Optimization of circuit layouts has limited effectiveness in EMI suppression.
Control strategy-based solutions can effectively suppress EMI at the source without adding extra components, thereby significantly reducing the size of EMI filters and im-proving converter power density [20]. The most commonly used control strategy for offline power converters is conventional pulse width modulation (PWM) control. Conventional PWM control is characterized by periodicity, resulting in a line spectrum power, with high peaks being a major cause of severe EMI. Spread-spectrum modulation strategies, including periodic [21], random [22], and chaotic [23] approaches, are effective in reducing the peak of the power spectrum, thus mitigating EMI. Among these, random and chaotic spread-spectrum modulation techniques exhibit superior EMI suppression compared to periodic modulation. Chaotic signals, due to their simplicity of implementation, are often preferred over random signals as ideal alternatives in many applications. Chaotic spread-spectrum modulation PWM (CSSM-PWM) disrupts the periodicity of conventional PWM, resulting in a continuous spectrum power with significantly reduced peak values, effectively suppressing EMI. Therefore, chaotic spread-spectrum modulation technology has received widespread attention [24,25,26,27,28].
Theoretical research findings from reference [29] suggest that the power spectrum of chaotic spread-spectrum modulation technology aligns with the probability density function of the chaotic modulation signal. Non-uniformly distributed chaotic modulation signals lead to non-uniform power spectra, while uniformly distributed chaotic modulation signals result in uniformly distributed power spectra. Subsequent research has demonstrated that uniformly distributed power spectra can effectively reduce peak values, offering optimal EMI suppression [30]. Hence, the challenge of power spectrum equalization in chaotic spread-spectrum modulation can be reframed as the task of obtaining uniformly distributed chaotic signals. The quest for achieving chaotic modulation signals with uniform distribution now stands as a pressing issue to be addressed for the advancement of chaotic spread-spectrum modulation technology.
The methods reported in the literature for obtaining uniformly distributed chaotic signals [31,32,33,34,35,36,37,38,39] mainly focus on one-dimensional chaotic signals and are not suitable for high-dimensional chaotic signals with higher complexity.
Currently, achieving power spectral homogenization in high-dimensional chaotic signal spread-spectrum modulation encounters two primary challenges. One is the difficulty of attaining a smooth probability density function, while the other is the absence of uniformization methods for probability density functions of high-dimensional chaotic signals. The histogram method stands as the most prevalent approach for addressing the probability density function in high-dimensional chaotic signals. Nevertheless, the probability density function derived from the histogram method exhibits a step-like shape, lacking smoothness, thereby impeding uniformization efforts.
To address these challenges, this paper proposes a power spectral homogenization strategy based on distribution transformation. This strategy converts the task of achieving power spectral homogenization in high-dimensional chaotic signal spread-spectrum modulation into solving the smooth probability density function and uniformization transformation of chaotic modulation signals.
Firstly, the proposal of using kernel density estimation addresses the challenge of obtaining smooth probability density functions for chaotic signals. This algorithm not only simplifies the solving process, but also generates smooth probability density functions. Subsequently, a distribution transformation algorithm is introduced to directly homogenize the probability density functions. This algorithm can convert non-uniformly distributed chaotic signals into uniformly distributed ones. By utilizing the uniformly distributed chaotic signals for spread-spectrum modulation, uniform power spectra are achieved, minimizing peak values to the greatest extent. Finally, a prototype of an active clamp flyback converter based on a digital signal processor (DSP) is developed. Using the widely used and high-performing Chua’s chaotic signal [23] as an example, the effectiveness of the proposed strategy for power spectral homogenization is validated on this experimental prototype. Experimental results demonstrate that the strategy can attain uniform power spectra. For peak suppression of common-mode conducted EMI, Chua’s chaotic signal achieves 13.18 dB, while the proposed strategy achieves 16.26 dB. Compared to Chua’s chaotic signal, the proposed strategy shows an improvement of over 3 dB in suppressing common-mode conducted EMI.
2. Implementation of CSSM-PWM Converter and Its Power Spectrum Distribution Characteristics
This common-mode conducted EMI is a major component in the conducted EMI of high-frequency converters [40]; the flyback converter is the most widely used topology in medium and small power applications, and active clamping technology can improve the efficiency of flyback converters.
Therefore, researching optimization strategies for suppressing common-mode conducted EMI in active clamping inverters is of practical significance. This paper takes the DSP-based CSSM-PWM active clamping flyback converter as an example for research, as shown in Figure 1.
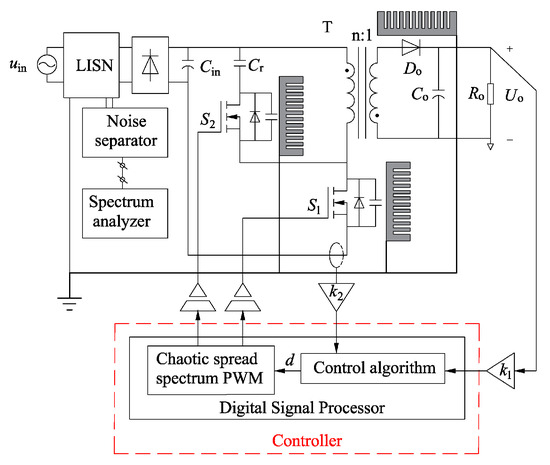
Figure 1.
Schematic diagram.
In the diagram, is the normal grid power, is the input filter capacitor, is the active clamping resonant capacitor, is the output rectifier diode, is the output filter capacitor, is the load, is the output voltage, is the main switching transistor, is the auxiliary switching transistor, is the voltage regulation coefficient, is the current regulation coefficient, is the transformer, and is the duty cycle calculated by a closed-loop control.
In Figure 1, there are two MOSFETs, and ; hence, there are two common-mode conducted EMI noise sources. When operating in conventional PWM control mode, the noise source is a periodic pulse source with the same frequency as PWM, with a discrete spectrum and energy mainly concentrated at the switching frequency and its harmonics, resulting in high spectral peaks and severe EMI. When operating in CSSM-PWM control mode, the noise source is a non-periodic pulse source with a continuous spectrum, the energy of concentrated spectral lines is dispersed, and the spectral peaks are significantly reduced. A uniformly distributed power spectrum can minimize the peak value, thus achieving an optimal EMI suppression effect.
The theoretical research results from the literature [29] indicate that chaotic spread-spectrum modulation of unit sine waves results in a power spectrum shape consistent with the probability density function of the chaotic modulation signal, as expressed below:
where represents the power spectrum of the modulated wave, is the maximum frequency deviation, is the carrier frequency, is the chaotic modulation signal, and is the probability density function of the chaotic modulation signal.
Equation (1) shows that the peak of the power spectrum is inversely proportional to the maximum frequency deviation. An increased frequency deviation leads to a decreased peak in the power spectrum. The power spectrum’s shape corresponds to the probability density function of the modulation signal. If the modulation signal’s probability density function is non-uniform, the power spectrum will also be non-uniform, and vice versa for uniform distribution. The power spectrum characteristics of CSSM-PWM and common-mode conducted EMI under CSSM-PWM control mode are similar to the power spectrum of sinusoidal chaos spread-spectrum modulation [41].
The power spectra of conventional PWM, non-uniform CSSM-PWM, and uniform CSSM-PWM are shown in Figure 2.
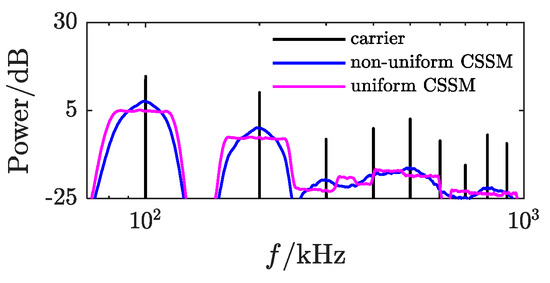
Figure 2.
Power spectrum of conventional PWM and chaotic spread-spectrum modulation PWM (CSSM-PWM). (CSSM: chaotic spread-spectrum modulation).
Figure 2 illustrates that the power spectrum of conventional PWM exhibits a linear distribution, whereas the power spectrum of CSSM-PWM displays a continuous distribution. In contrast, the power spectrum of non-uniform CSSM-PWM exhibits a non-uniform distribution across both the fundamental frequency band and harmonic bands, whereas the power spectrum of uniform CSSM-PWM demonstrates a uniform distribution across these bands. Notably, the peak of the power spectrum for uniform CSSM-PWM is the smallest, indicating its superior ability to suppress spectral peaks. Therefore, uniform chaotic spread-spectrum modulation presents the most effective suppression of spectral peaks.
However, the probability density functions of common chaotic signals are often non-uniformly distributed, making it challenging to achieve a uniformly distributed power spectrum when used for spread-spectrum modulation. This paper aims to explore methods for transforming non-uniformly distributed chaotic modulation signals into a uniform distribution, in order to achieve a uniform shaping of the power spectrum in chaotic spread-spectrum modulation and reduce peak values.
3. Solution and Uniformization Modification of Chaotic Signal Probability Density Function
To achieve uniform transformation of chaotic signal probability density functions, accurately resolving the probability density function is essential. The predominant method for resolving the probability density function of high-dimensional chaotic signals is currently the histogram approach. However, this method faces difficulties in terms of attaining a smooth probability density function. To enhance the efficiency and ensure smooth results, this paper introduces the non-parametric estimation technique of kernel density estimation [42]. Furthermore, a distribution transformation algorithm is put forth in this paper to facilitate the uniform transformation of the probability density function.
3.1. Kernel Density Estimation Algorithm for Solving Probability Density Function of Chaotic Modulated Signals
Let be a sample of size that is independently and identically distributed from a population with distribution function and probability density function . The sample values are , , …, , …, , where . Then, the estimate of its probability density function is:
where is the kernel function and is the window width. After thoroughly considering the trade-off between smoothing effects and approximation errors, we chose a balanced window width value of 0.0799 for this paper.
The distribution function is:
The kernel function must satisfy the normalization condition:
The smoothing degree of kernel density estimation is not sensitive to the choice of kernel function. Commonly used kernel functions include uniform kernel function, Gaussian kernel function, Epanechnikov kernel function, etc. In this paper, the numerical example uses Gaussian kernel function.
The probability density function obtained using the kernel density estimation method and histogram method are shown in Figure 3.
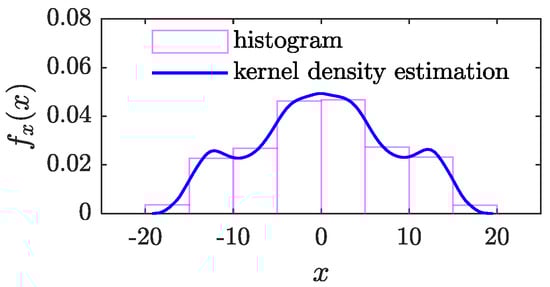
Figure 3.
The probability density functions obtained by histogram and kernel density estimation method.
Figure 3 shows that the probability density function obtained by the histogram method is stair-shaped, while the kernel density estimation method can obtain a smooth probability density function.
3.2. Distribution Transformation Algorithm for Achieving Uniformization Modification of Probability Density Function
Taking into account the boundedness and quasi-randomness of chaotic signals, this paper proposes a distribution transformation method based on the concept of the inverse problem to achieve the uniformization of chaotic signal probability density functions. The method ensures theoretically that the transformed chaotic signals conform to a uniform distribution. The detailed proof process is presented in Appendix A.
The expression for the proposed distribution transformation method, , is represented as follows:
where the domain of the chaotic signal is , with distribution function , and the domain of the target uniformly distributed chaotic signal is .
Equation (5) indicates that, by simply scaling and shifting the distribution function of the non-uniformly distributed chaotic signal , one can obtain the analytical expression of the transformation relationship .
The research [39] demonstrates that among various chaotic signals, Chua’s chaotic signal exhibits better suppression effects on common-mode conducted EMI in high-frequency converters. Therefore, this paper conducts experiments using the second component of the state variables of Chua’s chaotic system (see Appendix B) as the intrinsic chaotic signal to validate the effectiveness of the proposed strategy in power spectrum equalization and the optimization effects on common-mode conducted EMI suppression.
Let be the uniformly distributed chaotic signal on the interval obtained by transforming . According to Equation (5), the transformation process from to is illustrated in Figure 4.
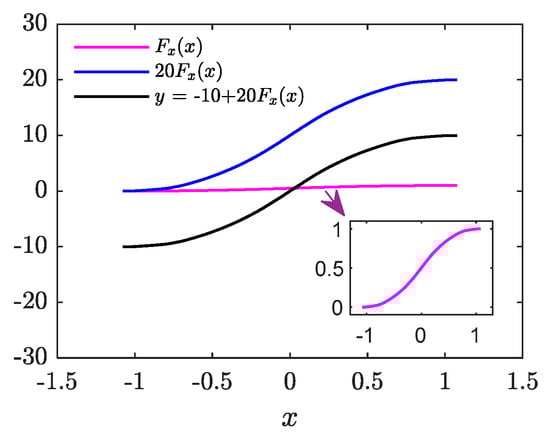
Figure 4.
Distribution transformation diagram.
The transformation process depicted in Figure 4 can be described as follows: first, the distribution function of , denoted as (solid magenta line), is stretched vertically by a factor of 20, resulting in the blue solid line, . Then, it is shifted downwards by 10 units, yielding the transformation relationship from to , expressed as (solid black line).
By utilizing the transformation relationship illustrated by the solid black line in Figure 4, the target uniformly distributed chaotic signal is obtained from the chaotic signal . The probability density functions and waveforms of and are shown in Figure 5. The sampling rate is 2 MHz, and the sample capacity is .
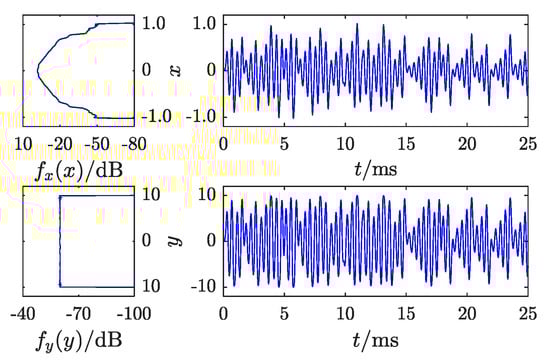
Figure 5.
Waveforms and probability density functions.
Figure 5 shows that distribution transformation can, on one hand, expand the densely distributed regions. In the areas where exhibits smaller oscillation amplitudes near the horizontal axis, the probability density function values are larger, and the sample points are more closely packed. The distribution transformation elongates the waveforms of these regions along the vertical axis, thereby dispersing the distribution of sample points. On the other hand, distribution transformation can converge the sparsely distributed regions. In areas where has larger amplitudes, the probability density function values are smaller, and the sample points are more sparsely distributed. The distribution transformation compresses the waveforms of these regions along the vertical axis, leading to a denser distribution of sample points. The probability density functions in Figure 5 demonstrate that the chaotic signal with a non-uniform distribution, after undergoing distribution transformation, results in the chaotic signal exhibiting a uniform distribution.
Figure 6 displays the attractors of Chua’s chaotic signal obtained through simulation, as well as the attractors of the chaotic signal after distribution transformation; Figure 7 shows the attractors obtained from actual measurements after distribution transformation. Here, and are the second and third components of the Chua’s chaotic system in Appendix B, respectively, which correspond to and after the distribution transformation.
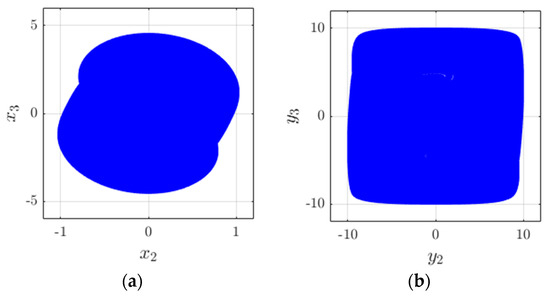
Figure 6.
Chaotic attractors of Chua’s chaotic signal and after undergoing distribution transformation: (a) Chua’s chaotic signal; (b) after the distribution transformation.
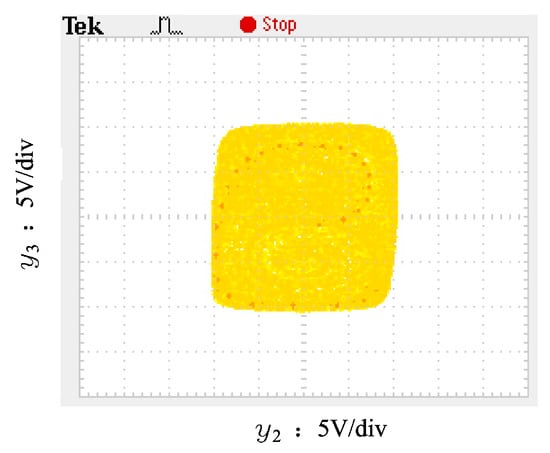
Figure 7.
Experimental chaotic attractor.
By comparing Figure 6b with Figure 7, it can be seen that the measured chaotic attractor and simulation results are quite consistent. Therefore, the proposed distribution transformation does not alter the essence of the chaotic signal, and the resulting signal remains a chaotic signal.
In summary, the specific steps of the distribution transformation algorithm for chaotic modulation signals are described as follows:
Step 1: Extract an independent and identically distributed sample of size from a component of the chaotic system;
Step 2: Calculate the probability density function using Equation (2);
Step 3: Calculate the distribution function using Equation (3);
Step 4: Set parameters c and d according to the actual situation, and use Equation (5) to obtain the distribution transformation , thereby obtaining the desired uniformly distributed chaotic modulation signal .
The strategy for uniformizing the power spectrum of chaotic spread-spectrum modulation is as follows: Use the distribution transformation algorithm to transform the non-uniformly distributed chaotic modulation signal into a uniformly distributed chaotic modulation signal ; then, use for spread-spectrum modulation to achieve the purpose of uniformizing the power spectrum and reducing the spectral peak.
4. Global and Local Spectrum Characteristics of Power Spectrum Homogenization Strategy for Chaotic Spread-Spectrum Modulation
In this section, chaotic signals and are used to perform chaotic spread-spectrum modulation on a 100 kHz unit sine wave. The global and local spectral distribution characteristics of the proposed strategy are analyzed separately to demonstrate the effectiveness of the proposed strategy in uniformizing the power spectrum. The maximum frequency deviation is 20 kHz, and the spread-spectrum band is .
4.1. Global Spectrum Characteristics
Figure 8 illustrates the spectrum of a unit sine wave and the spectral characteristics after the wave has been modulated by chaotic spread spectrum.
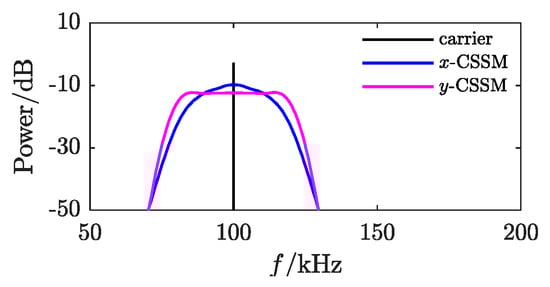
Figure 8.
Power spectrum of sine wave modulated by CSSM.
Figure 8 shows that the power spectrum of the unit sine wave is a line spectrum at 100 kHz, and chaotic spread-spectrum modulation broadens the line spectrum into a continuous spectrum on the spread-spectrum band.
The power spectrum of the spread-spectrum modulation of has a peak at 100 kHz, which has a similar shape to the probability density function of (see Figure 5). The power spectrum of the spread-spectrum modulation of is uniformly distributed.
Therefore, the proposed strategy achieves uniform distribution of the power spectrum, thereby realizing the purpose of uniform shaping of the power spectrum and reducing the peak values.
4.2. Time–Frequency Analysis for Local Spectrum Characteristic Research
Theoretical power spectrum is obtained based on Fourier transformation, and Fourier transformation is defined over the entire time domain, so the theoretical power spectrum reflects the global frequency characteristics of the time-domain signal. Actual power spectrum measurements are always performed within a short, finite time window, so the measured power spectrum reflects the local frequency characteristics of the time-domain signal. Fourier transformation does not have time–frequency localization functionality, so it cannot analyze the local frequency characteristics of the time-domain signal within a short time window. Knowing only the frequency characteristics of the theoretical power spectrum cannot accurately predict the frequency characteristics of the measured power spectrum.
In order to obtain a uniformly distributed measured power spectrum, the local frequency characteristics of the modulated signal should be uniformly distributed, and this uniform distribution of frequency characteristics should not change over time. Therefore, it is essential to use time–frequency analysis techniques to study the local frequency characteristics of the modulated signal.
To study the local frequency characteristics of the proposed strategy, spreading modulation is applied to unit sinusoidal waves using and , and their time–frequency distributions are shown in Figure 9 and Figure 10, respectively. The color scale displays the amplitude of the power spectrum within the short time window of the modulated wave (unit in dB).
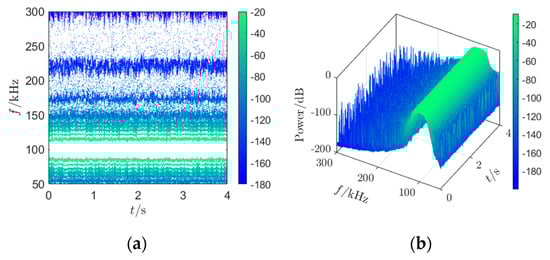
Figure 9.
Time–frequency distribution of modulated wave by x: (a) contour map by x; (b) waterfall by x.
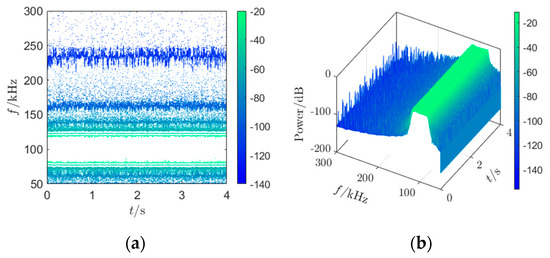
Figure 10.
Time–frequency distribution of modulated wave by y: (a) contour map by y; (b) waterfall by y.
In Figure 10a, the widths of the bright stripes near 100 kHz are wider than in Figure 9a, indicating that the proposed strategy broadens the energy distribution of the power spectrum in a wider frequency band, making the energy distribution more dispersed. Figure 10a shows that with the passage of time, the color and width of the bright stripes do not change significantly, indicating that the consistency of the local frequency spectrum distribution characteristics of the proposed strategy is well maintained.
In Figure 9b, the top of the waterfall is arched, with a peak at 100 kHz, indicating that the energy of the local frequency spectrum of the modulated wave corresponding to the original chaotic modulation signal is relatively concentrated at 100 kHz, with a larger peak. In Figure 10b, the top of the waterfall is relatively flat, showing a uniform distribution, indicating that the local frequency spectrum of the proposed strategy is uniformly distributed; with the passage of time, there is no significant change in the shape of the waterfall, indicating that the uniform distribution characteristic of the local frequency spectrum of the proposed strategy does not change over time.
Both the contour map and the waterfall of the time–frequency analysis indicate that the local frequency spectrum of the proposed strategy is uniformly distributed, and this uniform distribution characteristic does not change over time. Therefore, it can be predicted that the proposed strategy can achieve a measured power spectrum that is uniformly distributed.
5. Results and Discussion
In this section, the measured power spectrum is used to further validate the effectiveness of the proposed strategy in power spectral uniformization, and the optimization effect of common mode conducted EMI suppression is measured. A prototype of an active clamp flyback converter based on DSP28335 was built according to the circuit schematic shown in Figure 1, as shown in Figure 11. The main parameters of the prototype are shown in Table 1, and the measuring equipment used is shown in Table A1 in Appendix C.
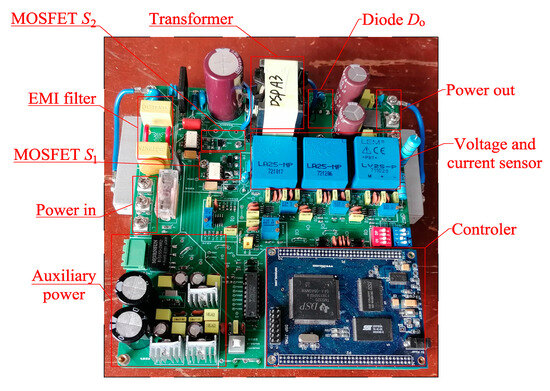
Figure 11.
Experimental platform.

Table 1.
Main parameters of the experimental platform.
5.1. Actual Measurement of Power Spectrum for CSSM-PWM
Using and , conventional PWM waves with a switching frequency of 100 kHz were frequency-modulated, and their power spectra were measured using a spectrum analyzer. The measured power spectra are shown in Figure 12. The maximum frequency deviation of the frequency modulation is 20 kHz, the spread-spectrum band is between 80 kHz and 120 kHz, and the resolution bandwidth RBW for spectrum measurement is set to 10 Hz.
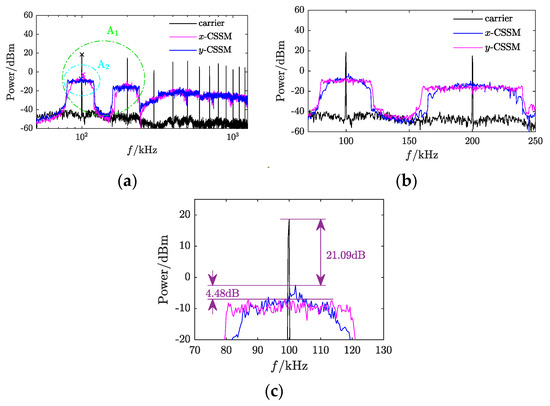
Figure 12.
Power spectrum of CSSM-PWM: (a) power spectrum; (b) zoom-in region A1; (c) zoom-in region A2.
The maximum spectral peak measurement data are as follows: the power spectrum of conventional PWM is 18.63 dBm, while the power spectra of chaotic spread-spectrum modulated PWM are −2.46 dBm for and −6.94 dBm for , as indicated by the ‘×’ mark in Figure 12a.
Figure 12a shows that the power spectrum of conventional PWM is a linear spectrum, distributed at the switching frequency and its integer multiples; the power spectrum of chaotic spread-spectrum modulated PWM for and is continuous, extending the linear power spectrum of conventional PWM in the spreading band and its integer multiples, resulting in a significant reduction in the peak value of the power spectrum. In the fundamental band and the spreading band , the power spectrum has the same shape as the probability density function of the chaotic modulated signal (see Figure 5). Due to the overlapping regions between the spreading band [240 kHz, 360 kHz] and the spreading band , higher multiples of spreading bands also have similar overlaps, causing the power spectrum to merge into a continuous range in the spreading band and higher multiples.
Figure 12b shows that, in the fundamental band and spreading band, the power spectrum of chaotic spread-spectrum modulated PWM is more evenly distributed, with lower peak values compared to the power spectrum of chaotic spread-spectrum modulated PWM.
Figure 12c illustrates that the maximum peak of the power spectrum for spread-spectrum modulated PWM decreases by 21.09 dB, while for spread-spectrum modulated PWM, it decreases by 25.57 dB. In comparison to the original chaotic signal , this strategy reduces the maximum peak of the power spectrum by 4.48 dB.
In summary, the proposed strategy achieves a uniformly distributed measured power spectrum.
5.2. Actual Measurement of Power Spectrum for Common-Mode Conducted EMI
The measured power spectra of common-mode conducted EMI in conventional PWM control mode, chaotic spread-spectrum modulated PWM control mode, and chaotic spread-spectrum modulated PWM control mode are shown in Figure 13, with the maximum peak values shown in Table 2.
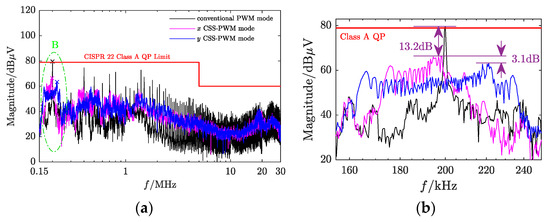
Figure 13.
Power spectra of common mode conducted EMI under CSSM-PWM control mode: (a) power spectrum; (b) zoom-in region B.
Table 2.
Maximum peak values of common-mode conducted EMI.
Figure 13a shows the following. The common mode conducted EMI under normal PWM control mode has a linear spectrum; the common-mode conducted EMI under and CSSM-PWM control mode has a continuous distribution, with significantly reduced peak values (more significant reduction in the low frequency band); and the peak value is lowest under y CSSM-PWM control mode, providing the best suppression effect on common-mode conducted EMI.
Figure 13b shows the following. The power spectrum distribution under CSSM-PWM control mode is more uniform, indicating the effectiveness of the proposed strategy in terms of uniformizing the power spectrum of common-mode conducted EMI; the maximum reduction in common-mode conducted EMI under CSSM-PWM control mode is 13.18 dB, and under CSSM-PWM control mode, it is 16.26 dB (as shown in Table 2). Compared to the original Chua’s () CSSM-PWM control mode, the proposed strategy improves the suppression effect on the maximum value of common-mode conducted EMI by 3.08 dB.
The proposed strategy is theoretically not only outstanding in suppressing common-mode conducted EMI, but it is also effective in suppressing differential-mode conducted EMI [43].
6. Conclusions
This paper conducts research on the uniform shaping of the power spectrum of high-dimensional chaotic signal spread-spectrum modulation and validates the effectiveness of the proposed strategy using an experimental prototype of an active clamp flyback converter based on DSP. The conclusions are as follows:
- (1)
- The use of the kernel density estimation algorithm solves the problem of obtaining a smooth probability density function for high-dimensional chaotic signals.
- (2)
- A distribution transformation method is proposed, theoretically guaranteeing that the transformed chaotic signal satisfies a uniform distribution.
- (3)
- The proposed power spectrum uniformization strategy can achieve the uniform shaping of the power spectrum, obtain a uniformly distributed power spectrum, and further improve the suppression effect of Chua’s chaotic spread-spectrum modulation technology on common-mode conducted EMI.
- (4)
- The proposed chaotic spread-spectrum modulation power spectrum uniformization strategy provides a feasible solution for addressing the severe conducted EMI issues in offline power converters based on digital control systems.
Author Contributions
Conceptualization, Z.Y. and B.C.; methodology, Z.Y.; software, Z.Y.; validation, Z.Y., Y.Z. and Q.L.; formal analysis, Z.Y.; investigation, Z.Y.; resources, Z.Y.; data curation, Z.Y.; writing—original draft preparation, Z.Y.; writing—review and editing, Z.Y., Y.C. and B.C.; visualization, Z.Y.; supervision, B.L.; project administration, Y.C.; funding acquisition, B.C. and B.L. All authors have read and agreed to the published version of the manuscript.
Funding
This research was funded by National Natural Science Foundation General Project of China, grant number 52377169, National Natural Science Foundation of China, grant number 52377172, and Guangxi Natural Science Foundation of China, grant number 2021GXNSFAA220132.
Data Availability Statement
Data are contained within the article.
Conflicts of Interest
Author B.C. was employed by the company of Jiangsu Electric Power Research Institute Co., Ltd. The remaining authors declare that the research was conducted in the absence of any commercial or financial relationships that could be construed as a potential conflict of interest.
Appendix A
The proposed distribution transformation algorithm follows a uniform distribution.
Proposition A1.
where
is the distribution function of
.
The transformation
follows a uniform distribution on
as long as:
Proof of Proposition A1.
Thus,
Therefore, the range of is:
It can be known from the definition of the distribution function that the distribution function satisfies:
It can be known from the definition of the probability density function that is non-negative. From Equation (3), it can be seen that the distribution function is a monotonically increasing function. Therefore, according to the Frobenius–Perron operator, the probability density function of can be obtained:
It can be seen that follows a uniform distribution on the interval . □
Appendix B
Chua’s chaotic system state equation is:
where
Initial conditions is:
where T represents the transpose operator.
Appendix C
The testing equipment used in this paper is shown in Table A1.
Table A1.
List of measurement devices.
Table A1.
List of measurement devices.
| Equipment | Specification |
|---|---|
| Noise separator | EM5016 |
| Spectrum analyzer | GSP-818 |
| Oscilloscope | TDS 2012C, TDS 1012C-EDU |
| Digital multimeter | UT61E+, UT61D |
References
- Xu, G.; Wang, X.; Zhu, W.; Xiang, D. Prognostics & Health Management Technology for Power Electronic Devices and Its Advances. CSEE Proc. 2023, 43, 1912–1926. [Google Scholar] [CrossRef]
- Li, H.; Zhang, C.; Wang, Z.; Zhang, Z.; Zheng, T.; Lu, Y.; Zhang, J.; Zhang, B. Review of EMI Mechanism and Suppression Methods in Power Supply System of High-speed Train. CSEE Proc. 2023, 43, 3137–3154. [Google Scholar] [CrossRef]
- Sun, S.; Lin, Z.; Tang, X.; Wei, X.; Zhao, Z. A Review of Switching Oscillation in Wide Band Gap Semiconductor Devices. CSEE Proc. 2023, 43, 6765–6775. [Google Scholar] [CrossRef]
- Xu, J.; Gu, L.; Ye, Z.; Kargarrazi, S.; Rivas-Davila, J.M. Cascode GaN/SiC: A Wide-Bandgap Heterogenous Power Device for High-Frequency Applications. IEEE Trans. Power Electron. 2020, 35, 6340–6349. [Google Scholar] [CrossRef]
- Huang, H.; Lu, T. Research on the Influence of Mutual Inductance Coefficients in EMI Filter on Filtering Performance and Its Modeling Method. CSEE Proc. 2023, 43, 276–285. [Google Scholar] [CrossRef]
- Jiang, D.; Shen, Z.; Liu, Z.; Han, X.; Wang, Q.; He, Z. Progress in Active Mitigation Technologies of Power Electronics Noise for Electrical Propulsion System. CSEE Proc. 2020, 40, 5291–5301. [Google Scholar] [CrossRef]
- Wang, Y.; Luo, D.; Xiao, X.; Li, Y.; Xu, F. Review and Development Tendency of Research on 2~150 kHz Supraharmonics. Power Syst. Technol. 2018, 42, 353–365. [Google Scholar] [CrossRef]
- Zhang, Y.; Fang, J.; Lin, F.; Ruan, Z.; Zhang, W.; Chen, Y. Supraharmonics Transmission Characteristics in Three Phase Transformer. Power Syst. Technol. 2020, 44, 4387–4394. [Google Scholar] [CrossRef]
- Victoria, J.; Suarez, A.; Martinez, P.A.; Amaro, A.; Alcarria, A.; Torres, J.; Herraiz, R.; Solera, V.; Martinez, V.; Garcia-Olcina, R. Advanced Characterization of a Hybrid Shielding Solution for Reducing Electromagnetic Interferences at Board Level. Electronics 2024, 13, 598. [Google Scholar] [CrossRef]
- Wu, X.; Gao, X.; Wang, J.; Li, Z.; Du, S.; Gao, S.; Li, F.; Du, J.; Shchurov, N.I.; Zhang, X. Advances in Modeling and Suppression Methods of EMI in Power Electronic Converters of Third-Generation Semiconductor Devices. Electronics 2023, 12, 2348. [Google Scholar] [CrossRef]
- Xiao, X.; Liao, K.; Tang, S.; Fan, W. Development of Power-Electronized Distribution Grids and the New Supraharmonics Issues. Trans. China Electrotech. Soc. 2018, 33, 707–720. [Google Scholar] [CrossRef]
- Wang, S.; Wyk, J.D.V.; Lee, F.C. Effects of Interactions Between Filter Parasitics and Power Interconnects on EMI Filter Per-formance. IEEE Trans Ind. Electron. 2007, 54, 3344. [Google Scholar] [CrossRef]
- Narayanasamy, B.; Luo, F. A Survey of Active EMI Filters for Conducted EMI Noise Reduction in Power Electronic Converters. IEEE Trans. Electromagn. Compat. 2019, 61, 2040. [Google Scholar] [CrossRef]
- Chu, Y.; Wang, S.; Wang, Q. Modeling and Stability Analysis of Active/Hybrid Common-Mode EMI Filters for DC/DC Power Converters. IEEE Trans. Power Electron. 2016, 31, 6254. [Google Scholar] [CrossRef]
- Goswami, R.; Wang, S.; Chu, Y. Modeling and analysis of hybrid differential mode filters for AC/DC converters to suppress current ripples and EMI. In Proceedings of the 2015 IEEE Energy Conversion Congress and Exposition (ECCE), Montreal, QC, Canada, 20–24 September 2015. [Google Scholar] [CrossRef]
- Wang, S.; Maillet, Y.Y.; Wang, F.; Boroyevich, D.; Burgos, R. Investigation of Hybrid EMI Filters for Common-Mode EMI Suppression in a Motor Drive System. IEEE Trans. Power Electron. 2010, 25, 1034. [Google Scholar] [CrossRef]
- Wang, S.; Maillet, Y.Y.; Wang, F.; Boroyevich, D. Hybrid EMI filter design for common mode EMI suppression in a motor drive system. In Proceedings of the 2008 IEEE Power Electronics Specialists Conference, Rhodes, Greece, 15–19 June 2008. [CrossRef]
- Tung, N.T.; Tuyen, N.D.; Huy, N.M.; Phong, N.H.; Cuong, N.C.; Phuong, L.M. Design and Implementation of 150 W AC/DC LED Driver with Unity Power Factor, Low THD, and Dimming Capability. Electronics 2020, 9, 52. [Google Scholar] [CrossRef]
- Chien, W.; Cheng, Y.; Hsiao, C.; Han, K.; Chiu, C. Research on Anti-Radiation Noise Interference of High Definition Multi-media Interface Circuit Layout of a Laptop. Electronics 2020, 9, 426. [Google Scholar] [CrossRef]
- Li, H.; Ding, Y.; Zhang, C.; Yang, Z.; Yang, Z.; Zhang, B. A Compact EMI Filter Design by Reducing the Common-Mode Inductance With Chaotic PWM Technique. IEEE Trans. Power Electron. 2022, 37, 473. [Google Scholar] [CrossRef]
- Stepins, D.; Shah, D.D.; Sokolovs, A.; Zakis, J. An Improved Spread-Spectrum Technique for Reduction of Electromagnetic Emissions of Wireless Power Transfer Systems. Electronics 2022, 11, 2733. [Google Scholar] [CrossRef]
- Yousaf, J.; Faisal, M.; Nah, W.; Ghazal, M.; Sarmad Mahmmod, R.; Rmili, H. Effects of Random Switching Schemes on the EMI Levels of Conventional and Interleaved Buck Converters for Mobile Devices. Electronics 2022, 11, 306. [Google Scholar] [CrossRef]
- Fan, W.; Shi, Y.; Chen, Y. A Method for CM EMI Suppression on PFC Converter Using Lossless Snubber with Chaotic Spread Spectrum. Energies 2023, 16, 3583. [Google Scholar] [CrossRef]
- Chen, J.; Jiang, D.; Sun, W.; Shen, Z.; Zhang, Y. A Family of Spread-Spectrum Modulation Schemes Based on Distribution Characteristics to Reduce Conducted EMI for Power Electronics Converters. IEEE Trans. Ind. Appl. 2020, 56, 5142–5157. [Google Scholar] [CrossRef]
- Gamoudi, R.; Chariag, D.E.; Sbita, L. A Review of Spread-Spectrum-Based PWM Techniques—A Novel Fast Digital Implementation. IEEE Trans. Power Electron. 2018, 33, 10292–10307. [Google Scholar] [CrossRef]
- Callegari, S.; Setti, G.; Langlois, P. A CMOS tailed tent map for the generation of uniformly distributed chaotic sequences. In Proceedings of the 1997 IEEE International Symposium on Circuits and Systems (ISCAS), Hong Kong, China, 12 June 1997. [Google Scholar] [CrossRef]
- Qi, C.; Chen, X.; Mu, X. A Hybrid Spread Spectrum Modulation Technique for PWM Inverters. CSEE Proc. 2012, 32, 38–44. [Google Scholar] [CrossRef]
- Li, S.; He, G.; Chen, Y.; Jiang, L.; Qin, L. Research on Conduction EMI Suppression of High Frequency Isolated Quasi Z-source Inverter Based on Multi-scroll Chaos of Chen System. High. Volt. Eng. 2019, 45, 2545–2552. [Google Scholar] [CrossRef]
- Callegari, S.; Rovatti, R.; Setti, G. Spectral properties of chaos-based FM signals: Theory and simulation results. IEEE Trans. Circuits Syst. I Fundam. Theory Appl. 2003, 50, 3–15. [Google Scholar] [CrossRef]
- Yang, R.; Zhang, B. Spectrum Characteristics and Spectrum Optimizing Design of Chaotic PWM Based on Invariable Distribution. Acta Electron. Sin. 2007, 35, 2150–2155. [Google Scholar]
- Tang, X.; Xu, Z.; Li, F.; Li, Z.; Liu, L.; Yang, C.; Huang, H.B.; Chen, L.Y.; Zhang, X.G. A Physical Layer Security-Enhanced Scheme in CO-OFDM System Based on CIJS Encryption and 3D-LSCM Chaos. J. Light. Technol. 2022, 40, 3567–3575. [Google Scholar] [CrossRef]
- Tse, K.K.; Ng, R.W.; Chung, H.S.; Hui, S.Y.R.H. An evaluation of the spectral characteristics of switching converters with chaotic carrier-frequency modulation. IEEE Trans. Ind. Electron. 2003, 50, 171–182. [Google Scholar] [CrossRef]
- Callegari, S.; Rovatti, R.; Setti, G. Chaos-based FM signals: Application and implementation issues. IEEE Trans. Circuits Syst. I Fundam. Theory Appl. 2003, 50, 1141–1147. [Google Scholar] [CrossRef]
- Yang, Z.; Li, H.; Ding, Y.; Wang, J. Continuous Multi-Scroll Chaotic PWM and its Chaotic Signal Selection Method for EMI Sup-pression of Power Converters. IEEE Access 2020, 8, 168910–168922. [Google Scholar] [CrossRef]
- Wang, Y.; Liu, Z.; Zhang, L.; Pareschi, F.; Setti, G.; Chen, G. From Chaos to Pseudorandomness: A Case Study on the 2-D Coupled Map Lattice. IEEE Trans. Cybern. 2023, 53, 1324–1334. [Google Scholar] [CrossRef] [PubMed]
- Rovatti, R.; Setti, G.; Callegari, S. Limit properties of folded sums of chaotic trajectories. IEEE Trans. Circuits Syst. I Fun-Dam. Theory Appl. 2002, 49, 1736–1744. [Google Scholar] [CrossRef]
- Setti, G.; Mazzini, G.; Rovatti, R.; Callegari, S. Statistical modeling of discrete-time chaotic processes-basic finite-dimensional tools and applications. Proc. IEEE 2002, 90, 662–690. [Google Scholar] [CrossRef]
- Li, Z.; Qiu, S.; Chen, Y. Experimental study on the suppressing EMI level of DC-DC converter with chaotic map. CSEE Proc. 2006, 26, 76–81. [Google Scholar] [CrossRef]
- Yang, R.; Zhang, B. Experiment and mechanism research of chaotic PWM of converter in EMI suppressing. CSEE Proc. 2007, 27, 114–119. [Google Scholar] [CrossRef]
- Zhang, B.; Wang, S. A Survey of EMI Research in Power Electronics Systems With Wide-Bandgap Semiconductor Devices. IEEE J. Emerg. Sel. Top. Power Electron. 2020, 8, 626–643. [Google Scholar] [CrossRef]
- Balestra, M.; Bellini, A.; Callegari, S.; Rovatti, R.; Setti, G. Chaos-Based Generation of PWM-Like Signals for Low-EMI Induction Motor Drives: Analysis and Experimental Results. IEICE Trans. Electron. 2004, E87-C, 66–75. [Google Scholar]
- Zong, X.; Fei, S.; Zhao, J.; Zhang, A. Mathematical Statistics with Applications in MATLAB, 1st ed.; China Machine Press: Beijing, China, 2015; pp. 158–160. ISBN 978-7-111-50423-8. [Google Scholar]
- Li, H.; Ding, Y.; Yang, Z.; Jiang, Y. Optimization Design of EMI Filter with Chaotic PWM in DC-DC Converters. In Proceedings of the 2019 IEEE Workshop on Wide Bandgap Power Devices and Applications in Asia (WiPDA Asia), Taipei, China, 23–25 May 2019. [Google Scholar] [CrossRef]
Disclaimer/Publisher’s Note: The statements, opinions and data contained in all publications are solely those of the individual author(s) and contributor(s) and not of MDPI and/or the editor(s). MDPI and/or the editor(s) disclaim responsibility for any injury to people or property resulting from any ideas, methods, instructions or products referred to in the content. |
© 2024 by the authors. Licensee MDPI, Basel, Switzerland. This article is an open access article distributed under the terms and conditions of the Creative Commons Attribution (CC BY) license (https://creativecommons.org/licenses/by/4.0/).