Abstract
With the continuous development of the power grid, its structure is becoming increasingly complex. The occurrence of faults in transmission lines may lead to cascading failures in the power grid, ultimately resulting in widespread power outages. The transmission of equipment information and the sending of fault reports in the power grid rely on the power communication network. This network is crucial for ensuring the safe, stable, and economical operation of the power grid. As the number of devices in the power grid increases and sensor technology becomes more widespread, the volume of data generated by both the power grid and the power communication network has increased sharply. However, relational databases have limited scalability and struggle to meet the growing volume of data and user demands. This paper proposes a graph mapping method based on the power grid and communication network, utilizing data from both networks to construct a unified data plane in a graph database. Taking power transfer operations as an example, a unified standard data model and monitoring indicator system are established for both networks, enabling faster response and power restoration to blackout areas in the event of power grid faults. Simulation results demonstrate that compared to traditional relational databases, graph databases exhibit significantly improved efficiency in handling large-scale, highly connected data, making them more suitable for future power grids.
1. Introduction
With the continuous development of the power grid, ensuring a stable power supply has become a matter of great concern. The power communication network plays a crucial role in ensuring the safety, stability, and economic operation of the power grid. It is an integral part of the power grid, facilitating the transmission of information from primary equipment and reporting faults. The diagnosis, handling of faults, and power transfer operations in the power grid also rely on the power communication network [1]. The deployment of power grid equipment and the power communication network are closely interlinked, with power grid equipment and associated communication devices typically being deployed at the same location. The power communication network swiftly transmits business data, such as power consumption information and distribution automation data, from power grid equipment to the control center. Based on the real-time data transmission and continuous monitoring of power grid operations facilitated by the power communication network, network operation personnel can efficiently conduct power grid topology analysis, understand the structure and operational status of the power grid, and ensure its normal operation [2].
In recent years, with the explosive growth of data, advances in computing capabilities, and progress in AI and machine learning algorithms, big data technology has experienced unprecedented development. Big data technology, the Internet of Things, and cloud computing have jointly contributed to power grid regulation. Big data development has made it more diverse and complex, making it very difficult for relational databases to handle data [3]. Currently, relational databases are mainly used to represent power grid topologies, whereas relational databases use tabular structures to store data, with each table having a fixed schema. Relational databases have very low query efficiency when dealing with large amounts of data and numerous connections, prompting people to turn to non-relational databases [4]. Graph databases use graph structures to store data, and they perform well in handling large volumes of complex relational data, making it easy to represent and query complex relationships. Additionally, since graph databases do not need to adhere to the strict schema, they are more flexible in scenarios where data models need frequent modifications [5].
Based on the operational data of the power grid and communication network, a graph mapping method based on the power communication network and power grid can be constructed to map the data of the two networks to a unified data plane, establishing a unified standard data model and monitoring index system for both networks. Taking power transfer as an example, network operators can grasp real-time information about the operation of the power grid through the power communication network. In the event of equipment or line failures, the communication network operation analysis module can quickly analyze the propagation range of the fault. Through remote monitoring and control of power grid devices via the power communication network, fault resolution solutions can be promptly generated, and power transfer operations can be completed.
In recent years, many experts and scholars have conducted numerous research schemes for power grid planning combined with graph databases to improve the efficiency of power grid dispatch and ensure stable power supply. Reference [6] constructed some power grid data models based on domain modeling theory and proposed methods to transform these models, greatly enhancing the efficiency of data retrieval. However, the paper did not elaborate on combining different data models or address conflicts and contradictions between various models. Reference [7] combined power topology with graph databases and proposed a method for power outage area analysis based on graph databases. Reference [8] designed a common information model-oriented graph database (CIMGDB), which can enhance the efficiency of the power system. However, The complex model structure results in a large amount of data. Reference [9] used the CIM/E model to reduce data volume and speed up the response time of the data storage system, where the network topology processing algorithm was implemented using the messaging method. It was based on the TigerGraph graph database and was applied to process the topology information of substations. Reference [10] built a graph database-based power grid topology analysis application framework, addressing issues in data modeling, storage, and processing in power grid asset data management systems represented by power grid topology analysis systems. Reference [11] combined a breadth-first search algorithm with the graph database algorithm to study a method for calculating fault range, improving the efficiency of analyzing power grid faults. Reference [12] proposed a topology analysis tool, TAnalyzer, based on the graph database Neo4j, which could better perform tasks such as power grid topology analysis and fault range detection. The drawbacks were the insufficient accuracy of topology analysis and the need for ample storage space. Reference [13] proposed a fault propagation algorithm based on graph databases and predicate calculus, effectively improving the efficiency of the power grid. Reference [14] completed the solution of power outage range and the design of power transfer schemes based on graph data modeling. However, the paper lacked corresponding experimental data to verify the feasibility of the proposed solutions.
This paper combines graph theory algorithms such as Dijkstra, depth-first search, and breadth-first search, proposing a large-scale power grid fault propagation range calculation and optimal power transfer path planning scheme based on the Neo4j graph database, with distance as the weighting factor. Test results indicate that, compared to traditional schemes based on relational databases, the proposed scheme in this paper achieves faster planning of power transfer paths, thereby reducing losses caused by faults.
2. Basic Framework of Power Transfer Scheme
As shown in Figure 1, formulating a power transfer scheme in the graph database generally involves six main steps: collecting data, creating the graph model, determining the fault propagation range, identifying the optimal power transfer path, performing switch operations based on the selected path, and validating the generated power transfer scheme. Specifically, it begins with collecting data on the equipment and lines in the distribution network. Subsequently, we can create the graph database model based on the collected data, representing nodes and connections in the graphical format. The fault propagation range can be determined by combining the relevant graph algorithms with the fault location. Then, the optimal power transfer scheme is generated using shortest path algorithms and specifying the areas requiring power supply. Finally, the generated power transfer path performs corresponding switch operations, and the scheme’s feasibility is validated.
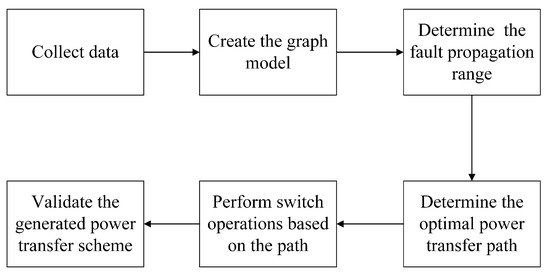
Figure 1.
Generation of the power transfer scheme.
3. Relational Database and Neo4j Graph Database
In the development of database technology, relational and graph models are commonly used data models. The relational model is established on a rigorous mathematical foundation, exhibiting high data independence and security with simple usage. The relational database is a structured database that employs tables to store data, and its data query language is SQL. After decades of development, relational database technology has become relatively mature, but its strict schema constraints make it challenging to extend existing databases [15].
Relational databases organize data through tables. When representing entity relationships, it is necessary to repetitively store information in different columns of the tables, leading to extremely low efficiency in recursive queries and multi-table join queries. In complex data models, relational databases require multiple tables and table connections to represent relationships between entities. Multiple join operations result in decreased query performance and increased query complexity [16].
Graph databases use the graph structure to store data, represented by nodes, edges, and attributes. In contrast to relational databases, graph databases can flexibly store relationships between entities directly [17]. In the simple graph model shown in Figure 2, nodes represent entities, such as power sources or electrical equipment. Edges represent relationships between entities, such as power supply or electricity usage. Attributes denote information about nodes and edges, such as voltage, power, etc.
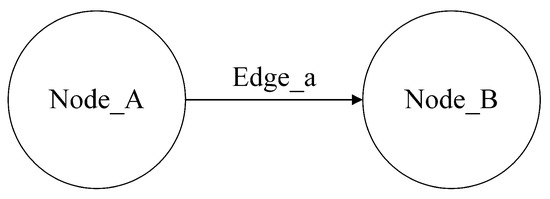
Figure 2.
The graph model of Neo4j.
The power circuit of a simple dual-machine system is shown in Figure 3, with a busbar, a circuit breaker, switches, and loads in the lines. The relational model of this dual-machine system is illustrated in Table 1, Table 2, Table 3, Table 4 and Table 5. Different types of equipment are stored in their respective component tables (see Table 1, Table 2, Table 3 and Table 4), and the connection relationships between devices are stored in the connection table (see Table 5). Information retrieval involves operations between several tables, thus limiting speed.
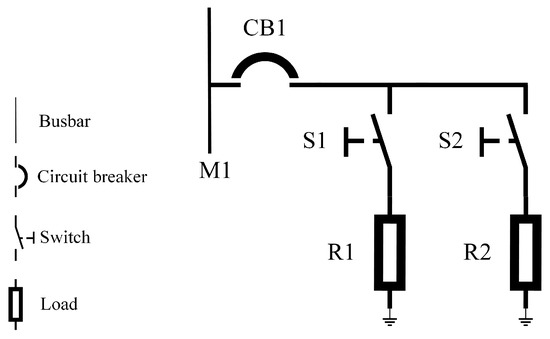
Figure 3.
The power circuit of a dual-machine system.

Table 1.
Table of busbars.
Table 2.
Table of circuit breakers.
Table 3.
Table of switches.
Table 4.
Table of loads.
Table 5.
Table of connection relationships.
The graph model of the dual-machine system is depicted in Figure 4. The graph database stores the system’s topology information in the form of nodes and edges, facilitating a visual representation of the connection relationships between components.
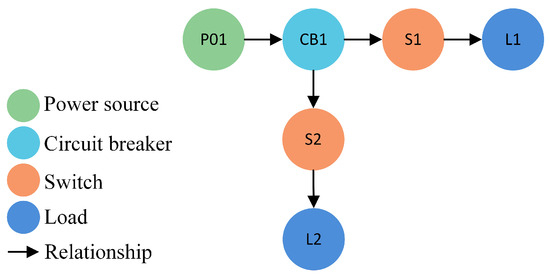
Figure 4.
The graph model of the dual-machine system.
When querying in graph databases, utilizing the relationships represented by edges allows for direct retrieval of entity records, eliminating the performance overhead caused by multiple join operations in relational databases and significantly enhancing query efficiency. Compared to relational databases, graph databases have several advantages:
- (1)
- The natural expression of the relational model. In graph databases, it is possible to define nodes and edges of any type to represent entities and relationships. This model can intuitively and naturally reflect the relational model in the real world, making data modeling more flexible and intuitive.
- (2)
- The flexible data model. The model of graph databases is more flexible than relational databases, allowing for the dynamic addition and removal of nodes, edges, and attributes. This flexibility enables better adaptation to changes in the data model.
- (3)
- Efficient relationship queries. By directly navigating the graph structure, graph databases can efficiently execute relationship and path queries without loading irrelevant, redundant data.
- (4)
- Node parallel computation. Unlike relational databases that only support simple statistical analysis and calculation functions, graph databases support node parallel computation, enabling the processing of more complex computing tasks. Some graph databases also support user-defined computation function libraries.
- (5)
- Ease of understanding and visualization. The data model and query language of graph databases make data more understandable. Through intuitive graphical representations, users can better understand relationships between data.
Neo4j is a widely used high-performance graph database known for its excellent performance in scenarios with complex entity relationships and strong data correlations. Cypher is the query language of Neo4j, providing a flexible and intuitive syntax that allows users to perform queries between nodes and edges efficiently. Additionally, Neo4j integrates various algorithms such as Dijkstra, LPA, etc., which assist users in complex graph analysis and processing [18]. Neo4j has found extensive applications in various fields, including social network analysis, network security, knowledge graphs, and power enterprise information systems.
In summary, Neo4j is a robust graph database management system that excels at tasks like fault range analysis and rapid generation of the power transfer scheme.
4. Construction of Power Grid Model
As shown in Table 6, each node has four attributes in the established graph model: ID, Label, Name, and Color. The label is used to distinguish different types of nodes. For instance, P and D can represent power sources and electrical equipment, respectively. The color allows us to visually identify the type of each node within the graph database.
Table 6.
Table of nodes.
Table 7 is a relational table containing seven attributes: ID, Label A, Name A, Name a, Label B, Name B, and Distance. For example, in Figure 2, Node_A and Node_B are the start and end nodes of the relationship Edge_a, respectively. Both nodes have label and name attributes, while the relationship Edge_a has ID, Name, and Distance attributes.
Table 7.
Table of relationships.
When modeling in the relational database, data are ultimately stored in tabular form, making it challenging to represent relationships between nodes intuitively. Retrieving connection relationships in such databases often requires a significant amount of time. In contrast, data are transformed into a graphical format when modeling in a graph database, allowing node relationships to be intuitively visualized. The graph database can be viewed as a collection of nodes and edges, and the inherent network structure of the power grid makes it well-suited for storing data in a graph format [19].
5. Power Transfer Scheme Based on Graph Database
CIM/E language is named after CIM and the prefixes ‘easy’, ‘efficiency’, and ‘electric-power’. It is simple, efficient, and well-suited for describing and exchanging large-scale power grid models [20]. The data model of the power system adopts the CIM/E standard and is described in the form of relational tables, which represent various objects within the system. Equipment and connection relationships are stored in separate tables, namely the equipment and relationship tables. In the traditional relational model, equipment and relationships can be equivalently represented as nodes and edges in a graph model [21].
5.1. Graph Database Modeling
Figure 5 depicts the partial representation of the lines by modeling a regional line diagram in the graph database. Each node has four attributes: ID, label, name, and color. Different types of equipment have distinct labels and colors. For instance, the label for power nodes in Figure 5 is P, the color is green, and the name is P01. In the diagram models in Figure 5 and the following figures, we use the lowercase letters along with relationship arrow to represent different connections. Specifically, the connection relation for circuit breakers is uniformly designated as ‘y’; the connection nodes for equipment areas are assigned ‘a’; ‘z’ signifies the relation for disconnecting switches; while other lowercase letters, such as ‘b’ and ‘d’, denote the relationship names for line nodes.
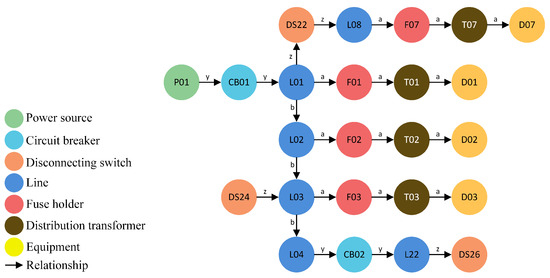
Figure 5.
The partial power grid model.
5.2. Scheme to Determine the Fault Propagation Range
The data volume in the distribution network is increasing, and the connection relationships have become intricate. To reduce the loss caused by equipment or line failure, it is essential to determine the fault propagation range [14]. As shown in Figure 6, the specific steps are as follows:
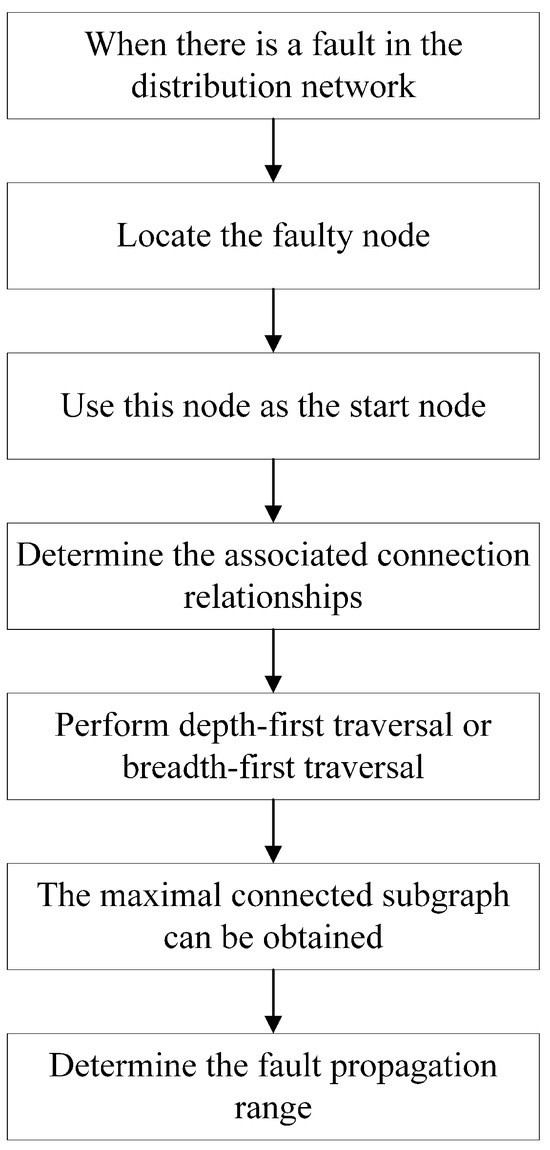
Figure 6.
Determination of the fault propagation range.
- (1)
- When a fault occurs in the distribution network, it is necessary to identify the specific equipment or line where the fault has occurred and locate the corresponding node in the established distribution network model.
- (2)
- Take this node as the starting node and determine the connected relationships associated with this starting node.
- (3)
- Using either the depth-first traversal or breadth-first traversal method, and building on the connected relationships determined in step (2), traverse the graph database to obtain a maximal connected subgraph related to the starting node. This subgraph represents the range of fault propagation for that node.
5.3. Planning Scheme for Optimal Power Transfer Path
When equipment or line faults result in power outages, it is necessary to rapidly generate a power transfer scheme to supply power to electrical equipment. As shown in Figure 7, the specific steps are as follows:
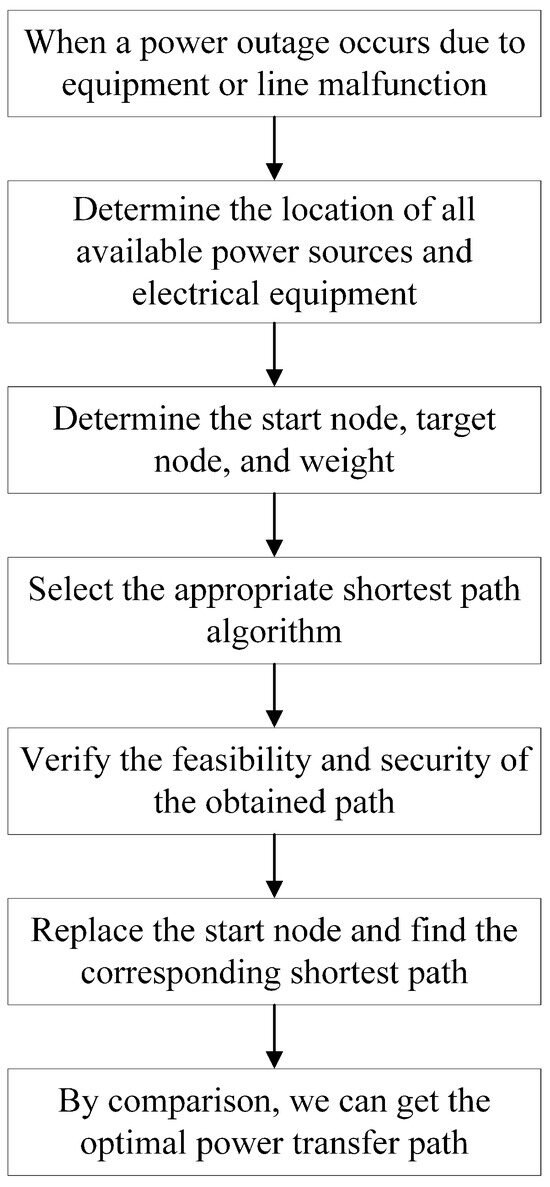
Figure 7.
Determination of the optimal power transfer path.
- (1)
- Traverse the graph database to identify all available power sources and select one as the start node. Simultaneously, find the node corresponding to the electrical equipment in the model and designate it as the target node.
- (2)
- Determine the factors considered in finding the shortest path, such as distance, path length, or optimal power flow.
- (3)
- Use an appropriate shortest path algorithm, such as Dijkstra’s algorithm, to calculate the shortest path from the start node to the target node.
- (4)
- Analyze the obtained power transfer path, verifying its feasibility and safety.
- (5)
- Replace the start node with other available power sources and repeat steps (2)–(4). Finally, compare the power transfer paths from different power sources to obtain the optimal power transfer path.
The steps of Dijkstra’s shortest path algorithm [22] are illustrated in Algorithm 1.
| Algorithm 1 The Dijkstra shortest path algorithm |
|
The optimal power transfer path planning algorithm with distance as the weight is shown in Algorithm 2.
| Algorithm 2 The power transfer path planning algorithm |
|
6. Application of Power Transfer Scheme
This section validates the feasibility of two schemes: fault propagation range calculation and optimal power transfer path planning, based on the topological model of a specific area’s distribution network using the Neo4j graph database [23]. The model comprises 265 nodes and 286 relationships, including 3 power sources, 7 circuit breakers, 56 types of electrical equipment, etc. During the initial operation, the equipment in the network is powered by node P03. Figure 8 illustrates a partial connectivity graph for power source P03, where each electrical equipment has only one connection relationship.
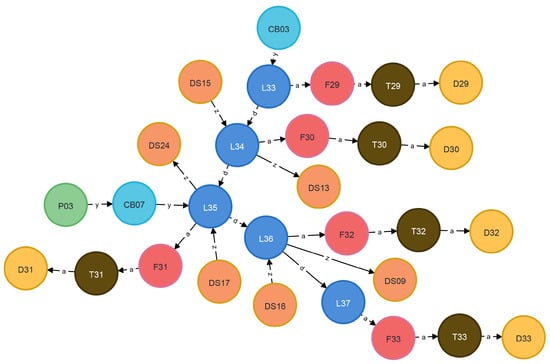
Figure 8.
Partial connection graph of P03.
6.1. Determination of Fault Propagation Range
During the power grid operation, if an anomaly is detected in equipment D30, it is first necessary to disconnect all circuit breakers and switches in Figure 8, identify the nodes connected to D30, and then proceed with the fault diagnosis.
Starting from D30, the following Cypher query can obtain the maximal connected subgraph of D30, as shown in Figure 9. The graph represents the propagation range of the current fault, and the query executed in 50 ms.
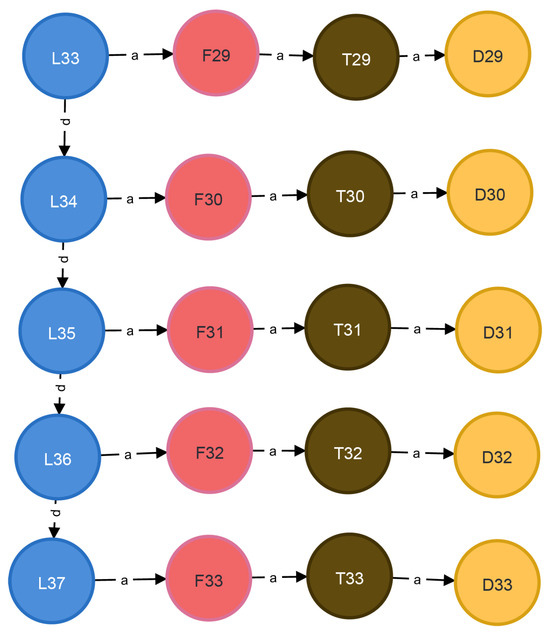
Figure 9.
Maximal connected subgraph of D30.
- MATCH (n:D {name:’D30’})-[:a*0..]-(m)-[:d*0..]-(k)-[:a*0..]-(w)RETURN DISTINCT w;
6.2. Power Transfer Path Planning
Due to the malfunction of equipment D30, power source P03 can no longer supply the entire power grid. In this case, if equipment D49 requires an urgent power supply, it is necessary to calculate the shortest paths from the other two power sources to D49 separately. Subsequently, the optimal power transfer path is selected from the two paths. Finally, the switches along the chosen path are closed to complete the power transfer.
Using power source P01 as the start node and equipment D49 as the target node, the shortest path between them can be obtained through the Dijkstra algorithm. The Cypher statement is shown below, and the query time for this operation is 132 ms.
- MATCH (startNode:P {name:’P01’}),(endNode:d {name:’D49’})CALL apoc.algo.dijkstra (startNode, endNode, ’’, ’distance’) YIELD path,weightRETURN path,weight,length(path);
Figure 10 illustrates the shortest path from P01 to D49, with a path length of 17 and a total distance of 8377.
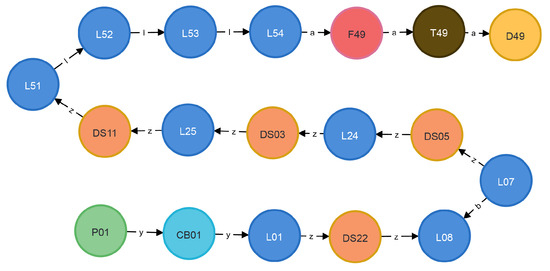
Figure 10.
Power transfer path from P01 to D49.
Changing the name of the start node in the above Cypher code to P02 yields the shortest path from P02 to D49, with a query time of 121 ms.
Figure 11 depicts the shortest path from P02 to D49, with a path length of 12 and the sum of distances equal to 6596.
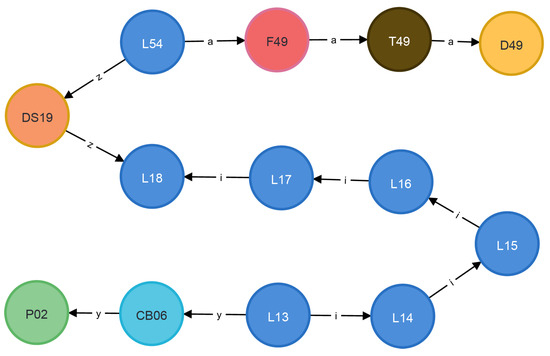
Figure 11.
Power transfer path from P02 to D49.
Upon comparison, it is evident that power to equipment D49 should be performed by power source P02, whether from the path length or distance perspective.
In this experiment, for the sake of simplicity, we assigned different distances to each edge, and each edge’s distance was randomly generated. In practical applications, specific weights such as the optimal power flow can be set to edges between nodes based on the actual conditions of the power grid. These weights can then be considered during the optimal power transfer path planning.
6.3. Comparison between the Graph Database and Relational Database
In order to obtain more accurate conclusions, we conducted experiments separately on two different computers. The configurations and operating environments of the computers are shown in Table 8. Compared with graph databases, the results obtained from power transfer path planning in relational databases are the same, but there is a significant difference in query speed. The query times between two databases on different computers are shown in Table 9.
Table 8.
The configurations and operating environments.
Table 9.
Comparison of query times between two databases on different computers.
When querying the maximal connected subgraph of D30, due to the small data volume, queries are relatively simple and involve fewer nodes and relationships, resulting in better performance of relational databases. However, when querying the power transfer paths, which involve a significantly larger number of nodes and relationships, the performance of graph databases is much better than that of relational databases. Moreover, a decrease in computer performance will rapidly increase query time for relational databases, but the impact on graph databases is relatively minor.
Additionally, defining the sum of nodes and relationships as complexity, we conducted experiments on networks of different scales. The query time curves for the two computers are shown in Figure 12 and Figure 13. Obviously, when the complexity is low, both relational databases and graph databases perform well. As the complexity increases, the query time of relational databases rapidly increases, while graph databases exhibit better robustness, showing no significant performance degradation. At a complexity of 1000, the performance gap between graph databases and relational databases becomes very pronounced. The experiments demonstrate that graph databases can perform efficiently with increasing data volume and complexity, making them more suitable for large-scale and highly connected data storage and query requirements.
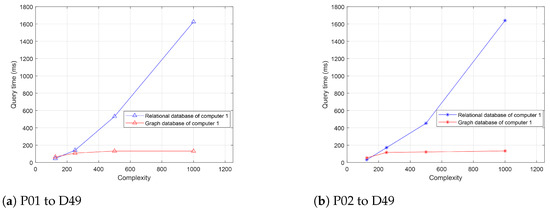
Figure 12.
Query times for two power transfer paths in computer 1.
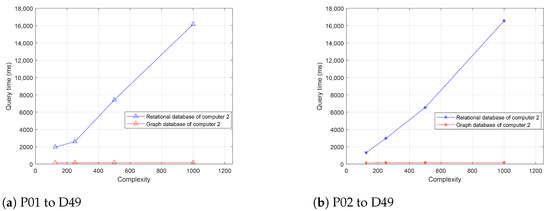
Figure 13.
Query times for two power transfer paths in computer 2.
7. Conclusions
This paper uses the graph database to explore the calculation of the fault propagation range and the planning of power transfer paths in distribution networks. This paper proposes corresponding schemes and conducts experimental verification in the graph database. The proposed schemes successfully address the problems and visually represent the experimental results. Additionally, the experimental results in the graph database are compared with those in the relational database. The comparison reveals that the graph database performs less efficiently than the relational database when calculating the fault propagation range with a relatively small dataset. However, in planning power transfer paths, where many nodes and edges are involved, the relational database experiences a significant increase in processing time. The model established in this paper only consists of a few hundred nodes and relationships. In practical applications, the number of devices will grow exponentially, and the efficiency of graph databases will far exceed that of relational databases.
The experimental results indicate that the power transfer scheme based on the graph database can rapidly calculate the fault propagation range and promptly complete the planning of power transfer paths in large-scale and complexly interconnected distribution networks.
Author Contributions
Conceptualization, D.L., B.Y., L.L., C.S., L.M. and S.X.; methodology, D.L., L.L. and J.S.; software, J.S.; validation, C.C.; formal analysis, B.Y.; investigation, C.C.; data curation, D.L., L.M. and S.X.; writing—original draft, C.C.; writing—review and editing, C.S. and J.S.; supervision, L.L. and L.M.; project administration, B.Y., C.S. and S.X. All authors have read and agreed to the published version of the manuscript.
Funding
This research was funded by the Science and Technology project of the State Grid Corporation of China (Research on Dispatching Fusion Communication Oriented to the Power Communication Network and Its Cooperative Control with Power Network Operation, 52060022001B).
Data Availability Statement
Restrictions apply to the availability of these data. Data were based on the author of reference [23] and are available from (accessed on 19 June 2023) http://www.aeps-info.com/aeps/article/abstract/20211031001 with the permission of the author of reference [23].
Conflicts of Interest
D.L., L.L., C.S., L.M. and S.X. are employed by the Information & Telecommunications Company, State Grid Shandong Electric Power Company. B.Y. is employed by the State Grid Beijing Electric Power Company. The remaining authors declare that the research was conducted in the absence of any commercial or financial relationships that could be construed as a potential conflict of interest.
References
- Liu, S.; Tang, B.G.; Zhou, Z.Q. Research of the electric communication network system based on SDN architecture. In Proceedings of the 2021 IEEE 4th Advanced Information Management, Communicates, Electronic and Automation Control Conference (IMCEC), Chongqing, China, 18–20 June 2021; pp. 678–681. [Google Scholar]
- Wei, Y.J.; Tian, A.Q.; Jiang, Y.J.; Zhang, W.J.; Ma, L.Q.; Ma, L.; Sun, C.; Sun, J. A DRL-Based Load Shedding Strategy Considering Communication Delay for Mitigating Power Grid Cascading Failure. Electronics 2023, 12, 3024. [Google Scholar] [CrossRef]
- Palagashvili, A.M.; Stupnikov, S.A. Reversible Mapping of Relational and Graph Databases. Pattern Recognit. Image Anal. 2023, 33, 113–121. [Google Scholar] [CrossRef]
- Do, T.; Mai-Hoang, T.; Nguyen, V.; Huynh, Q. Query-based performance comparison of graph database and relational database. In Proceedings of the SoICT 2022: The 11th International Symposium on Information and Communication Technology, Hanoi, Vietnam, 1–3 December 2022; pp. 375–381. [Google Scholar]
- Sunuwar, D.; Singh, M. Comparative analysis of relational and graph databases for data provenance: Performance, queries, and security considerations. In Proceedings of the 2023 World Conference on Communication & Computing (WCONF), Raipur, India, 14–16 July 2023; pp. 1–7. [Google Scholar]
- Pan, Z.H.; Jing, Z.X. Modeling methods of big data for power grid based on graph database. In Proceedings of the 2018 International Conference on Power System Technology (POWERCON), Guangzhou, China, 6–8 November 2018; pp. 4340–4348. [Google Scholar]
- Dai, J.P.; Chai, B.; Qiu, H.B.; Zhang, B.; Jiang, W.; Wang, L. Analysis of distribution network outrage region based on graph database. In Proceedings of the 2016 China International Conference on Electricity Distribution (CICED), Xi’an, China, 10–12 August 2016; pp. 1–4. [Google Scholar]
- Ravikumar, G.; Khaparde, S.A. A Common Information Model Oriented Graph Database Framework for Power Systems. IEEE Trans. Power Syst. 2017, 32, 2560–2569. [Google Scholar] [CrossRef]
- Zhou, Z.X.; Yuan, C.; Yao, Z.Y.; Dai, J.P.; Liu, G.Y.; Dai, R.C.; Wang, Z.W.; Huang, G.M. CIM/E Oriented Graph Database Model Architecture and Parallel Network Topology Processing. In Proceedings of the 2018 IEEE Power & Energy Society General Meeting (PESGM), Portland, OR, USA, 5–10 August 2018; pp. 1–5. [Google Scholar]
- Zhou, A.H.; Qiu, H.B.; Pan, S.; Hu, B. Research on Power Grid Topology Analysis Based on Graph Database. In Proceedings of the 2018 5th IEEE International Conference on Cloud Computing and Intelligence Systems (CCIS), Nanjing, China, 23–25 November 2018; pp. 841–844. [Google Scholar]
- Chai, B.; Liu, S.Y.; Dai, J.P.; Zhao, T.; Zhou, A.H.; Gao, K.L. Fault Range Analysis of Information and Communications Assets in Power Grid: A Graph Data Perspective. In Proceedings of the 2017 International Conference on Applied Mathematics, Modelling and Statistics Application (AMMSA), Beijing, China, 21–22 May 2017; pp. 162–165. [Google Scholar]
- Qiu, H.B.; Zhou, A.H.; Hu, B.; Chai, B.; Pan, S.; Yang, P. TAnalyzer: A Graph Database Based Topology Analysis Tool for Power Grid. In Proceedings of the 2nd International Conference on Computer Science and Application Engineering (CSAE 2018), Hohhot, China, 22–24 October 2018; pp. 1–5. [Google Scholar]
- Chen, J.; Jiang, Y.; Lu, W.D.; Han, M.; Li, X.M. A large scale power communication network simulation system based on big graph database. Sci. China Technol. Sci. 2019, 62, 2088–2092. [Google Scholar] [CrossRef]
- Tang, Z.; Chai, B.; Wei, M.Y.; Sai, F. Research on Distribution Network Topology and Fault Planning Knowledge Graph Fusion and Reasoning Based on Graph Database. In Proceedings of the 2022 12th International Conference on Power and Energy Systems (ICPES), Guangzhou, China, 23–25 December 2022; pp. 174–178. [Google Scholar]
- Gyorodi, C.; Gyorodi, R.; Sotoc, R. A comparative study of relational and nonrelational database models in a Web-based application. Int. J. Adv. Comput. Sci. Appl. 2015, 6, 78–83. [Google Scholar]
- Sestak, M.; Rabuzin, K.; Novak, M. Integrity constraints in graph databases-implementation challenges. In Proceedings of the Central European Conference on Information and Intelligent Systems. 27th International Conference 2016, Varazdin, Croatia, 21–23 September 2016; pp. 28–35. [Google Scholar]
- Soussi, R.; Aufaure, M.-A.; Baazaoui, H. Towards Social Network Extraction Using a Graph Database. In Proceedings of the Second International Conference on Advances in Databases, Knowledge, and Data Applications (DBKDA 2010), Menuires, France, 11–16 April 2010; pp. 28–34. [Google Scholar]
- Lu, H.L.; Hong, Z.G.; Shi, M.Y. Analysis of Film Data Based on Neo4j. In Proceedings of the 2017 16th IEEE/ACIS International Conference on Computer and Information Science (ICIS), Wuhan, China, 24–26 May 2017; pp. 675–677. [Google Scholar]
- Wang, F.H.; Shi, J.; Ju, X.M.; Li, B. An Efficient Graph Data Processing Framework for Power Grid Systems. In Proceedings of the 2018 IEEE SmartWorld, Ubiquitous Intelligence & Computing, Advanced & Trusted Computing, Scalable Computing & Communications, Cloud & Big Data Computing, Internet of People and Smart City Innovation (SMARTWORLD/SCALCOM/UIC/ATC/CBDCOM/IOP/SCI), Guangzhou, China, 7–11 November 2018; pp. 2063–2067. [Google Scholar]
- Huang, H.; Gao, Z.H.; Dai, J.P.; Wang, Y.; Shan, X.; Zhai, M.Y.; Liu, G.Y.; Wang, W. Power Grid Modeling and Topology Analysis Based on Graph Database Conforming with CIM/E. In Proceedings of the 2019-International Forum on Smart Grid Protection and Control (PURPLE MOUNTAIN FORUM), Nanjing, China, 17–18 August 2019; pp. 575–591. [Google Scholar]
- Liu, Y.N.; Qu, S.Q.; Fan, B.B. Current Status and Application Analysis of Graph Database Technology. In Proceedings of the 2021 3rd International Conference on Machine Learning, Big Data and Business Intelligence (MLBDBI), Taiyuan, China, 3–5 December 2021; pp. 735–744. [Google Scholar]
- Verma, D.; Messon, D.; Rastogi, M.; Singh, A. Comparative Study Of Various Approaches Of Dijkstra Algorithm. In Proceedings of the 2021 International Conference on Computing, Communication, and Intelligent Systems (ICCCIS), Noida, India, 19–20 February 2021; pp. 328–336. [Google Scholar]
- Jiang, W.; Wang, M.H.; Chen, J.M.; Liu, J.D.; Pu, S.; Xu, Z.Q. Calculation of Power Supply Reliability for Distribution Network Based on Neo4j Graph Database. Autom. Electr. Power Syst. 2022, 46, 104–111. [Google Scholar]


Disclaimer/Publisher’s Note: The statements, opinions and data contained in all publications are solely those of the individual author(s) and contributor(s) and not of MDPI and/or the editor(s). MDPI and/or the editor(s) disclaim responsibility for any injury to people or property resulting from any ideas, methods, instructions or products referred to in the content. |
© 2024 by the authors. Licensee MDPI, Basel, Switzerland. This article is an open access article distributed under the terms and conditions of the Creative Commons Attribution (CC BY) license (https://creativecommons.org/licenses/by/4.0/).