Article

Data-Driven ICS Network Simulation for Synthetic Data Generation

1
Department of Computer Science and Engineering, University of North Texas, Denton, TX 76205, USA
2
Department of Computer Engineering (Smart Security), Gachon University, (13120), Seongnam-si 1342, Gyeonggi-do, Republic of Korea
3
Department of Electrical and Computer Engineering, Illinois Institute of Technology, Chicago, IL 60616, USA
*
Author to whom correspondence should be addressed.
Electronics 2024, 13(10), 1920; https://doi.org/10.3390/electronics13101920
Submission received: 18 December 2023 / Revised: 6 February 2024 / Accepted: 12 February 2024 / Published: 14 May 2024
(This article belongs to the Special Issue Applied AI-Based Platform Technology and Application, Volume II)

Abstract

:
Industrial control systems (ICSs) are integral to managing and optimizing processes in various industries, including manufacturing, power generation, and more. However, the scarcity of widely adopted ICS datasets hampers research efforts in areas like optimization and security. This scarcity arises due to the substantial cost and technical expertise required to create physical ICS environments. In response to these challenges, this paper presents a groundbreaking approach to generating synthetic ICS data through a data-driven ICS network simulation. We circumvent the need for expensive hardware by recreating the entire ICS environment in software. Moreover, rather than manually replicating the control logic of ICS components, we leverage existing data to autonomously generate control logic. The core of our method involves the stochastic setting of setpoints, which introduces randomness into the generated data. Setpoints serve as target values for controlling the operation of the ICS process. This approach enables us to augment existing ICS datasets and cater to the data requirements of machine learning-based ICS intrusion detection systems and other data-driven applications. Our simulated ICS environment employs virtualized containers to mimic the behavior of real-world PLCs and SCADA systems, while control logic is deduced from publicly available ICS datasets. Setpoints are generated probabilistically to ensure data diversity. Experimental results validate the fidelity of our synthetic data, emphasizing their ability to closely replicate temporal and statistical characteristics of real-world ICS networks. In conclusion, this innovative data-driven ICS network simulation offers a cost-effective and scalable solution for generating synthetic ICS data. It empowers researchers in the field of ICS optimization and security with diverse, realistic datasets, furthering advancements in this critical domain. Future work may involve refining the simulation model and exploring additional applications for synthetic ICS data.

1. Introduction

Industrial control systems (ICSs) are widely used to manage and control processes in industries such as manufacturing, power generation, communications, and chemicals. As the ICS plays an increasingly core role in the industry, it has become the subject of various studies, such as those on optimization [1,2], to improve process efficiency. These studies require datasets collected from actual ICSs because they require process status information in many cases. SWaT [3] and HAI [4] are datasets collected from a test bed configured similarly to an actual ICS and are used in many data-driven studies.
While the need for and importance of ICS datasets is increasing [5], the number of widely adopted datasets is limited. There are two main reasons for this: (1) Building an ICS environment, including hardware, costs a lot of money. The ICS environment is largely implemented with supervisory control and data acquisition (SCADA) systems, distributed control systems (DCSs), programmable logic controllers (PLCs), human–machine interfaces (HMIs), and various sensors [6]. These devices require high reliability and performance to delicately control the process and are generally expensive. (2) Even if hardware devices are equipped, implementing the logic to control these devices requires the know-how of skilled workers.
Even if public datasets exist, more data may be required. For example, machine learning- or deep learning-based ICS intrusion detection systems [7,8] require a large amount of learning data to be supplied to achieve high detection performance. For this purpose, augmentation of the dataset is necessary. The best way to augment data is to recreate the ICS environment where the dataset was collected, but this presents the following challenges: (1) In general, a network design that collects publicly available ICS datasets is presented, but the control logic of detailed components such as a PLC is often not disclosed, making it difficult to reproduce. (2) In the ICS network, numerous components (or data points) interact. Therefore, even if well-known generative models such as generative adversarial networks (GANs) [9] or variational autoencoders (VAEs) [10] are utilized, it is not appropriate to generate data independently for data points.
However, it is essential to acknowledge the limitations and challenges posed by existing methods for data augmentation in the context of industrial control systems (ICSs); while the need for additional data is evident, recreating the ICS environment to augment datasets presents its own set of issues, as follows.
Lack of control logic disclosure: In many cases, publicly available ICS datasets do not provide comprehensive details regarding the control logic of intricate components like programmable logic controllers (PLCs). This lack of disclosure hampers the ability to accurately reproduce the control strategies and behaviors of these critical components in a simulated environment.
Interconnected data points: Within an ICS network, numerous components and data points interact intricately. Unlike traditional data augmentation scenarios, where generative models like generative adversarial networks (GANs) or variational autoencoders (VAEs) may be applied independently to generate data points, ICS data points are interdependent. Changes in one component can have ripple effects on others. Therefore, conventional generative models may not capture the complex interdependencies and correlations present in ICS networks effectively.
Addressing these challenges requires innovative approaches that can replicate not only the data but also the intricate control logic and interactions between components accurately. These challenges underscore the need for more specialized and data-driven methods tailored specifically to the unique characteristics of ICS environments.
Our insights for resolving the above challenges and generating ICS artificial data are as follows: (1) Instead of using expensive hardware equipment, the ICS environment is completely recreated in software. (2) Instead of completely reproducing the control logic of equipment such as PLCs, the logic is reproduced based on data. (3) Probabilistically set setpoints are used to control or provide randomness to the generated data. A setpoint is a target value for the process value of the control system and is used to control the operation of the process.
Combining the above insights, in this paper, we propose a method to simulate the ICS network environment where data are collected for a given original ICS dataset and to augment the data. First, we build a simulated ICS environment using virtualized containers containing PLCs or SCADA. Each PLC uses a software-virtualized hardware layer instead of actual hardware. Additionally, the control logic of the PLC is reproduced using the existing ICS dataset to operate identically to the actual PLC it is intended to imitate. SCADA controls the PLC using setpoints, collects data generated from the network, and stores them in a database. Our experimental findings confirm that our simulated ICS environment successfully generates synthetic data that closely mimic the temporal patterns and statistical characteristics of real-world ICS network data. This approach holds promise for enhancing data availability in various ICS research applications, such as optimization and intrusion detection systems. At this time, setpoints are set stochastically to provide randomness to the collected data. The contributions of this paper are as follows:
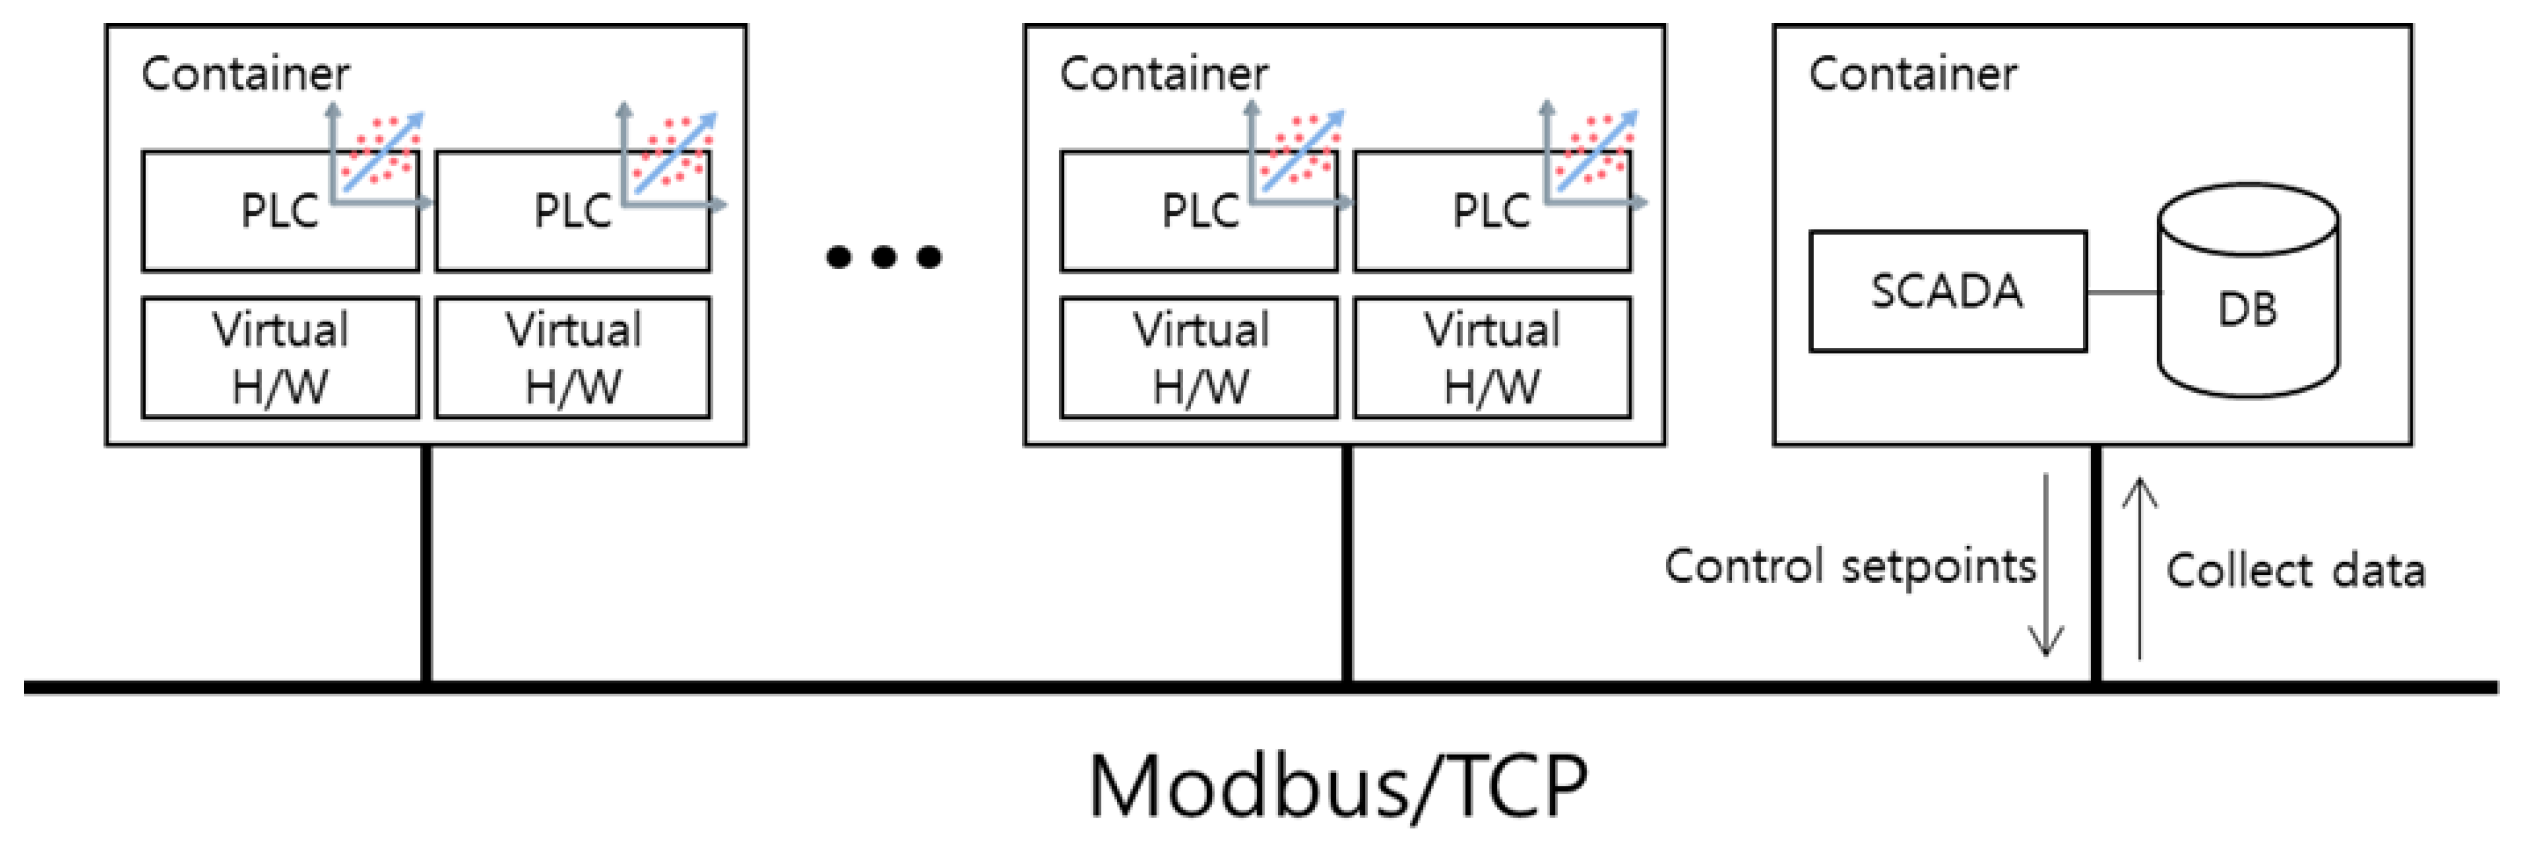
  • For a given original ICS dataset, we reproduce the ICS network environment where the dataset was collected with a virtualized container.
  • Each container contains a PLC or SCADA, and the control logic of the PLC is regressed from the given ICS dataset.
  • SCADA uses setpoints to control PLCs, and the values of setpoints are set probabilistically to ensure the randomness of the collected datasets.
The remainder of this paper is organized as follows. Section 2 presents research on actively used public ICS datasets and data generation. Section 3 describes the proposed simulated ICS environment architecture and data generation method. Section 4 presents experimental results, including a comparison of the similarity between the original and generated datasets. A summary of the proposal, limitations, and future work are discussed in Section 5 and Section 6.

2. Related Work

In this section, we present the work related to our proposal. Section 2.1 introduces datasets popularly used in data-driven ICS research. Section 2.2 describes previously proposed machine learning-based data generation methods.

2.1. Public Datasets for ICS

SWaT [3] is an ICS test bed for large-scale modern water treatment systems. This test bed aims to design a secure cyber–physical system and is designed to be similar to a full-scale system. This system consists of six processes (P1–6): raw water intake (P1), chemical disinfection (P2), ultrafiltration (P3), dichlorination using ultraviolet lamps (P4), purification by reverse osmosis (P5), and ultrafiltration membrane backwash and cleaning (P6). The SWaT dataset was collected for the purpose of studying cyber- and physical attacks on these processes. This dataset consists of physical datasets such as network packet data and sensor/PLC data, and we are interested in physical datasets. SWaT’s physical dataset has 51 features and contains 946,772 samples.
HAI [4] is a dataset collected from a test bed that implements a steam-turbine power generation and pumped storage hydropower system. This test bed consists of four main processes (P1–P4): boiler process (P1), turbine process (P2), water-treatment process (P3), and hardware-in-the-loop simulator (P4). This dataset was also collected to study cyberattacks in ICS environments. The most recently collected dataset has 86 features and contains 1,365,500 samples.
The five datasets presented by [11,12,13,14] are other datasets frequently employed in ICS research. These datasets were collected from power, gas pipeline, and energy management systems. They are also used, like the other two datasets described above, to study cyberattacks against ICS.

2.2. Synthetic Data Generation

Artificial data generation is a technique that creates data that are statistically similar to actual data collected in a real-world environment. This technique is frequently used in research where data collection is limited or privacy must be considered. Tushar et al. [15] generated stochastic data from a smart grid for solar generation. The study divided the state of solar irradiance, which changes randomly throughout the day, into four categories. Then, the authors modeled transitions between states using a segmented first-order Markov chain and generated data from the learned model. Iftikhar et al. [16,17] proposed a data generation method that reflects statistical characteristics such as trends and patterns. The study used a moving average to control periodic variations such as morning/evening peak and predicted energy consumption data using a periodic autoregressive (PAR) model. Zhang et al. [18] designed a GAN model to generate data for a smart grid. In order to effectively process time series data, the study introduced two distinct statistical characteristics: ‘level’, which is responsible for the mean and scale of the data, and ‘pattern’, which reflects individual activity. Zheng et al. [19] studied the generation of time series data by the phasor measurement unit (PMU) in the power system. A GAN was used to learn the underlying physical model that affects the internal relationships of data. While many studies adopted GANs for data generation, Razghandi et al. [20] proposed a model combining a VAE and a GAN to generate smart home synthetic time series data. The model learns the distribution of various data types in a smart home without prior knowledge and generates plausible samples. Additionally, by introducing a VAE, the mode collapse problem, a common problem of GANs, was improved.
Due to its nature, research on medical data always involves patient privacy concerns. To solve this problem, synthetic data can be used instead of actual patient data. Esteban et al. [21] proposed a GAN-based medical data generation model to publish data without privacy concerns. Simulation-based medical training is frequently employed, but its configuration usually relies on hand-engineered rules. The study used a data generation model to reproduce a variety of realistic intensive care unit (ICU) situations. Dahmen et al. [22] proposed a method of generating synthetic sensor data that reflect human behavior using a hidden Markov model (HMM). The authors introduced similarity measures to compare and verify real data and synthetic data.
Additionally, accuracy was improved using the data generated for semisupervised activity recognition, where only a small amount of annotated data was available. Imtiaz et al. [23] created smart healthcare records using a boundary-seeking GAN (BGAN). The study collected real-world smart healthcare data from geographically separated users and augmented the data to represent diversity in nutritional/behavioral patterns. Using this dataset and a GAN, the authors generated time series data containing categorical and numerical values.

2.3. Dynamic Time Warping

Dynamic time warping (DTW) is a versatile algorithm designed for measuring the similarity between two time series sequences that may vary in terms of time or exhibit temporal distortions. It was originally introduced by Berndt [24]. DTW is particularly valuable in scenarios where a simple linear alignment between two sequences may not capture their inherent similarity due to differences in speed, time delays, or distortions.
DTW operates through a dynamic programming approach, where it aligns two time series sequences by finding the optimal warping path. The algorithm minimizes the distance between corresponding points along the sequences, allowing for nonlinear mappings. This dynamic programming approach makes DTW robust in capturing complex relationships between sequences.
DTW has been applied across various domains due to its ability to handle time series data with irregularities. Some no applications include the following:
  • Speech recognition: DTW can be used to compare spoken words, accounting for variations in speaking rates.
  • Gesture recognition: in analyzing motion data, DTW aids in recognizing gestures even if they are performed at different speeds.
  • Biomedical signal processing: DTW is employed to compare biomedical signals like electrocardiograms (ECG) or DNA sequences.
  • Pattern recognition: DTW helps in recognizing patterns in sequences with variable lengths, such as handwriting recognition.
In summary, DTW stands as a fundamental algorithm in time series analysis, offering a flexible approach for comparing sequences in various domains. Its ability to account for temporal distortions makes it a valuable tool in scenarios where traditional distance metrics may fall short. The ongoing research on DTW continues to explore its limitations, refine its efficiency, and uncover new applications, solidifying its role in the broader landscape of time series analysis.

3. Proposal

In this section, we describe a simulation architecture that reproduces the original ICS environment from which a given ICS dataset was collected and a method for generating data from it. Section 3.1 introduces an overview of the ICS simulation environment built entirely in software. Section 3.2 presents a method to mimic the behavior of the control logic of the original PLC involved in a given dataset. Finally, in Section 3.3, we present a method to control newly generated synthetic data and provide randomness simultaneously.

3.1. Overview

Leave a space of one line before and after a figure or an image, i.e., one line between the main text and the top of the figure or image, and one line between the bottom of the figure or image and the caption. The caption has a default space of 12 pt after it so the main text can continue below the caption. If no text follows the figure caption, do not leave any space between the caption and the next headline (the headline has a default space).
Figure 1 shows the architecture for the proposed simulated ICS environment. We employ virtualized containers to simulate the ICS environment entirely in software, without special hardware devices such as PLCs or sensors. One container contains the SCADA system and a database to collect and store the data generated. The remaining containers contain one or more PLCs, each operating on a virtualized hardware layer. To faithfully mimic a real ICS network, all containers are connected via a Modbus/TCP protocol.

3.1.1. Containers for SCADA System

A typical ICS environment includes SCADA to control the system, HMI for monitoring, and a historian server to collect data. To reduce architecture complexity and simplify environment construction, we included the above functions into a single SCADA system and connected a database to store the collected data. We can obtain a synthetic dataset by exporting and refining this database. PLCs can also request control signals (setpoints) according to programmed logic. This SCADA system manually sets setpoints or generates them probabilistically and transmits them to PLCs.

3.1.2. Containers for PLCs

These containers contain PLCs. In an actual PLC, it receives status signals from various connected sensors and outputs signals to control devices such as valves or actuators. However, we introduce a virtualized hardware layer to avoid using hardware devices. The virtualized hardware layer imitates sensors or controlled devices in software. In other words, the container’s PLCs periodically scan the sensor signals of the virtualized hardware layer and produce control signals according to logic. One thing that needs to be pointed out is the control logic installed in PLCs. We do not have access to the control logic of the actual PLC that produced the SWaT [3] or HAI datasets [4]. Therefore, we reproduce control logic that performs the same or similar actions from the publicly available ICS dataset in a data-driven manner.

3.2. Reproducing Control Logic for PLCs

PLCs are equipped with control logic written in programming languages such as ladder or structured text (ST). The SWaT [3] and HAI datasets [4] were collected from a network of multiple PLCs. If we can obtain the control logic of these PLCs, we can build a simulated ICS environment relatively easily. Additionally, by randomly generating data, our method has the advantages of overcoming privacy protection issues and making testing more active. Unfortunately, publishers of these datasets do not provide the specific control logic of the PLCs, creating a challenge for replicating the ICS environment. To overcome this limitation, we employ an abductive inference approach, leveraging the input and output tags specified in technical details and the publicly available ICS datasets.
In our previous experiments, a significant correlation was observed between the input and output signals of PLCs in SWaT or HAI test beds. This correlation forms the basis for our abductive inference, allowing us to express the relationship between input and output signals through a simple linear regression model. The model, trained using the traditional least square method, accurately reproduces the behavior of the PLCs in a data-driven manner.
According to our previous experiments, a high correlation was observed between the input and output of PLCs in SWaT or HAI test beds. That means we can express the relationship between input and output signals through simple linear regression.
y i = j = 1 p w j i x j + w 0 i
Here, y i is the i ( 1 , , n ) th output signal of the PLC with n outputs. x j and w j i are each the j ( 1 , , p ) th input of the PLC and its weight. Linear regression models are trained with the traditional least square method (LSM). We write a linear regression model learned with ST or ladder logic into the PLC’s control logic. The logic of the PLC reproduced in this way behaves equivalently to the PLC of SWaT or HAI.

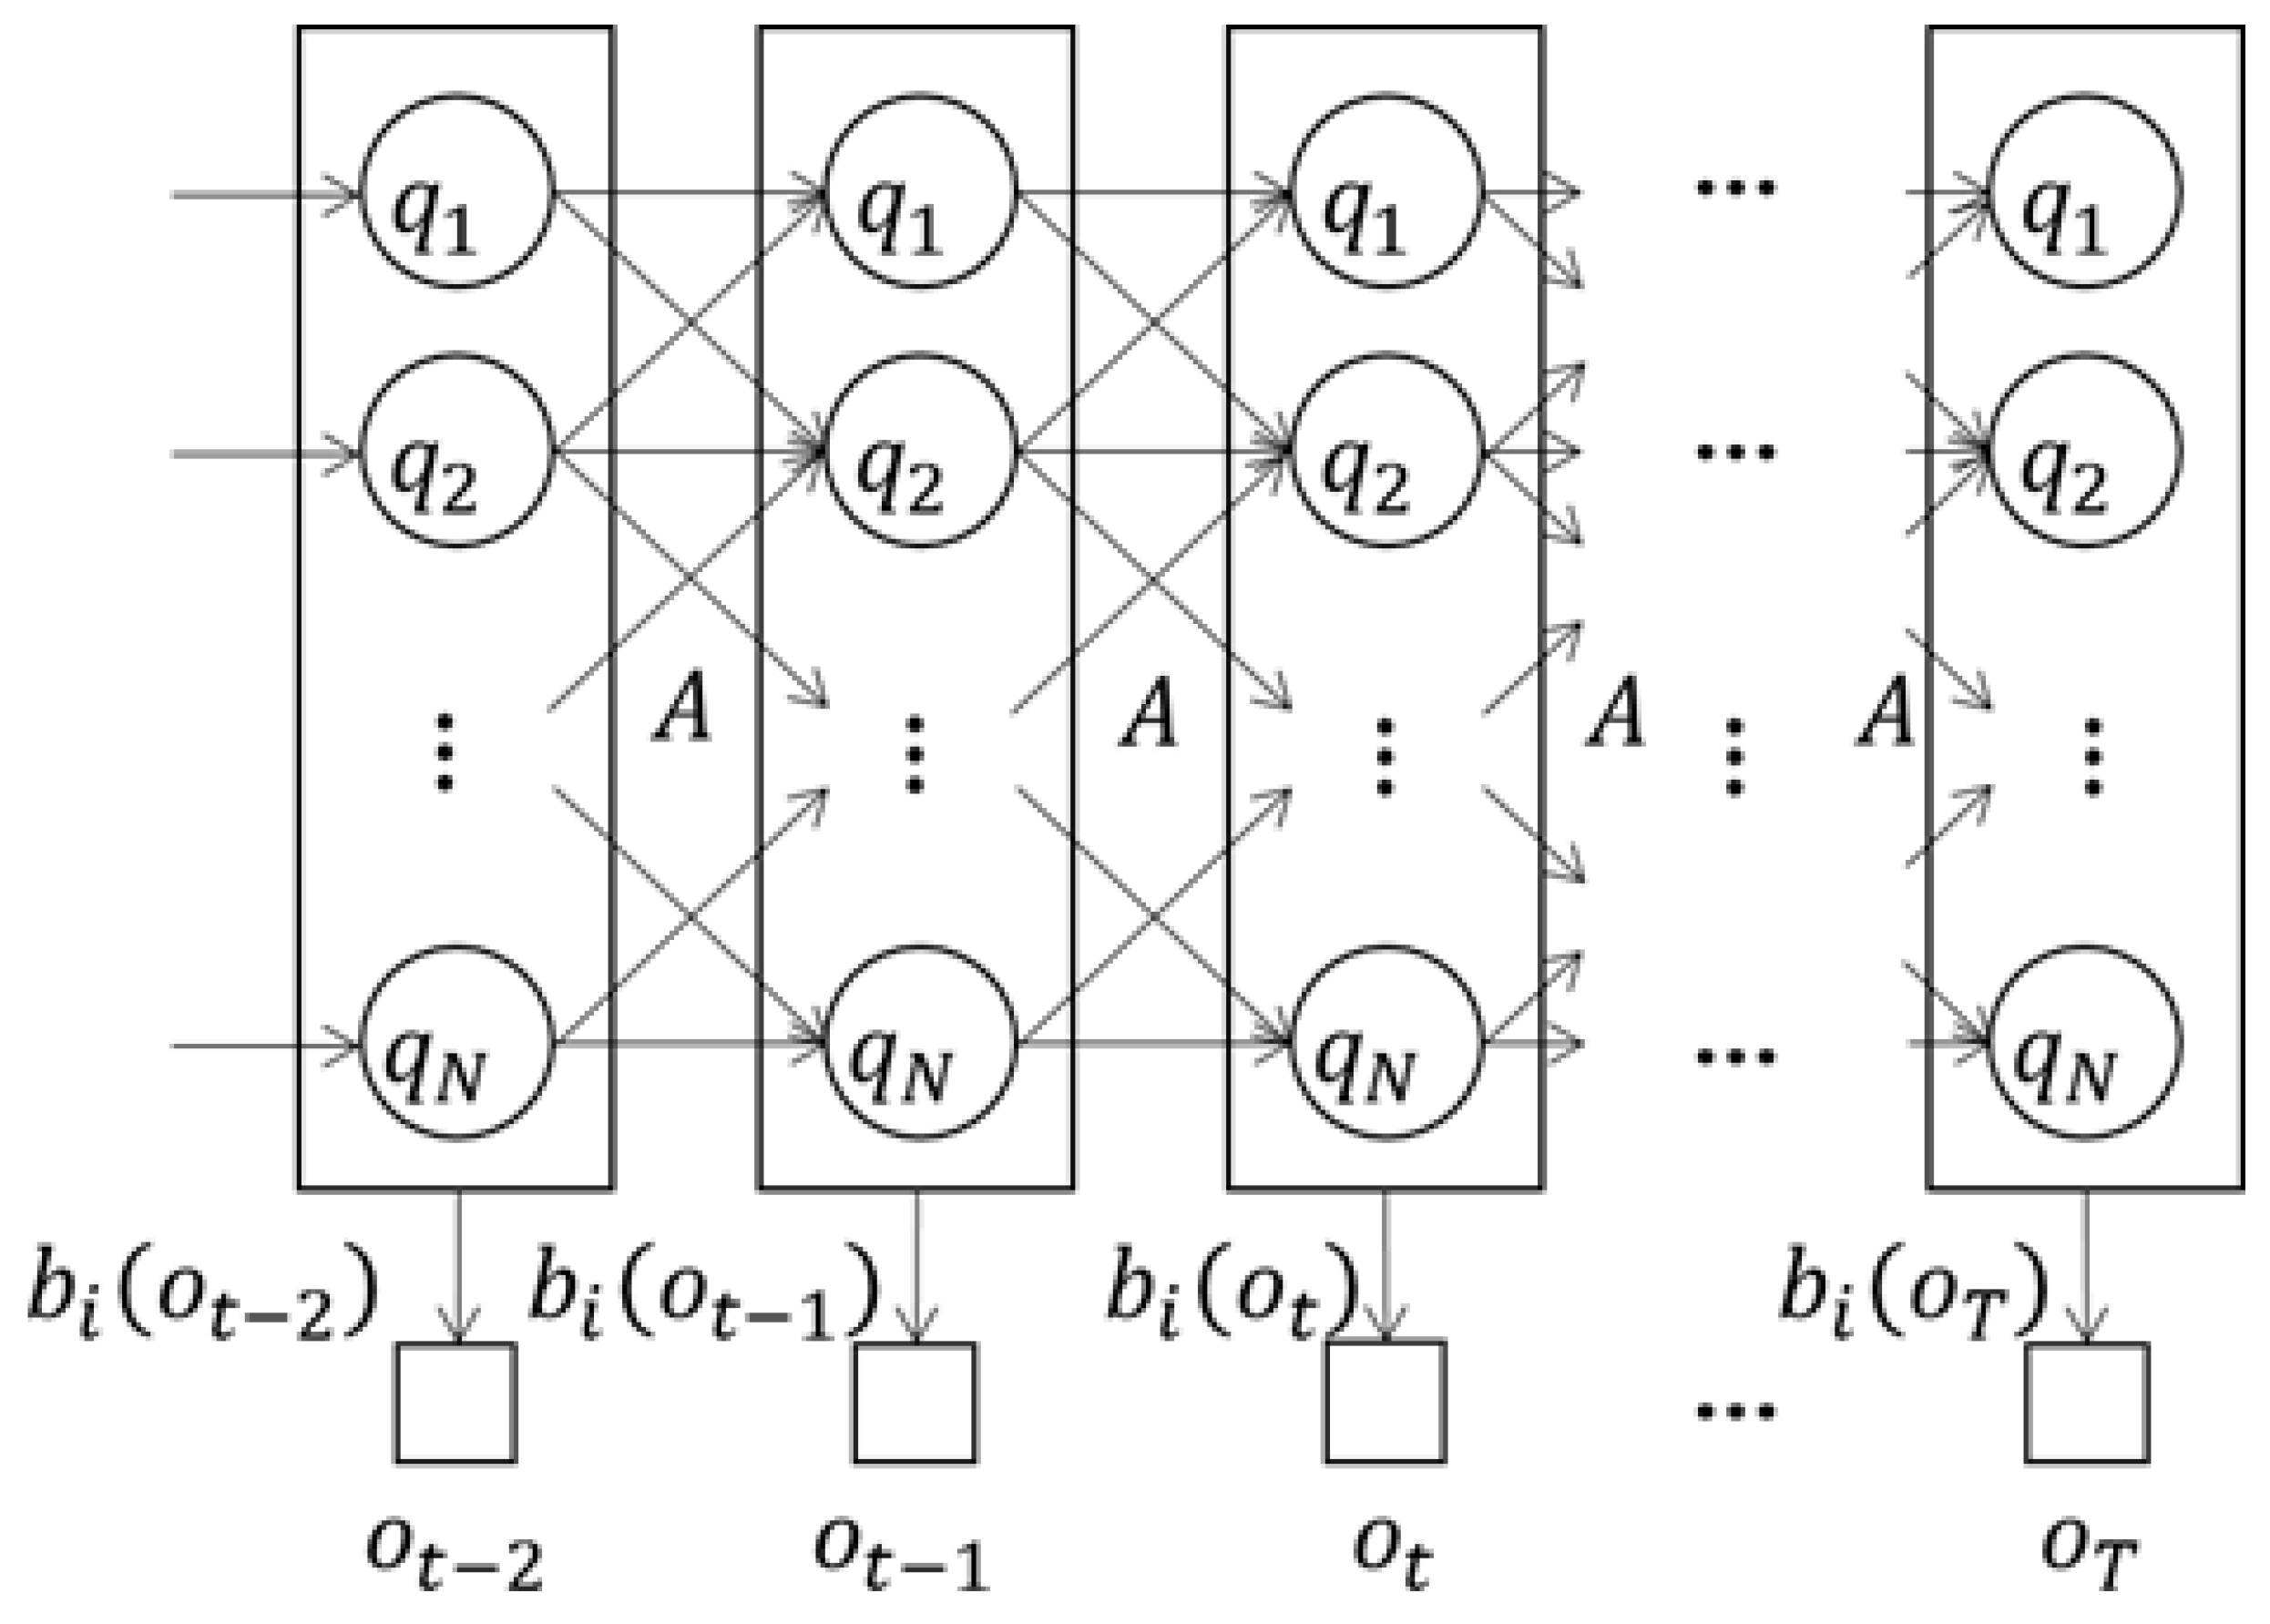
3.3. Hidden Markov Model for Setpoint Generation

In simulating the stochastic generation of setpoints, we employ a hidden Markov model (HMM) to capture the temporal characteristics of the control system. The HMM is parameterized by λ = ( A , B ) , where A is the transition probability matrix between hidden states, and B is the emission probability. The elements of A represent the probabilities of transitioning between different states, while B models the probabilities of emitting specific setpoint values from each state.
The learning process of the HMM parameters (A and B) is facilitated by the Baum–Welch algorithm, an expectation-maximization (EM) algorithm. This iterative algorithm allows us to estimate the parameters based on observed data, refining the model’s representation of the underlying system.
The forward and backward probabilities, represented by α t ( j ) and β t ( j ) , respectively, play a crucial role in the learning process. These probabilities are calculated recursively, utilizing dynamic programming for efficient computation. By applying the Baum–Welch algorithm, we obtain the optimal parameters for the HMM model, enabling us to stochastically generate artificial setpoint values that exhibit time series characteristics.
Algorithm 1 outlines the steps involved in learning the HMM model for PLC setpoint generation using the Baum–Welch algorithm. This algorithm is a type of expectation-maximization (EM) algorithm, and as a learning result, we obtain σ = ( A , B ) , the parameter of the HMM model.
With the learned HMM model λ = ( A , B ) , we probabilistically generate artificial setpoint values. First, the initial state Q 1 is drawn from the probability distribution Π for the initial state. Once the initial state is determined, a new setpoint o 1 is sampled from the emission distribution for that state. We use a Gaussian distribution as the emission distribution, as mentioned above. Then, the next state, Q 2 , is determined using the potential probability matrix A. o 2 is generated from the emission distribution for Q 2 . Repeating the above process creates as many setpoint values as necessary. Once this setpoint is set in the SCADA system, it is passed to the PLC to simulate the ICS environment. Algorithm 2 is an algorithm for creating an artificial setpoint.
Algorithm 1 Baum-Welch algorithm for training HMM model on setpoint in PLC
1:
Inputs:
2:
   The number of states N
3:
   Initialize Π = ( π 1 , π 2 , . . . , π N )
4:
   Initialize λ = ( A , B )
5:
repeat
6:
    E-step:
7:
       Initialize a 1 ( j ) = 0 j N
8:
       Initialize β T ( j ) = 1 j N
9:
    for  t = 2 to T do
10:
            α t ( j ) = i = 1 N α t 1 ( i ) a i , j b j ( o t )
11:
    end for
12:
    for  t = T 1 down to 1 do
13:
            β t ( i ) = j = 1 N a i , j b j ( o t + 1 ) β t + 1 ( j )
14:
    end for
15:
       Calculate γ t ( i , j ) = α t ( i ) β t ( j ) i = 1 N α t ( i ) β t ( i )
16:
       Calculate ξ t ( i , j ) = α t ( i ) a i , j b j ( o t + 1 ) β t + 1 ( j ) i = 1 N α t ( i ) β t ( i )
17:
    M-step:
18:
       Update a i , j
19:
       Update b j ( o )
20:
until convergence criterion is met
Algorithm 2 Generate Setpoint using Gaussian distribution
1:
Initialize:
2:
   Π (Initial state probability distribution)
3:
  A (Potential probability transition matrix)
4:
   μ (Emission distribution means vector)
5:
   σ (Emission distribution standard deviations vector)
6:
Sample initial state Q 1 Π
7:
Set t = 1 (current timestep)
8:
while  t T   do
9:
      Sample setpoint o t N ( μ Q t , σ Q t ) (Gaussian emission distribution)
10:
    Sample next state Q t + 1 A Q t , · (Transition probability based on current state)
11:
     t t + 1
12:
end while
13:
Return { o 1 , o 2 , . . . , o T } (Generated setpoint sequence)
For instance, let us consider a hypothetical PLC in a water treatment system. The HMM model, as illustrated in Figure 2, could represent different states such as ‘Normal Operation’, ‘Low Flow,’ or ‘High Contaminant Levels’. Figure 2 illustrates an HMM model for the setpoint of an arbitrary PLC. We assume that the setpoint of the PLC is emitted from N hidden states, denoted as Q = { q 1 , q 2 , , q N } , and observed as a sequence of observations O = o 1 o 2 o T . Our HMM model is parameterized as λ = ( A , B ) . Here, A = a 11 a 12 a i j a N N is the transition probability matrix between states, and B = b 1 ( o 1 ) b i ( o t ) b N ( o T ) is the emission probability. The element a i j of A is the probability of transition from state q i to q j . The element b i ( o t ) of B is the probability that the setpoint value o t comes from state q i . We assume the emission probability b i ( o t ) to be Gaussian-distributed. That is, state q i is defined by mean μ i R and standard deviation σ i R . Then, based on this definition, we define forward probability α t ( j ) and backward probability β t ( j ) (Equations (2) and (3)).
α t ( j ) = P ( o 1 , o 2 , , o t , Q t = q i | λ ) = i = 1 N α t 1 ( i ) × a i j × b j ( o t )
β t ( j ) = P ( o t + 1 , o t + 2 , , o T , Q t = q j | λ ) = i = 1 N a i j × b j ( o t + 1 ) × β t + 1 ( j )
Forward probability α t ( j ) is the probability of observing the first t setpoints and being in a specific state q j . Backward probability β t ( j ) , on the other hand, is the probability of observing T t + 1 setpoints starting from timestep t + 1 , assuming that the system is in state q j at timestep t. As expressed in Equations (2) and (3), obviously, α 1 ( j ) and β T ( j ) are defined recursively, and dynamic programming is used for efficient calculation. At this time, α 1 ( j ) and β T ( j ) are defined as π j × b j ( o 1 ) and 1, respectively, and ( π = ( π 1 π 2 π N ) is the probability for the initial state. Based on the above definition, we learn the HMM model for the PLC’s setpoint using the standard Baum–Welch algorithm. This Algorithm 1 is a type of expectation-maximization (EM) algorithm, and as a learning result, we obtain σ = ( A , B ) , the parameter of the HMM model.

4. Evaluation of Simulated ICS

A fully software-simulated ICS environment is proposed in Section 3. In this section, we use artificial ICS data with the simulated ICS proposed in Section 3 and compare them with the benchmark ICS dataset. Section 4.1 describes details about building a simulated ICS environment. Section 4.2 describes the benchmark ICS dataset used in the evaluation. Finally, in Section 4.3, we conduct a multifaceted comparative analysis of the benchmark dataset and the data generated from the simulated ICS.

4.1. Implementation

The simulated ICS environment proposed in Section 3 consists of several containers. Each container is a lightweight software package that contains everything needed to run an application, including code, system tools, libraries, and runtime. Containers are isolated from the host operating system and other containers running on the same host, providing a secure and consistent application runtime environment. Among several popular container software programs, we used Docker [25] to configure a simulated ICS environment. Each container contains a PLC or SCADA system. We used OpenPLC [26] to implement PLC and adopted ScadaBR [27] for SCADA. OpenPLC is an open-source programmable logic controller that can be used to control various industrial processes. OpenPLC supports several hardware devices to drive PLC logic, such as Arduino [28] or Raspberry Pi [29], among which we used the Python submodule. ScadaBR is an open-source SCADA system that can be used to monitor and control industrial processes.
The PLC of the simulated ICS includes a linear regression model learned in the manner described in Section 3.2. This model was implemented in ST or ladder logic. SCADA monitors the PLC’s variable values and controls the PLC by setting setpoints. Setpoints have values artificially generated by the HMM model, as described in Section 3.3. An important note is that since control systems typically operate for very long periods, numerical issues can easily arise during calculating the HMM model (i.e., floating-point over/under-flow). To solve this problem, we calculated the probability values that appear in the calculation process in log space and scaled the forward/backward probability at each timestep.

4.2. Experimental Results

This section presents the rigorous evaluation of our data-driven ICS network simulation framework, designed to assess its effectiveness in generating realistic synthetic data. We conducted comprehensive experiments utilizing the SWaT dataset, a meticulously curated resource capturing network traffic from a real-world ICS network consisting of 51 sensors and actuators over 11 days. The dataset’s meticulous annotation with ground truth labels, differentiating normal and abnormal system behavior, served as a valuable benchmark for measuring the fidelity and effectiveness of our synthetic-data-generation approach.

4.2.1. Model Creation

To comprehensively evaluate the performance of our simulated ICS environment, we created several dedicated models leveraging the SWaT dataset. These models, designated P1-CC, P1-FC, P1-TC, P1-PC, and P2-SC, were specifically tailored to replicate the behavior of distinct processes and components within the real-world ICS network captured by the SWaT dataset. This model-based approach ensured focused evaluation of the simulation’s ability to accurately reproduce the nuanced behavior of individual network elements.

4.2.2. Evaluation Metrics

To rigorously assess the quality of the synthetic data generated by our simulation, we employed a multifaceted approach encompassing quantitative metrics and temporal analysis. Our primary evaluation indicators included the following:
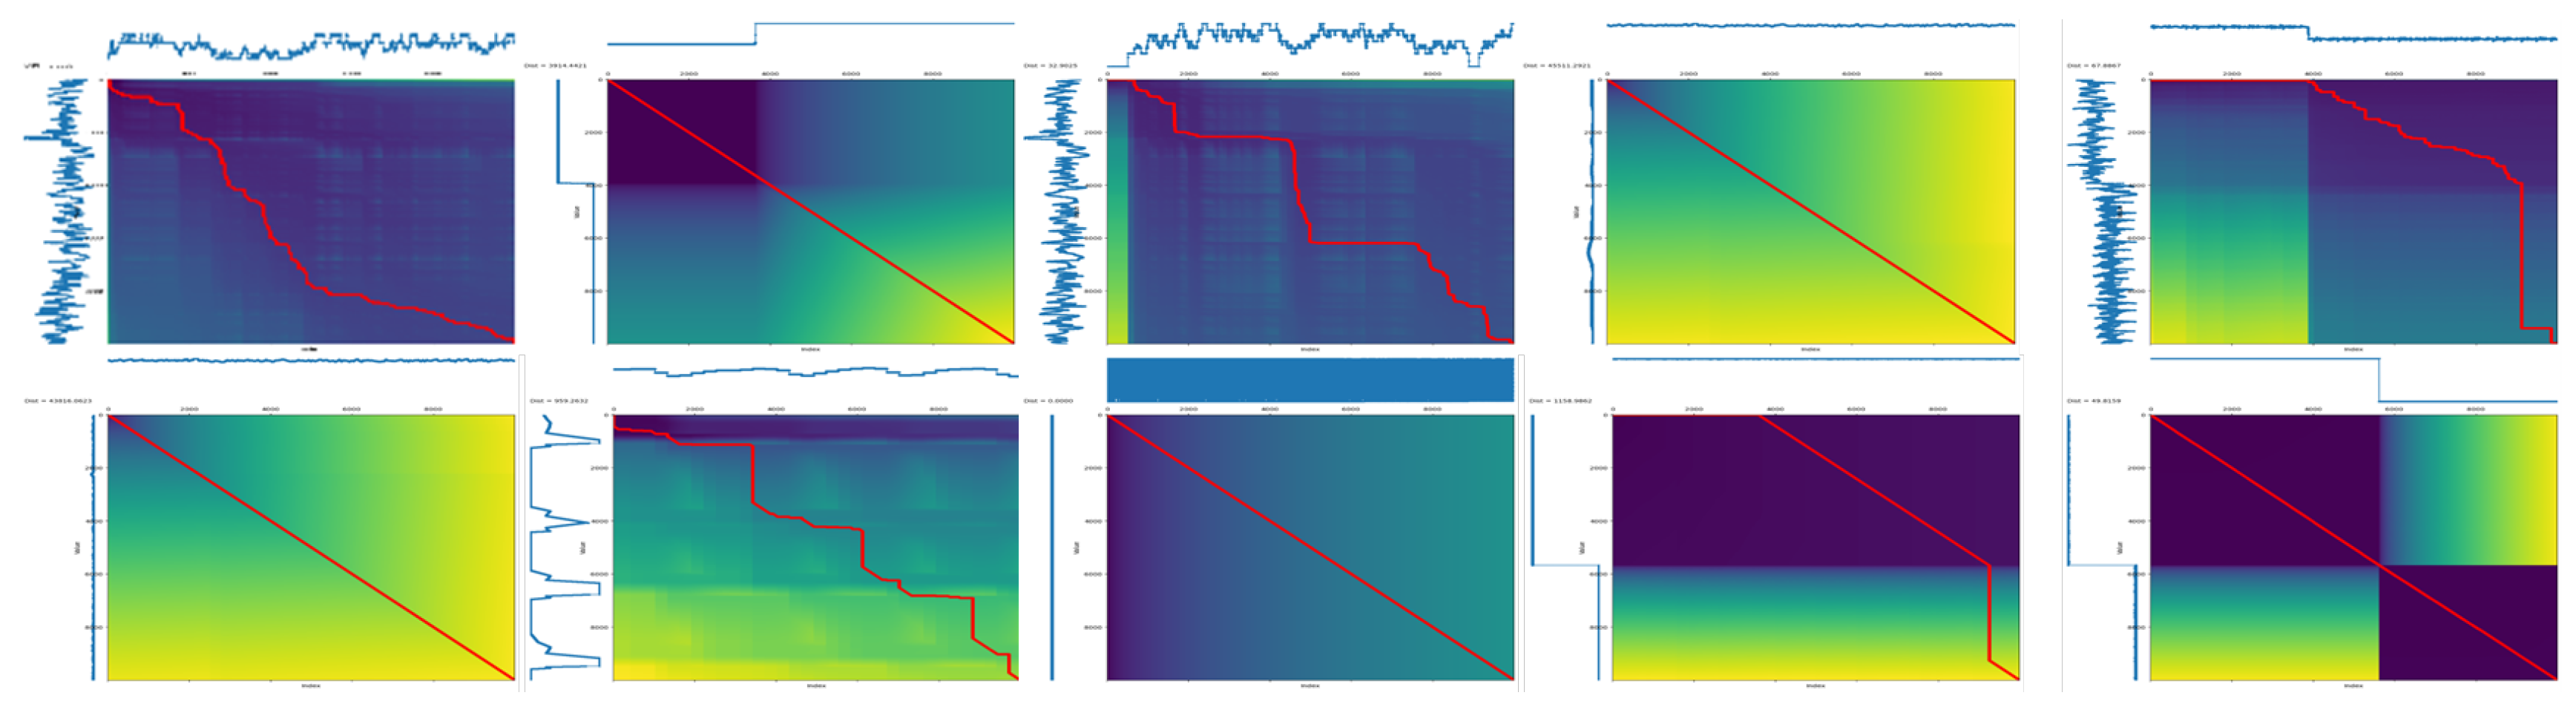
  • Dynamic time warping (DTW): This powerful technique measures the similarity between two time series sequences, accounting for temporal distortions and misalignments. We utilized DTW to compare the temporal patterns and dynamics between the generated synthetic data and the benchmark SWaT dataset, ensuring our simulation accurately captures the temporal aspects of real-world network traffic.
  • Statistical analysis: We further compared the statistical properties of the generated data with those of the SWaT dataset. This included analyzing key statistical moments such as mean, variance, and higher-order moments to validate that the synthetic data accurately reflect the overall statistical distribution of the real-world network traffic.

4.2.3. Analysis of Dynamic Time Warping (DTW)

Figure 3 presents the results of a dynamic time warping (DTW) analysis comparing the temporal patterns of our synthetically generated ICS network data with those of the benchmark SWaT dataset. DTW is a powerful technique for measuring the similarity between time series data, even when they exhibit temporal shifts or distortions. In this context, a lower DTW distance signifies a closer resemblance in the underlying temporal dynamics between the compared datasets.
Figure 3 and Table 1 display each generated model’s mean and variance values. The x axis represents the different models (P1-CC, P1-FC, P1-TC, P1-PC, and P2-SC), while the y axis represents the mean and variance values.
Our analysis reveals that the synthetic data generated by our proposed method demonstrate remarkable similarity to the real-world data captured in the SWaT dataset. As evident in the figure, the DTW distances between our synthetic data and the SWaT data for each model are consistently lower compared to other baseline approaches. This observation strongly suggests that our synthetic data faithfully reproduce the time-dependent characteristics of the real-world ICS network data.
This finding is significant for several reasons:
  • Validation of synthetic data generation: It confirms the effectiveness of our proposed method in generating realistic and representative synthetic ICS network data. This paves the way for its use in various research and development tasks related to ICS security analysis and anomaly detection.
  • Improved model performance: By providing realistic training data, our synthetic data can potentially lead to the development of more robust and generalizable models for anomaly detection and other tasks in the domain of ICS cybersecurity.
  • Reduced reliance on real-world data: The availability of accurate synthetic data can alleviate the dependence on scarce and sensitive real-world ICS network data for training and evaluation purposes. This can be particularly beneficial for security-sensitive applications or situations where access to real-world data is limited.

4.2.4. Statistical Analysis

In addition to DTW analysis, we computed the mean and variance values of the synthetic data models and compared them to those of the benchmark SWaT dataset. These statistics provide insights into whether the synthetic data capture the central tendency and variability observed in the real-world ICS network data as follows:
  • Mean analysis: The mean values of the synthetic data models closely align with those of the benchmark dataset. This suggests that our simulation successfully replicates the central tendencies observed in the real-world ICS network data.
  • Variance analysis: Similarly, the variance values of the synthetic data models exhibit similarities to the benchmark dataset. The variance reflects the degree of data dispersion, and our synthetic data capture this dispersion effectively.
Overall, the results from the DTW analysis and the mean and variance analyses collectively demonstrate that our simulated ICS environment generates synthetic data that closely resemble the temporal and statistical characteristics of the benchmark SWaT dataset. This underscores the capability of our approach to produce realistic and data-driven synthetic ICS data. In conclusion, the experimental results validate the effectiveness of our data-driven ICS network simulation method for synthetic data generation. By replicating both the temporal patterns and statistical characteristics of real-world ICS network data, our approach provides a valuable resource for researchers in the field of ICS optimization, security, and data-driven studies.

4.3. Computational Complexity Analysis

In this section, we provide a detailed analysis of the computational complexity of our proposed simulation architecture, which involves recreating the entire ICS environment in software and autonomously generating control logic from existing data.

4.3.1. ICS Environment Recreation

The computational complexity of simulating the ICS environment predominantly lies in the virtualization of containers and the establishment of communication protocols to mimic real-world scenarios. The use of virtualized containers ensures the absence of physical hardware, but it introduces computational overhead. Specifically, the computational demands can be broken down into the following components:
  • Virtualized container operations: The creation, maintenance, and communication between virtualized containers introduce overhead, and the scalability of the simulation relies on the efficiency of these operations. Analyzing the time complexity of container-related tasks is crucial for understanding how the computational demands grow with the size and complexity of the simulated ICS environment.
  • Communication protocol overheads: Simulating the Modbus/TCP protocol for intercontainer communication adds another layer of complexity. Understanding the computational demands of encoding, transmitting, and decoding messages within the simulated environment provides insights into the scalability and efficiency of our approach.

4.3.2. Autonomous Control Logic Generation

The computational complexity of autonomously generating control logic from existing data involves various stages, each contributing to the overall demands of the approach, as follows:
  • Abductive inference: The correlation analysis between input and output signals and subsequent application of linear regression introduce computational complexities. The time complexity of abductive inference relies on the size of the dataset and the efficiency of linear regression algorithms.
  • Hidden Markov model learning: The Baum–Welch algorithm used for learning the parameters of the hidden Markov model (HMM) contributes to computational demands. Analyzing the time complexity of the Baum–Welch algorithm provides insights into the efficiency of our setpoint generation approach.
  • Reflection on computational efficiency: While our proposed approach offers a comprehensive simulation architecture for ICS environments, it is essential to acknowledge the computational demands associated with the virtualization of containers, communication protocol simulation, and autonomous generation of control logic. The scalability of our approach depends on the efficiency of container management, communication protocol emulation, and algorithms employed for abductive inference and HMM learning.
Efforts to optimize these computational aspects, potentially through parallelization, algorithmic enhancements, or leveraging hardware acceleration, could further improve the efficiency of our simulation architecture. Additionally, considering the potential computational overhead in large-scale scenarios is crucial for practical applications and system integration.
In conclusion, a nuanced understanding of the computational complexity associated with our proposed approach provides valuable insights into its scalability and efficiency. Ongoing efforts to optimize these computational aspects will contribute to the practicality and applicability of our simulation architecture in real-world ICS scenarios.

5. Conclusions

In conclusion, this paper presented a novel data-driven method for generating realistic synthetic data for industrial control system (ICS) networks. This approach eliminates the need for expensive hardware by simulating the entire ICS environment using software. We replicated the control logic of PLCs based on existing data and employed stochastic setpoint generation to introduce natural variability into the collected data. This simulated environment, built on virtualized containers, mimics the behavior of real ICS components like PLCs and SCADA systems, ensuring the generated data’s fidelity to real-world scenarios.
Our experiments validated the effectiveness of our approach, demonstrating the generated data’s close resemblance to actual ICS network characteristics. Comparisons with benchmark datasets confirmed the similarity in key statistical properties, such as mean and variance. This success paves the way for utilizing our synthetic data in various kinds of data-driven ICS research studies, including optimization and security studies.
Our work offers a valuable solution to the challenges of cost, hardware, and control logic complexity in ICS data generation. This software-based method empowers researchers to access diverse and realistic datasets, ultimately contributing to advancements in ICS research and improved system optimization and security.

6. Discussion and Future Work

In this section, we delve into the limitations of our current study and propose potential avenues for future research to enhance the understanding and applicability of our simulation architecture.

6.1. Limitations

While our simulation architecture presents a novel approach to reproducing ICS environments and generating synthetic datasets, several limitations should be acknowledged:
  • Lack of real-world control logic: The inability to access the actual control logic from the PLCs in datasets like SWaT or HAI poses a significant challenge. Our abductive inference method relies on correlations between input and output signals, and although effective, it may not capture the intricate details of the original control logic. Future research could explore methods to directly obtain or approximate the control logic to improve the fidelity of the simulated environment.
  • Assumed linearity in control logic inference: Our current approach employs simple linear regression for control logic inference, assuming a linear relationship between input and output signals. This assumption may not hold in all scenarios, particularly when dealing with complex control systems. Future work could investigate more sophisticated machine learning models to capture nonlinear relationships and enhance the accuracy of control logic replication.
  • Stochastic setpoint generation complexity: While our stochastic setpoint generation using hidden Markov models (HMMs) is effective, the chosen model might oversimplify the complexity of real-world systems. Future research could explore alternative probabilistic modeling approaches, such as Bayesian networks or recurrent neural networks, to better capture the dynamic nature of setpoints in ICS environments.
  • Limited validation metrics: Our evaluation of the simulated ICS environment primarily relies on qualitative comparisons and synthetic dataset generation. Introducing quantitative metrics and validation methodologies, such as comparing statistical properties of the simulated and real datasets, would strengthen the reliability of our simulation architecture.

6.2. Future Research Directions

Building upon the identified limitations, several promising directions for future research emerge:
  • Enhanced control logic inference: Investigate methods to enhance the fidelity of control logic inference, potentially exploring machine learning techniques that can generalize complex relationships from limited data. Access to more comprehensive datasets with detailed control logic information would be invaluable for improving the accuracy of control logic replication.
  • Advanced probabilistic setpoint modeling: Explore advanced probabilistic modeling techniques beyond HMMs for setpoint generation. Bayesian methods or deep learning approaches could offer more nuanced representations of the temporal characteristics of ICS setpoints, allowing for a more realistic simulation.
  • Dynamic adjustment of simulation parameters: Develop mechanisms for dynamically adjusting simulation parameters based on the evolving nature of ICS environments. Incorporating adaptive learning algorithms could enable the simulation architecture to continuously improve its accuracy and adapt to changes in control logic or setpoint patterns.
  • Security and anomaly injection: Integrate security-related features into the simulation architecture, allowing researchers and practitioners to test the resilience of ICS systems against cyberthreats. Additionally, explore methods to inject realistic anomalies into the simulated environment to evaluate the robustness of detection mechanisms.
  • Collaborative simulation frameworks: Investigate the development of collaborative simulation frameworks that allow multiple entities to contribute to the creation and improvement of simulated ICS environments. This collaborative approach could lead to more diverse and representative datasets, benefiting the entire research community.

Author Contributions

Conceptualization, M.K., S.J., J.C. and S.G.; methodology, M.K., S.J., J.C. and S.G.; software, M.K., S.J., J.C. and S.G.; formal analysis, M.K., S.J., J.C. and S.G.; investigation, M.K., S.J., J.C. and S.G.; resources, M.K., S.J., J.C. and S.G.; data curation, M.K., S.J., J.C. and S.G.; writing—original draft preparation, M.K., S.J., J.C. and S.G.; writing—review and editing, M.K., S.J., J.C. and S.G.; visualization, M.K., S.J., J.C. and S.G.; supervision, M.K., S.J., J.C. and S.G.; project administration, M.K., S.J., J.C. and S.G.; funding acquisition, M.K., S.J., J.C. and S.G. All authors have read and agreed to the published version of the manuscript.

Funding

This work was supported by the Technology Innovation Program Development Program-Development of Industrial Technology for Electronic Components (20018637, Research on constructing a data tree for the federated learning of distributed industrial data) funded By the Ministry of Trade, Industry & Energy (MOTIE, Korea).

Institutional Review Board Statement

Not applicable.

Informed Consent Statement

Not applicable.

Data Availability Statement

The raw data supporting the conclusions of this article will be made available by the authors on request.

Conflicts of Interest

The authors declare no conflicts of interest.

Abbreviations

The following abbreviations are used in this manuscript:
ICSIndustrial control system
SCADASupervisory control and data acquisition
DCSDistributed control system
PLCProgrammable logic controller
HMIHuman–machine interface
GANGenerative adversarial network
VAEVariational autoencoder
PARPeriodic autoregressive
PMUPhasor measurement unit
HMMHidden Markov model
BGANBoundary-seeking GAN
STStructured text
LSMLeast square method
ARAutoregressive
MAMoving average
ARIMAAutoregressive integrated moving average

References

  1. Subramanian, D.; Murali, P.; Zhou, N.; Ma, X.; Da Silva, G.C.; Pavuluri, R.; Kalagnanam, J. A prediction-optimization framework for site-wide process optimization. In Proceedings of the 2019 IEEE International Congress on Internet of Things, ICIOT 2019—Part of the 2019 IEEE World Congress on Services, Milan, Italy, 8–13 July 2019. [Google Scholar] [CrossRef]
  2. Min, Q.; Lu, Y.; Liu, Z.; Su, C.; Wang, B. Machine Learning based Digital Twin Framework for Production Optimization in Petrochemical Industry. Int. J. Inf. Manag. 2019, 49, 502–519. [Google Scholar] [CrossRef]
  3. Mathur, A.P.; Tippenhauer, N.O. SWaT: A water treatment testbed for research and training on ICS security. In Proceedings of the 2016 International Workshop on Cyber-Physical Systems for Smart Water Networks, CySWater 2016, Vienna, Austria, 11 April 2016. [Google Scholar] [CrossRef]
  4. Shin, H.K.; Lee, W.; Yun, J.H.; Kim, H.C. HAI 1.0: HIL-based augmented ICS security dataset. In Proceedings of the CSET 2020—13th USENIX Workshop on Cyber Security Experimentation and Test, Co-Located with USENIX Security 2020, Virtual, 10 August 2020. [Google Scholar]
  5. Khraisat, A.; Gondal, I.; Vamplew, P.; Kamruzzaman, J. Survey of intrusion detection systems: Techniques, datasets and challenges. Cybersecurity 2019, 2, 1–22. [Google Scholar] [CrossRef]
  6. Craggs, B.; Rashid, A.; Hankin, C.; Antrobus, R.; Serban, O.; Thapen, N. A reference architecture for IIoT and industrial control systems testbeds. In Proceedings of the IET Conference Publications 2019, London, UK, 1–2 May 2019. [Google Scholar] [CrossRef]
  7. Ayodeji, A.; Liu, Y.K.; Chao, N.; Yang, L.Q. A new perspective towards the development of robust data-driven intrusion detection for industrial control systems. Nucl. Eng. Technol. 2020, 52, 2687–2698. [Google Scholar] [CrossRef]
  8. Ling, J.; Zhu, Z.; Luo, Y.; Wang, H. An intrusion detection method for industrial control systems based on bidirectional simple recurrent unit. Comput. Electr. Eng. 2021, 91, 107049. [Google Scholar] [CrossRef]
  9. Goodfellow, I.J.; Pouget-Abadie, J.; Mirza, M.; Xu, B.; Warde-Farley, D.; Ozair, S.; Courville, A.; Bengio, Y. Generative adversarial nets. In Proceedings of the Advances in Neural Information Processing Systems, Montreal, QC, Canada, 8–13 December 2014. [Google Scholar]
  10. Kingma, D.P.; Welling, M. Auto-encoding variational bayes. In Proceedings of the 2nd International Conference on Learning Representations, ICLR 2014—Conference Track Proceedings, Banff, AB, Canada, 14–16 April 2014. [Google Scholar]
  11. Beaver, J.M.; Borges-Hink, R.C.; Buckner, M.A. An evaluation of machine learning methods to detect malicious SCADA communications. In Proceedings of the 2013 12th International Conference on Machine Learning and Applications, ICMLA, Miami, FL, USA, 4–7 December 2013; Volume 2. [Google Scholar] [CrossRef]
  12. Tommy, M. Industrial Control System (ICS) Cyber Attack Datasets. Available online: https://sites.google.com/a/uah.edu/tommy-morris-uah/ics-data-sets (accessed on 20 January 2023).
  13. Morris, T.; Gao, W. Industrial control system traffic data sets for intrusion detection research. IFIP Advances in Information and Communication Technology 2014, 441, 65–78. [Google Scholar]
  14. Morris, T.H.; Thornton, Z.; Turnipseed, I. Industrial Control System Simulation and Data Logging for Intrusion Detection System Research. In Proceedings of the Seventh Annual Southeastern Cyber Security Summit, Huntsville, AL, USA, 3–4 June 2015. [Google Scholar]
  15. Tushar, W.; Huang, S.; Yuen, C.; Zhang, J.A.; Smith, D.B. Synthetic generation of solar States for smart grid: A multiple segment Markov chain approach. In Proceedings of the IEEE PES Innovative Smart Grid Technologies Conference Europe, Istanbul, Turkey, 12–15 October 2014. [Google Scholar] [CrossRef]
  16. Iftikhar, N.; Liu, X.; Nordbjerg, F.E.; Danalachi, S. A Prediction-Based Smart Meter Data Generator. In Proceedings of the NBiS 2016—19th International Conference on Network-Based Information Systems, Ostrava, Czech Republic, 7–9 September 2016. [Google Scholar] [CrossRef]
  17. Iftikhar, N.; Liu, X.; Danalachi, S.; Nordbjerg, F.E.; Vollesen, J.H. A Scalable Smart Meter Data Generator Using Spark. Lecture Notes in Computer Science (Including Subseries Lecture Notes in Artificial Intelligence and Lecture Notes in Bioinformatics); Springer: Cham, Switzerland, 2017; p. 10573. [Google Scholar]
  18. Zhang, C.; Kuppannagari, S.R.; Kannan, R.; Prasanna, V.K. Generative Adversarial Network for Synthetic Time Series Data Generation in Smart Grids. In Proceedings of the 2018 IEEE International Conference on Communications, Control, and Computing Technologies for Smart Grids, SmartGridComm, Aalborg, Denmark, 29–31 October 2018. [Google Scholar] [CrossRef]
  19. Zheng, X.; Wang, B.; Xie, L. Synthetic dynamic PMU data generation: A generative adversarial network approach. In Proceedings of the 2019 International Conference on Smart Grid Synchronized Measurements and Analytics, SGSMA, College Station, TX, USA, 21–23 May 2019. [Google Scholar] [CrossRef]
  20. Razghandi, M.; Zhou, H.; Erol-Kantarci, M.; Turgut, D. Variational Autoencoder Generative Adversarial Network for Synthetic Data Generation in Smart Home. arXiv 2022, arXiv:2201.07387v1. [Google Scholar]
  21. Esteban, C.; Hyl, S.L.; Rätsch, G. Real-valued (Medical) Time Series Generation with Recurrent Conditional GANs. arXiv 2017, arXiv:1706.02633v2. [Google Scholar]
  22. Dahmen, J.; Cook, D. SynSys: A synthetic data generation system for healthcare applications. Sensors 2019, 19, 1181. [Google Scholar] [CrossRef] [PubMed]
  23. Imtiaz, S.; Arsalan, M.; Vlassov, V.; Sadre, R. Synthetic and Private Smart Health Care Data Generation using GANs. In Proceedings of the International Conference on Computer Communications and Networks, ICCCN, Virtual, 19–22 July 2021. [Google Scholar] [CrossRef]
  24. Berndt, D.J.; Clifford, J. Using dynamic time warping to find patterns in time series. In Proceedings of the 3rd International Conference on Knowledge Discovery and Data Mining, Seattle, WA, USA, 31 July–1 August 1994. [Google Scholar]
  25. Docker, Inc. Available online: https://www.docker.com/ (accessed on 8 March 2023).
  26. Alves, T.; Morris, T. OpenPLC: An IEC 61,131–3 compliant open-source industrial controller for cyber security research. Comput. Secur. 2018, 78, 364–379. [Google Scholar] [CrossRef]
  27. SCADA-BR. Available online: https://www.scadabr.com.br/ (accessed on 8 March 2023).
  28. Arduino. Available online: https://www.arduino.cc/ (accessed on 9 March 2023).
  29. Raspberry Pi. Available online: https://www.raspberrypi.com/ (accessed on 9 March 2023).
Figure 1. Overview of simulated ICS architecture.
Electronics 13 01920 g001
Figure 2. Hidden Markov model for a setpoint of a PLC.
Electronics 13 01920 g002
Figure 3. Dynamic time warping (DTW) result.
Electronics 13 01920 g003
Table 1. Mean and variance values.
P1-CC (P1_PP04SP)P1-CC (P1_PP04)P1-FC (P1_B3005)P1-FC (P1_FCV03D)P1-TC (P1_B4022)P1-TC (P1_FCV01D)P2-SC (P2_AutoSD)P2-SC (P2_SCO)P1-PC (P1_B2016)P1-PC (P1_PCV01D)
Original mean27.41829.4993.21149.04430.97118.872113.98954,747.2541.10930.723
Predicted mean27.52824.0581010.99149.04330.95118.874118.05354,747.221.111472.913
Original variance0.061103.586912.6492.1430.435246.328116.1143216.6880.01311.322
Predicted variance0.084.018440.8151.340.446229.67194.3423215.4060.011107.278
Disclaimer/Publisher’s Note: The statements, opinions and data contained in all publications are solely those of the individual author(s) and contributor(s) and not of MDPI and/or the editor(s). MDPI and/or the editor(s) disclaim responsibility for any injury to people or property resulting from any ideas, methods, instructions or products referred to in the content.

