UNet-BiLSTM: A Deep Learning Method for Reconstructing Electrocardiography from Photoplethysmography
Abstract
1. Introduction
2. Materials and Methods
2.1. Dataset
2.2. Preprocessing
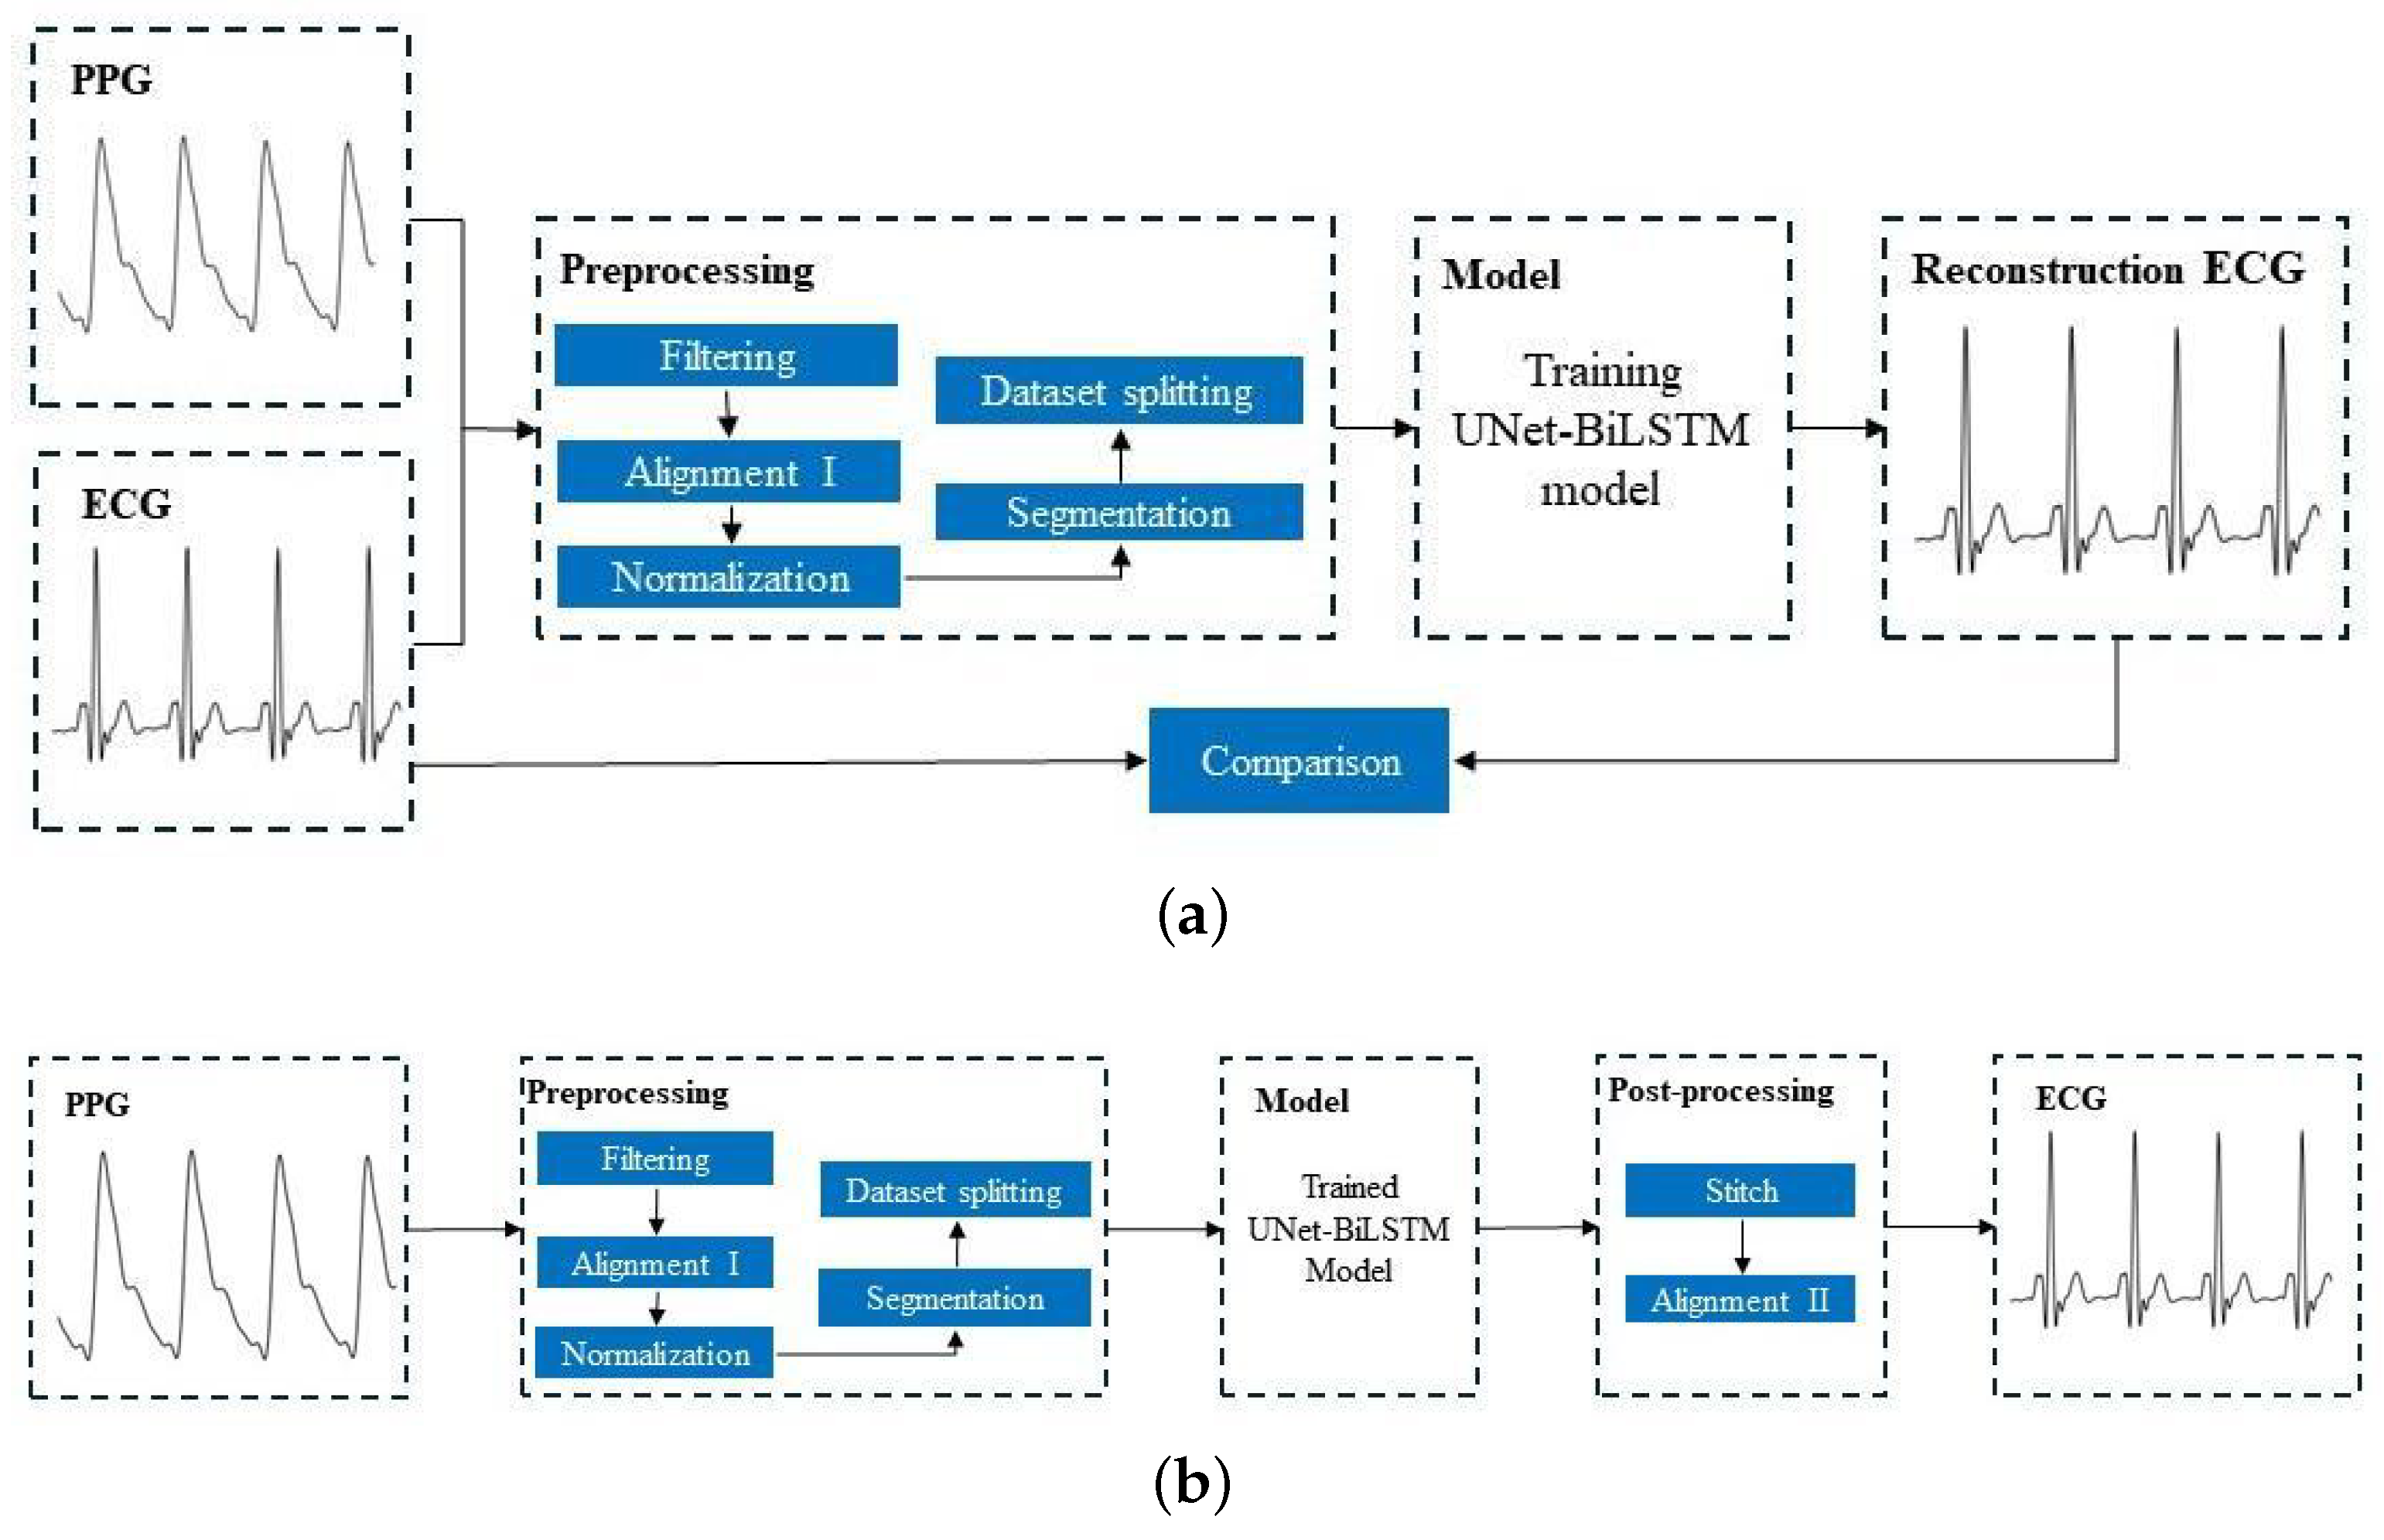
- Filtering: The ECG signal and PPG signal were filtered. We applied a fourth-order Chebyshev bandpass filter to the ECG signal with a passband frequency of 0.5–20 Hz. Similarly, a fourth-order Chebyshev bandpass filter was applied to the PPG signal with a passband frequency of 0.5–10 Hz.
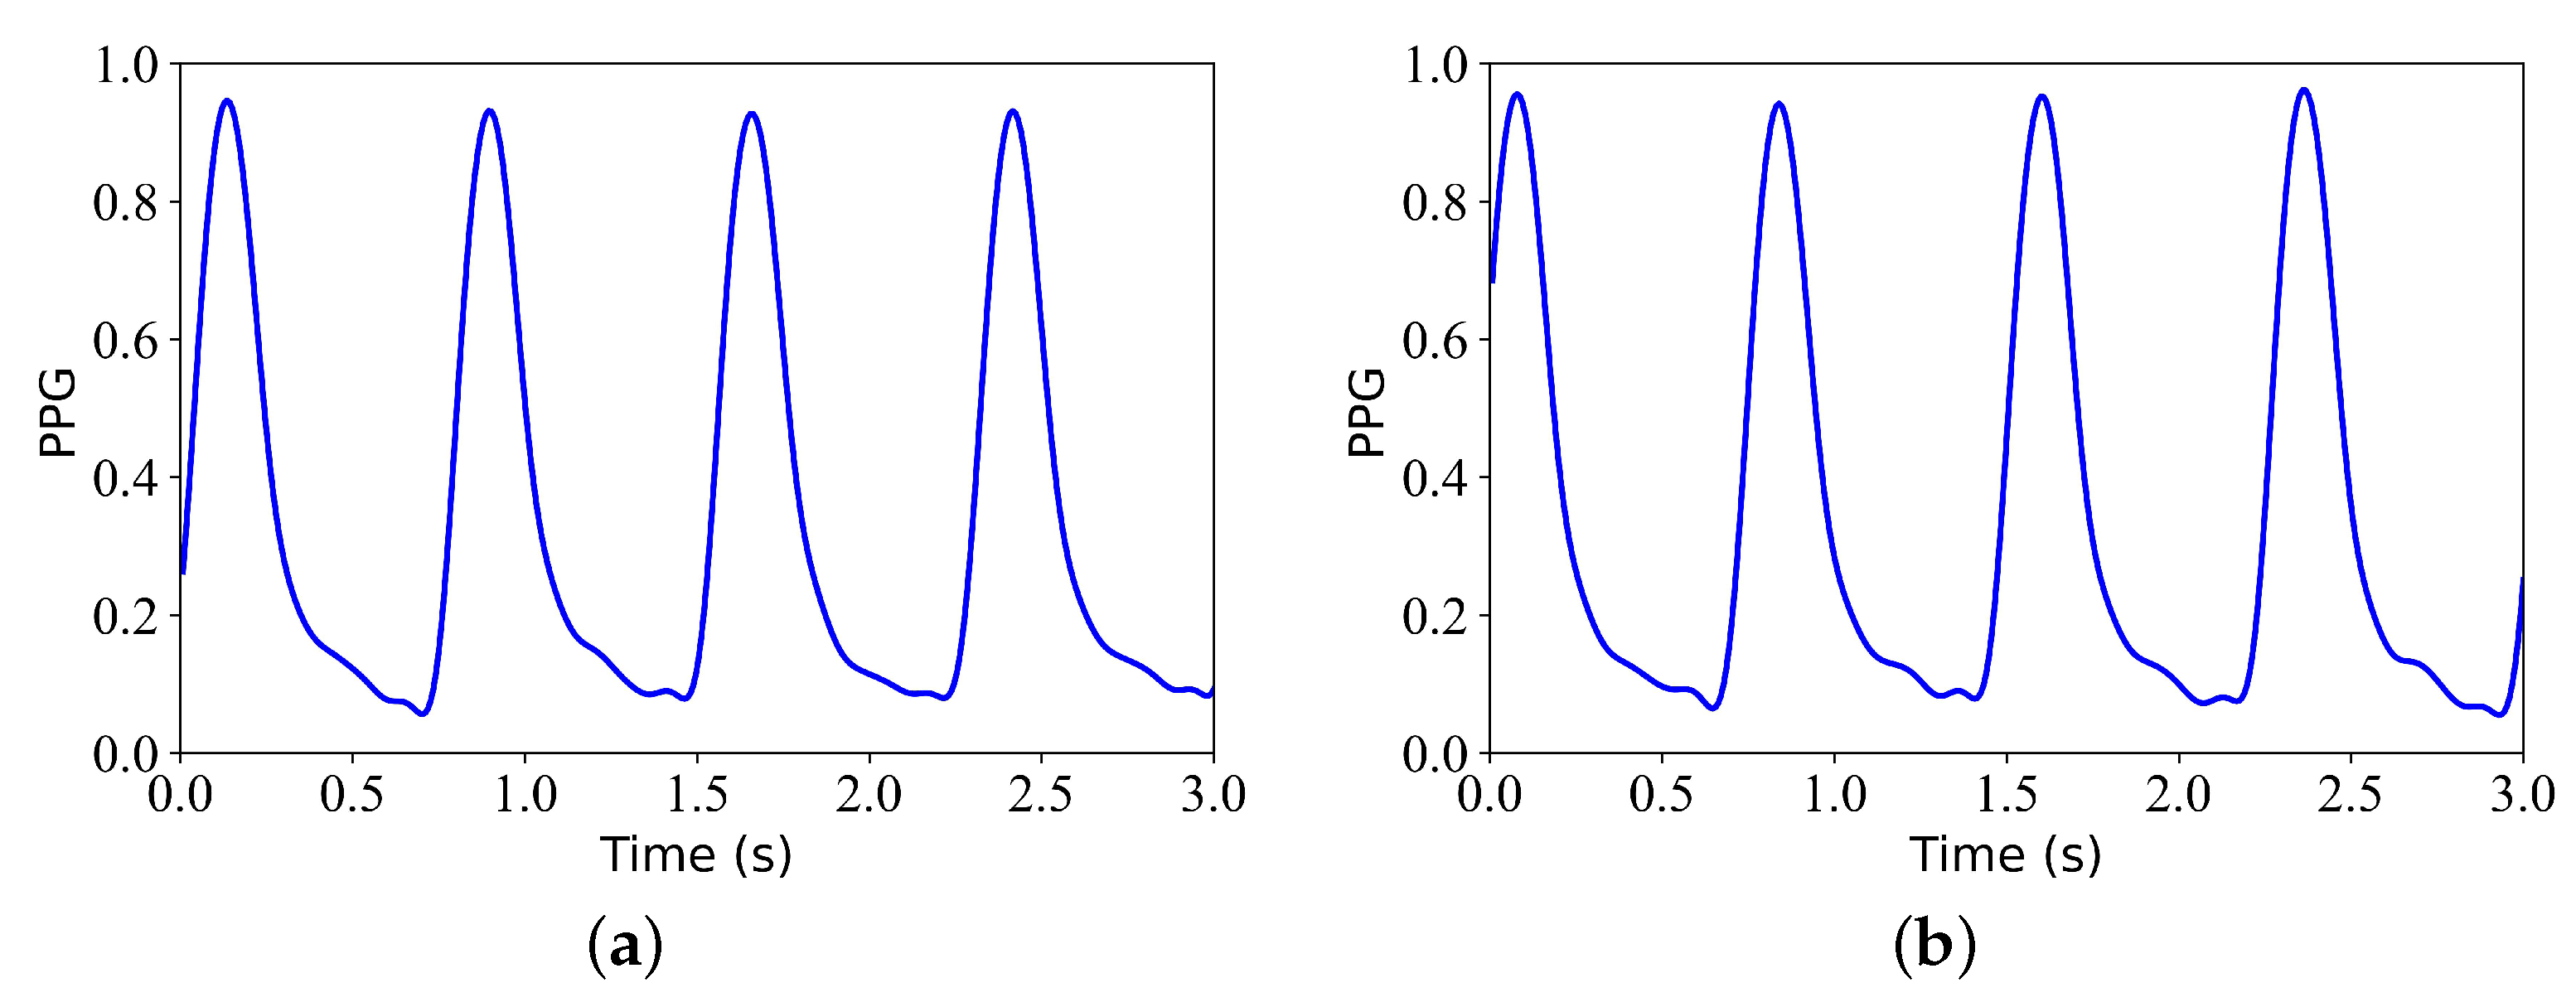
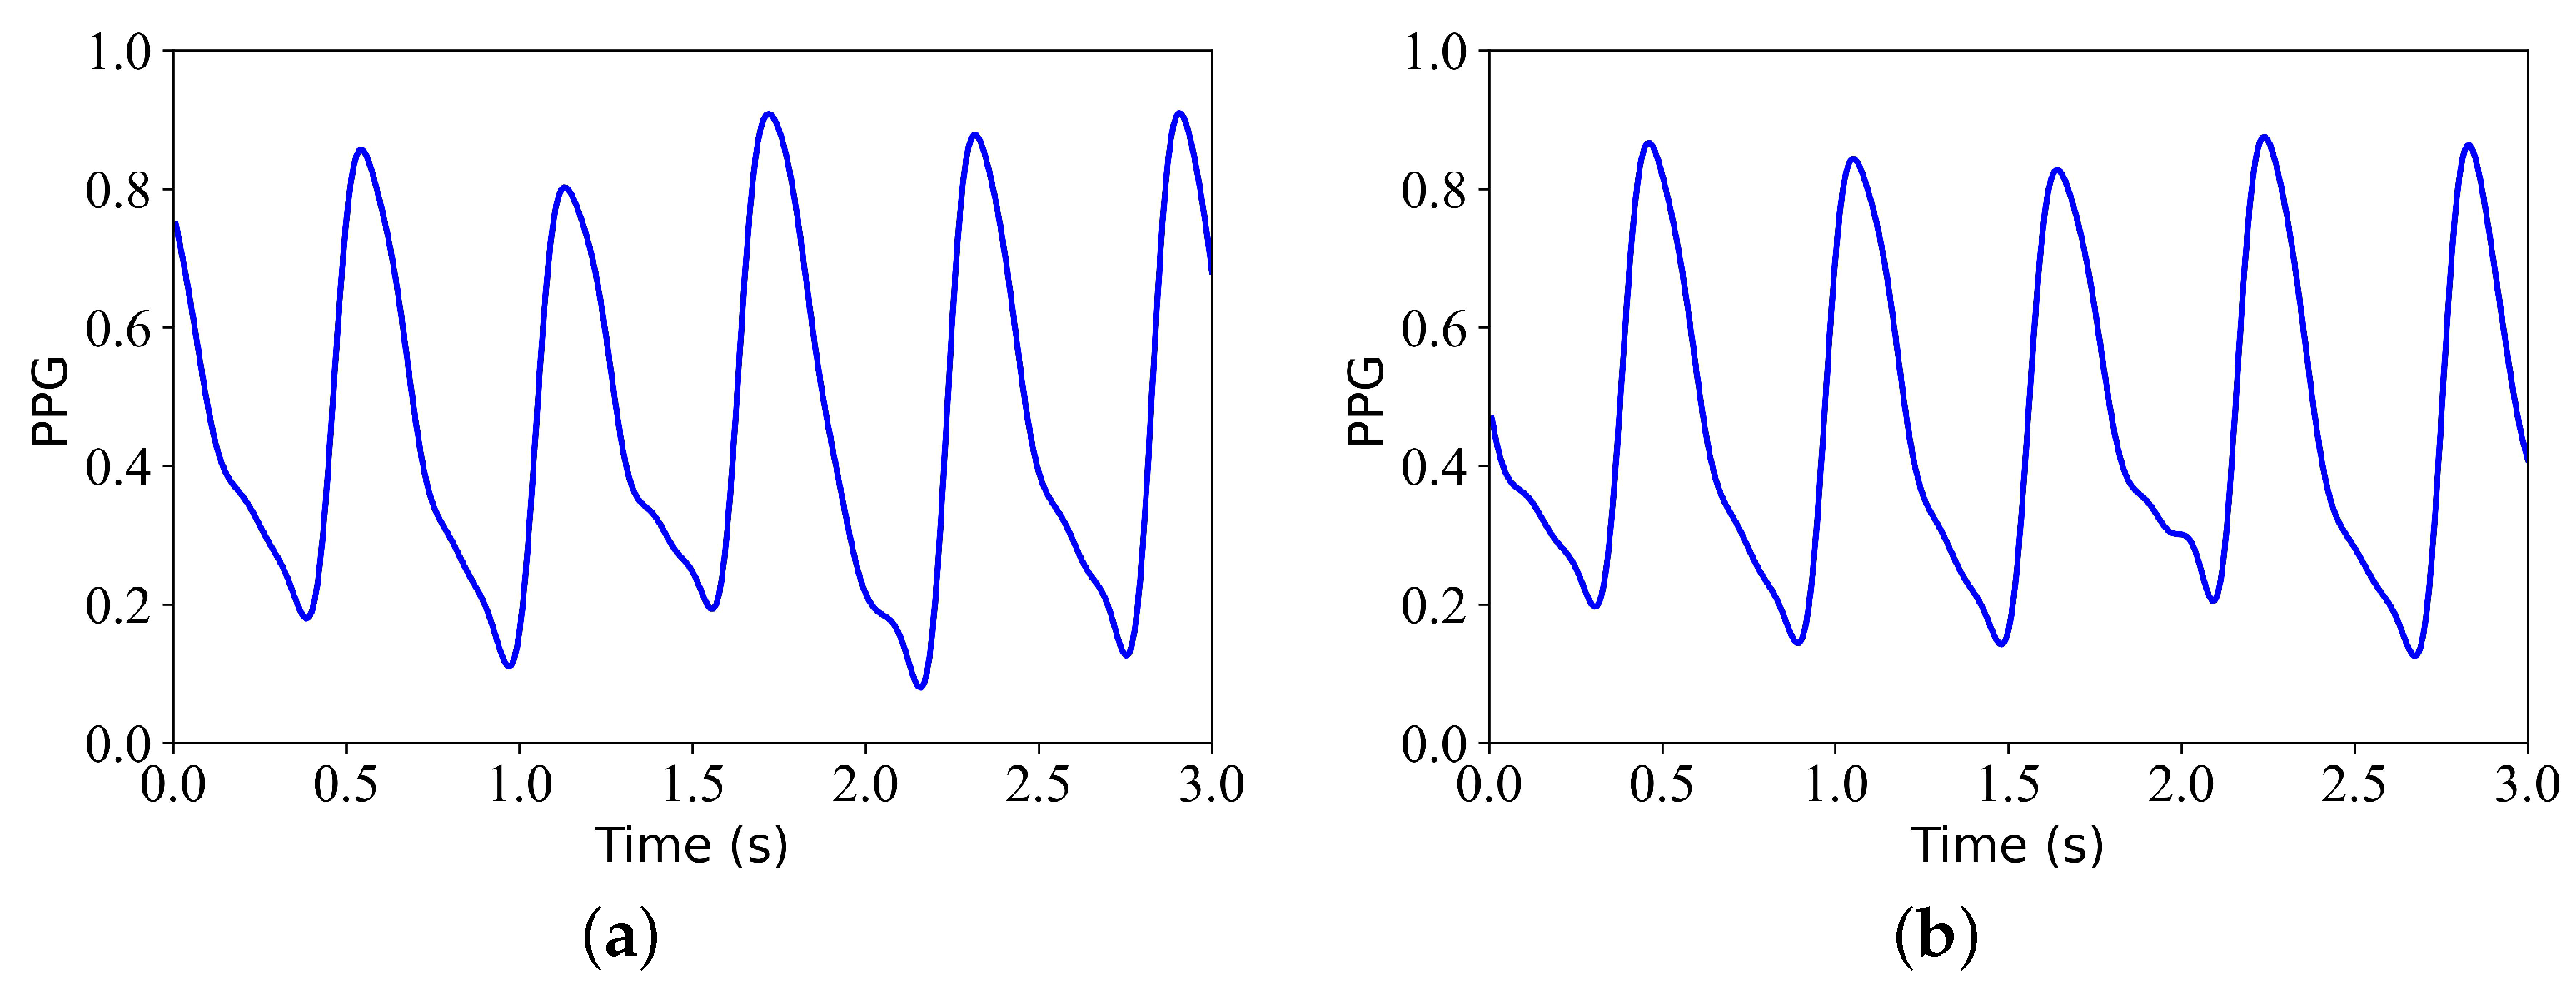
- Alignment I: The Pan–Tompkins method [19] was used to detect the R-wave peak in the ECG signal. A block-based method [20] was used to detect the systolic peak in the PPG signal. Then, the third systolic peak in the PPG signal was aligned with the corresponding R peak in the ECG signal. Figure 2 shows the signals before and after alignment I. Figure 2a shows the ECG and PPG before Alignment I. Figure 2b shows the ECG and PPG after alignment I. This step produced a pair of aligned ECG and PPG signals.
- Normalization: Since the ECG signal needed to be compared with the reconstructed ECG signal, the PPG signal only needed to be scaled to the range of [0, 1] after aligning the data.
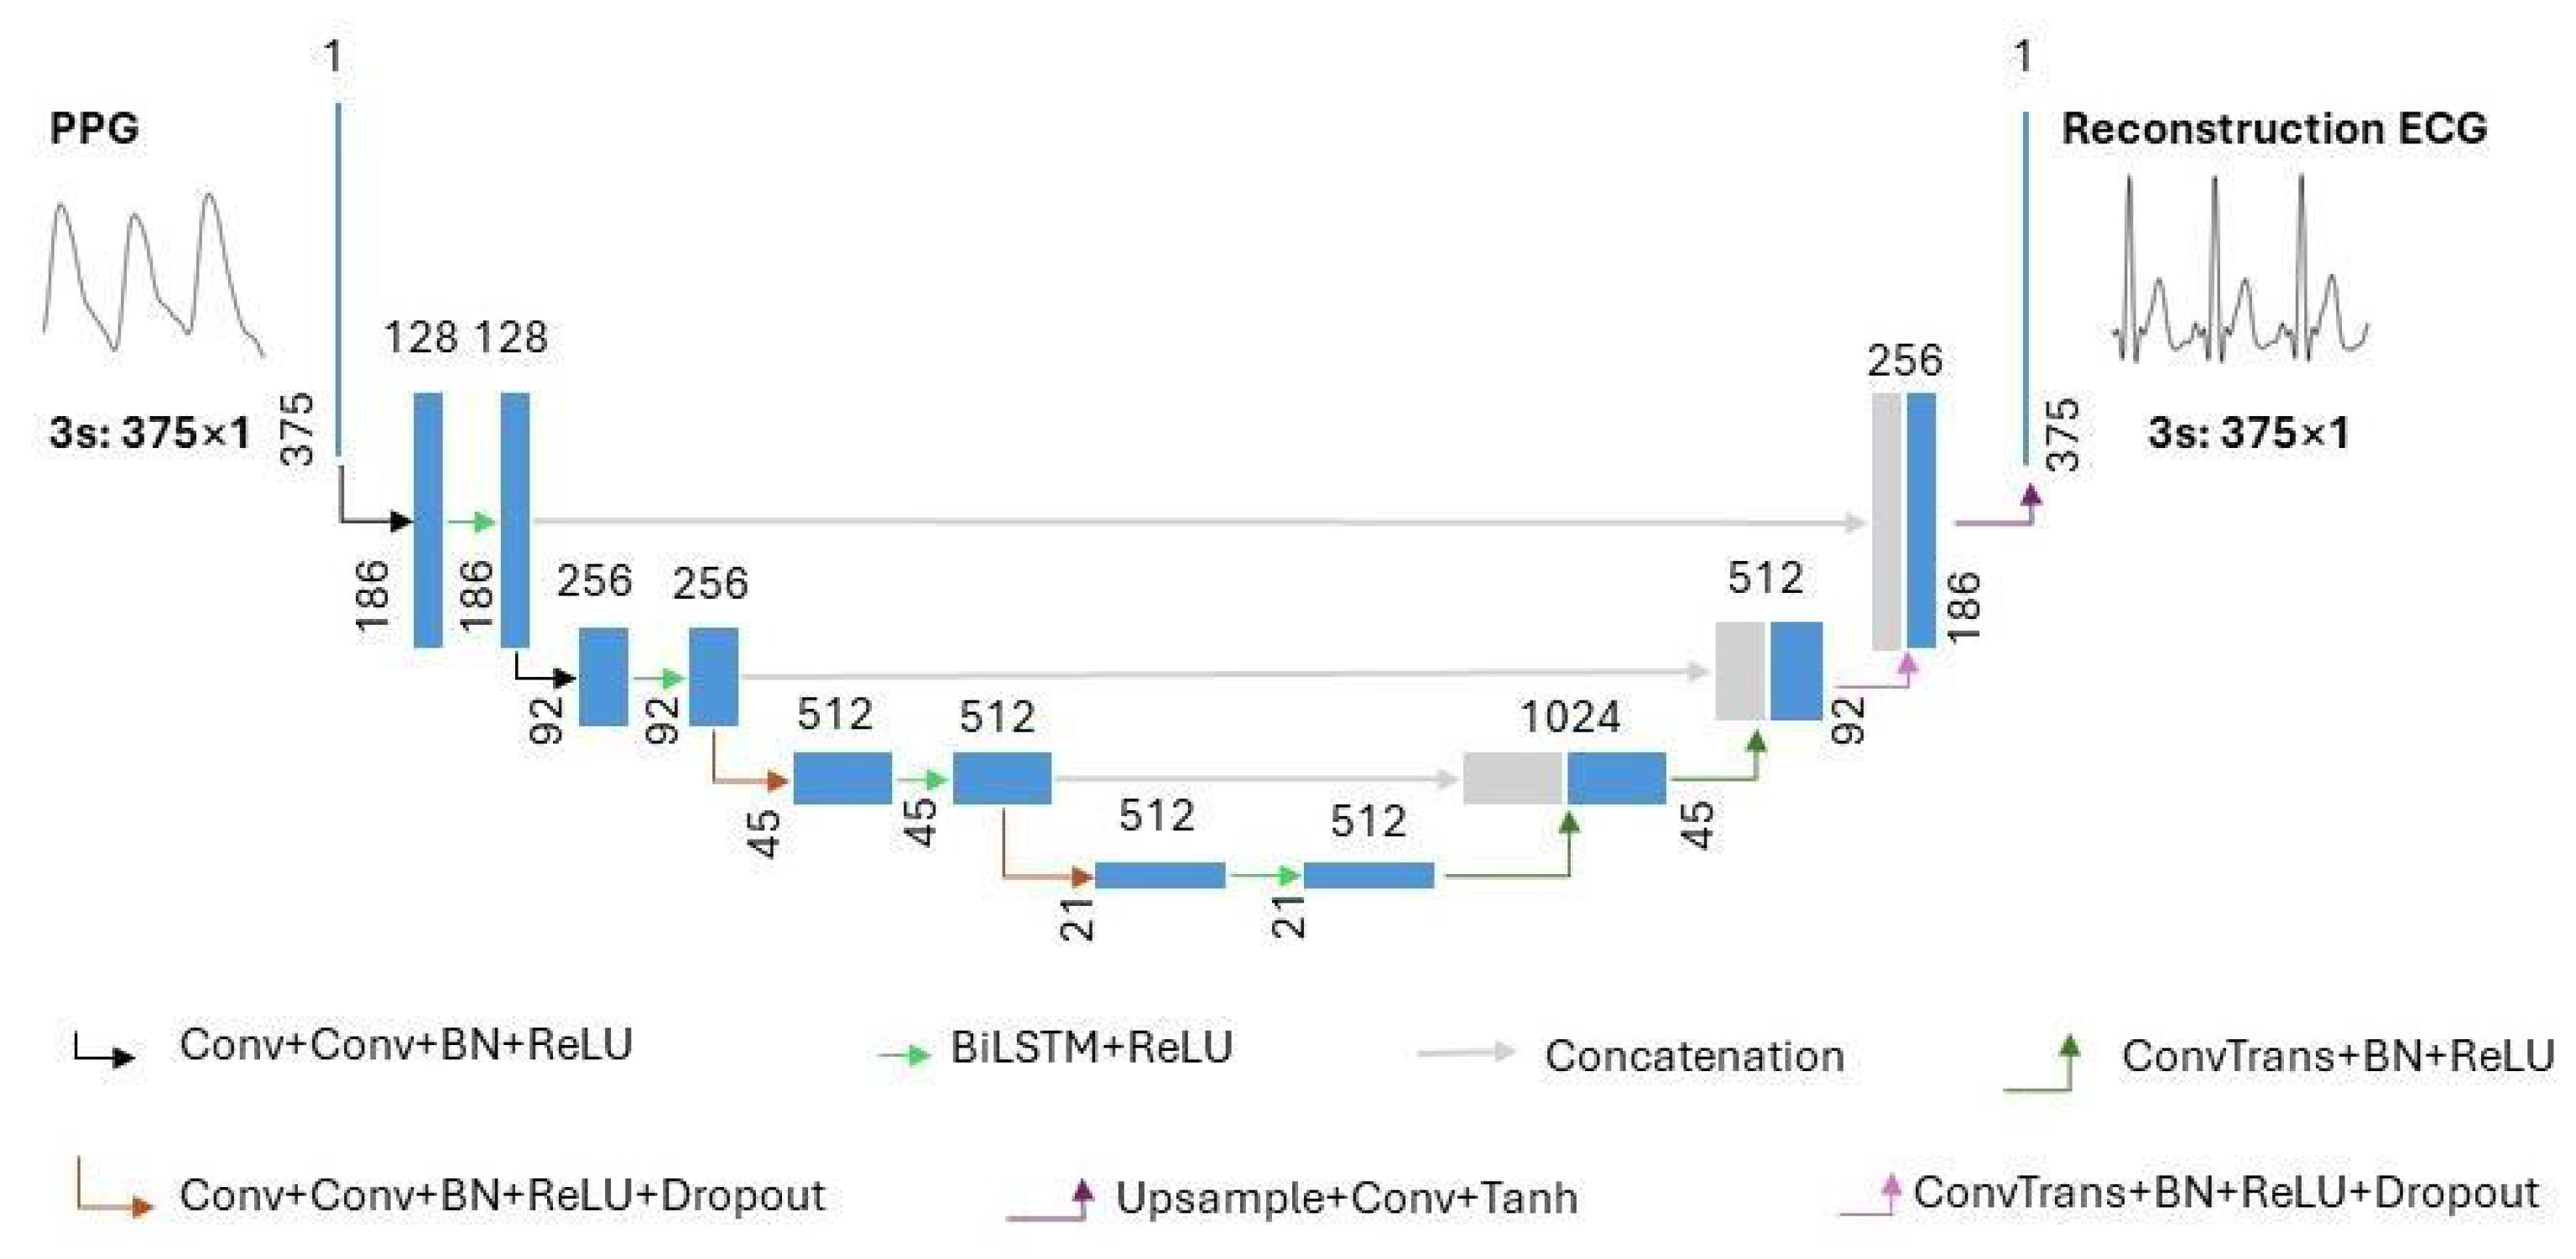
- Segmentation: The ECG and PPG signals obtained in the previous step were divided into segments of 3 s. Since the signal alignment would result in a signal length of less than 300 s, it was necessary to ensure that the length of each record was consistent. To maintain consistency in the length of the training data, we only considered the first 294 s of data and disregarded any data beyond that. Specifically, each record was divided into 3 s.
- Dataset splitting: In particular, the first 60% of each recording was used for training, the next 20% of each recording was used for validation, and the remaining 20% of each recording was used for testing.
2.3. Model Architecture
2.4. Training Options
2.5. Stitching the Reconstructed ECG Segments and Alignment II
- Stitching the reconstructed ECG segments: The neural network’s output consisted of 375 samples of reconstructed ECG segments, each of which was 3 s long. Therefore, they needed to be spliced together to form a continuous reconstructed ECG signal. The second ECG segment was placed after the first ECG segment when combining two ECG segments. The spliced signal was used as the first segment, and the subsequent segment was used as the second segment for further merging. This step was repeated until all test segments in the record were joined together.
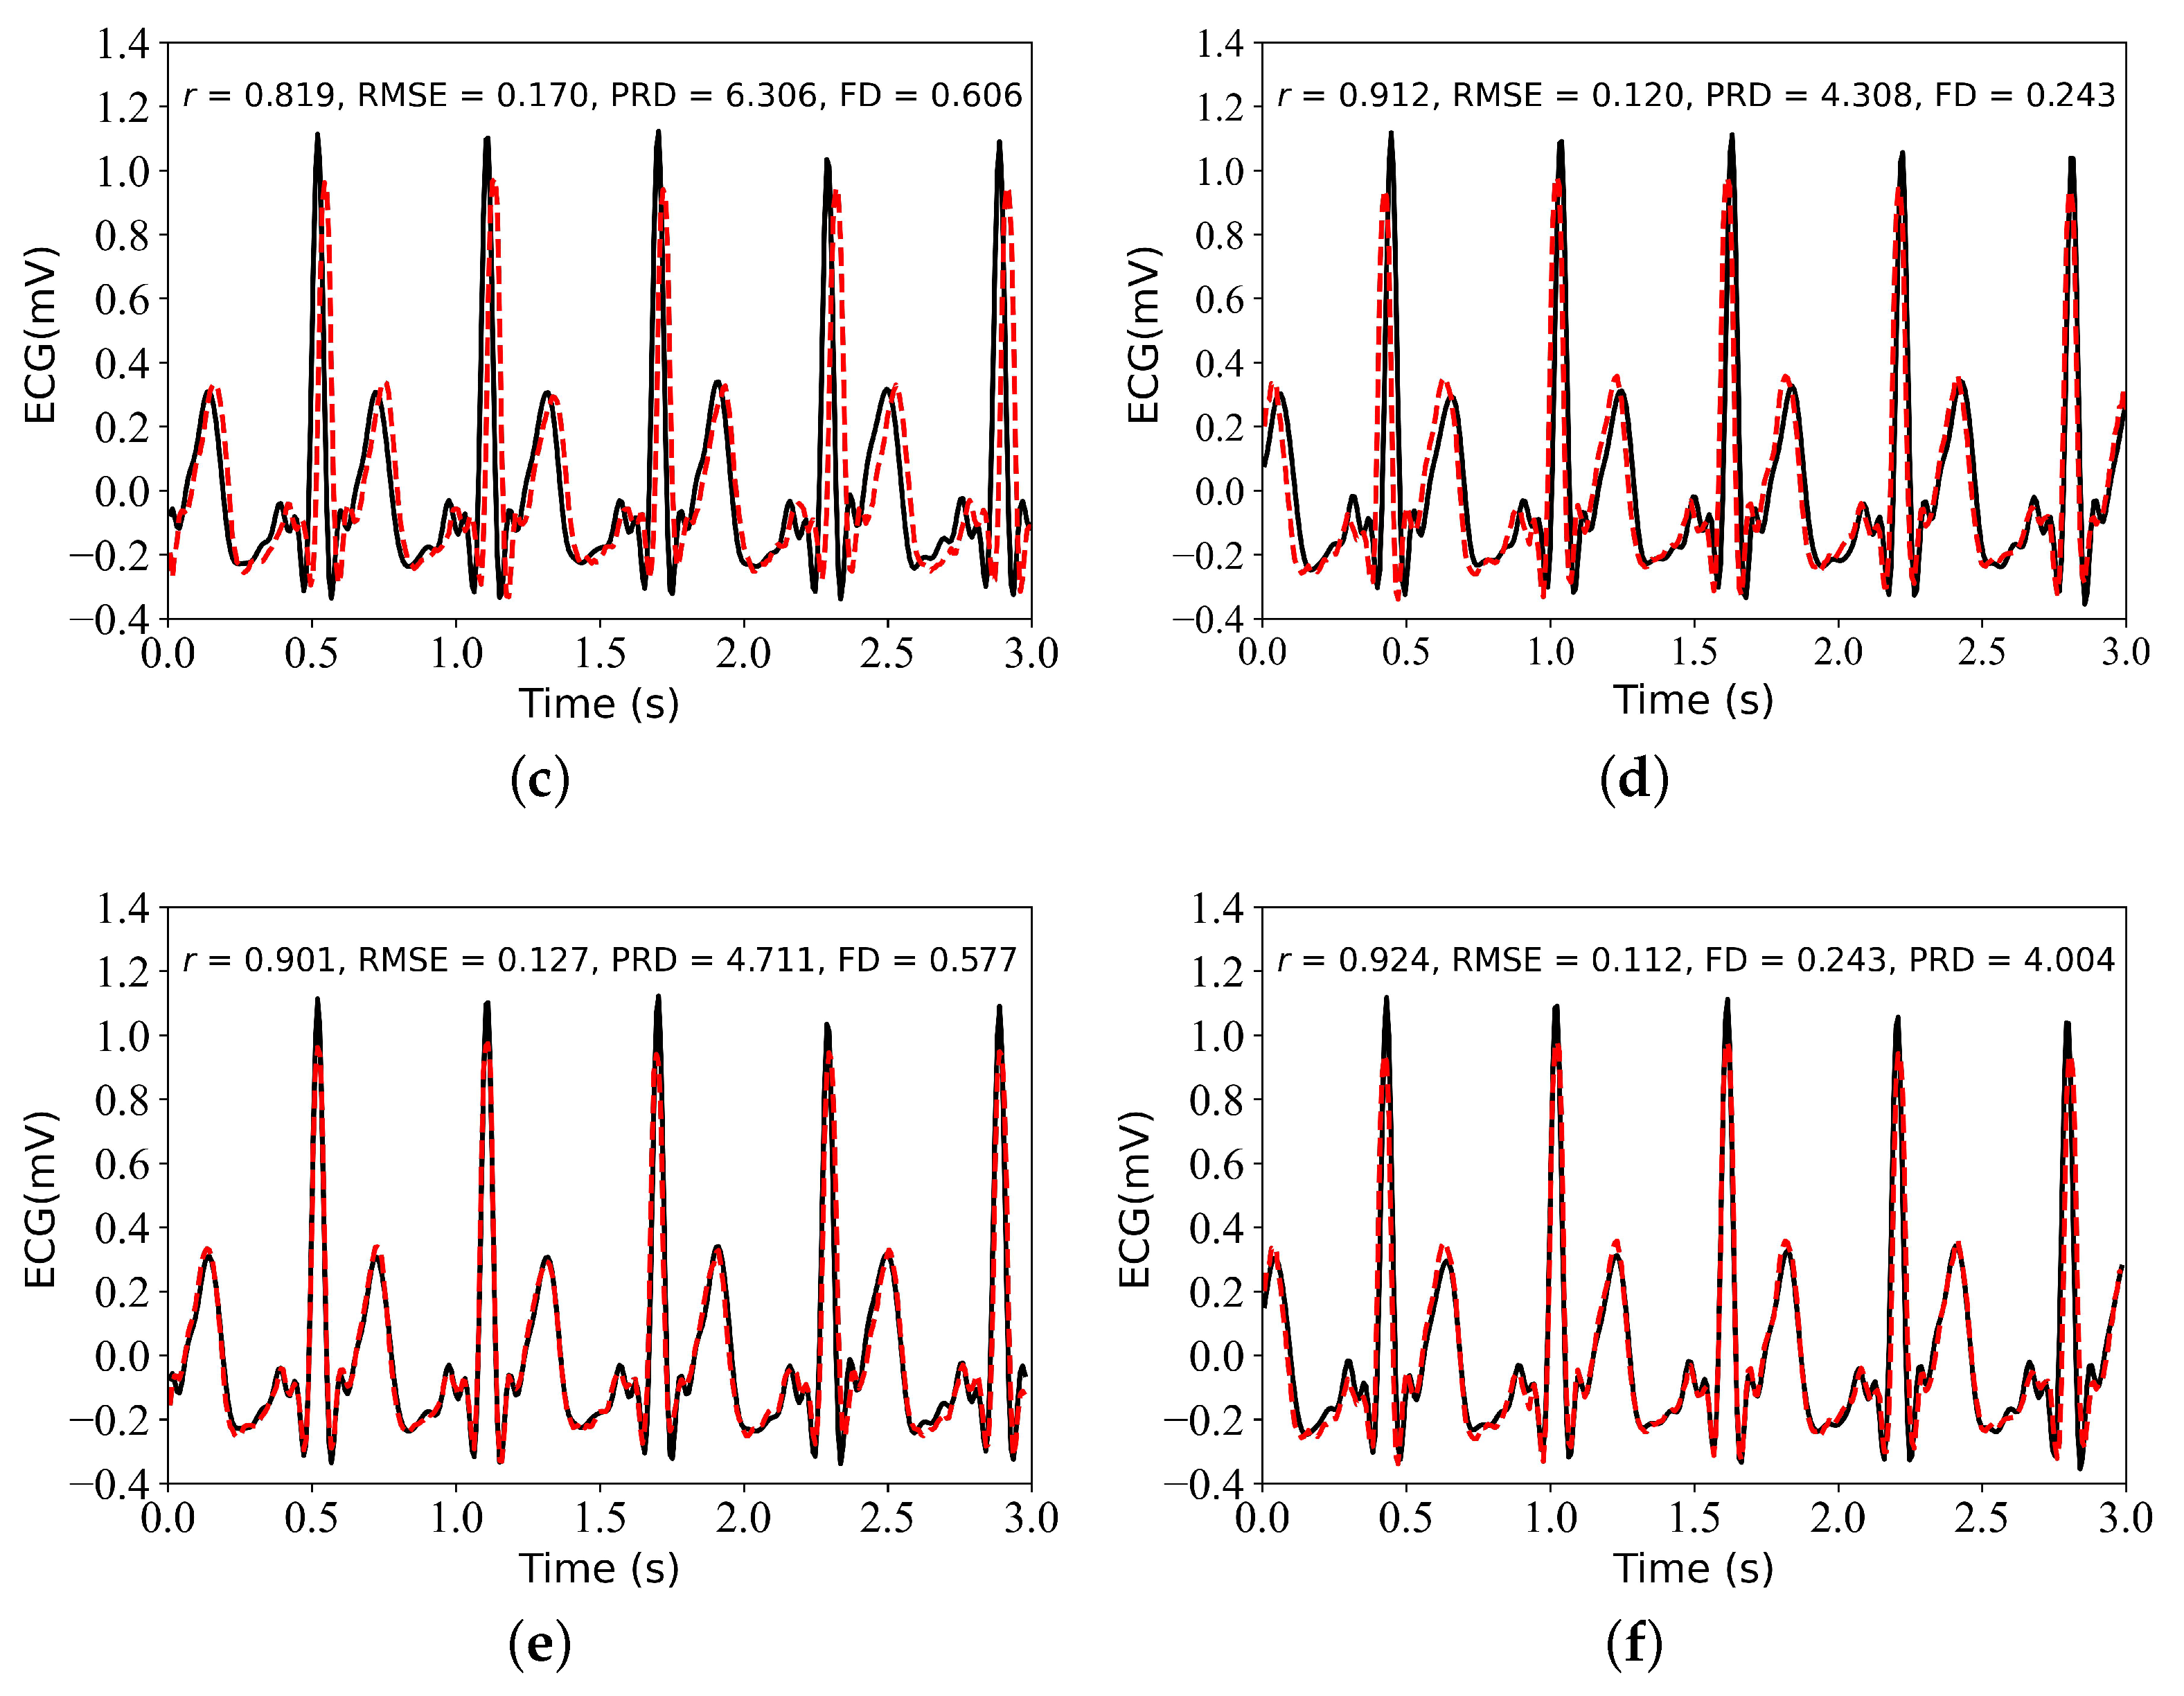
- Alignment II: The result of splicing was an ECG signal that had already been reconstructed, and it was aligned using cross-correlation. After visualizing the reconstructed and reference ECGs, it was discovered that there was some offset between some of the recorded ECGs (some distance between the R-wave crests of the reference and reconstructed ECGs). Cross-correlation alignment is used to minimize the distance between the R-wave peaks of the reference and reconstructed ECGs. This alignment was primarily performed to improve the evaluation of the similarity between the reconstructed and reference signal.
2.6. Performance Evaluation
- Pearson’s correlation coefficient (): The r is a statistical measure that can be used to assess the strength and direction of the linear correlation between two variables. The absolute value of r is in the range of [0, 1]. A correlation coefficient approaching 1 indicates a strong correlation, whereas a coefficient approaching 0 indicates a weak correlation. r is given by the following equation:In the given formula, and represent the individual sample points of the reference ECG signal and the reconstructed ECG signal, respectively, with both being indexed by i. The variable l represents the number of samples of the reference ECG. The symbols and denote the mean values of the ECG signal and the reconstructed ECG signal, respectively.
- Root mean square error (RMSE): The RMSE is a metric used to quantify the discrepancy—commonly referred to as the error—between the measured value of an ECG signal and its corresponding reconstructed value. The RMSE is a quantitative measure used to assess the level of deviation between predicted and actual values. The value in question is a non-negative value that ranges from zero to positive infinity. The closer the value of the RMSE is to zero, the more optimal the reconstruction outcomes become. The RMSE was calculated with the following equation:
- Percentage root mean squared difference (PRD): The PRD was calculated to quantify the distortion between the reference signal E and the reconstructed signal . The value of the PRD was defined within the interval [0, +∞]. The quality of the reconstruction results was enhanced, with a decrease in the PRD value. The following equation was used to calculate the PRD:
- Fréchet distance (FD): The FD is a metric that was utilized to assess the similarity of signals by analyzing the position and order of points on the ECG signal waveform and synthesizing them into a curve. The Fréchet distance quantified the minimum Euclidean distance between corresponding points in the reference and reconstructed ECG signal curve. When calculating the distance between two curves, the distance metric considered the spatial arrangement and sequence of the data points, allowing for a more accurate evaluation of the similarity between the two time-series signals. The value of the FD was defined within the interval [0, +∞]. The closer the FD was to 0, the higher the degree of similarity observed between the reference and reconstructed ECG. The following equation was used to determine the value of the FD:The function represents the Euclidean distance between two corresponding points on the reference ECG signal curve and the reconstructed ECG signal curve. The variable m represents the number of sampling points. The maximum distance under this sampling is denoted as . The Fréchet distance is the value in the sampling method that minimizes the maximum distance.
3. Results
4. Discussion
- In the present study, the ECG signals were filtered using a frequency range below 20 Hz, while frequencies above 20 Hz were not considered. This approach has certain limitations. In subsequent research, we intend to evaluate the efficacy of this model across various frequency ranges.
- The dataset utilized for this research was obtained from the MIMIC III matched subset, which consisted of 125 records. Although the model proposed in this study was designed for group models, the dataset did not provide distinctions based on gender, age, disease, etc. In subsequent research, the dataset will be partitioned based on gender, age, disease, and other relevant factors to evaluate the efficacy of group models.
- This study exclusively focused on the attributes of a complete ECG waveform and did not examine additional features, such as QRS waves and ST segments. In subsequent research, it is imperative to conduct a more comprehensive evaluation of the disparities between reconstructed ECG features and reference ECG features.
5. Conclusions
Author Contributions
Funding
Data Availability Statement
Conflicts of Interest
Abbreviations
| BiLSTM | Bidirectional long short-term memory. |
| CVD | Cardiovascular disease. |
| DCT | Discrete cosine transform. |
| ECG | Electrocardiography. |
| FD | |
| MIMIC | Multiparameter Intelligent Monitoring in Intensive Care. |
| r | Pearson’s correlation coefficient. |
| PPG | Photoplethysmography. |
| PRD | Percentage root mean squared difference. |
| RMSE | Root mean square error. |
| WHO | World Health Organization. |
| XDJDL | Cross-domain joint dictionary learning. |
References
- Cardiovascular Diseases (CVDs). Available online: https://www.who.int/en/news-room/fact-sheets/detail/cardiovascular-diseases-(cvds) (accessed on 27 September 2023).
- Sulaiman, S.; Adam, J.R.; Felix, R.; Shan, Z.; Akhil, V.; Fayzan, C.; Jessica, K.D.F.; Nidhi, N.; Riccardo, M.; Girish, N.N.; et al. Deep learning and the electrocardiogram: Review of the current state-of-the-art. EP Eur. 2021, 23, 1179–1191. [Google Scholar]
- Reisner, A.; Shaltis, P.A.; McCombie, D.; Asada, H.H. Utility of the photoplethysmogram in circulatory monitoring. Anesthesiol. J. Am. Soc. Anesthesiol. 2008, 108, 950–958. [Google Scholar] [CrossRef] [PubMed]
- Shelley, K.H. Photoplethysmography: Beyond the calculation of arterial oxygen saturation and heart rate. Anesth. Analg. 2007, 105, S31–S36. [Google Scholar] [CrossRef] [PubMed]
- Elgendi, M.; Fletcher, R.; Liang, Y.; Howard, N.; Lovell, N.H.; Abbott, D.; Lim, K.; Ward, R. The use of photoplethysmography for assessing hypertension. NPJ Digit. Med. 2019, 2, 1. [Google Scholar] [CrossRef] [PubMed]
- Wang, L.; Pickwell-Macpherson, E.; Liang, Y.P.; Zhang, Y.T. Noninvasive cardiac output estimation using a novel photoplethysmogram index. In Proceedings of the 2009 Annual International Conference of the IEEE Engineering in Medicine and Biology Society, Minneapolis, MN, USA, 3–6 September 2009. [Google Scholar]
- Denisse, C. A review on wearable photoplethysmography sensors and their potential future applications in health care. Int. J. Biosens. Bioelectron. 2018, 4, 195. [Google Scholar]
- Allen, J. Photoplethysmography and its application in clinical physiological measurement. Physiol. Meas. 2007, 28, R1–R39. [Google Scholar] [CrossRef] [PubMed]
- Zhu, Q.; Tian, X.; Wong, C.W.; Wu, M. Learning your heart actions from pulse: ECG waveform reconstruction from PPG. IEEE Internet Things J. 2021, 8, 16734–16748. [Google Scholar] [CrossRef]
- Tian, X.; Zhu, Q.; Li, Y.; Wu, M. Cross-domain joint dictionary learning for ECG reconstruction from PPG. In Proceedings of the 2020 IEEE International Conference on Acoustics, Speech and Signal Processing (ICASSP), Barcelona, Spain, 4–8 May 2020. [Google Scholar]
- Li, Y.; Tian, X.; Zhu, Q.; Wu, M. Inferring ECG from PPG for Continuous Cardiac Monitoring Using Lightweight Neural Network. arXiv 2012, arXiv:201204949. [Google Scholar]
- Tang, Q.; Chen, Z.; Guo, Y.; Liang, Y.; Ward, R.; Menon, C.; Elgendi, M. Robust reconstruction of electrocardiogram using photoplethysmography: A subject-based Model. Front. Physiol. 2022, 13, 859763. [Google Scholar] [CrossRef]
- Tang, Q.; Chen, Z.; Ward, R.; Menon, C.; Elfendi, M. PPG2ECGps: An End-to-End Subject-Specific Deep Neural Network Model for Electrocardiogram Reconstruction from Photoplethysmography Signals without Pulse Arrival Time Adjustments. Bioengineering 2023, 10, 630. [Google Scholar] [CrossRef]
- Vo, K.; Naeini, E.K.; Naderi, A.; Jilani, D.; Rahmani, A.M.; Dutt, N.; Cao, H. P2E-WGAN: ECG waveform synthesis from PPG with conditional wasserstein generative adversarial networks. In Proceedings of the 36th Annual ACM Symposium on Applied Computing, Virtual Event, 22–26 March 2021; pp. 1030–1036. [Google Scholar]
- Sarkar, P.; Etemad, A. CardioGAN: Attentive Generative Adversarial Network with Dual Discriminators for Synthesis of ECG from PPG. In Proceedings of the AAAI Conference on Artificial Intelligence, Delhi, India, 2–9 February 2021; Volume 35, pp. 488–496. [Google Scholar]
- Omer, O.A.; Salah, M.; Hassan, A.M.; Mubarak, A.S. Beat-by-Beat ECG Monitoring from Photoplythmography Based on Scattering Wavelet Transform. Trait. Signal 2022, 39, 1483–1488. [Google Scholar] [CrossRef]
- Abdelgaber, K.M.; Salah, M.; Omer, O.A.; Farghal, A.E.A.; Mubarak, A.S. Subject-Independent per Beat PPG to Single-Lead ECG Mapping. Information 2023, 14, 377. [Google Scholar] [CrossRef]
- Johnson, A.E.W.; Pollard, T.J.; Shen, L.; Lehman, L.H.; Feng, M.; Ghassemi, M.; Moody, B.; Szolovits, P.; Celi, L.A.; Mark, R.G. MIMIC-III, a freely accessible critical care database. Sci. Data 2016, 3, 160035. [Google Scholar] [CrossRef] [PubMed]
- Pan, J.; Tompkins, W.J. A Real-Time QRS Detection Algorithm. IEEE Trans. Biomed. Eng. BME 1985, 32, 230–236. [Google Scholar] [CrossRef]
- Elgendi, M.; Norton, I.; Brearley, M.; Abbott, D.; Schuurmans, D. Systolic Peak Detection in Acceleration Photoplethysmograms Measured from Emergency Responders in Tropical Conditions. PLoS ONE 2013, 8, e76585. [Google Scholar] [CrossRef]
- Olaf, R.; Philipp, F.; Thomas, B. U-net: Convolutional networks for biomedical image segmentation. In International Conference on Medical Image Computing and Computer-Assisted Intervention; Springer: Berlin/Heidelberg, Germany, 2015; pp. 234–241. [Google Scholar]
- Sakib, M.A.M.; Sharif, O.; Hoque, M.M. Offline Bengali Handwritten Sentence Recognition Using BiLSTM and CTC Networks. In Proceedings of the Internet of Things and Connected Technologies, Patna, India, 3–5 July 2020. [Google Scholar]
- Wang, Q.; Feng, C.; Xu, Y.; Zhong, H.; Sheng, V.S. A Novel PrivacyPreserving Speech Recognition Framework Using Bidirectional LSTM. J. Cloud Comput. 2020, 9, 36. [Google Scholar] [CrossRef]
- Zhu, F.; Ye, F.; Fu, Y.; Liu, Q.; Shen, B. Electrocardiogram Generation with a Bidirectional LSTM-CNN Generative Adversarial Network. Sci. Rep. 2019, 9, 6734. [Google Scholar] [CrossRef]
- Siami-Namini, S.; Tavakoli, N.; Namin, A.S. The Performance of LSTM and BiLSTM in Forecasting Time Series. In Proceedings of the 2019 IEEE International Conference on Big Data (Big Data), Los Angeles, CA, USA, 9–12 December 2019. [Google Scholar]
- Stoller, D.; Ewert, S.; Dixon, S. Wave-u-net: A multi-scale neural network for end-to-end audio source separation. arXiv 2018, arXiv:1806.03185. [Google Scholar]
- Bühlmann, P.; Van de Geer, S. Statistics for High-Dimensional Data: Methods, Theory and Applications; Springer: Berlin/Heidelberg, Germany, 2011. [Google Scholar]
- Liu, J.; Tang, W.; Chen, G.; Lu, Y.; Feng, C. Correlation and agreement: Overview and clarification of competing concepts and measures. Shanghai Arch. Psychiatry 2016, 28, 115–120. [Google Scholar]
- Alt, H.; Godau, M. Computing the Fréchet distance between two polygonal curves. Int. J. Comput. Geom. Appl. 1995, 5, 7591. [Google Scholar] [CrossRef]
- Karlen, W.; Raman, S.; Ansermino, J.M.; Dumont, G.A. Multiparameter respiratory rate estimation from the photoplethysmogram. IEEE Trans. Biomed. Eng. 2013, 60, 1946–1953. [Google Scholar] [CrossRef] [PubMed]
- Saeed, M.; Villarroel, M.; Reisner, A.T.; Clifford, G.; Lehman, L.; Moody, G.; Heldt, T.; Kyaw, T.H.; Moody, B.; Mark, R.G. Multiparameter Intelligent Monitoring in Intensive Care II: A public-access intensive care unit database. Crit. Care Med. 2011, 39, 952–960. [Google Scholar] [CrossRef] [PubMed]
- Pimentel, M.A.; Johnson, A.E.; Charlton, P.H.; Birrenkott, D.; Watkinson, P.J.; Tarassen-ko, L.; Clifton, D.A. Toward a robust estimation of respiratory rate from pulse oximeters. IEEE Trans. Biomed. Eng. 2016, 64, 1914–1923. [Google Scholar] [CrossRef]
- Reiss, A.; Indlekofer, I.; Schmidt, P.; Van Laerhoven, K. Deep PPG: Large-scale heart rate estimation with convolutional neural networks. Sensors 2019, 19, 3079. [Google Scholar] [CrossRef]
- Schmidt, P.; Reiss, A.; Duerichen, R.; Marberger, C.; Van Laerhoven, K. Introducing wesad, a multimodal dataset for wearable stress and affect detection. In Proceedings of the International Conference on Multimodal Interaction, Boulder, CO, USA, 16–20 October 2018; pp. 400–408. [Google Scholar]



| Alignment I | Alignment II | r | RMSE | PRD | FD | |
|---|---|---|---|---|---|---|
| Experiment I | Yes | No | 0.842 ± 0.061 | 0.083 ± 0.035 | 5.672 ± 1.167 | 0.280 ± 0.149 |
| Experiment II | Yes | Yes | 0.861 ± 0.058 | 0.077 ± 0.030 | 5.302 ± 1.169 | 0.278 ± 0.149 |
| Experiment III | No | No | 0.812 ± 0.076 | 0.089 ± 0.036 | 6.287 ± 1.408 | 0.332 ± 0.157 |
| Experiment IV | No | Yes | 0.830 ± 0.076 | 0.084 ± 0.034 | 5.978 ± 1.447 | 0.335 ± 0.165 |
| Method | Data | Segment Length | r | RMSE | PRD | FD | Epoch |
|---|---|---|---|---|---|---|---|
| DCT [9] | TBME-RR [30]: 42 Records | Beat | 0.906 | NR | NR | NR | NR |
| MIMIC III [18]: 103 Records | 0.790 | ||||||
| Self-collected: 2 Records | 0.895 | ||||||
| P2E-WGAN [14] | MIMIC II [31]: 276 Records | 3 s | 0.835 | 0.162 | NR | 0.375 | 6000 |
| CardioGAN [15] | BIDMC [32]: 53 Records | ||||||
| CAPNO [30]: 42 Records | 4 s | NR | 0.364 | 9.315 | 0.784 | 15 | |
| DALIA [33]: 15 Records | |||||||
| WESAD [34]: 15 Records | |||||||
| SWT [16] | MIMIC II [31] | NR | 0.1006 | NR | NR | 3500+ | |
| This study (UNet–BiLSTM) | MIMIC III [18]: 125 Records | 3 s | 0.861 | 0.077 | 5.302 | 0.278 | 500 |
Disclaimer/Publisher’s Note: The statements, opinions and data contained in all publications are solely those of the individual author(s) and contributor(s) and not of MDPI and/or the editor(s). MDPI and/or the editor(s) disclaim responsibility for any injury to people or property resulting from any ideas, methods, instructions or products referred to in the content. |
© 2024 by the authors. Licensee MDPI, Basel, Switzerland. This article is an open access article distributed under the terms and conditions of the Creative Commons Attribution (CC BY) license (https://creativecommons.org/licenses/by/4.0/).
Share and Cite
Guo, Y.; Tang, Q.; Chen, Z.; Li, S. UNet-BiLSTM: A Deep Learning Method for Reconstructing Electrocardiography from Photoplethysmography. Electronics 2024, 13, 1869. https://doi.org/10.3390/electronics13101869
Guo Y, Tang Q, Chen Z, Li S. UNet-BiLSTM: A Deep Learning Method for Reconstructing Electrocardiography from Photoplethysmography. Electronics. 2024; 13(10):1869. https://doi.org/10.3390/electronics13101869
Chicago/Turabian StyleGuo, Yanke, Qunfeng Tang, Zhencheng Chen, and Shiyong Li. 2024. "UNet-BiLSTM: A Deep Learning Method for Reconstructing Electrocardiography from Photoplethysmography" Electronics 13, no. 10: 1869. https://doi.org/10.3390/electronics13101869
APA StyleGuo, Y., Tang, Q., Chen, Z., & Li, S. (2024). UNet-BiLSTM: A Deep Learning Method for Reconstructing Electrocardiography from Photoplethysmography. Electronics, 13(10), 1869. https://doi.org/10.3390/electronics13101869


