Abstract
This paper proposes a modified sensor measurement expression for a moving target defense (MTD) strategy to detect coordinated cyber-physical attacks (CCPAs). Essentially, the MTD defense characteristics for detecting false data injection attacks (FDIAs) differ from those used to detect CCPAs. In the first case, the MTD performance in detecting FDIAs at the attack-execution stage is mainly considered, which is generally denoted by the detection probability; however, whether the construction of undetectable CCPAs is disrupted via the MTD strategy used during the attack-preparation stage is the focus of the latter case. There has been little work on the detection of undetectable CCPAs in the context of MTD post-activation. In our work, a novel approach to detecting undetectable CCPAs via a modified sensor measurement expression is proposed. First, the production mechanism for undetectable CCPAs without the application of an MTD strategy is transferred to that which occurs after MTD activation; then, based on an in-depth analysis of the CCPAs’ production mechanism after MTD activation, a novel modified sensor measurement expression is presented to detect undetectable CCPAs. Extensive simulations were conducted on three standard power systems to verify the effectiveness and simplicity of our approach to detecting CCPAs.
1. Introduction
Power grids are gradually evolving towards smart grids through the deep integration of information and communication technologies (ICT). This greatly facilitates the operation and management of power grids. Just as a coin has two sides, power grids also suffer from malicious cyber-attacks. There is an attack called a coordinated cyber-physical attack (CCPA, e.g., the attack on the Ukrainian electrical grid) that is dangerously covert. When the physical attack involves disconnecting a power transmission line, transformer, or generator, the cyber-attack simultaneously injects a crafted attack into sensor measurements conveyed from the field devices to the control center to mask the physical attack, which could trigger cascading failures. Therefore, CCPAs have gradually become a concern [1,2,3].
Multiple defense methods against CCPAs have been studied. An approach based on securing a set of measurements was proposed in [4]. Another approach employing measurements from known-secure phasor measurement units (PMUs) was provided in [1]. Because there are some aging devices in power grids, security upgrades are too expensive. Moreover, extensive research has also proved that PMUs are powerless against FDI attacks [5]. Machine learning-based methods to detect FDI attacks were also proposed in [6,7,8]. Recent studies have shown that these methods are vulnerable in adversarial scenarios [9]. Therefore, new defense mechanisms need to be explored.
In recent years, multiple countermeasures have been proposed to prevent stealthy cyber-attacks. False data injection attacks (FDIAs) are well-known forms of attacks on power grids [10,11]. To detect and mitigate FDIAs, the moving target defense (MTD) method has recently been proposed for use in power systems. In comparison with traditional static defense, MTD is a dynamic strategy, which increases the complexity and the cost for potential attackers. The MTD works by actively perturbing transmission lines’ reactances using distributed flexible AC transmission system (D-FACTS) devices, which invalidates the knowledge acquired by attackers.
Recent related works: in reference [12], D-FACTS devices were first used on power grids to control power flow and relieve congestion. The authors of references [13,14] first proposed deploying D-FACTS devices into power grids to enhance state estimation security. Rahman et al. [15] first proposed using an MTD mechanism to secure state estimation and presented a formal MTD design to guarantee its effectiveness in detecting FDIAs. To acquire an effective solution to MTD reactance perturbations in the detection of FDIAs, references [16,17] proposed a design criterion that showed that effective MTD perturbations incur a non-trivial operational cost, corresponding to the grid’s optimal power flow (OPF) cost [16] and the transmission power losses [17]. The authors of reference [18] propose a hidden MTD approach that avoids detection by attackers. Zhang Zhenyong et al. [19] presented sufficient system topology conditions to guarantee MTD’s detection capability for all FDIAs. Liu Bo et al. [20] proposed an optimal D-FACTS placement that maintains MTD’s detection capability against FDIAs via graph theory, using the minimum number of D-FACTS devices. Subhash Lakshminarayana and Yau [16] developed a new metric to depict the tradeoff between MTD’s detection abilities and its cost. The authors of reference [21] first revealed the correlation between MTD design and FDI detection and optimized MTD performance in terms of detecting FDI attacks.
In recent years, the MTD method has been used to thwart CCPAs in which the physical attacks only involve disconnecting transmission lines. The authors of reference [2] first proposed detecting CCPAs based on the MTD technique. In the paper, the interconnection between the attacker and the defender was formulated as a two-player zero-sum game, and the transmission lines’ reactances that needed to be perturbed were solved by computing the game solution. In this way, the MTD’s detection capability against CCPAs could be guaranteed while diminishing the grid’s OPF cost. In contrast, the works by the authors of references [2,22] considered the practical constraints and further proposed an algorithm for finding the minimum number of D-FACTS devices that need to be used.
Note the difference in the characterization of MTD defense against FDIAs and CCPAs. When considering MTD’s defense against FDIAs, its performance in the detection of FDIAs is focused on the attack-execution stage. Specifically, the first sensor measurements conveyed from the field devices to the control center are used with state estimation technology; then, after obtaining the state estimation data, a bad data detector (BDD) formulation, denoted as the difference between the -norm of the measurement residue and a predetermined threshold value, is constructed; and finally, generally using the Monte Carlo approach, the detection probability is obtained. However, when considering MTD’s defense against CCPAs, MTD’s ability to disrupt the construction of CCPAs is mainly focused on the attack preparation stage. The literature has rarely focused on the issue of detecting CCPAs. The authors of reference [1] derived the CCPA’s undetectable mechanism. Then, how to construct a BDD formulation that can successfully detect undetectable CCPAs in the context of MTD activation becomes an issue. Only one paper [23] proposed a formulation for detecting CCPAs in the context of MTD activation, but the formulation was complex, and how to obtain the data for most components in the formulation was not explained. Therefore, in our work, a novel method to detect CCPAs is presented, and only DC power flow mode is considered.
There are two main contributions of this paper:
- Based on the CCPA production principle derived in [1] and the method that MTD uses to disrupt the construction of CCPAs proposed in [2], we further derive the CCPA production principle in the context of MTD’s post-activation;
- We propose a modified sensor measurement expression that is applied to identify CCPAs after MTD activation. In the expression, a supplement state factor, notated as , is added. We provide an in-depth discussion of the construction characteristics of the supplemental state factor.
The remainder of this paper is organized as follows: Section 2 presents the system model. In Section 3, the principle of the CCPAs is explained. In Section 4, the method of detecting CCPAs via the MTD strategy is presented. In Section 5, the production principle of the CCPAs after MTD activation is further derived. Numerous simulation results are presented in Section 6. The final section presents the conclusion.
2. System Model
2.1. Preliminary System Model
A power grid is often described as a graph, . showing the set of buses. Set indicates the set of transmission lines. In general, a bus is selected as the slack bus. A transmission line in the set represents the connection between bus i and bus j, while its reactance is denoted by . At each bus in the power grid, a power balance exists. At bus i, the power balance is denoted as . , , and , which indicate generation, load, and active power injection, respectively. Note that the positive direction of the power flow on line k is from bus i to bus j. In the DC power flow model, the positive power flow is denoted as:
where and represent the voltage phase angles at buses i and j, respectively.
In this paper, we mainly focus on the DC power flow model [24,25]. is the reduced branch-bus incidence matrix, given by:
is a diagonal branch susceptance matrix whose element Dkk is opposite to the susceptance of the line k = {i,j}, i.e., Dkk = −bij. In the vector form, the power flow vector is expressed as and is interrelated with the voltage phase angel vector . Their relationship can be expressed as follows:
2.2. State Estimation and Bad Data Detection
Using stator estimation (SE) technology, the system state, i.e., the voltage phase angles can be estimated from the noisy sensor measurements. Let denote the sensor measurements, including the nodal power injections and the forward and reverse branch power flows, i.e., and M indicates the total number of the measurements. M = n − 1 + 2L. The measurement noises are denoted by the vector , which is generally assumed to follow a Gaussian distribution. The measurement vector z can be expressed as:
where is the measurement matrix given by . Based on the weighted least squares (WLS) technology, the estimate can be expressed as:
where is a diagonal matrix, whose elements are reciprocals of the variances in measurement errors.
After state estimation, the residual measurement is computed by a bad data detector (BDD), and denoted by r as follows:
A bad data alert is triggered if the norm of the residual exceeds the predefined threshold . Since the measurement residual’s norm conforms to the chi-square distribution of freedom m − (n − 1), the threshold can be determined by a hypothesis check with a confidence degree of .
3. Coordinated Cyber-Physical Attacks
Due to the existing supervisory control and data acquisition (SCADA) communication standards’ vulnerabilities, an attacker can initiate a cyber-attack. The specific way of doing so is to inject an attack vector into the sensor measurements conveyed from the field devices to the control center. This can interfere with the system operator’s normal operations and even cause the operator to take the wrong actions. Although the measurements are subjected to the BDD to identify their validity, a smart attacker can carefully design an attack. Ultimately, the manipulated sensor measurements can bypass the BDD. Such an attack is known as an undetected attack.
3.1. Undetectable FDI Attacks
The attack vector is usually denoted as . The measurement vector including a FDI attack is written as and given by:
If the designed a is expressed as:
where , shows that the FDI attack is undetectable [26,27]. The detection probability of the FDI attack is equal to the false positive (FP) rate , where (usually a small value close to zero).
3.2. Coordinated Cyber-Physical Attacks
A cyber-physical attack (CPA) is synchronous; both the physical attack and the cyber-attack occur simultaneously. Only the physical attack that disconnects a single transmission line is considered in our work. After the physical attack has been launched, the system topology and power flow may change. In general, a random cyber-attack injected into the sensor measurements hardly masks the negative effect on the power grid resulting from the physical attack. However, the negative effect can be completely concealed by injecting a crafted cyber-attack. As a result, the sensor measurements conveyed to the control center can bypass the BDD. This type of undetected CPA is called a coordinated CPA, that is, a CCPA.
After the physical attack, the system parameters are different from their initial state and are denoted by the subscript “p”. The sensor measurement vector from the field devices is and may be formulated as:
where is known as a physical attack vector, given by:
is the difference in the measurement matrix between post-attack and pre-attack, given by:
is the difference in the nodal voltage state variable between post-attack and pre-attack, denoted by:
When constructing a CCPA [1], the impact of the on the measurement residual must be removed. A coordinated FDI attack vector can be designed in the form of:
3.3. Knowledge Required to Launch a CCPA
Assume that a single branch is disconnected after a physical attack. Buses i and j are two endpoints of branch . When relying on the composition method of the elements in the measurement difference matrix [1], the tripped branch reactance only needs to be known when constructing . Moreover, due to Equation (13), the knowledge required to launch a CCPA includes the branch reactance and the difference in the phase angles of buses i and j, i.e., . In [2], the equation of the difference phase angles between buses i and j is given as:
The meaning of the equation is also given in [2].
An example of an IEEE 4-bus system is given in Figure 1. Assume that is disconnected. There are two paths between buses 1 and 2 in the remaining system. One path is and k1 = 3, another path is and k2 = 2. The phase angle difference between buses 1 and 2 is calculated as:
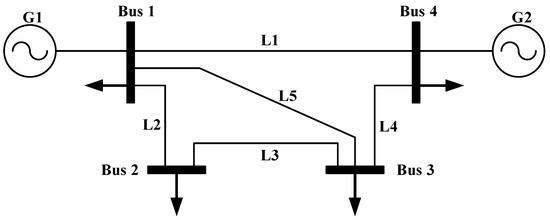
Figure 1.
An example of a four-bus power system.
The power flow in Equation (14) may be obtained by monitoring the corresponding sensor measurements. By monitoring the system power flow over a period of time, the attacker can learn the line reactance . The disconnected branch reactance can also be obtained.
4. Moving-Target Defense for CCPAs
4.1. Preliminary MTD
The authors of reference [12] presented the power transmission constraints and bottlenecks that could be eliminated by altering the admittances of transmission lines via the D-FACTS that were used. The D-FACTS can be hung on transmission lines due to their light weight. Some scholars of power systems make use of D-FACTS devices to detect FDIAs [13]. Rahman et al. [15] first named the detection method MTD due to the uncertainties, which injected blurred system information for potential attackers and increased the difficulty of successfully launching a covert attack after MTD activation. If an attacker wants to launch a CCPA, he/she must know the reactance of the transmission lines, which are verified according to Equation (14). If the information acquired by the attacker is in doubt, then the attacker might give up and not launch the CCPA. Therefore, the MTD method was applied to protect the power grid from CCPAs in our work.
4.2. MTD Perturbation Frequency and Practical Implementation
To guarantee MTD’s effectiveness, before the attacker obtains sufficient information to launch a successful attack, the system settings must be altered. In fact, the attacker can acquire the requested information, which is used to launch an undetectable CCPA, by monitoring the power grid’s sensor measurement readings over a period of time [28]. Hourly perturbations are sufficient for practical systems, as validated by the experimental evidence (see the discussion in [29], Sec. IV).
Figure 2 of reference [2] illustrates the practical implementation of the MTD scheme. As was explained in reference [2], the MTD perturbation interval is in the order of hours, whereas the SCADA measurement frequency is in the order of 4–6 s. When the transmission lines’ reactance is perturbed, the information grasped by the attacker becomes invalid. For example, let denote the new measurement matrix after MTD activation. Although the attacker knows the original measurement matrix , the attacker cannot know .
4.3. Defending against CCPAs
The essence of the MTD’s defense against CCPAs is to disrupt CCPAs’ construction by actively perturbing some appropriate lines’ reactances [22]. The problems associated with the deployment of D-FACTS devices are a hot research topic in the field of the MTD defense against a variety of malicious attacks [30,31].
Recall from Equation (14) that, to launch a CCPA, the attacker must acquire two types of information: (i) the reactance of the disconnected branch, and (ii) all branches’ reactances in any alternate path between buses i and j. Hence, the defender can only destroy the CCPA by invalidating either of the two types of information [2]. An example can be used to illustrate this idea. Figure 2 depicts an IEEE 14-bus power system, assuming that the tripped branch is . denotes a collection of all alternate paths between buses 6 and 13, and . Table 1 lists all the alternate paths between buses 6 and 13 and provides all the transmission lines included in every alternate path. When the tripped line is , the total number of alternate paths is 12. If the attacker acquires and all transmission lines’ reactances of any path among the 12 alternate paths, then the attacker can launch a CCPA and vice versa. As shown in Figure 2, when tripped, only three sets of D-FACTS devices are deployed on . Specifically, after the reactances of , and are disturbed, the reactances of all transmission lines in any alternate path presented in Table 1 are blurred for the attacker. The CCPA with must be cut off and cannot be launched. The deployment of D-FACTS devices still contains a variety of other schemes that can be used to disrupt the CCPA, which is not our main concern. In addition, reference [2] provides the method used to protect all power grid transmission lines from all CCPAs. The design of the MTD perturbations is shown in reference [16]. The perturbation ratio of the transmission lines’ susceptances ranges from 0.8 to 1.2 in this paper.
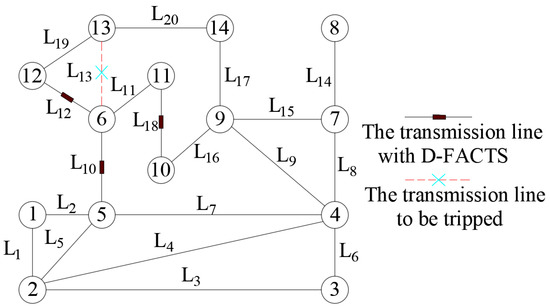
Figure 2.
IEEE 14-bus power system.

Table 1.
All alternate paths and full transmission lines of an alternate path when the tripped line is L13 in the IEEE 14-bus power system.
5. Modified Sensor Measurement Expression
The BDD usually determines whether there are any abnormal data based on the statistical characteristics of the residual measurement. The residual measurement is the difference between the sensor measurements and the estimated measurements. The sensor measurement expression is closely related to the correct or incorrect detection result.
5.1. Production Mechanism of CCPAs after MTD Activation
First, based on the literature [1] that derived the approach to implement a CCPA, we analyzed the mechanism associated with launching a CCPA after MTD activation. In reference [1], Equations (12)–(14) are, respectively, expressed as:
These three equations show the reason that a CCPA is undetectable. There are two fundamental reasons for this: (i) the sensor measurements are provided in the form of a vector and can be expressed as a product of the original measurement matrix and the nodal state variable, in addition to the independent noise and (ii) during state estimation, the key element of the matrix E is the original measurement matrix. The two points lead to the new measurement residual is exactly equal to the original value , so that can pass the BDD. Then, the undetectable property of the CCPA is implemented.
Based on the above three equations, we can also derive three new equations illustrating the production mechanism of CCPAs in the context of MTDs post-activation. The three equations are shown below (similarly, let , ):
As shown in Equation (20), the key component in ES technology in the context of post-activation MTDs is . The equation denoted as manifests the sensor measurements after MTD activation without any attack, which must bypass the BDD. That is, the -norm of the residual measurement is less than the predetermined threshold value, which is denoted as . Although is not , at least two approaches can be used to determine the actual system state after MTD activation for the attackers. These two methods have been provided in references [1,22]. The specific instructions are provided after the theorem in the following text is proved. Equation (21) illustrates , which demonstrates that can also pass the BDD. Equations (19)–(21) seem to perfectly illustrate why a CCPA is undetectable after MTD activation. However, there is a problem. In Equation (19), and is designed by the smart attacker. However, the attacker cannot learn the measurement matrix , so is unlikely to be designed. If the cannot be designed, the undetectable production mechanism of the CCPAs is in doubt after MTD activation. The CCPA should be undetectable; therefore, this problem must be solved. How can the undetectable mechanism of the CCPA after MTD activation be explained?
It is well known that smart attackers have mastered the original measurement matrix H. The optimized cyber-attack vector in Equation (11) of reference [1] may have been designed following the equation , where is the measurement matrix after the physical attack and can be mastered by the attackers. The two relationships, between and and between and are worth probing.
Theorem 1.
The original measurement difference matrix and the measurement difference matrix after MTD activation are both sparse matrices. The relationship between them can be expressed as , where is a positive number, which may be equal to 1.
Proof of Theorem 1.
Suppose that the tripped branch in a power grid is , whose susceptance is denoted by after a physical attack, where buses i and j are the two endpoints of the branch. According to Formulas (15)–(20) in [1], can be given by:
where k is the line index of the branch , and is the total number of transmission lines in the power grid. The non-zero entries are either a positive or negative susceptance of the tripped branch. Under the two different conditions obtained based on the above approach, the two expressions of are also obtained as follows:
□
The first condition, corresponding to Equation (23), is when the susceptance of the tripped branch is not perturbed before a physical attack. The second condition, corresponding to Equation (24), is when the susceptance of the tripped branch is altered before a physical attack. In Equation (24), represents the multiple of the tripped branch susceptance to perturbation. is not equal to 1 and could be selected as a number between 0.8 and 1.2 [2,16,22]. As a result, by combining Equations (22)–(24), the relation between and can be written as , where may be equal to 1. Therefore, the theorem is proved.
Based on this theorem, the relation between and can be expressed by ; can be limited to between 0.8 and 1.2 and is certainly also equal to 1. Since is approximately 1, it is reasonable to assume that they are equal, and Equation (19) can be rewritten as:
Now, we must explain exactly why a smart attacker can design the attack vector Specifically, we must understand how the smart attacker learns . At least one method is mentioned above. This method has been provided in the literature [1]. As was explained in [1] and Equations (23) and (24) checked, the attacker only needs to acquire the phase angles of the two buses connecting to the tripped branch after the physical attack. The phase angles of the two buses can be directly measured by the attacker by compromising or deploying PMUs on the two buses, which can occur even after the MTD has been activated.
In addition, some may think that our job is unimportant. However, in our experience, few congeneric works have been carried out. Only one paper [23] provided a similar result, also denoted by an equation, as follows:
In contrast to Equation (25), not only is Equation (26) complex, but the implications and data related to most of its components are rarely provided. In Equation (25), the two points are sufficiently presented.
5.2. The Reason for Modifying Sensor Measurement Expression
Specifically, if a tripped branch is deployed as a D-FACTS device before a physical attack and the susceptance of the disconnected branch has been altered before the physical attack, this corresponds to the condition of Equation (24). Under this condition, the relationship between and is expressed by , where is not equal to 1. Therefore, the construction of the CCPA is corrupted. There is also a very special case in which the susceptance of at least one branch that is located on any of the alternate paths between the two endpoints of the tripped branch has been changed when the susceptance of the tripped branch is invariable. Under this condition, although is equal to , the construction of the CCPA is also corrupted. In these two cases, both CCPAs can be detected using a theoretical analysis. However, in the first case, , although is not equal to 1, as is usually close to 1, the detection probability obtained via the BDD is very small and almost equal to , which is set at 0.05. In the second case, , the result for the detection probability is also the opposite: there is a contradiction.
Why has the generation mechanism of CCPAs been destroyed (due to insufficient conditions and the difference phase angles between the two key buses being poorly computed via Equation 14), while the detection probabilities obtained via the BDD are still wrong? How can this problem be solved? After carefully analyzing the construction of Equation (25), it can be inferred that the sensor measurement expression must be modified.
5.3. Sensor Measurement Expression Modified
When the conditions under which the CCPA can be detected are satisfied, Equation (25) must be modified as follows:
In Equation (27), the supplementary state factor, denoted as is a sparse vector. There is a unique non-zero entry in the vector. Assume that the disconnected branch is , where buses i and j are the two endpoints of the branch . The component index number of the unique non-zero entry in the corresponds to the bus index of either bus i or bus j. The value of the unique non-zero entry can be selected as a negative number that is less than a predesigned negative number.
6. Simulation
Below, our simulation results, obtained using the MATPOWER toolbox, are presented to show the effectiveness and convenience of the proposed approach. To be more convincing, we performed extensive simulations for IEEE 14-, 30-, and 118-bus systems.
Figure 3 and Figure 4 depict the IEEE 30-bus power system and IEEE 118-bus system, respectively, as follows.
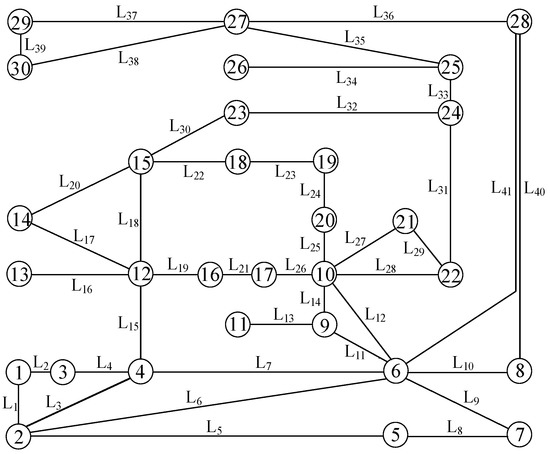
Figure 3.
IEEE 30-bus power system.
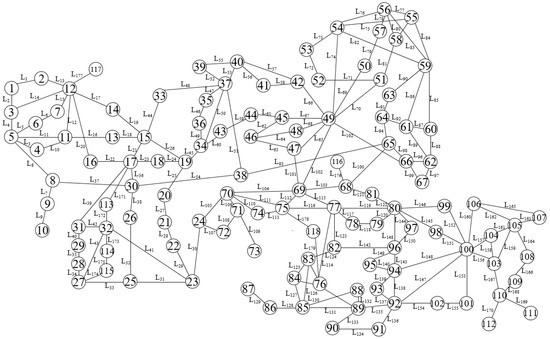
Figure 4.
IEEE 118-bus power system.
To verify the correctness of the proposed method, a simulation scenario involving 24 simulation strategies was designed. Table 2 lists all simulation strategies and the specific measures used in each simulation strategy.
Table 2.
Specific measures and the systems to which they were applied.
6.1. The Correctness and Completeness of the Simulation Scenario
Essentially, the MTD defense characteristics used to detect FDIAs differ from those used to detect CCPAs. In the first case, the MTD’s performance when detecting FDIAs in the attack-execution stage is mainly considered when it is generally denoted by the detection probability. The focus of the latter case is whether the construction of undetectable CCPAs is disrupted by the MTD strategy in the attack preparation phase. In our work, a new method, similar to that used to detect FDIAs, is presented to detect CCPAs. The principle that the construction of undetectable CCPAs is flawed is still followed. In Section 4.3, two ways to disrupt undetectable CCPAs were presented. Suppose that a line is tripped. Then, one way to disrupt the construction of a CCPA is to modify the line’s reactance using the MTD strategy. Another way is to disturb at least one line’s reaction on each alternative path connecting bus i to bus j. In this context, this simulation scenario, involving 24 simulation strategies, was designed. The overall implementation block diagram is shown in Figure 5.
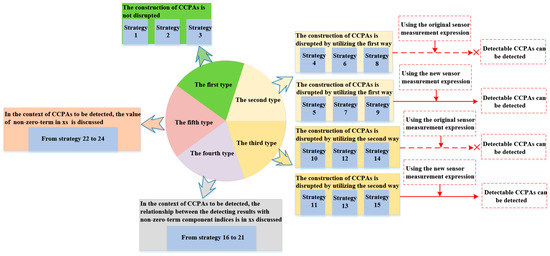
Figure 5.
The overall block diagram of the proposed simulation scenario.
As can be seen from Figure 5, based on the disruption of undetectable CCPAs construction, all 24 simulation strategies are divided into five categories, which include all situations from a logical functional perspective. Therefore, they are correct and complete. In addition, the symbol xs indicates a supplementary stator factor when the new sensor measurement expression is used.
6.2. The Steps of the Proposed Method
The steps of the proposed method, that is, the undetectable CCPAs’ detection via a modified sensor measurement expression, are shown in Figure 6. In essence, the proposed method still follows a mathematical statistical concept, using the BDD judgment to calculate the detection rate.
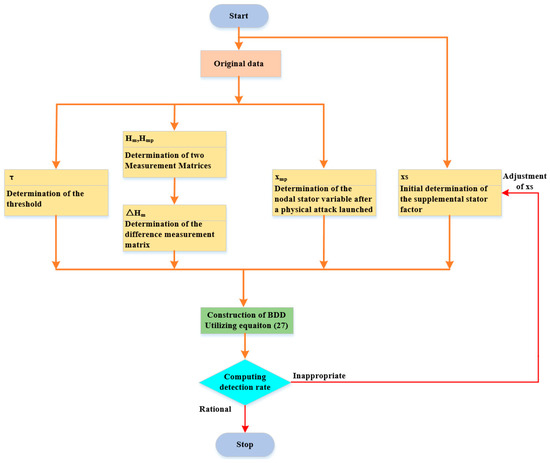
Figure 6.
Diagram of the proposed undetectable CCPAs’ detection procedure.
Note that, in the BDD detection mechanism, the pre-determined threshold τ is selected through numerical statistical methods. Specifically, as the square of the two-norm of the residual measurement conforms to the chi-square distribution, τ can be determined by a hypothesis check with a confidence level of 0.05. In addition, the specific calculation method of the undetectable CCPAs’ detection rate is given in Figure 6.
6.3. Undetectable CCPAs
We designed three simulation strategies for the IEEE 14-bus system, the IEEE 30-bus system, and the IEEE 118-bus system, respectively. In the simulation strategy 1, is disconnected but does not belong to , and The IEEE 14-bus system diagram is given in Figure 2. The path consisting of lines is not an alternate path between nodes 6 and 13. The attacker can obtain all the necessary knowledge, and then the CCPA must be undetectable. As shown in Figure 7, the results of simulation strategy 1 reflect that the detection rate undergoes small fluctuations around 0.05; the principles of simulation strategies 2 and 3 are the same as those of assimilation strategy 1. After acquiring the specific measurements from Table 2 and checking Figure 3 and Figure 4, it is clear that the CCPAs in strategies 2 and 3 must also be undetectable. Similarly, consistent results are obtained in Figure 7.
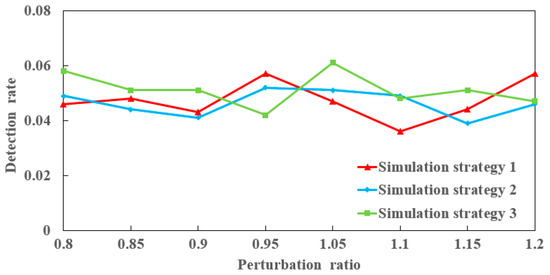
Figure 7.
The detection rates in simulation strategies 1, 2, and 3 when the perturbation ratio increases from 0.8 to 1.2.
6.4. Detectable CCPAs When the Susceptance of the Disconnected Branch Is Altered
6.4.1. Computing the Detection Rate via the General Mathematical and Statistical Method
We carefully designed simulation strategies 4, 6, and 8. In simulation strategy 4, line is disconnected and simultaneously belongs to , so the attacker must not know the susceptance of line within a short period of time. In principle, the CCPA of strategy 4 should be detectable; however, the result of strategy 4, as shown in Figure 8, indicates that the detection rate in the strategy is almost 0.05, which suggests that the CCPA is undetectable. There is a contradiction. The root of the problem is the use of the original sensor measurement expression, denoted by Equation (25), for the BDD. When the modified sensor measurement expression, denoted by Equation (27), is used in simulation strategy 5, the result conforms to this theory. From Figure 8, the detection rate in strategy 5 is almost 1 when the perturbation ratio increases from 0.8 to 1.2, which is right and consistent with this principle. In essence, simulation strategies 6 and 8 are the same as strategy 4, which can be verified using Figure 8; then, simulation strategies 7 and 9 are consistent with strategy 5.
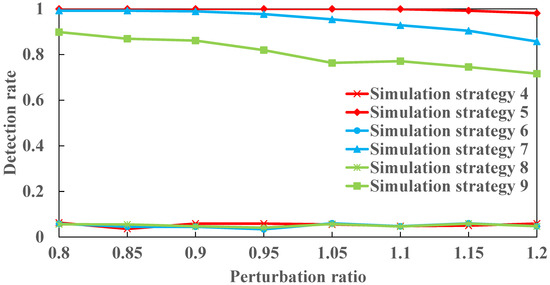
Figure 8.
The detection rates in simulation strategies 4, 5, 6, 7, 8, and 9 when the perturbation ratio increases from 0.8 to 1.2.
In Figure 8, although the detection rate in strategy 7 decreases monotonically from 0.992 to 0.857, this is sufficient to show that the CCPA in this case is detectable by the IEEE 30-bus system; similarly, although the detection rate in strategy 9 monotonically decreases from 0.898 to 0.716, the result also indicates that the CCPA is detectable for the IEEE 118-bus system.
6.4.2. Computing Detection Rate via Machine Learning Methods
Although a variety of methods to detect covert attacks exist, such as machine learning methods [32], little research has been carried out regarding the detection of CCPAs. Here, based on the machine learning method proposed in the literature [32] to detect FDIAs, research on CCPAs’ detection using machine learning methods has also been conducted.
When detecting CCPAs, the initial data are similarly obtained from the MATPOWER toolbox. The operating points of the test systems provided in the MATPOWER case files are used to generate sensor measurements [32]. After repeating the process 50 times, training and test data are obtained. In our work, the Support Vector Machine (SVM) method and Error Back Propagation (BP) algorithm were used to detect undetectable CCPAs. The simulation results for simulation strategies 4–9 have a disturbance reaction ratio of 1.2, as shown in Figure 9.
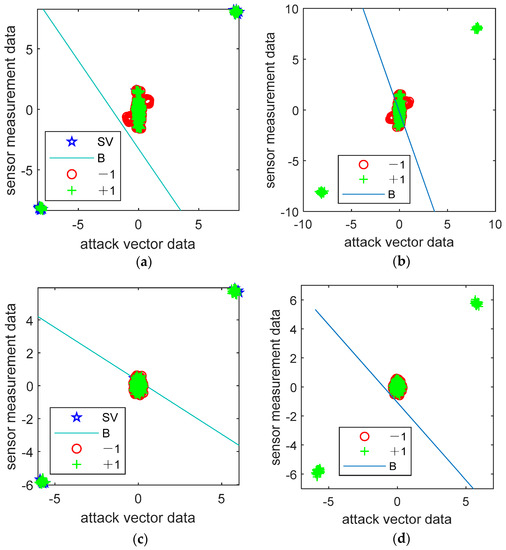
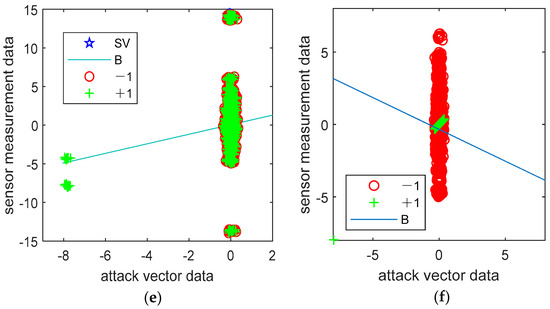
Figure 9.
The machine learning methods’ performance in the detection of undetectable CCPAs (a,c,e) utilize SVM, while (b,d,f) utilize BP, for an IEEE 14-bus power system, an IEEE 30-bus power system, and an IEEE 118-bus power system, respectively.
In the above six subgraphs, the red circles, tagged as “−1” correspond to the undetectable data; the green pluses, denoted as “+1”, represent the detectable data. Lines marked “B” indicate boundaries; the letter “sv” denotes the support vector, represented as a blue pentagram. As described above, the initial data for the simulations are obtained from the MATPOWER case files. Using multiple cycles of calculation, a large amount of training and test data can be obtained. These data are mainly divided into two categories. One is attack vector data, and the other is sensor measurement data. In the above six subgraphs, the abscissa data is the calculated attack vector data, and the ordinate data is the calculated sensor measurement data. Both attack vector and sensor measurement data can be subdivided into two categories. The first is undetectable, and the other is detectable, and they can be derived from Equations (25) and (27), respectively.
Neither machine learning method can perfectly separate the two types of data. In addition, in [32], three indicators were provided to measure the learning abilities and memorization properties of the machine learning methods. These three indicators are Precision (Prec), Recall (Rec), and Accuracy (Acc), which are defined as:
The literature [32] also provided the connotations of these three indicators. When the branch reactance disturbance ratio changes from 0.8 to 1.2, the change in these three indicators for IEEE 14-bus, 30-bus, and 118-bus power systems is shown in Figure 10.
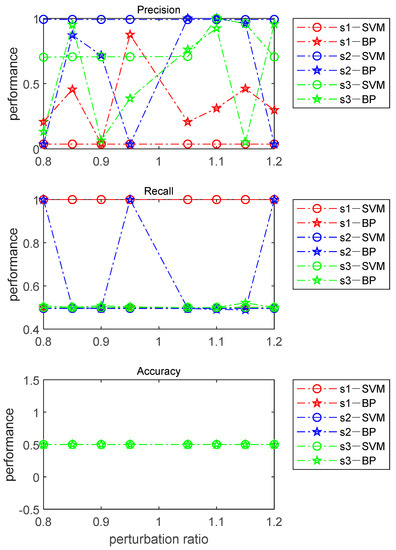
Figure 10.
Fluctuations in the three index values when the disturbance ratio changes from 0.8 to 1.2.
Based on the connotations of these three indexes, Figure 10 shows that both machine learning methods are powerless to detect undetectable CCPAs. As accuracy measures the total classification performance of algorithms, this value is invariable, regardless of the selected perturbation ratio and which machine learning method is utilized.
6.5. Detectable CCPAs When the Susceptances of at Least One Branch in Any of the Alternate Paths between the Two Endpoints of a Tripped Branch Changes before a Physical Attack
6.5.1. Computing the Detection Rate via the General Mathematical and Statistical Method
We elaborately designed simulation strategies 10, 12, and 14 and simulation strategies 11, 13, and 15. The principle of simulation strategy 10 is the same as that of simulation strategies 12 and 14. In strategy 10, line is disconnected, as are . By looking at Figure 2, we can see whether the susceptances of lines are simultaneously perturbed before a physical attack. Although the attacker knows the susceptance of line , the attacker must not know the phase angle difference between nodes 6 and 13 based on Equation (14). According to the detection principle, the CCPA could be detectable. However, the result of simulation strategy 10, as shown in Figure 11, is almost 0.05, which indicates the CCPA is undetectable. The reason for this is the use of the original sensor measurement expression. After adopting the modified expression, the simulation result is correct, and the detection rate is constant at 1. In fact, the principle of the specific measurements of simulation strategies 12 and 14 is consistent with that of simulation strategy 10. Equation (14) is used in both strategies 12 and 14. Therefore, the results of the latter two strategies are both almost 0.05. Similarly, after Equation (27) is used, both of the results in simulation strategies 13 and 15 indicate that the CCPAs are detectable, which is correct. As shown in Figure 11, the detection rate is almost 0.96 for the IEEE 30-bus system; the detection rate monotonically increases from 0.7 to 0.869.
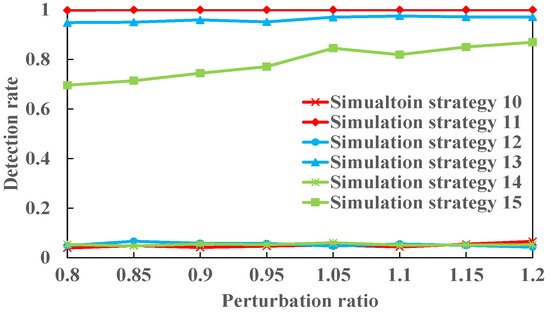
Figure 11.
The detection rates in simulation strategies increase from 10 to 15 when the perturbation ratio increases from 0.8 to 1.2.
6.5.2. Computing the Detection Rate via the General Mathematical and Statistical Method
Based on the concept described in Section 6.4.2, the SVM and BP algorithms are also used to detect undetectable CCPAs when considering simulation strategies 10–15 with a disturbance reactance ratio of 1.2; the obtained simulation results are shown in Figure 12.
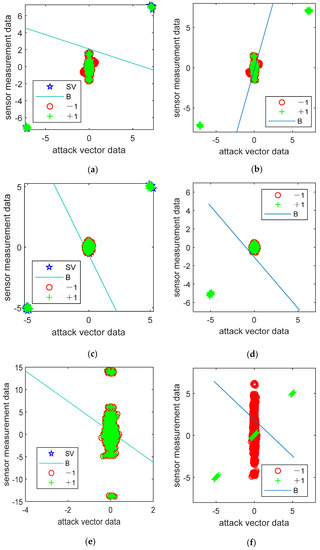
Figure 12.
The performance of machine learning methods in the detection of undetectable CCPAs (a,c,e), utilizing SVM, and (b,d,f), utilizing BP, for an IEEE 14-bus power system, an IEEE 30-bus power system, and an IEEE 118-bus power system, respectively.
The meaning of each subgraph letter in Figure 12 is exactly the same as that in Figure 9. The coordinates of the six subgraphs in Figure 12 have the same meaning as those of the six subgraphs in Figure 9. For simulation strategies 10–15, both machine learning methods are ineffective. Similarly, corresponding to simulation strategies 10–15, when the branch reactance disturbance ratio changes from 0.8 to 1.2, the changes in precision, recall, and accuracy for IEEE 14-bus, 30-bus, and 118-bus power systems are shown in Figure 13.
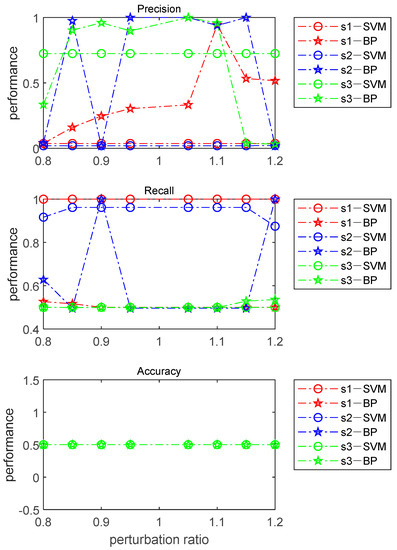
Figure 13.
Fluctuation in the three index values when the disturbance ratio changes from 0.8 to 1.2.
As shown in Figure 13, the detection effectiveness of the two machine learning methods when used to detect undetectable CCPAs is quite similar to the results shown in Figure 10. The value of the accuracy indicator remains constant, which will lead to an undesirable performance of the two methods for simulation strategies 10–15.
6.6. Component Index of the Unique Non-Zero Entry in the Supplemental Stator Factor
We designed simulation strategies 16, 18, and 20, whose detection principles are the same, and simulation strategies 17, 19, and 21, whose detection principles are also the same. In simulation strategy 16, the tripped branch is , and the susceptances of lines were perturbed before a physical attack. As is shown in Figure 2, the attacker cannot acquire the phase angle difference between nodes 6 and 13 based on Equation (14). If the modified sensor measurement expression is used, the CCPA should be detectable. The specific measures in simulation strategy 16 are nearly the same as those in simulation strategy 17. The difference is that the component index of the unique non-entry in is different. The former’s index is either 5 or 12, which corresponds to a bus index of bus 6 or 13, respectively; then, the latter’s index belongs to the collection , which excludes 5 and 12. As is seen in Figure 14, both of the simulation results are quite different. The result in strategy 16 is almost 1; however, the result in strategy 17 is almost 0.05, which illustrates the correctness of the component index of the non-zero entry in This is closely related to the correctness of the detection result. Even if the CCPA should be detectable in principle, if the component index is wrong, the opposite conclusion is reached.
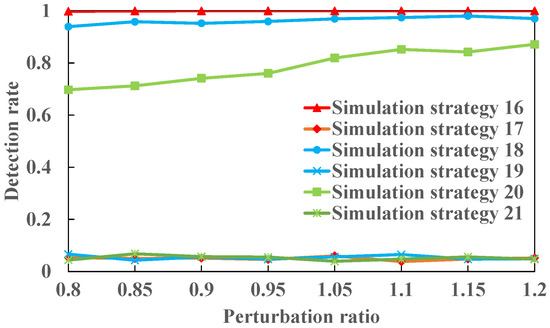
Figure 14.
The detection rates in simulation strategies 16–21 when the perturbation ratio increases from 0.8 to 1.2.
In principle, the relation between simulation strategies 18 and 19 and the relation between simulation strategies 20 and 21 are both consistent with the relation between simulation strategies 16 and 17. As the disconnected line is in the simulation strategy 18 and the disconnected line is , , the component index is either 13 or 14 in the former simulation and either 24 or 71 in the latter simulation. The former detection rate is nearly 0.96; the latter detection rate monotonically increases from 0.7 to 0.87.
6.7. Value of the Unique Non-Zero Entry in the Supplemental Stator Factor
We designed simulation strategies 22, 23, and 24. In fact, strategy 22 is a continuation of strategy 16. A new measure is added to the former. That is, the value of the unique non-zero term monotonically increases from 0 to −0.2, which is referred to in the original data from MATPOWER.
As shown in Figure 15, all the detection rates monotonically increase when the value of the unique non-zero term of decreases from 0 to −0.2. If the value is around zero, all the detection rates are less than 0.2. When the value is −0.15, the detection rate for the IEEE 14-bus system is near 1. The detection rate for the IEEE 30-bus system is 0.8 and is 0.54 in the last system. When the value is −0.18, the three detection rates are 1, 0.96, and 0.78, respectively, which can meet the detection requirements. In simulation strategies 16, 18, and 20, all the values are only −0.18. Of course, if the value is less than −0.12, all the detection rates are near 1, which is not necessary. A value of −0.18 is appropriate.
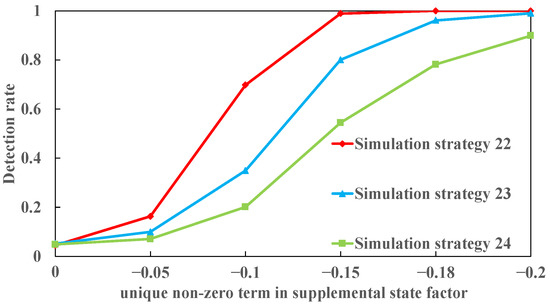
Figure 15.
The detection rates in simulation strategies 22–24 when the value of the unique non-zero term in the supplemental state factor decreases from 0 to −0.2.
6.8. Analysis of Results
We proposed a non-zero element in the supplemental stator factor xs for the modified sensor measurement expression. Then, the initial magnitude of the non-zero element derives from the MATPOWER toolbox. After repeated exclusion simulations, the value of the non-zero term is finally determined, which is implemented as shown in Figure 6.
Moreover, two main forms of detection against covertly malicious cyber-attacks have been proposed in recent years. One method utilizes the statistical properties of sensor measurement data to detect cyber-attacks; another is based on the machine learning concept. Using the characteristics and research status of these two methods, the effectiveness of the first method in terms of feasibility, convenience, and stability is much better than that of the latter. For example, considering the second method, a large amount of data should be obtained; then, after training and testing the data, a net with perfect performance is likely to be acquired. Finally, the net can be utilized to detect cyber-attacks. However, when the net is not available, the detection process is hard to carry out, as our work confirms. Certainly, in the first approach, the BDD judgment mechanism is the specific implementation scheme. When constructing a specific BDD judgment formula, the meaning and data source of each quantity must be clear and true, which means that it is difficult to construct a reasonable BDD judgment formula. A BDD judgment that can detect new synchronous covert attacks and undetectable CCPAs has rarely been proposed. In our work, a BDD judgment formula that is mainly based on the modified sensor measurement expression is explicitly proposed for the first time. Our method is still based on the statistical nature of these data. As long as the data in other cases have certain statistical properties, the method proposed in our work is fully available.
7. Conclusions
In the paper, we present a novel approach to detecting CCPAs in the context of MTD post-activation. We conducted an in-depth analysis of the mechanism of undetectable CCPAs when the MTD technique is applied and proposed a modified sensor measurement expression, appended as a supplementary state factor. To verify the correctness of this approach, we carefully designed 24 simulation strategies for an IEEE 14-bus system, an IEEE 30-bus system, and an IEEE 118-bus system. These 24 simulation strategies constructed a complete simulation scenario, which not only proved the correctness of this new method but also presented the construction characteristics of the supplemental state factor. The simulation results illustrate the simplicity and validity of the method presented in this paper.
Author Contributions
Conceptualization and methodology J.Y.; software, J.Y.; validation, J.Y. and Q.L.; formal analysis, J.Y. and Q.L.; writing—original draft J.Y.; writing—review and editing, Q.L. All authors have read and agreed to the published version of the manuscript.
Funding
This research received no external funding.
Institutional Review Board Statement
Not applicable.
Informed Consent Statement
Not applicable.
Data Availability Statement
The original data used to support the results of this study are from MATPOWER.
Acknowledgments
The authors would like to thank all the editors and anonymous reviewers for their careful reading and insightful remarks.
Conflicts of Interest
The authors declare no conflict of interest.
References
- Deng, R.; Zhuang, P.; Liang, H. CCPA: Coordinated cyber-physical attacks and countermeasures in smart grid. IEEE Trans. Smart Grid 2017, 8, 2420–2430. [Google Scholar] [CrossRef]
- Lakshminarayana, S.; Belmega, E.V.; Poor, H.V. Moving-target defense against cyber-physical attacks in power grids via game theory. IEEE Trans. Smart Grid 2021, 12, 5244–5257. [Google Scholar] [CrossRef]
- Zhou, M.; Liu, C.; Jahromi, A.A.; Kundur, D.; Wu, J.; Long, C. Revealing vulnerability of N-1 secure power systems to coordinated cyber-physical attacks. IEEE Trans. Power Syst. 2022, 38, 1044–1057. [Google Scholar] [CrossRef]
- Li, Z.; Shahidehpour, M.; Alabdulwahab, A.; Abusorrah, A. Bilevel model for analyzing coordinated cyber-physical attacks on power systems. IEEE Trans. Smart Grid 2015, 7, 2260–2272. [Google Scholar] [CrossRef]
- Shepard, D.P.; Humphreys, T.E.; Fansler, A.A. Evaluation of the vulnerability of phasor measurement units to GPS spoofing attacks. Int. J. Crit. Infrastruct. Prot. 2012, 5, 146–153. [Google Scholar] [CrossRef]
- He, Y.; Mendis, G.J.; Wei, J. Real-time detection of false data injection attacks in smart grid: A deep learning-based intelligent mechanism. IEEE Trans. Smart Grid 2017, 8, 2505–2516. [Google Scholar] [CrossRef]
- Habibi, M.R.; Baghaee, H.R.; Dragičević, T.; Blaabjerg, F. Detection of false data injection cyber-attacks in DC microgrids based on recurrent neural networks. IEEE J. Emerg. Sel. Top. Power Electron. 2021, 9, 5294–5310. [Google Scholar] [CrossRef]
- Habibi, M.R.; Baghaee, H.R.; Dragičević, T.; Blaabjerg, F. False data injection cyber-attacks mitigation in parallel DC/DC converters based on artificial neutral networks. IEEE Trans. Circuits Syst. Ⅱ Exp. Briefs 2021, 68, 717–721. [Google Scholar] [CrossRef]
- Sayghe, A.; Anubi, O.M.; Konstantinou, C. Adversarial examples on power systems state estimation. In Proceedings of the IEEE Power Energy Society Innovative Smart Grid Technologies Conference (ISGT), Washington, DC, USA, 17–20 February 2020; pp. 1–5. [Google Scholar]
- Li, B.; Lu, R.; Xiao, G.; Li, T.; Choo, K.K.R. Detection of false data injection attacks on smart girds: A resilience-enhanced scheme. IEEE Trans. Power Syst. 2022, 37, 2679–2692. [Google Scholar] [CrossRef]
- Xiahou, K.; Liu, Y.; Wu, Q.H. Decentralized detection and mitigation of multiple false data injection attacks in multiarea power systems. IEEE J. Emerg. Select. Top. Ind. Electron. 2022, 3, 101–112. [Google Scholar] [CrossRef]
- Divan, D.; Johal, H. Distributed FACTS—A new concept for realizing grid power flow control. IEEE Trans. Power Electron. 2007, 22, 2253–2260. [Google Scholar] [CrossRef]
- Morrow, K.L.; Heine, E.; Rogers, K.M.; Bobba, R.B.; Overbye, T.J. Topology perturbation for detecting malicious data injection. In Proceedings of the ICSS—2012 45th Hawaii International Conference on System Sciences, Maui, HI, USA, 4–7 February 2012; pp. 2104–2113. [Google Scholar] [CrossRef]
- Davis, K.R.; Morrow, K.L.; Bobba, R.; Heine, E. Power flow cyber attacks and perturbation-based defense. In Proceedings of the IEEE SmartGridComm, Taiwan, China, 5–8 November 2012; pp. 342–347. [Google Scholar] [CrossRef]
- Rahman, M.A.; Al-Shaer, E.; Bobba, R.B. Moving target defense for hardening the security of the power system state estimation. In Proceedings of the First ACM Workshop on Moving Target Defense, Scottsdale, AZ, USA, 3 November 2014; pp. 59–68. [Google Scholar] [CrossRef]
- Lakshminarayana, S.; Yau, D.K.Y. Cost-benefit analysis of moving-target defense in power grids. IEEE Trans. Power Syst. 2020, 36, 1152–1163. [Google Scholar] [CrossRef]
- Liu, C.; Wu, J.; Long, C.; Kundur, D. Reactance perturbation for detecting and identifying FDI attacks in power system state estimation. IEEE J. Sel. Top. Signal Process. 2018, 12, 763–776. [Google Scholar] [CrossRef]
- Tian, J.; Tan, R.; Guan, X.; Liu, T. Enhanced hidden moving target defense in smart grids. IEEE Trans. Smart Grid 2018, 10, 2208–2223. [Google Scholar] [CrossRef]
- Zhang, Z.; Deng, R.; Yau, D.K.Y.; Cheng, P.; Chen, J. Analysis of moving target defense against false data injection attacks on power grid. IEEE Trans. Inf. Forensics Secur. 2019, 15, 2320–2335. [Google Scholar] [CrossRef]
- Liu, B.; Wu, H. Optimal D-FACTS placement in moving target defense against false data injection attacks. IEEE Trans. Smart Grid 2020, 11, 4345–4357. [Google Scholar] [CrossRef]
- Zhang, Z.; Deng, R.; Cheng, P.; Chow, M.-Y. Strategic protection against FDI attacks with moving target defense in power grids. IEEE Trans. Control Netw. Syst. 2021, 9, 245–256. [Google Scholar] [CrossRef]
- Zhang, Z.; Tian, Y.; Deng, R.; Ma, J. A Double-benefit moving target defense against cyber–physical attacks in smart grid. IEEE Internet Things J. 2022, 9, 17912–17925. [Google Scholar] [CrossRef]
- Chen, Y.; Lakshminarayana, S.; Teng, F. Localization of coordinated cyber-physical attacks in power grids using moving target defense and deep learning. In Proceedings of the SmartGridComm, Singapore, 25–28 October 2022; pp. 387–392. [Google Scholar] [CrossRef]
- Liu, Y.; Ning, P.; Reiter, M.K. False data injection attacks against state estimation in electric power grids. In Proceedings of the ACM Conference of Computer and Communications Security (CCS), Chicago, IL, USA, 9–13 November 2009; pp. 21–32. [Google Scholar]
- Deng, R.; Xiao, G.; Lu, R. Defending against false data injection attacks on power system state estimation. IEEE Trans. Ind. Inform. 2015, 13, 198–207. [Google Scholar] [CrossRef]
- Giani, A.; Bitar, E.; Garcia, M.; McQueen, M.; Khargonekar, P.; Poolla, K. Smart grid data integrity attacks. IEEE Trans. Smart Grid 2013, 4, 1244–1253. [Google Scholar] [CrossRef]
- Zhao, J.; Mili, L.; Wang, M. A generalized false data injection attacks against power system nonlinear state estimator and countermeasures. IEEE Trans. Power Syst. 2018, 33, 4868–4877. [Google Scholar] [CrossRef]
- Lin, H.; Kalbarczyk, Z.T.; Iyer, R.K. RAINCOAT: Randomization of network communication in power grid cyber infrastructure to mislead attackers. IEEE Trans. Smart Grid 2018, 10, 4893–4906. [Google Scholar] [CrossRef]
- Yang, Q.; Li, D.; Yu, W.; Liu, Y.; An, D.; Yang, X.; Lin, J. Toward data integrity attacks against optimal power flow in smart grid. IEEE Internet Things J. 2017, 4, 1726–1738. [Google Scholar] [CrossRef]
- Zhou, Y.; Cheng, G.; Zhao, Y.; Chen, Z.; Jiang, S. Toward proactive and efficient DDoS mitigation in IIoT systems: A moving target defense approach. IEEE Trans. Ind. Inform. 2021, 18, 2734–2744. [Google Scholar] [CrossRef]
- Li, B.; Xiao, G.; Lu, R.; Deng, R.; Bao, H. On feasibility and limitations of detecting false data injection attacks on power grid state estimation using D-FACTS devices. IEEE Trans. Ind. Inform. 2019, 16, 854–864. [Google Scholar] [CrossRef]
- Ozay, M.; Esnaola, I.; Vural, F.T.Y.; Kulkarni, S.R.; Poor, H.V. Machine learning methods for attack detection in the smart grid. IEEE Trans. Neural Netw. Learn. Syst. 2016, 27, 1773–1785. [Google Scholar] [CrossRef] [PubMed]
Disclaimer/Publisher’s Note: The statements, opinions and data contained in all publications are solely those of the individual author(s) and contributor(s) and not of MDPI and/or the editor(s). MDPI and/or the editor(s) disclaim responsibility for any injury to people or property resulting from any ideas, methods, instructions or products referred to in the content. |
© 2023 by the authors. Licensee MDPI, Basel, Switzerland. This article is an open access article distributed under the terms and conditions of the Creative Commons Attribution (CC BY) license (https://creativecommons.org/licenses/by/4.0/).