Abstract
In the 5G era, the amount of network data has grown explosively. A large number of new computation-intensive applications have created demand for edge computing in mobile networks. Traditional optimization methods are difficult to adapt to the dynamic wireless network environment because they solve the problem online, which is not suitable in edge computing scenarios. Therefore, in order to obtain a mobile network with better performance, we propose a network frame with a resource allocation algorithm based on power consumption, delay and user cooperation. This algorithm can quickly realize the optimization of a network to improve performance. Specifically, compared with heuristic algorithms, such as particle swarm optimization, ant colony algorithm, etc., commonly used to solve such problems, the algorithm proposed in this paper can reduce some aspects of network performance (including delay and user energy consumption) by about 10% in a network dominated by downlink tasks. The performance of the algorithm under certain network conditions was demonstrated through simulations.
1. Introduction
1.1. Research Motivation
As communication technology enters the 5G era, a large number of new mobile applications have appeared simultaneously. The traffic in mobile networks has also increased significantly. In the future, there will be more user devices and data from computation-intensive applications in the networks. Traffic will continue to increase as the networks develop [1]. Correspondingly, increased traffic and more complex apps mean that more time and energy will be required for processing. Meanwhile, the consumption of time and energy with applications running will significantly affect the performance of applications, and even entire networks.
In most mobile networks, communication facilities are powered by the grid [2]. Compared with battery-powered user devices, these facilities are less sensitive to energy consumption during network working. However, for most user devices, the impact of energy consumption during the running of applications is critical. For example, if people had to carry a large-capacity power bank when using smart phones, the portability of mobile devices would be greatly reduced. Therefore, reducing the energy consumption of mobile devices when running computation-intensive apps is an important topic in current research [3]. In addition to the energy consumption of user devices, some 5G applications also have very strict requirements for delays in service delivery, for instance, telesurgery, automatic driving, VR [4], etc. Obviously, a common requirement for these applications is to reduce the time required for application processing as much as possible. Generally, such applications require a large amount of computing power; thus, users’ mobile devices cannot independently complete the computation and analysis of massive data via local computing. Therefore, in order to solve a series of problems brought by the exponential growth in access and requirements of user devices [5], and to improve network performance in scenarios where cloud computing is not applicable, researchers proposed mobile edge computing (MEC) in 5G scenarios a few years ago. So-called MEC allocates computing power close to users; at this time, user devices are only responsible for data transmission and result visualization.
1.2. Research Objectives and Problem Statement
The MEC standard was first proposed by the European Telecommunications Standards Institute (ETSI) in 2014. MEC is a better solution for computation-intensive applications in mobile networks because it can reduce the pressure of user devices and improve the performance of the network. The MEC server is the core of MEC. Users only need to upload their requirements and wait for the server to send the result back. This pattern of computing enhances the ability of user devices to run applications. It is also more secure and faster than cloud computing [6]. In this way, apps can be processed with a lower delay and energy consumption, thus improving network performance [7].
As a popular topic in current mobile communications research, edge computing can help in the following scenarios: firstly, for on-demand services on public transport, such as services where users ask for video-on-demand on airplanes or trains via their internal networks; secondly, in telesurgery, which also has high requirements for communication delay and reliability—in this application, edge computing can also reduce data transmission in the network, thereby keeping sensitive data confidential, such as the real-time status of patients’ bodies [8]. In addition, in some other scenarios, including the industrial Internet of Things (iIoT) [9], VR/AR interactive video and live broadcasts [10], MEC can also reduce delay and improve users’ experiences [11].
With MEC technology, the allocation of communication resources will significantly affect its performance [12]. The problem studied in this work is how to realize the allocation of network resources more quickly and accurately to improve the quality of the MEC network. Conceivably, this is a dynamic optimization problem. The architecture of mobile networks is diverse. Therefore, in order to make our research more targeted, we assumed a MEC network consisting of one server and users in multiple cells. In addition, the majority of tasks in the network were downlink tasks. The resource allocation capability of a MEC network will significantly affect its quality. As a mobile network with a distributed structure, there are a large number of heterogeneous resources in the network, the server locations are relatively scattered and the power consumption of devices is also constrained [13]. In addition, bandwidth is the most valuable resource in all networks. Thus, with the development of a network, the explosive growth in the amount of data also requires the network to make full use of every spectrum resource. In short, the resource allocation ability of the network affects the effectiveness of its resources and the quality of service (QoS).
There are considerable differences between resource allocation and other optimization problems associated with MEC networks. In a 5G network, network fluctuation is fast and substantial [14,15]; thus, conventional optimization methods may not help. On one hand, with the expansion in network scale, the definition domain of the objective function expands, and the complexity of the optimization problem also increases sharply. In addition, the large number of heterogeneous resources in the network also introduces challenges in resource allocation [16]. Due to the time-varying property of mobile networks, traditional optimization algorithms must update the problem and iterate again according to each different network condition and user demand. This introduces redundant computation and extra delay. There are many new 5G applications, and optimization is also more complex than before. Therefore, the performance of conventional optimization methods may be poor [17]. On the other hand, traditional algorithms cannot solve the cooperation problem of multiple sub-networks well. The bond of all network components needs to be tighter. Usually, the exchange of network information is realized through real-time data transmission. There will be a large amount of data streams in the network, which is likely to cause network congestion and increase the delay and energy consumption of application processing. In this case, MEC cannot solve the problem of cloud computing, as network performance will be damaged due to poor dynamic resource allocation. Therefore, in MEC, a dynamic, intelligent and fast wireless resource allocation strategy is an important prerequisite for excellent network performance. As a popular and practical technology in recent years, machine learning has brought significant economic benefits to the production process of many industrial departments [18]. It can make decisions about resource allocation efficiently. At present, relevant research mainly includes studies on learning mechanisms and the use of big data [19]. MEC networks contain a large amount of data from devices; thus, machine learning is very helpful for resource allocation in MEC networks. Generally, we can analyze the data in the wireless network, optimize the network and even provide instructions for the devices. Machine learning can greatly improve the QoS by abundant training. In the field of optimization, one of the most popular machine learning methods is reinforcement learning (RL) [20].
1.3. Related Works and Research Gap
At present, research on machine learning for MEC network optimization is focused on two main areas, one of which is direct optimization based on historical data in the network. For example, one study [3] proposed a network optimization algorithm based on single-cell edge computing. A task offloading strategy for wireless mobile networks assisted by UAVs was shown in another study [5]. Reference [7] describes a resource allocation method based on deep reinforcement learning in 5G ultra dense networks. Another study [16] put forward a deployment and task allocation method for a server reinforcement learning framework in a multi-access edge computing scenario. In addition, the authors of [21] proposed a federal learning mechanism under data-security-sensitive conditions. The other research focus is the discussion of spatial and temporal correlations in data and the prediction of unknown parameters based on historical network status. For example, one study [3] demonstrated a method for network prediction under the condition of unknown user status, as well as network optimization. Another study [22] investigated the prediction of network parameters and network optimization using a hybrid artificial neural network. It can be seen from the literature that many researchers have tried to use machine learning to promote the performance of MEC. However, there are still some deficiencies in the current research. Firstly, with an increase in network scale, the complexity of optimization increases and the time required for optimization is also significantly extended. It is still necessary to make this decision-making process more efficient. Secondly, it is worthwhile to carry out more research about the relevance of network data. On this basis, a corresponding network framework should be proposed to achieve this function. Subsequently, researchers can discuss how users can help further optimize the mobile network through mutual cooperation. Briefly, the content of this paper includes a service scenario for the MEC network and the cooperation of users in the network. Specifically, the network frame includes one MEC server providing service to users in multiple cells (mainly downlink tasks). Cooperation between users can optimize resource allocation by saving resources and allowing for task coordination, further improving network performance.
1.4. Research Contributions and Paper Structure
To solve the problem discussed above, i.e., resource allocation in MEC networks considering user cooperation, this paper will provide a fast and accurate solution for wireless communication resource allocation in MEC networks. The promotion of resource allocation ability by user cooperation will also be discussed. As mentioned above, the innovation of this paper includes putting forward a network frame that can achieve user cooperation, introducing a user cooperation mechanism in MEC resource allocation and explaining why this mechanism can help. We will present our conclusions after the problem introduction, network modeling, optimization problem description, function design, algorithm introduction, simulation and analysis. In this way, a solution for rapid resource allocation in the scenario of ‘one MEC server serving users in multi-cells’ and a mechanism called user cooperation for the further promotion of network resource allocation performance are explained. According to our final results, with the user cooperation considered, network quality can be improved by about 10%, at most.
2. Materials and Methods
2.1. Preliminary Knowledge
2.1.1. Introduction of the Problem
As shown in Figure 1, this paper considers a MEC network frame consisting of a single server serving multiple cells where the user’s request and conditions are known. In this network, the MEC server cooperates with all cell base stations to provide service to M users in these cells through N independent communication resources. Each user device has a certain local computing capacity and ability to communicate with the server. The network uses the strong computing power of the MEC server to help users run their apps. In this way, the MEC network realizes local–edge collaborative working with low delay and power consumption. Users communicate with the base station through the wireless network, and base stations communicate with the server via wired communication.
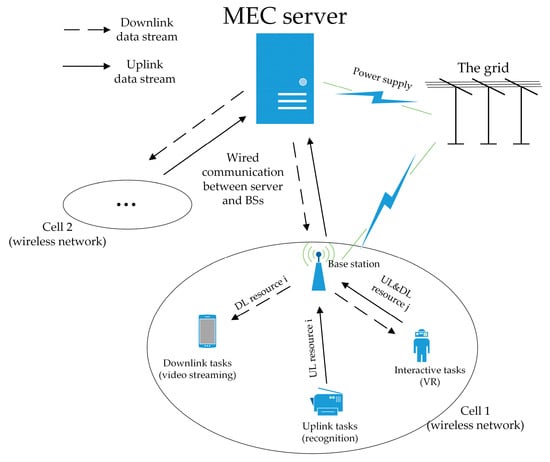
Figure 1.
Optimization problem scenarios.
There are three kinds of tasks in this problem, including uplink tasks, such as fingerprint recognition; downlink tasks, such as video streaming; and interactive tasks, such as VR service. Currently, downlink traffic accounts for the majority of network traffic. Sometimes, it even accounts for 90% of the total. Conceivably, further consideration of the properties of downlink tasks may be helpful for optimization.
In this problem, the result of resource allocation is mainly determined by the energy consumption of user devices and the delay of the network. The total energy consumption is the sum of the energy consumption for all computing and data transmission. The network delay is composed of two main parts: namely, the delay from user devices to the base station and the delay from the base station to the MEC server. For simplicity, this paper postulates that public communication facilities have an inexhaustible energy supply because they are powered by the grid. In addition, another prerequisite assumption is that these facilities have an extremely high transmission capacity. Based on this, only the energy consumption of user devices and the delay of data transmission between user devices and the base station should be considered.
According to this problem, this paper will subsequently describe the generation of the transmission, delay and energy consumption models for the downlink, uplink and interactive tasks. For downlink tasks, the user usually sends a relatively short request; then the MEC server will compute, compress and downlink transmit the corresponding content after receiving the request. It is predicted that the traffic of multimedia downlink services will account for the vast majority of network traffic in the future. For uplink tasks, users upload acquired data to the MEC server via their devices. Then, before sending the result back, the MEC server must process this content according to the data stored by itself. Generally, the result is relatively short and the downlink transmission pressure is very low. For interactive tasks, the network needs to satisfy users’ demands for online real-time interaction. This kind of task requires the MEC server to complete real-time information collection upon request by user devices and then quickly send the interaction content to the user. Thus, the server and user will both conduct frequent data transmission. To summarize, users, communication facilities, different kinds of tasks and various heterogeneous communication resources together form a MEC network, as shown in Figure 1; i.e., one server serves multiple cells.
2.1.2. Introduction of Model Components
- Transmission model
This paper assumes that in a MEC network, the server uses the orthogonal frequency division multiple access (OFDMA) protocol to allocate network resources. Here, the number of users is M, the uplink and downlink channels have N independent resources and every channel has an equal bandwidth W. Thus, the transmission capacity provided by uplink resource i and downlink resource j between user device m and the base station can be expressed as follows:
where um,i and dm,j, respectively, indicate whether resources i and j are allocated to user m, with 1 and 0 representing allocated/non-allocated status, and vm,i and wm,j represent the transmission power of uplink resource i and downlink resource j. In order to simplify the model and the simulation of a practical scenario, power allocation is not continuous here. It is divided into G gears for selection. In addition, hm,i and hm,j represent the gain on the channels. This model operates under two assumptions. Firstly, the channel gain during edge computing only changes between adjacent time slots. The denominator of the logarithm term is the variance of additive white Gaussian noise. In addition, the channel is quasi-static in each millisecond time slot because of the strict delay requirement in the MEC network.
After obtaining the transmission capacity provided by each channel from Formulas (1) and (2), the total transmission capacity of each user can be obtained using the following equations:
In these formulas, the four vectors um, vm, dm and wm are the vectors of the uplink resource allocation, uplink power allocation, downlink resource allocation and downlink power allocation of user m, respectively. Taking um as an example, um = [um,1 um,2 … um,N]; others are the same.
- Delay model
In this model, based on the conditions of the network frame, a necessary assumption is that all users serially, independently and almost synchronously send their requests. Within each time slot, each user requests only one task with no mutual interference. Thus, the delay of the three kinds of tasks can be modeled as follows:
For a downlink task, the user sends a request for content stored in the network. After receiving the content, the MEC server performs pre-processing, such as encoding and compression, on the corresponding data. Finally, the server will transmit this content to the user via allocated downlink channels. In this task, the user’s request is generally very short; thus, the model does not have to consider its related items. The delay can be expressed as:
where Fs is the CPU frequency of the MEC server; indicates the number of CPU cycles required by the MEC server to compute this kind of task (per bit); Bm represents the task bytes requested by user m; and c is the compression ratio of the content after pre-processing. The terms on the right-hand side represent the computation time of the server processing the task and the time required for the downlink transmission.
For an uplink task, the user’s device collects data and uploads them to the server after local computation and encoding. Then, the server processes the data and sends the corresponding result to the user. In this kind of task, the model assumes that the computation capacity of the MEC server is much larger than that of user devices. The returned result is usually very small in terms of bytes. Therefore, the time required for server computation and the time for result transmission can be removed from the model. This delay can be expressed as:
In Equation (6), Fm is the CPU frequency of the user’s device; is the number of CPU cycles required by the user’s device to compute this kind of task (per bit); Bm denotes the task bytes for user m; and c is the compression ratio of the data. The two terms on the right-hand side represent the delay resulting from local computation and the delay associated with the uplink transmission of data.
The last kind of task is the interactive task. In this kind of task, both uplink and downlink transmission should be considered. The MEC server first obtains real-time data from users via their mobile devices. Then it performs real-time processing and transmits specific data required by users according to the feedback obtained. Obviously, these kinds of MEC tasks require task segmentation, cooperation between the server and user and frequent uplink and downlink data transmission. The delay associated with this kind of task is expressed as follows:
In Formula (7), μm is the task segmentation ratio representing the proportion of the task that is locally processed by the user’s device; Fm is the CPU frequency of the device; and are the number of CPU cycles required by the user’s device and the MEC server to process this kind of task (per bit ); Bm represents the task bytes requested by user m; and c is the compression ratio. In the ‘max’ function, the first term is the delay of local computation. The second term is the sum of three components: i.e., the delay for uploading the edge-computed portion of the task, the delay for server computation and the delay for downlink transmission. For simplicity, the user’s local computing and edge computing are parallel; thus, the delay can be expressed as the larger of the two.
- Energy consumption model
In order to alleviate the conflict between the battery capacity of mobile devices and application performance, the user’s energy consumption should also be considered in the model for optimization. Generally speaking, when communicating, the energy consumption of the system should contain at least three components: namely, the energy consumption for device standby, data transmission and computation. In addition, for different kinds of tasks, the expressions of these three terms are also different.
For downlink tasks, since the model assumes that the communication facilities are powered by the grid, the energy consumption of the base station and server is not considered. Generally, requests for downlink tasks only contain a small amount of data. Therefore, the energy consumption of such tasks is equal to the standby energy consumption of the mobile device. In multiple equal and small time slots, standby energy is only related to the intrinsic parameters of devices. Thus, this energy consumption can be expressed by Ps, a constant; i.e.,
For uplink tasks, energy consumption usually includes device standby consumption, local computing consumption and data transmission consumption. Thus, it can be expressed as:
In the equation, η is the factor of energy consumption, equal to 3.44 × 10⁻²³. The first term in the equation is the standby consumption of the mobile device. The consumption of local computation is represented by the second term. The last term is the uplink transmission consumption, which is equal to the product of transmission power and time.
For interactive tasks, generally, the task is processed by local and edge computing at the same time. Therefore, the energy consumption of a task can be expressed as the sum of device standby consumption, local computing consumption and uplink transmission consumption:
The meaning of terms in Equation (10) will not be repeated.
- User cooperation model
User cooperation is used to promote the optimization of wireless networks. In some scenarios, the network will have to process a large number of requests for one or some specific downlink tasks; for example, video-on-demand services on trains and planes, or when a video is popular in a specific region within a certain period of time. In this case, the server can send the same or similar content to multiple users together by collecting specific information in user requests, which can effectively reduce traffic in the network and promote network optimization. This can not only make the model converge faster but can also effectively save communication resources and improve the performance of the optimized network.
To solve this problem, a necessary assumption is that the number of popular videos is small; thus, the above problem can be solved by adding a short identifier to the request sent by users. The paper further postulates that the identifier has K bits in total, where k1 bits indicate the kind of task (uplink, downlink or interactive task). The rest of the k2 bits are used to represent the index of the specific task. The size of the content transmitted by the user should be:
This model brings two benefits to optimization: It can make the best use of network resources and compress the exploration space of the algorithm. The former can significantly reduce the network transmission delay, while the latter can simplify the optimization problem and improve the final results.
This paper assumes a network dominated by downlink tasks, and where the number of different tasks is relatively small. Thus, it is unwise to process the same or similar requests for tasks separately, as this will waste precious bandwidth resources. After considering the user cooperation model, these similar tasks can be processed together to achieve a higher transmission rate with the original bandwidth. Let us take two homogeneous downlink tasks as an example to explain this concept. Suppose that two independent users, m1 and m2, submit requests for similar downlink tasks. Recall in Equation (4), if user cooperation is not considered, the maximum transmission delay of two users is expressed as:
where Bcontent is the size of the transmitted content and Dm1 and Dm2 are the transmission rates of the two users. Meanwhile, considering the user cooperation integrating these tasks, the transmission delay becomes:
Since the transmission rate in the model must be greater than 0, delay2 must be less than delay1; i.e., the transmission delay is reduced. For more complex networks and task scenarios, the above proof still applies.
In addition to reducing the network transmission delay, user cooperation can also compress the exploration space of the algorithm by mapping the state parameters of optimization from independent users to specific tasks, thus reducing the complexity of optimization problems and improving the optimization quality of network delay and user energy consumption. This is discussed in more detail in Section Introduction of Qlearning Components.
In conclusion, before optimization, the server can first check all similar tasks in the network according to users’ requests. In this way, the exploration space of the algorithm will be compressed, and the network resources will be also used more reasonably.
Based on the above sub-models, the overall model of the problem is shown in Figure 2. In the figure, Ps is the standby energy consumption and Pc&t represents computation and transmission energy consumption. Users in the blue dashed box are in the same cell.
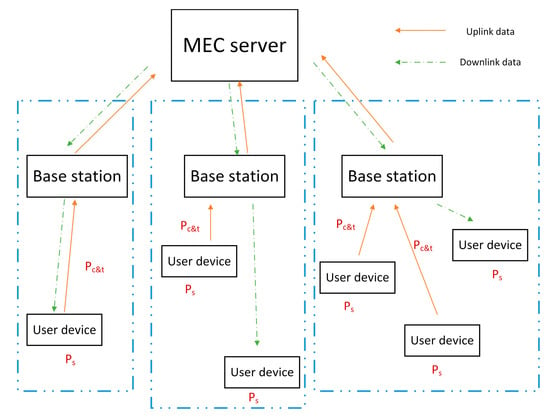
Figure 2.
Overall model of optimization problem.
2.2. Description of Optimization and Algorithm
2.2.1. Description of Optimization Problem
According to the above sections, the objective of this paper is to provide an efficient resource allocation algorithm for MEC networks that supports varied services and communication resources and reduces the delay and energy consumption of users’ applications, this achieving the optimization of resource allocation in the MEC network. The optimization problem can be defined as a function related to delay and energy consumption at the same time. Here, we use the following function to minimize delay and energy consumption:
subject to:
In the objective function (14), γt and γe are the normalized weight coefficients whose summation is 1, and their values indicate the sensitivity of the MEC network to the optimization of delay and energy consumption; M is the number of users; m is the specific user’s index; N is the number of resources; i and j are the indexes of the specific resource; and U, D, V, W and X represent the uplink resource allocation matrix, downlink resource allocation matrix, uplink power allocation matrix, downlink power allocation matrix and identifier matrix, respectively, where U = [u1 u2 … uM]T and D, V and W are similar to U. The identifier xm = xk1 × k2, which is used for user cooperation in the network, corresponds to matrix X = [x1 x2 … xM]T. Thus, the optimization problem is finally expressed as a function of minimizing the weighted sum of delay and energy consumption. The independent variables of this function include U, D, V, W and X. The first term is the delay term, which represents the largest delay in the network, and the second term is energy consumption, which is the total energy consumption of the network.
Considering the practical network, the optimization process should be restricted by some conditions. First, (15) is the restriction on the kind of task. The user’s request must belong to one of the three kinds mentioned above: namely, downlink task (1), uplink task (2) or interactive task (3). Then, (16) is the restriction on the resource allocation status, where 0 and 1 represent non-allocated and allocated status, respectively. Further, (17) and (18) are the conditions of the identifier. Suppose that the identifier xm of user m is composed of xk1 and xk2. xk1 represents the kind of task (2 bits in total) and xk2 indicates the index of the specific task (log2Ktask bits in total), where Ktask is the number of different tasks of that kind. The fifth restriction (19) ensures each uplink and downlink resource can only be allocated to one user in the same time slot. The last condition, (20), is the power constraint on user devices and the base station. In order to fully mobilize the resources in the network, the transmission power of each resource should be less than the respective power limit. Thus, the uplink transmission is less than Pul and the downlink transmission is less than Pdl.
This optimization problem involves discrete variables, including allocation status and the number of bytes, and continuous variables such as transmission power. If the model tries to solve this problem by means of conventional algorithms for optimization, because of the frequent network change between adjacent time slots, the algorithm must iterate again after every change, which will result in more extensive computation operations, larger delays and worse optimization performance. This will undoubtedly lead to a waste of MEC resources. Therefore, low iterations and a low complexity resource allocation algorithm will greatly improve the ability of a MEC network to quickly match multi-dimensional resources and multiple kinds of tasks.
2.2.2. Algorithm Architecture
Obviously, the optimization problem in this paper is a mixed integer and nonlinear problem. In addition, conventional optimization algorithms cannot adapt to the time-varying property of MEC networks. In the following sections, how to train the network by reinforcement learning and how to simplify the model and accelerate the learning process according to the identifier provided by the user under certain network conditions will be introduced. When the optimized network is working, the MEC server can perform resource allocation directly according to the current users’ tasks and network conditions. Thus, the iteration delay is eliminated, and network resource allocation is also further improved.
Introduction of Qlearning Components
First, it is important to clarify the reason for using Qlearning (QL). When solving dynamic optimization problems, QL has some advantages over commonly used heuristic algorithms. First, QL is better at processing a large amount of network historical data. It can also evaluate the quality of the obtained strategies more easily. Second, the amount of data used by QL is relatively small. QL can quickly obtain the solution to a problem, especially when the solution is related to past experience. Thus, the algorithm has strong adaptability to the environment. Third, using QL can realize the offline training and optimization of the network, which is especially suitable for wireless networks and other scenarios that experience dramatic changes. Finally, compared with the more complex DQN algorithm, QL has a theoretical guarantee of convergence and more easily obtains the solution.
Figure 3 shows a schematic diagram of reinforcement learning. In the figure, St is the current state. For each state of the agent, the algorithm will select an action according to the preset rules. Then the agent obtains the corresponding reward (rt) and jumps to the next state St+1 according to the environment. After several episodes, the algorithm will eventually converge on the decision or path with the maximum total reward, i.e., the optimal solution.
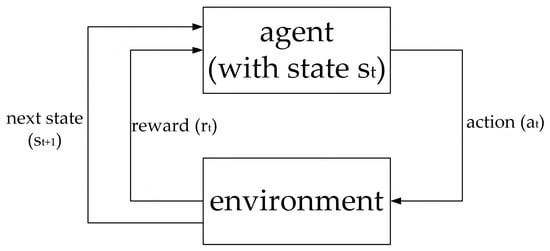
Figure 3.
Schematic diagram of Qlearning.
By matching the reinforcement learning model with each component of the optimization problem, it is conceivable that the centralized reinforcement learning agent is the MEC server. The action space includes four sub-spaces, namely the U, V, D and W matrices. Thus, A = [U V D W]. In particular, due to the extra burden associated with continuous variables in solving problems, it is necessary to discretize the power allocation action, i.e., assume that the power can be divided into G gears. Therefore, the elements in the V and W matrices must yield to this condition:
On this basis, the state will be expressed as the task corresponding to the maximum delay in the network, which can facilitate a more purposeful optimization of the network. According to the index of the current state, the optimal allocation scheme of this network is obvious. The index of the state is equivalent to the index of different tasks in the opinion of user cooperation. Conceivably, user cooperation can help compress the state space according to these indexes. Finally, for each process of action selection and state transfer, since the objective is to minimize the delay and energy consumption, the value of the reward function should be negatively correlated with the value of objective function, as follows:
where c1 and c2 are two constants and ‘wsf’ is the weighted sum function shown in Equation (14). In this way, the larger reward represents a smaller value of objective function and better network performance.
Introduction of Exploration Strategy, Iteration Process and Parameters
The following section discusses some portions of QL, an algorithm for reinforcement learning. In each loop of the QL algorithm, the MEC server first selects a feasible action from the action space according to the current state. After the server performs this action, the state changes accordingly. The server will record the reward and update the corresponding term in the Q table. Obviously, in the process of algorithm implementation, there are two important mechanisms, namely exploration and updating of the Q table.
The random exploration strategy is an important part of exploration. In order to ensure that all feasible actions can be selected by the MEC server with a non-zero probability and the probability of the current optimal solution is always higher than others, the Bozeman exploration is adopted. The mathematical expression of the random exploration strategy is as follows:
According to this equation, the probability of a specific action being selected under each state is obtained by a fraction. Its numerator is the exponential term of a certain element in the Q table and its denominator is the sum of all exponential terms in this state. In addition, θ is the ability of action differentiation.
The rule for updating the Q table is also important. Each time the MEC server receives a reward, its corresponding term in the Q table must be updated. Usually, the Berman equation of reinforcement learning can be used as the rule for updating the Q table:
where α is the learning efficiency of the agent, the value of which affects the convergence speed and optimization results of the model, and γ is the discount of the impact of future rewards on the current state. A larger value indicates that the model pays more attention to long-term benefits, and vice versa. is a term in the Q table that corresponds to the optimal action of the next state sk+1 with the prerequisite that the current action is ak.
Algorithm pseudocode
The pseudocode of algorithm is depicted in the following Algorithm 1.
| Algorithm 1 Pseudocode for Qlearning algorithm with user cooperation |
| Input: state and action space, network conditions, initialized reward R = 0, training episodes K Output: optimal resource allocation strategy
|
The algorithm operates under the prerequisites that the MEC server knows the network conditions completely, resource allocation is entirely observable and all actions are interconnected. In addition, in this model, the network state at the next moment is only related to the current state and the action performed. Therefore, the Qlearning problem can be modeled as a Markov decision model.
At the beginning of the algorithm, the MEC server needs to initialize the Q table and randomly select the initial state s0. After obtaining the network state sk, the server determines the optimal action by searching the maximum term of the current state in the Q table and calculates the strategy for action exploration. Whenever the MEC server searches the action, it will select the best action with a certain probability. At the same time, in order to ensure that the server always maintains exploration behavior during the learning process to avoid falling into local optimums, the MEC server will also select a random action according to the strategy π with another certain probability. After performing the selected action, the MEC server will obtain the reward based on the change in network performance. Finally, the next state sk+1 is determined according to the change in network state.
2.2.3. Complexity Analysis of Algorithm
Theorem 1.
The algorithm complexity is O(actions). In the worst case, the algorithm needs to traverse all possible actions. The total number of actions is . The first term on the right-hand side is the number of actions in uplink resource allocation and the second term is the number of actions in uplink power allocation. The next two terms represent downlink resource allocation and downlink power allocation, respectively.
Proof of Theorem 1.
According to the above sections, it is obvious that in the action subspace of uplink and downlink resource allocation, there are M independent users and N independent communication resources in the network. Therefore, there are M different possibilities for the allocation of each resource; i.e., MN is the size of this action subspace. As for the action subspace of power allocation, its size is determined by the number of resources and the number of power gears. Clearly, each independent resource can arbitrarily choose the gear power. Thus, the result is GN. The number of actions in this model must yield the above equation. □
3. Results
3.1. Simulation Parameters and Conditions
At first, this paper must clarify some important parameters used in the simulation. These parameters are listed in the Table 1.

Table 1.
Important simulation parameters.
The simulation described in this paper was based on the pycharm platform; therefore, all programs were written in Python. The structure and components of the QL algorithm used in the simulation are described in Section 2.2.2. Its core structure is shown in Figure 3. All states and rewards were recorded in the Q table. The specific architecture of the algorithm is shown in Figure 4. The Monte Carlo method was used to evaluate algorithm performance. In order to show the performance of the algorithm, the simulation results represent the average of a large number of experiments.
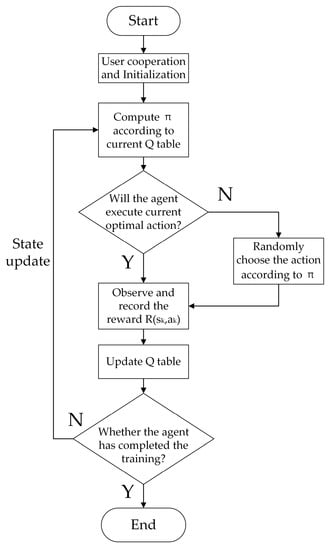
Figure 4.
Algorithm flow chart.
3.2. Illustration and Evaluation of Algorithm Performance
In order to show the advantages of the proposed algorithm, we compared its performance with some heuristic optimization algorithms. Each algorithm experienced the same network change in the simulation. Between every two changes, the network model was trained or iterated a certain number of times.
In the following figures, QL and co-QL represent the QL algorithm and QL with user cooperation considered, respectively. ACO, DE, PSO and SA denote the ant colony optimization algorithm, differential evolution algorithm, particle swarm optimization algorithm and simulated annealing algorithm, respectively. These heuristic algorithms were taken for comparison because they are typical and efficient. After continuous research and promotion, these algorithms have shown high efficiency and good performance in solving dynamic optimization problems [23,24,25,26]. Therefore, this simulation compared their performance with QL to illustrate the advantages of reinforcement learning compared with heuristic algorithms in solving dynamic optimization problems. The benchmark in the following figures is the result corresponding to the greedy algorithm with random exploration. This algorithm has the advantages of being simple and fast; however, it is easy to get trapped in a local optimal result.
Figure 5 illustrates the convergence speed of the various algorithms in solving optimization problems. The abscissa in Figure 6 represents the iteration turn of the algorithm, and the ordinate is the value of the objective function corresponding to the current optimization result. It can be seen that the convergence speed of QL was only inferior to that of the particle swarm optimization algorithm; however, its optimization result was better. This disadvantage in convergence speed can be compensated by offline training; thus, in most cases, QL has better convergence speed. In a practical network, heuristic algorithms are feasible only when the network fluctuation is small. In the case of obvious network fluctuation, the objective function of the whole network may change significantly, which will make the heuristic algorithm invalid. However, QL is good at dynamic optimization and can adapt well to these network changes. In addition, the convergence speed of QL was further improved and the final optimization result was also better after adopting the view of user cooperation.
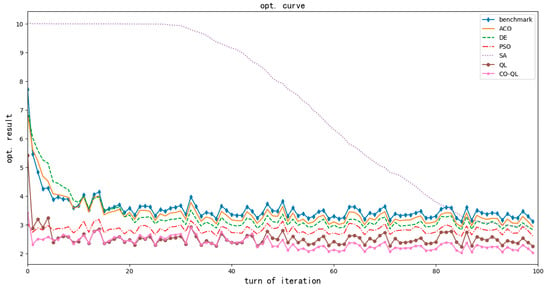
Figure 5.
Comparison of convergence speed of algorithms.
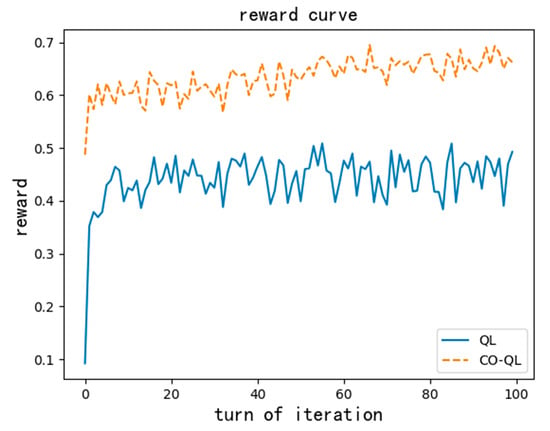
Figure 6.
Reward functions of the two QL algorithms.
Figure 6 shows the reward curve of the two QL algorithms. The abscissa represents the iteration turn, and the ordinate is the average reward of the current turn. It can be seen that QL can realize a rapid increase in rewards and eventually converge on a stable result; thus, this algorithm is effective. In addition, from the above two figures, comparing the QL algorithms with and without user cooperation, the one with user cooperation had a better convergence performance. Since the number of tasks in the network is reduced by user cooperation during optimization, it is obvious that the QL with cooperation will obtain more rewards and converge on a better result than the one without cooperation.
In order to further analyze the dynamic performance of the QL algorithm in solving optimization problems and explain the functions of user cooperation, including making the best use of network resources and compressing the exploration space of the algorithm, we used the above algorithms to solve several dynamic optimization problems under different conditions of M, N, G, etc. By observing the final result of optimization, the following results were obtained. In particular, for the model described in this paper, the delay is composed of the computation delay and transmission delay. Here, the computation delay depends only on the device itself, which will not change during the simulation. The change in total network delay already reflects the change in network transmission delay. Therefore, although user cooperation only reduces the transmission delay of the network, this component of delay is no longer illustrated separately in the simulation but is represented in the image of network delay.
Figure 7 shows the impact of changing the number of users in the optimization algorithms. From left to right, the three curves are the objective function curve corresponding to the optimization result, the delay curve and the energy consumption curve. The abscissa of the three figures is the number of users. The ordinates are the value of objective function (O.F.), delay and energy consumption, respectively. As shown in the optimization problem (14), the objective function consists of terms of both delay and energy. The units of delay and energy are, successively, seconds (s) and Joules (J). Another prerequisite is that all new users will request similar downlink tasks. It is known that with an increase in the number of users, networks gradually become congested. At this time, the optimization performance of the QL algorithm is better than others. The exponential growth curves can be seen in Figure 7a. With an increase in users, the value of the objective function increases more quickly. At the left portion of the curves, resources are still relatively abundant after new users access the network. From Equations (1) and (2), the transmission rate and the number of network resources form a logarithmic relationship; thus, the excess resources cannot significantly improve the transmission rate. At this time, allocating network resources to new users has little impact on network performance. At the right portion of the curves, the network becomes congested gradually; thus, allocating network resources to new users now has a greater impact. This can be understood by analogy with the slope change of a logarithmic function under horizontal flipping. Next, with respect to Figure 7b,c, since the weight of delay optimization in this simulation was 0.6 (very close to 0.5), the curve changes in both figures are close to that in Figure 7a. Since the weight of delay optimization is slightly larger, the trend of the curves in Figure 7b is closer to the overall trend shown in Figure 7a. In Figure 7b, after considering user cooperation, the server can integrate the downlink tasks and reduce the impact of new access users on network delay without significantly raising energy consumption. The delay brought by new users can be mitigated by user cooperation; however, the energy consumption of new users cannot be ignored. Therefore, the curves in Figure 7c will still increase.
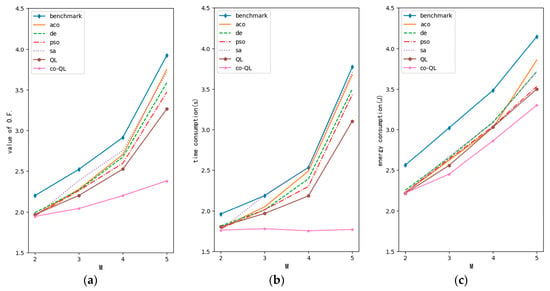
Figure 7.
Optimization performance curve with variable M (N = 5, G = 1): (a) curve for value of objective function; (b) curve for time consumption; (c) curve for energy consumption.
Figure 8 shows the impact of changing the number of independent communication resources on optimization. The content of each axis is similar to that in Figure 7. Obviously, with an increase in the number of resources, network performance improved. Meanwhile, the performance of QL was better than others. However, with a further increase in the number of resources, the improvement in network performance gradually slowed down. This is because the relation between transmission rate and the number of communication resources is not linear but logarithmic, which leads to the marginal revenue of delay optimization. In addition, the increase in energy consumption is still accelerating with the increase in resources. Therefore, reasonable planning with respect to the number of communication resources according to the number of users in the network can not only avoid the waste of resources, but also reduce the computation burden of the algorithm. Increasing the number of resources and reducing the number of access users are similar to some extent. Therefore, the trend of the curve in Figure 8a is opposite to that in Figure 7a. In Figure 8b, since the delay optimization weight is still 0.6, the trend of the curves is also similar to the overall trend shown in 8a. In addition, after increasing the number of resources, the network is no longer congested; thus, all the delay curves, including that of QL with user cooperation considered, will decline and their slopes will gradually decrease. In Figure 8c, because the transmission energy consumed by a network resource is significantly less than the energy consumption of device access and standby in the model described in this paper, the curve in this figure is flatter than that in Figure 7c.
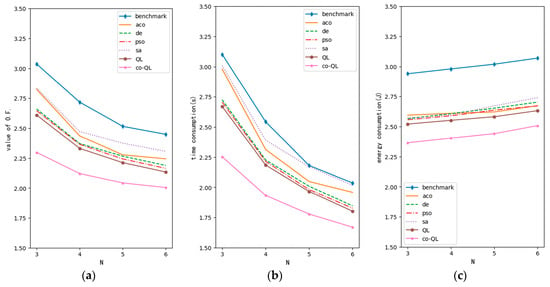
Figure 8.
Optimization performance curve of variable N (M = 3, G = 1): (a) curve for value of objective function; (b) curve for time consumption; (c) curve for energy consumption.
Figure 9 shows the effect of changing the power gears on optimization. The content of each axis is similar to that in Figure 7. With an increase in gears, there are more optional actions for allocation. Likewise, the performance of the QL algorithm was better than others. In Figure 9, the performances of the algorithms also showed considerable differences after changing the G value. QL and PSO gained some benefits from the increase in gears, but PSO was not as stable as QL. The DE algorithm was not very sensitive to the increase in G. Other algorithms could not provide stable optimization results and gradually converged on sub-optimal solutions. To summarize, the gear of power allocation depends on the performance of the individual algorithm. Blindly increasing the gears of power allocation may exceed the ability of the optimization algorithm and result in unwanted side-effects. Increasing the granularity of power allocation will significantly increase the exploration space of the optimization algorithm. In the wireless network scenario with dramatic fluctuations, the QL algorithm can increase its experience in solving problems by recording the rewards obtained, so as to find the solutions to optimization problems with a small amount of data. This is a property that other algorithms do not have. It can be seen from Figure 9a that the QL algorithm steadily gained benefits from more power allocation actions. After considering user cooperation, the algorithm can save network resources, compress exploration space and obtain better network performance. This is in line with the idea of equivalence and the compression of state space proposed in Section Introduction of Qlearning Components. It can be further seen from Figure 9b,c that the compression of the exploration space will reduce the burden of optimization and improve the optimization results with respect to delay and energy consumption.
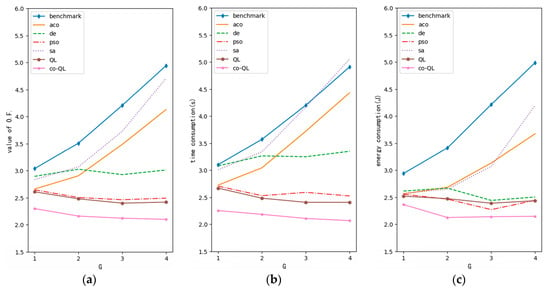
Figure 9.
Optimization performance curve of variable G (M = 3, N = 3): (a) curve for value of objective function; (b) curve for time consumption; (c) curve for energy consumption.
Figure 10 shows the impact of a different number of similar tasks on optimization. The sequence and axes of each image are similar to that in Figure 7. The abscissa refers to the number of similar tasks after considering user cooperation. In this experiment, taking a scenario of four tasks as an example, we changed the number of similar downlink tasks and observed the optimization performance of the QL algorithm. It is obvious that with the increase in task similarity, more tasks in the MEC network can be integrated and processed together. Thus, the network performance can be further improved. Considering user cooperation can significantly reduce the value of the objective function, further improve the processing speed of mobile applications and increase network optimization without introducing more energy consumption. In addition, the dotted line in the left figure illustrates the difference (magnified by a factor 5) in the optimization results before and after user cooperation. In this simulation, the tasks included similar downlink tasks and other kinds of tasks. In the model, the delay and energy consumption corresponding to downlink tasks are smaller than other kinds of tasks. Thus, as similar tasks increase and other types of tasks decrease, the objective function curves of the two QL algorithms, as shown in Figure 10a, also gradually decrease. However, QL considering user cooperation can integrate similar tasks, thereby making the best use of network resources and improving transmission rate. Observing the green dotted line, it can be seen that with the improvement in task similarity, considering user cooperation can achieve more obvious improvements in network performance. However, when the similarity exceeds a certain range, due to the logarithmic relationship between transmission rate and bandwidth, the improvement of network performance by user cooperation will fall into a bottleneck. It can be seen from Figure 10b,c that user cooperation can significantly reduce the transmission delay of the network without increasing the energy consumption burden of user devices. In conclusion, with the emergence of more similar tasks, higher performance can be achieved by user cooperation.
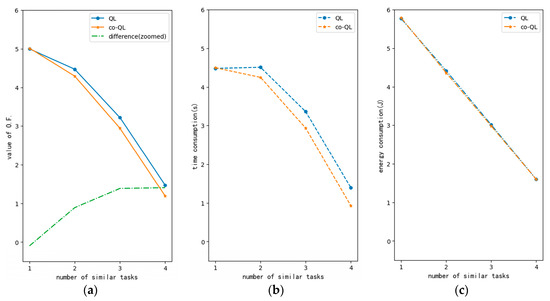
Figure 10.
Performance curve of QLs with different task similarities (M = 4, N = 4, G = 1): (a) curve for value of objective function; (b) curve for time consumption; (c) curve for energy consumption.
Figure 11 shows the changes in γt. The meaning of each axis is similar to that above. Obviously, the value of γt will not significantly affect the overall result of optimization; however, it will affect network delay and user energy consumption considerably. Specifically, when γt is small, γe is large. At this time, the objective function is very sensitive to changes in energy consumption; thus, all algorithms will focus more on the optimization of energy consumption. When γt is large, the result is opposite. In this simulation, the average delay of all actions in the model was less than the average user energy consumption. Therefore, the curve of user energy consumption changes more sharply than the delay. In addition, from Figure 11b,c, it can be seen that when the weight of delay or energy consumption is small, obvious benefits can be obtained by increasing its weight. This is because when the weight is large, although an increase in weight will still increase the corresponding term of the objective function, this increase is relatively small. For example, the delay weight increases from 0.1 to 0.3 and from 0.5 to 0.7. Both increase by 0.2, but the former increases 200% and the latter only 40%. Thus, the change is diluted. At this time, for all algorithms, it is better to distinguish the energy consumption items with great difference than to focus on distinguishing the suboptimal solution and the optimal solution with little difference in delay. The objective of optimization in this paper was the overall optimization of the network rather than the optimization of single performance. Therefore, this is reasonable.
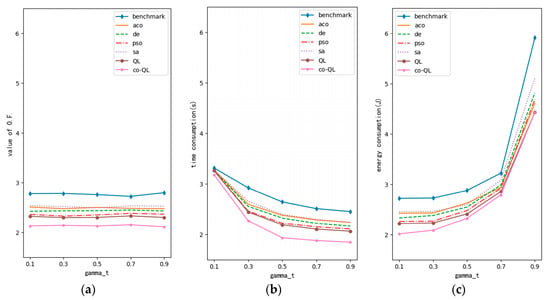
Figure 11.
Optimization performance curve of variable γt (M = 3, N = 4, G = 1): (a) curve for value of objective function; (b) curve for time consumption; (c) curve for energy consumption.
To summarize, according to the above figures and discussion, there is no doubt that user cooperation can help make better use of network resources and compress the exploration space. Both functions will result in a better network than other heuristic algorithms and conventional QL.
4. Discussion
This paper modeled an edge network in which a single server serves multiple cells by wireless communication and optimized the model according to the properties of the network under certain conditions. A QL resource allocation algorithm considering user cooperation was also adopted. To some extent, the convergence acceleration and performance promotion of network optimization was realized. The optimized wireless networks can provide faster and better MEC services.
Specifically, we adopted the QL algorithm to solve this problem. The Markov decision model was used to define the key components of the algorithm, including state, action and reward. The optimization of the MEC network was solved via user cooperation, initialization, action selection, Q table and state update. According to the simulation results, the QL algorithm performed better than traditional optimization algorithms, in terms of speed and results, in solving dynamic optimization problems. On this basis, the further optimization of the network via user cooperation and its related network frame is proposed. The simulation described in this paper showed that the algorithm considering user cooperation had better performance and could further improve the ability of network resource allocation in MEC scenarios with almost no extra cost. It was also shown that this algorithm will have obvious advantages for future networks with more downlink traffic.
In this paper, the energy consumption of public network facilities was not considered owing to the assumption that they are powered by the grid. However, in the case of severe power supply and communication conditions, this energy consumption will significantly affect network performance. For instance, for MEC networks in mountain areas, the power supply may not be easily powered by the grid. It is possible that some of these facilities are powered by battery and solar power. In addition, some networks even use UAVs to help with communication; thus, power supply and communication conditions may change considerably.
Author Contributions
Y.J. and Z.C. contributed to the conception and design of the proposed strategy. All authors wrote and edited the manuscript. All authors have read and agreed to the published version of the manuscript.
Funding
The financial support of “the Fundamental Research Funds for the Central Universities” (2021JBM001) is acknowledged.
Data Availability Statement
The authors confirm that the data supporting the findings of this study are available within the article.
Conflicts of Interest
The authors declare no conflict of interest.
References
- Song, F.; Xing, H.; Wang, X.; Luo, S.; Dai, P.; Xiao, Z.; Zhao, B. Evolutionary Multi-Objective Reinforcement Learning Based Trajectory Control and Task Offloading in UAV-Assisted Mobile Edge Computing. IEEE Trans. Mob. Comput. 2022, 18, 1–18. [Google Scholar] [CrossRef]
- Li, J. Application Mode of 5G edge computing in Industrial Internet. Ind. Control. Comput. 2022, 35, 141–143. [Google Scholar]
- Wang, S. Research on Machine Learning-Based Resource Management Technology in Mobile Edge Computing Network. Ph.D. Thesis, Beijing University of Posts and Telecommunications, Beijing, China, 10 November 2021. [Google Scholar]
- Yang, D.; Zhu, T.; Wang, S.; Wang, S.; Xiong, Z. LFRSNet: A Robust Light Field Semantic Segmentation Network Combining Contextual and Geometric Features. Front. Environ. Sci. 2022, 10, 1443. [Google Scholar] [CrossRef]
- Ng, W.C.; Lim, W.Y.B.; Xiong, Z.; Niyato, D.; Miao, C.; Han, Z.; Kim, D.I. Stochastic Coded Offloading Scheme for Unmanned Aerial Vehicle-Assisted Edge Computing. IEEE Internet Things J. 2022, 10, 71–91. [Google Scholar] [CrossRef]
- Nguyen, D.C.; Hosseinalipour, S.; Love, D.J.; Pathirana, P.N.; Brinton, C.G. Latency Optimization for Blockchain-Empowered Federated Learning in Multi-Server Edge Computing. IEEE J. Sel. Areas Commun. 2022, 40, 3373–3390. [Google Scholar] [CrossRef]
- Yu, S.; Chen, X.; Zhou, Z.; Gong, X.; Wu, D. When Deep Reinforcement Learning Meets Federated Learning: Intelligent Multi-Timescale Resource Management for Multi-access Edge Computing in 5G Ultra Dense Network. IEEE Internet Things J. 2020, 8, 2238–2251. [Google Scholar] [CrossRef]
- Guo, S.; Hu, X.; Dong, G.; Li, W.; Qiu, X. Mobile edge computing resource allocation: A joint Stackelberg game and matching strategy. Int. J. Distrib. Sens. Netw. 2019, 15, 1550147719861556. [Google Scholar] [CrossRef]
- Dai, X.; Xiao, Z.; Jiang, H.; Alazab, M.; Lui, J.C.; Dustdar, S.; Liu, J. Task Co-Offloading for D2D-Assisted Mobile Edge Computing in Industrial Internet of Things. IEEE Trans. Ind. Inform. 2022, 19, 480–490. [Google Scholar] [CrossRef]
- Chen, W.; Yang, Z.; Gu, F.; Zhao, L. A Game Theory Based Resource Allocation Strategy for Mobile edge computing. Comput. Sci. 2023, 50, 32–41. [Google Scholar]
- Li, Y. Research on Energy-Efficient and Efficient Resource Joint Optimization in Mobile Edge Computing. Ph.D. Thesis, Jilin University, Changchun, China, 1 September 2020. [Google Scholar]
- Zhu, S. Resource Optimization Problems in Mobile Edge Computing. Ph.D. Thesis, Southeast China University, Nanjing, China, 12 May 2021. [Google Scholar]
- Jiang, H.; Dai, X.; Xiao, Z.; Iyengar, A.K. Joint Task Offloading and Resource Allocation for Energy-Constrained Mobile Edge Computing. IEEE Trans. Mob. Comput. 2022, 1, 1. [Google Scholar] [CrossRef]
- Du, H.; Deng, Y.; Xue, J.; Meng, D.; Zhao, Q.; Xu, Z. Robust Online CSI Estimation in a Complex Environment. IEEE Trans. Wirel. Commun. 2022, 21, 8322–8336. [Google Scholar] [CrossRef]
- Jiang, Y.; Li, X. Broadband cancellation method in an adaptive co-site interference cancellation system. Int. J. Electron. 2022, 109, 854–874. [Google Scholar] [CrossRef]
- Mohajer, A.; Daliri, M.S.; Mirzaei, A.; Ziaeddini, A.; Nabipour, M.; Bavaghar, M. Heterogeneous computational resource allocation for NOMA: Toward green mobile edge-computing systems. IEEE Trans. Serv. Comput. 2022, 1, 1–14. [Google Scholar] [CrossRef]
- Mazloomi, A.; Sami, H.; Entahar, J.; Otrok, H.; Mourad, A. Reinforcement Learning Framework for Server Placement and Workload Allocation in Multi-Access Edge Computing. IEEE Internet Things J. 2022, 10, 1376–1390. [Google Scholar] [CrossRef]
- Jordan, M.I. Artificial intelligence—The revolution hasn’t happened yet. Harv. Data Sci. Rev. 2019, 1, 1–9. [Google Scholar]
- Malandrino, F.; Chiasserini, C.F.; Di Giacomo, G. Energy-efficient Training of Distributed DNNs in The Mobile-Edge-Cloud Continuum. In Proceedings of the 2022 17th Wireless On-Demand Network Systems and Services Conference (WONS), Oppdal, Norway, 30 March–1 April 2022; pp. 1–4. [Google Scholar]
- Meng, H. Study on Task Migration Strategy in Mobile Edge Computing. Ph.D. Thesis, Beijing University of Technology, Beijing, China, 1 May 2019. [Google Scholar]
- Guo, H. Research on the key technologies of resource allocation and data access for edge computing. Master’s Thesis, National University of Defense Technology, Changsha, China, 1 December 2019. [Google Scholar]
- Hamadi, R.; Khanfor, A.; Ghazzai, H.; Massoud, Y. A Hybrid Artificial Neural Network for Task Offloading in Mobile Edge Computing. In Proceedings of the 2022 IEEE 65th International Midwest Symposium on Circuits and Systems (MWSCAS), Fukuoka, Japan, 7–10 August 2022; pp. 1–4. [Google Scholar]
- Zhang, Y.; Hu, J. Agent model-assisted particle swarm optimization algorithm for dynamic optimization problems with high computational cost. J. Shanxi Norm. Univ. Nat. Sci. Ed. 2021, 49, 71–84. [Google Scholar]
- Jin, Y.; Wang, X. Improved Differential Evolution Algorithm for Steelmaking and Continuous Casting Dynamic Scheduling Problem. Comput. Meas. Control 2022, 30, 272–278. [Google Scholar]
- Dong, M.; Lin, B. Dynamic optimization of navigation satellite laser inter-satellite link topology based on multi-objective simulated annealing algorithm. Chin. J. Lasers 2018, 45, 217–228. [Google Scholar]
- Zhu, X.; He, Y. Energy-efficient dynamic task scheduling algorithm for wireless sensor networks. Comput. Eng. Des. 2020, 41, 313–318. [Google Scholar]
Disclaimer/Publisher’s Note: The statements, opinions and data contained in all publications are solely those of the individual author(s) and contributor(s) and not of MDPI and/or the editor(s). MDPI and/or the editor(s) disclaim responsibility for any injury to people or property resulting from any ideas, methods, instructions or products referred to in the content. |
© 2023 by the authors. Licensee MDPI, Basel, Switzerland. This article is an open access article distributed under the terms and conditions of the Creative Commons Attribution (CC BY) license (https://creativecommons.org/licenses/by/4.0/).