1. Introduction
The recent spread of electric vehicles is an ongoing trend that can be observed all over the world. According to current analyses, electric vehicles will appear in larger numbers on the roads in the near future. A main limitation considered for the greater propagation of electric vehicles is their battery, since there has not yet been a fundamental breakthrough in their development, given that the capacity and the lifetime of currently used batteries are very limited, and it results in a short driving range of the electric vehicles themselves. In order to overcome these limitations, the development of specific fast chargers is in progress, as well as the development of new charging methods of electric vehicles. Today, automotive consumers expect products tailored to their mobile information and entertainment needs, and these products should be tightly integrated in novel automotive applications such as autonomous electric car charging applications, automatic vehicle washing applications, etc. [
1,
2,
3,
4].
Expedited development of electric vehicles will increase the need for applications related to them in the future [
4,
5,
6]. Certainly, one of the basic and most momentous operations is charging the batteries of electric vehicles and why there is a need for applications related to this purpose. Since the charging of electric vehicles takes a certain amount of time, there is a need on the part of users and operators to automate this process in order to meet the needs of customers. Thus, after parking the vehicle at the charging station, the user would have no further work on charging, except for opening the charging door, as the process would be fully automated by robots and the user would be free to perform various tasks during the charging time [
7,
8]. Hence, the concept of comfort electric vehicle charging, where no human intervention is required, is very interesting to customers, and many companies have started research related to this topic. Further, automated charging will become even more pertinent in the future due to progress in autonomous car driving and driverless parking applications. In these situations, a robot will take over the whole charging process when the vehicle is parked autonomously without any human intervention. Using automation technology will indicate that the manual charging process as we currently know it will no longer be required. Naturally, the specific problems related to this application should be analyzed and solved, such as the requirement of precise parking, robot movement around the parked vehicle, the illumination conditions demanded for cameras used for charging socket detection, urgent interruption of the charging process and disconnection of the plug, etc.
This paper represents initial research within an industrial project whose goal is to develop a robotic application for the automatic charging of electric vehicles using image processing techniques. As a result, a new approach for automatic electric vehicle charging socket detection using the ZED 2i depth sensor will be proposed.
The main research task of this industrial project is the deployment of a simple image processing method supported by information from a depth sensor, and the investigation of the capabilities of the ZED 2i depth camera in the application of the automated position and tilt detection of the Combined Charging System 2 (CCS2) socket of electric vehicles. The socket extraction procedure is based on intensity transformations, simple image processing operations, and a series of morphological operations. This project is part of the 2020-1.1.2-PIACI-KFI-2020-00173 industrial project related to the development of robot-based applications for autonomous electric vehicle charging. The main demand of the project is to use well-known, already proven, and reliable image processing operations and methods to provide the smooth and dependable operation of the robot [
9,
10,
11,
12]. The generated depth map and the recorded point cloud of the scene model serve as resources for the robot to determine the exact position and the slope angles of the charging socket on electric vehicles. It should be noted that later the Universal Robot 10e (UR10e) with an included force torque sensor will be used as a robotic arm during the deployment of an autonomous charging application [
1,
2,
3].
The specific requirement of the project client was the deployment of a vision system that records the image from one position and, later, the socket region must be extracted with a much simplified, but reliable, image processing technique [
13,
14]. The ZED 2i depth sensor was embedded in the Robotic Operating System (ROS) framework via its ROS wrapper. This wrapper ensures the obtainment of real-time measurements on multiple ROS topics. A detailed description of the robot and its work is outside the scope of this paper; it will be fully depicted in a future research paper.
In the end, using the strict instructions about the simplicity and reliability of the project, a novel image processing procedure was developed for the automatic electric vehicle charging CCS2 socket detection and extraction. Thus, this initial research entirely fulfilled the aim of the project, and in the near future the testing will be extended on real electric vehicles with a camera mounted on the robot’s arm.
The contribution of this study in terms of an industrial research project is the development of a simplified and reliable image processing algorithm for the detection of a CCS2 charging socket position and its tilt angles with a depth sensor for the automated electric vehicle charging application. The utilization of well-known and common image processing operations for charging socket detection purposes is not yet published in the scientific literature, as well as in papers related to industrial research with the aim of the charging socket detection. Thus, this is a novel and, at the same time, a proven approach for solving the problem of the electric vehicle charging socket detection for a future industrial application.
The paper can be summarized as follows. The first section is the Introduction, the second section is the literature overview, and the third section introduces the ZED 2i sensor in brief. Section four describes the proposed method, section five shows the experiments and results, and section six provides the conclusion followed by suggested future works.
3. ZED 2i Depth Sensor
The following section will introduce the technology and some of the most significant properties of the ZED 2i depth sensor, along with its working principle in brief.
Fundamentally, the ZED 2i depth camera is a passive stereo camera without an active ranging appliance. This stereo device utilizes a binocular camera to generate 3D scene data, retrieves the disparity of the object and scene using a stereo matching algorithm, and in the end determinates the depth map according to the sensor parameters in millimeters (mm) [
36,
37,
38,
39,
40].
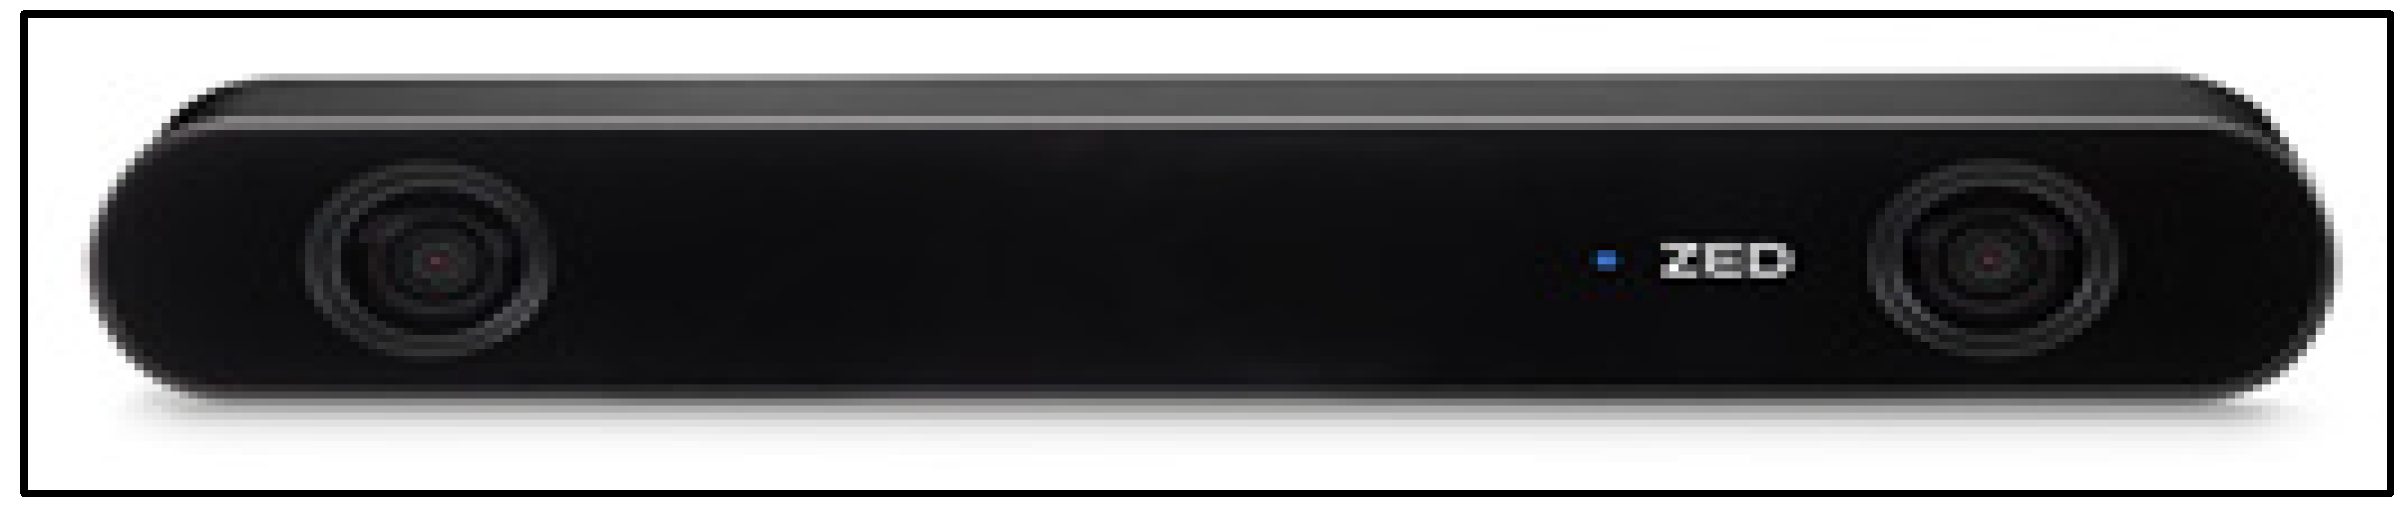
The new ZED 2i depth camera shown in
Figure 1 shares some features with other Stereolabs ZED depth cameras; nevertheless, the new ZED 2i sensor owns several important improvements [
36].
ZED 2i is the first stereo depth sensor that employs artificial neural networks (ANN) to reproduce and imitate human vision, taking stereo image perception to a new level [
36]. It has a neural network mechanism that notably enhances the recorded depth map, or depth video stream. This ANN is linked with the image digital signal processor (DSP), and jointly they yield to creating the best possible depth information [
36]. Furthermore, the ZED 2i sensor possesses an embedded shape detection framework. This framework detects both objects and shapes with spatial context. It integrates artificial intelligence (AI) with 3D localization to create spatial cognizance in the image [
36]. Moreover, the embedded skeleton tracking option is included in ZED 2i, which employs 18× body principal points for tracking applications. This method detects and tracks human body skeletons in real-time. The tracking outcome is represented via a bounding box and according to the documentation, the algorithm works up to a 10 m range.
Furthermore, the ZED 2i depth sensor possesses an improved positional tracking algorithm that is a pertinent improvement convenient for robotic applications [
12,
36]. This benefit comes from a wide 120° angle field of view (FOV), advanced sensor stack, and thermal calibration for considerably enhanced positional tracking precision and accuracy [
36]. The ZED 2i depth sensor also has an embedded inertial measurement unit (IMU), barometer, temperature sensor, and magnetometer. All these sensors supply extraordinary potentials of simple and precise multi-sensor recording. These sensors are factory calibrated on 9-axis with robots [
36]. All these sensors with its characteristics designate that the ZED 2i depth sensor is convenient for the deployment of autonomous and industrial robotic applications [
20,
21,
22,
23,
24,
25].
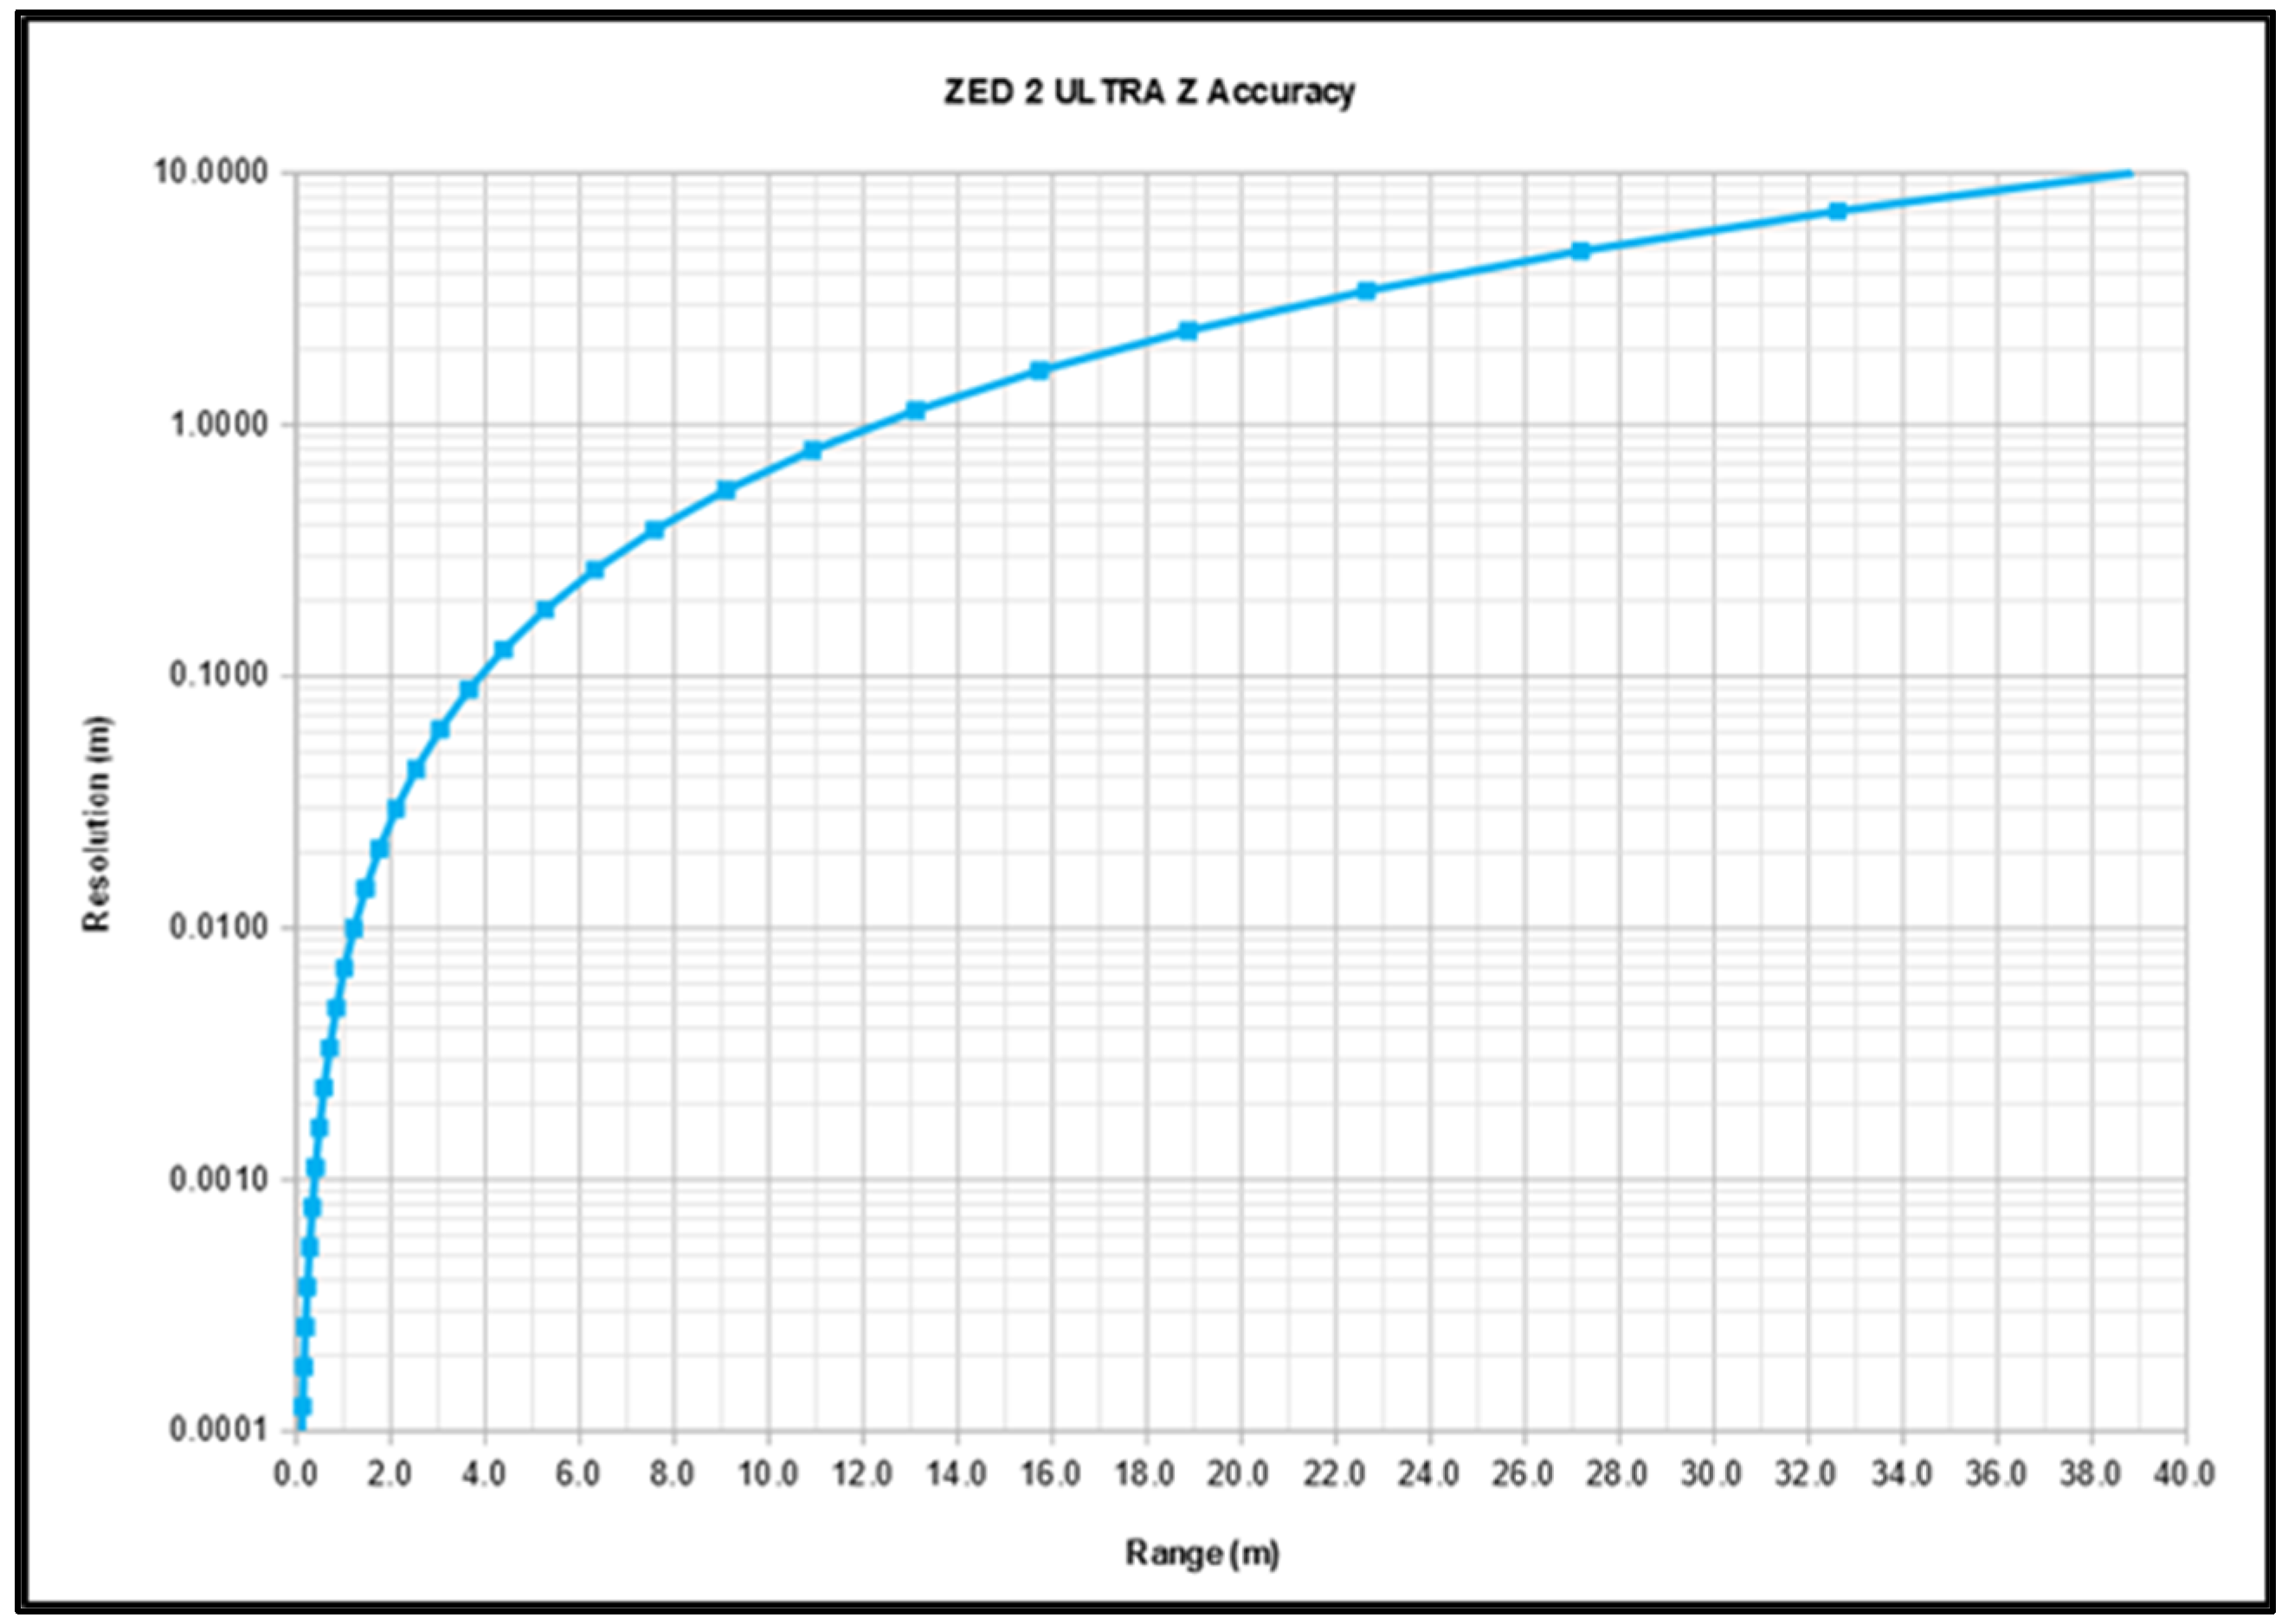
Figure 2 presents the accuracy graph of the ZED 2i depth sensor depending on the distance of an object from the depth sensor. As can be seen in the diagram, the depth resolution, i.e., the depth precision, decreases with the increasing distance [
36].
One of the most significant attributes of the ZED 2i is the ultra-sharp 8-element all glass lenses capable of grabbing video and depth with up to 120° field of view (FoV), with optically compensated distortion and a wider ƒ/1.8 aperture which permits the capture of 40% more light [
36]. Further, the ZED 2i optionally can use a polarizer. The embedded polarizing filter contributes to the highest-possible image quality in various applications outdoors. This special polarized lens helps decrease glare and reflections and also augments color depth and quality of the recorded images [
36]. Moreover, the ZED 2i stereo sensor offers two lens options: the 2.1 mm focal length lens for a wide field of view or a 4 mm focal length lens for enhanced depth and image quality at long range [
36]. These are the major characteristics related to stereo cameras since the lens, aperture, and light notably affect the image quality of any camera, not only the stereo depth camera. These properties enable the obtaining of a high-quality depth map [
36]. Further, the ZED 2i can be cloud linked, and this option provides a possibility to monitor and control the depth camera remotely. Using a particular cloud platform, depth map recording and analyzing the 3D data is possible from anywhere in the world [
36,
37].
Finally, based on the features of the ZED 2i sensor and its availability, the project’s management decided to acquire this sensor and use it in the initial research study of this industrial project.
The essential properties of the ZED 2i depth sensor are summarized in
Table 2 [
36].
4. Proposed Method
In the following section, the proposed algorithm will be described with the corresponding digital image processing operations.
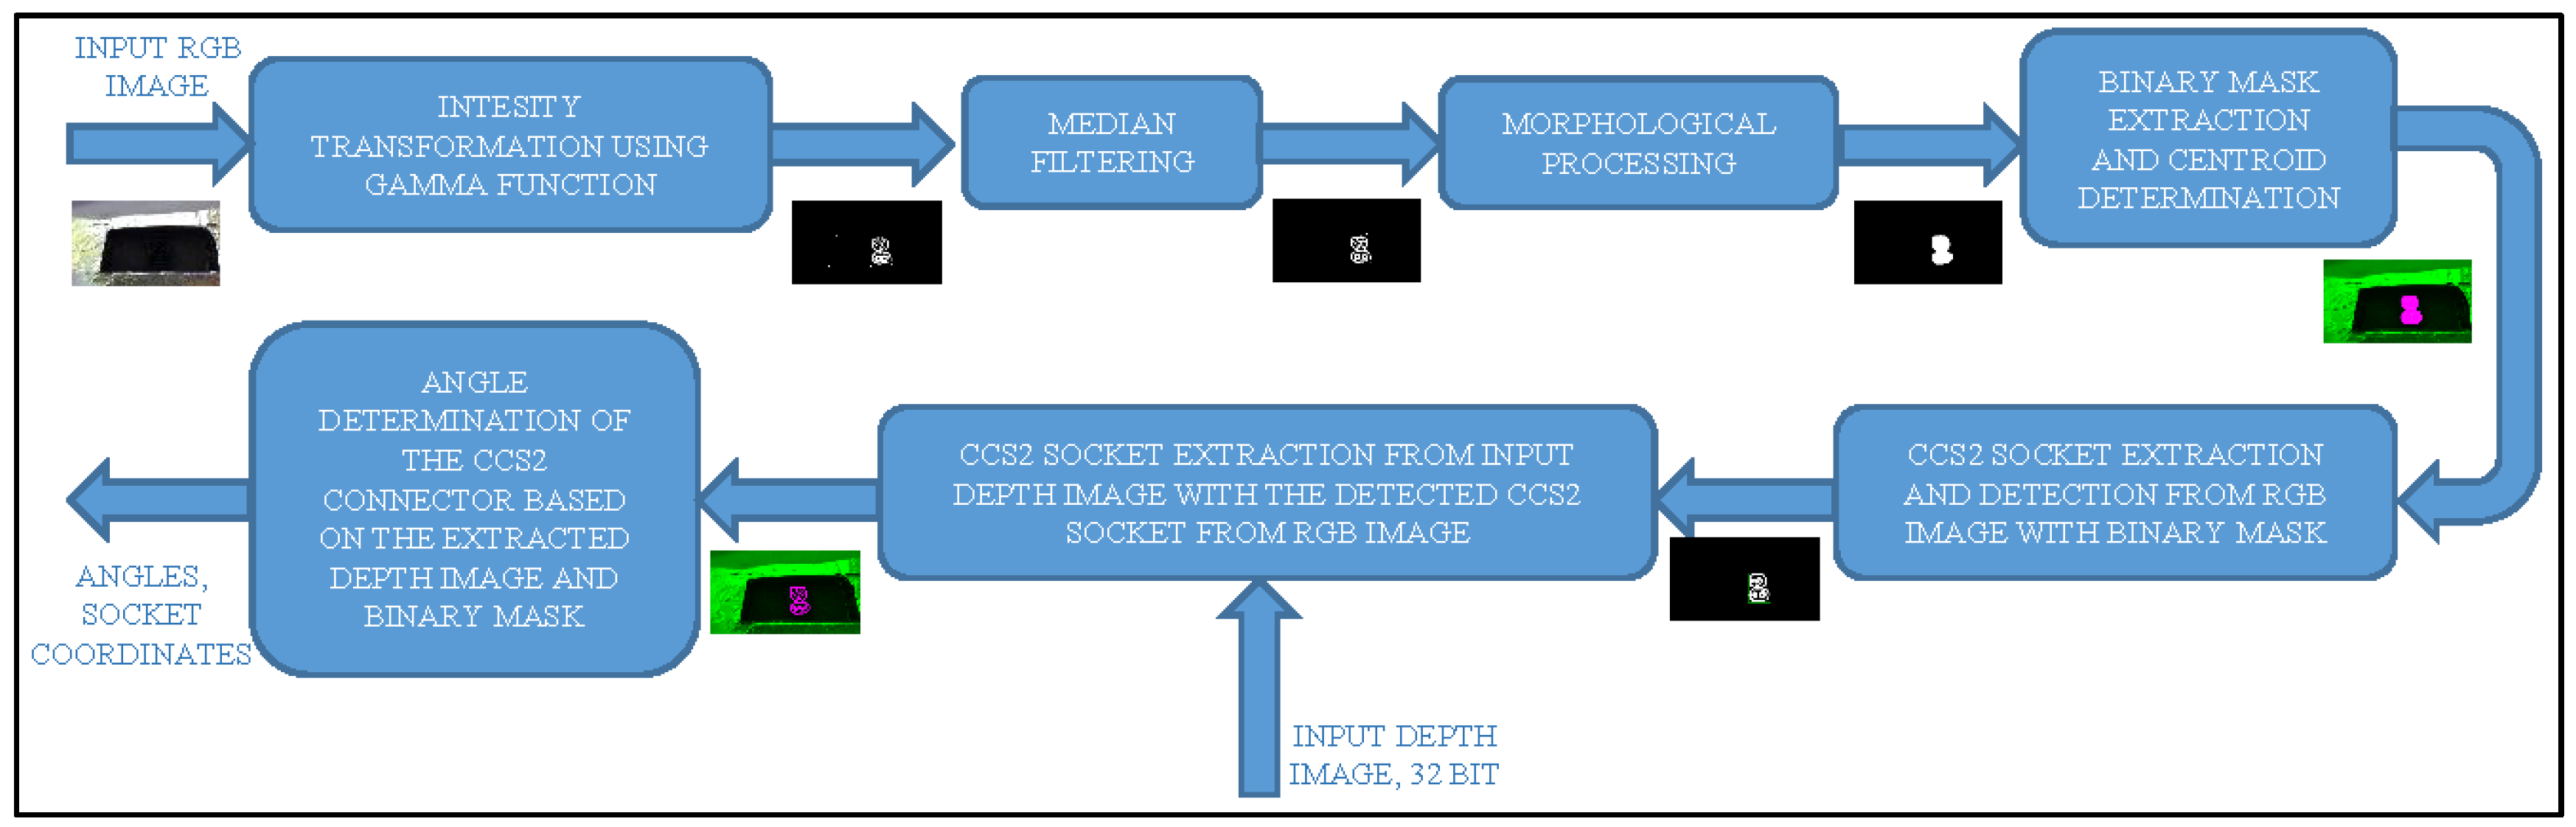
The block diagram of the proposed method is given in
Figure 3. The system has two inputs, the Red–Blue–Green (RGB) color image and the original depth image with 32-bit depth resolution. Since the image with 32-bit resolution cannot be visibly displayed, only a dark image can be seen [
36]. The main operation in this vision system is the application of the intensity transformation using the Gamma function and contrast stretching on the grayscaled input image [
13]. This is a crucial action in the algorithm because it will remove most of the unwanted surrounding image components around the CCS2 connector region. This step is followed by the median filtering in order to remove the noise from the remained surrounding elements around and inside the charging socket itself [
14]. Further, a series of morphological operations are implemented in order to obtain the binary mask of the socket area and the centroid coordinates of the socket itself [
13]. After the binary mask is formed, the CCS2 socket region is detected combining logical image operations on the thresholded and binarized RGB images with the previously obtained binary mask. Next, using the detected socket from the RGB image, the CCS2 socket area is extracted from the original depth map using logical operations [
14]. Finally, based on the detected CCS2 socket from the depth image with the corresponding depth information, and using the binary mask of the socket, the tilt angles of the socket in all three planes (XY, XZ, and YZ) were determined. Later, the obtained information would be forwarded to the UR robot’s control system in order to automatically, without human interaction, plug-in the charging plug [
9,
10,
11,
12].
A detailed explanation of the robot and control system is not within the scope of this article and is not possible at this time. The robot’s construction and the control system will be entirely described in a future research paper.
Further, the digital image processing algorithm will be described in detail through image processing examples. The recording environment and the illumination conditions will be explained later in the experiments section. It should be noted that, for the research and testing purposes, a vehicle body model was used with a built-in CCS2 socket. In the presented example, the car body model was covered with aluminum foil in order to increase the illumination reflection and artefacts appearance, which in reality would certainly appear on all vehicles due to the paintwork and environment illumination. In this way, the developed algorithm will have certain robustness to various disturbances and noise to the captured input images [
9,
10,
11].
In the beginning, it should be noted that the dimensions of the input images are 2208 × 1242 pixels [
36]. After the RGB and depth images are captured with the ZED 2i depth sensor, the second step is the conversion of the color image to a grayscale image. The reason for this conversion lies in the fact that the grayscaled image is the most suitable for processing using most image processing operations [
13].
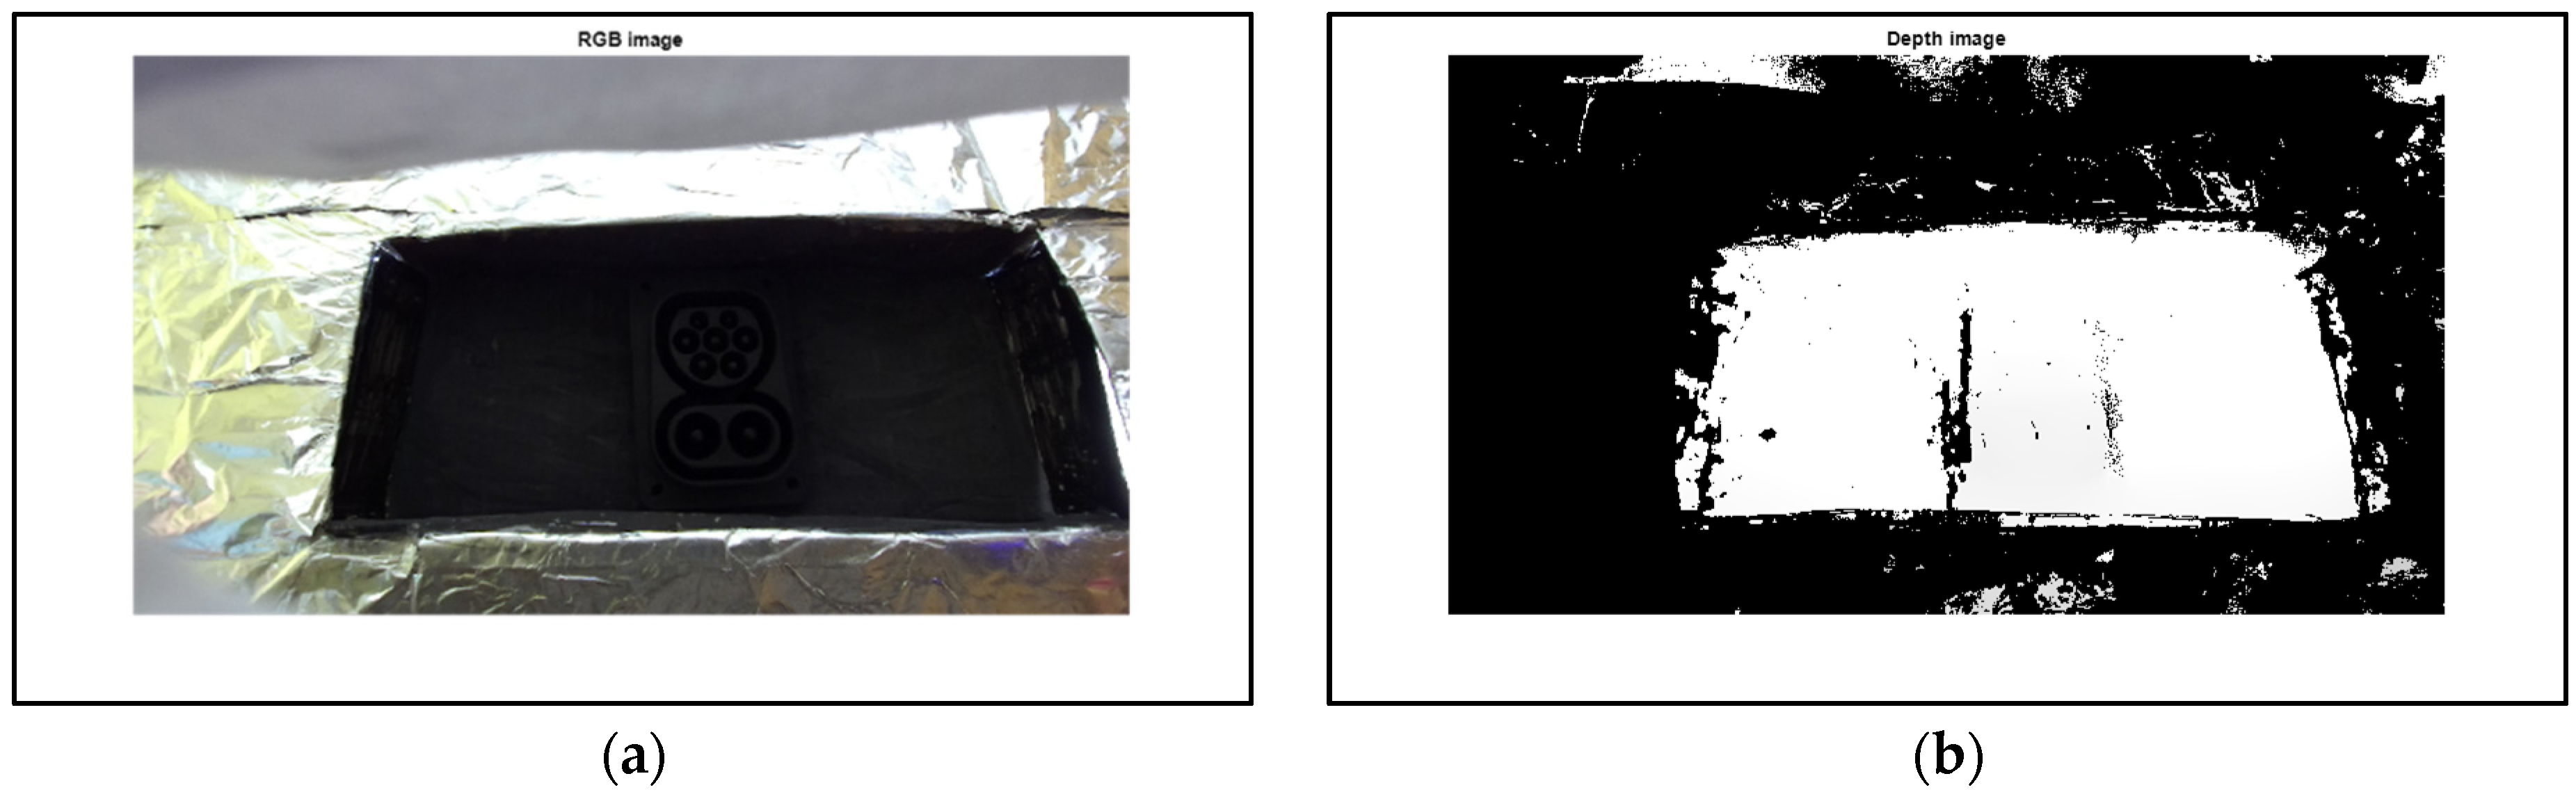
Figure 4a shows the captured RGB image. It is highly noised and contains artefacts and illumination reflection. The CCS2 connector is very poorly visible since its surrounding is very dark, as well the socket also. It is obvious from the shown RGB image that the socket detection is not a trivial task, because its textures are not visible and the surrounding regions are highly reflective and shadowed.
Figure 4b shows the grayscale version of the original input depth map converted to 8-bit resolution in order to make visible the image itself, since the original depth map in 32-bit resolution is not visible on common monitors, because only a completely black image without any details would be seen [
36]. As can be seen, the measured and generated depth map contains measured depth values in the socket region; however, due to the small difference between the depth values in the socket area, the socket is displayed in white shades and melted into its surrounding white area. Obviously, due to the impossibility of discerning the socket from its environment, the CCS2 socket cannot be distinguished and detected based only on the depth map itself [
11,
12,
36]. Thus, the socket extraction algorithm uses both the RGB and depth images for the socket detection and tilt angles determination, as it is presented with the block diagram in
Figure 3 and explained later in the paper.
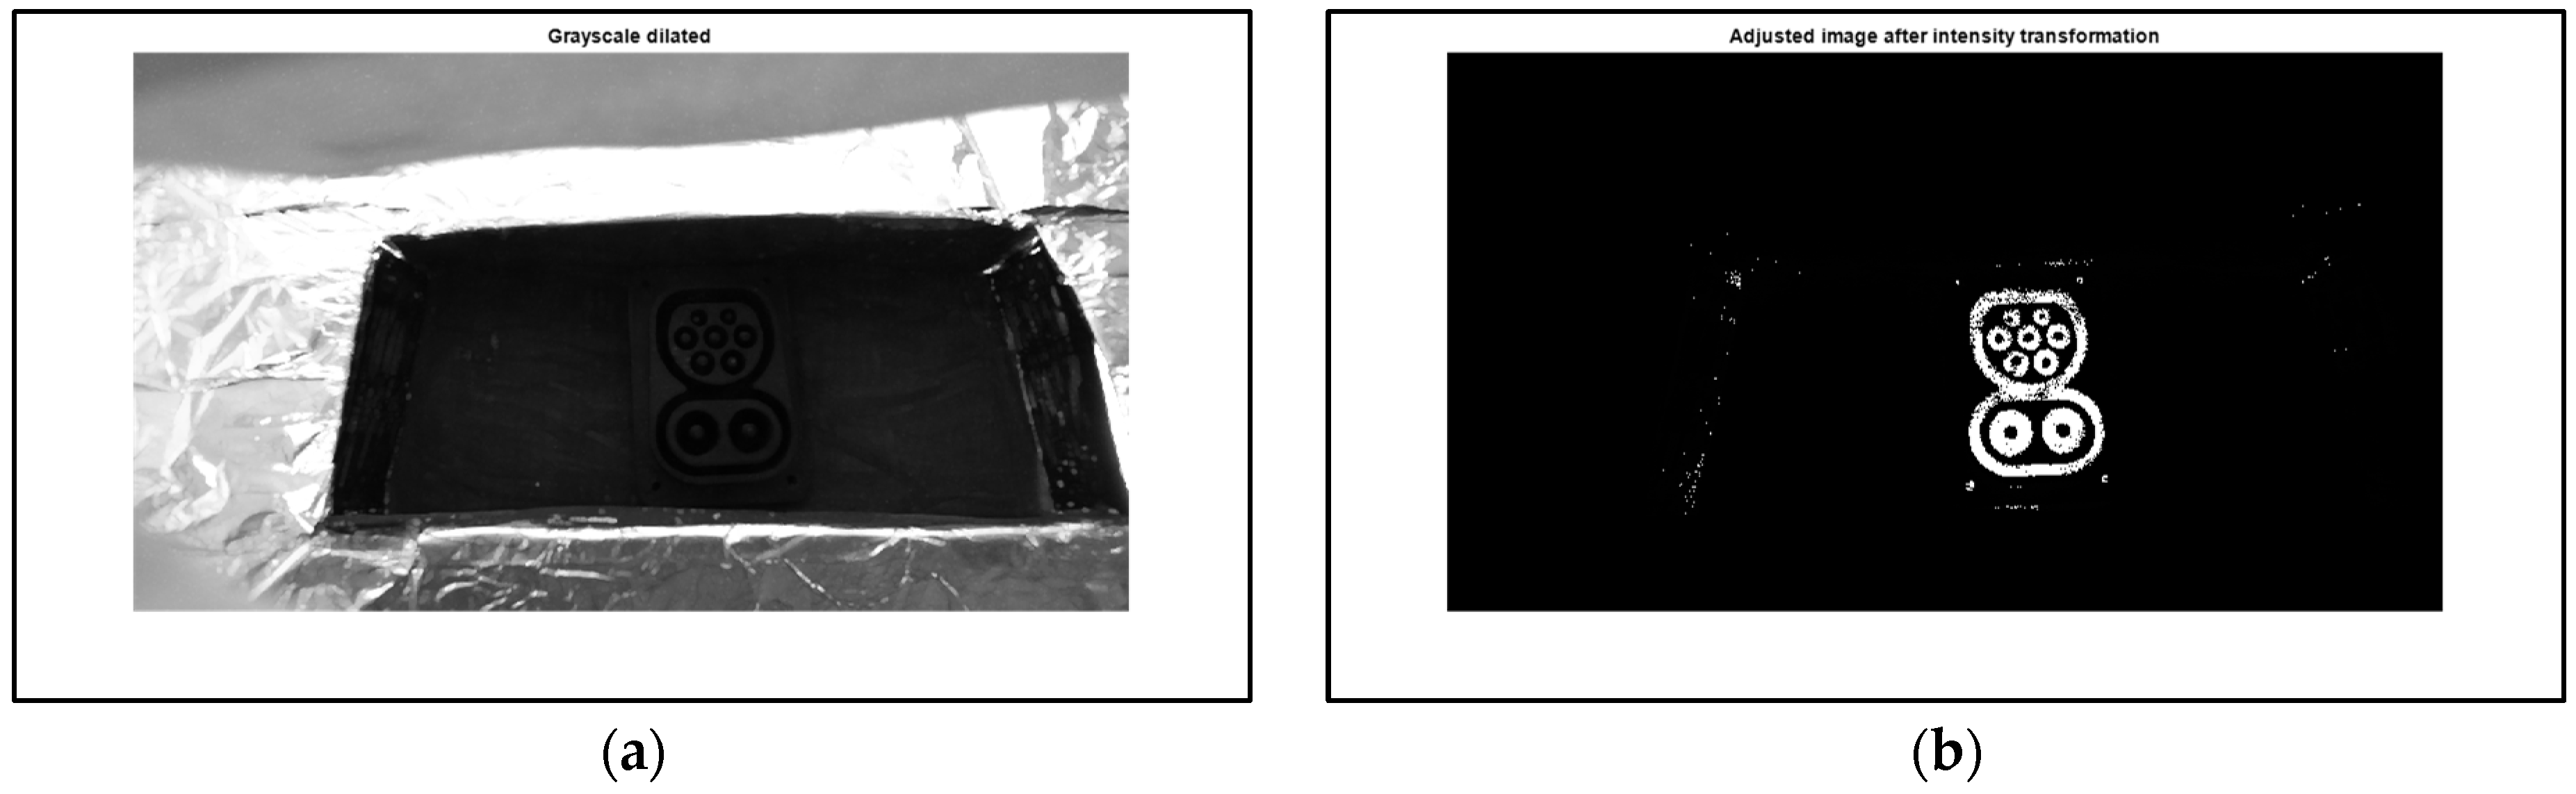
In order to enhance the contours of the connector, the input RGB image has been converted to grayscale image, and next the grayscale dilation operation is performed on the grayscaled input image [
13]. Basically, the grayscale dilation is a local-maximum operation, where the maximum is taken over a set of pixel neighbors defined by the spatial shape of the elements with value 1 in the domain of the structuring element (SE) [
14].
The grayscale dilation of a grayscale image
f by SE
B, denoted by
is defined as:
where
is the domain of SE
B and
is assumed to be −∞ outside the domain of
f [
13]. Basically, this expression executes a process similar to spatial convolution [
14]. An important difference between convolution and grayscale dilation is that, in the latter,
is a binary matrix that determines which locations in the neighborhood are included in the maximum operation. In convolution, the corresponding matrix is not binary [
13]. Hence, this local-maximum calculation via grayscale dilation yields in stronger textures in the resulting image, as shown in
Figure 5a. The grayscale dilation was performed using a disk-shaped structuring element. It should be noted that the sizes of SEs in all morphological operations depend on the image size, and in this algorithm, the dimensions of all the SEs are determined empirically [
14]. In the resulting image, the contours of the socket are more visible and the surrounding area is slightly blurred.
In the next step, the main operation of the algorithm is performed: the intensity transformation. The transformation is executed jointly with an application of the Gamma function, followed by contrast stretching [
14]. The use of the Gamma function in the literature is commonly named as gamma correction, gamma encoding, or power-law gamma transformation [
13]. To explain this operation in the spatial domain, a simple expression is introduced:
where
is the input image,
is the output image, and the
T is an operator on
f determined over a defined neighborhood around point
[
14]. The simplest version of the transform
T is when the neighborhood in image is a single pixel of size 1 × 1. Thus, the value of
g output at point (
x,
y) relies only on the intensity of
f input image at that point and
T becomes an intensity transformation function [
14]. Since the output of the intensity transformation function relies only on the intensity value at a point and not on a neighborhood of points, the expression is frequently simplified as:
where
r denotes the intensity of
f and
s the intensity of
g, both at the same coordinates
in the input and output images [
13].
The power-law gamma transformations are defined as follows:
where
γ and
c are positive constants [
14]. This gamma correction-based intensity transformation with fractional values of
γ maps a straight range of dark input values into a wider range of output values, with the opposite mapping for higher values of input intensity levels. Parameter
γ defines the shape of the transformation curve that maps the intensity values from input
f to output
g [
14]. If
γ is less than 1, the mapping is weighted toward higher output values, while if
γ is greater than 1, the mapping is weighted toward lower output values [
13]. The intensity transformation is performed jointly with contrast stretching, where the narrow interval of input intensity values is expanded into a wider interval of output values [
14]. In this algorithm, the value of
γ is 0.001. This value of
γ eliminates the brighter background of the CCS2 socket and retains the dark socket components and textures in the image. As shown in
Figure 5b, almost the whole area around the charging socket is eliminated. The remained connector elements contain noise that will be suppressed later with additional processing.
In the next step, a noise removal operation is performed using median filtering. The median filter is a well-known noise eliminating operation, and it is a very simple and efficient procedure [
14]. Basically, this is an order-statistic filter in image processing which substitutes the value of a pixel by the median of the intensity levels in a predetermined neighborhood of the corresponding pixel. The median filtering operation is defined as:
where
denotes a subimage centered on point
,
is the noise-reduced image,
r and
c are the row and column coordinates, respectively, of the pixels in neighborhood
, and
g represents the corrupted image with noise [
14]. Median filters are highly favored because, for certain types of random noise, they yield outstanding noise reduction abilities, with noticeably less blurring than linear smoothing filters with a similar size. Moreover, median filters are specifically effective in the existence of both bipolar and unipolar impulse noise [
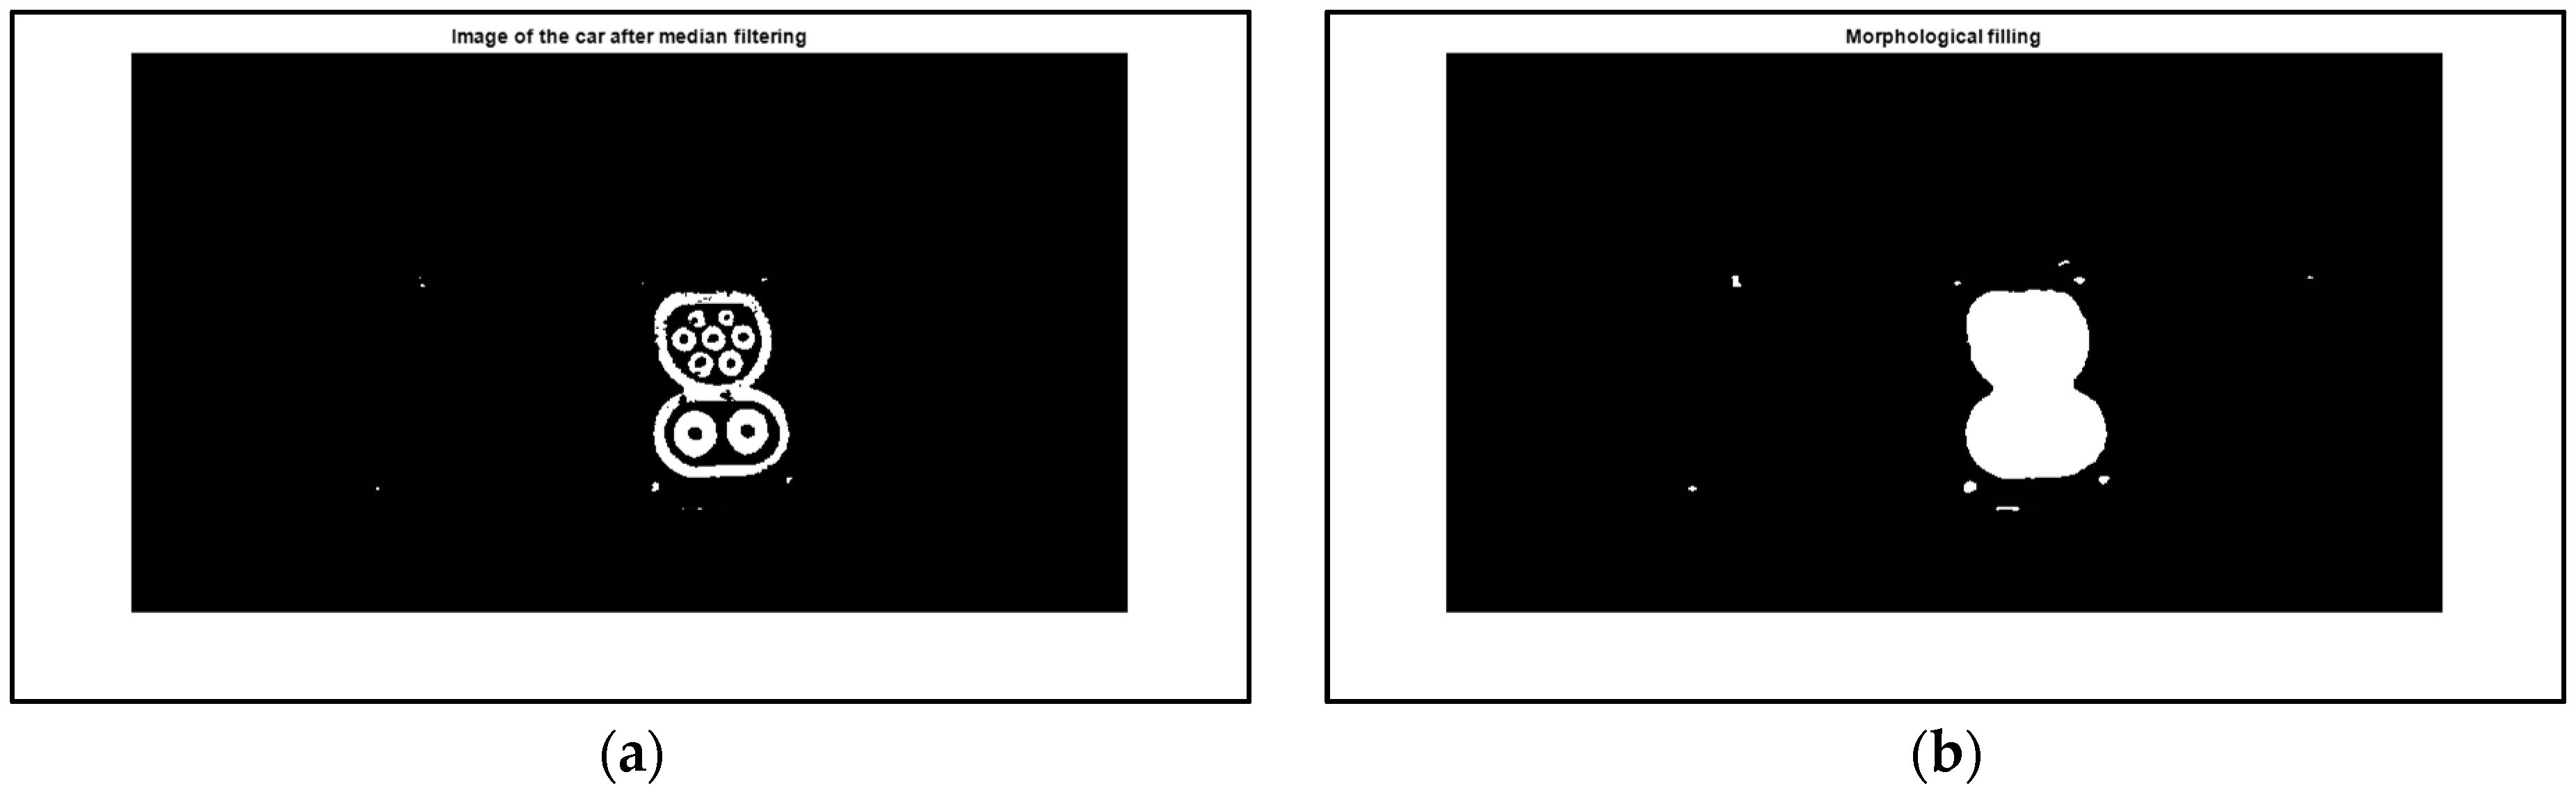
13]. In the algorithm, the empirically determined size of the employed median filter is 9 × 9, with the result of the median filtering shown in
Figure 6a. As can be seen, the noise from the image is removed and the CCS2 socket area is sharp and clear. It should be noted that the dimensions of the median filter depend on the dimensions of the input image, and it can be easily adopted during the experiments [
14]. However, there are several remaining components around the connector. These components will be removed via morphological filtering in further processing steps of the algorithm.
The next step in the algorithm is the binary morphological processing preceded by the simple thresholding operation. After the binarization is accomplished, a series of morphological dilations with plus-shaped structuring elements were performed in order to thicken the components in the connector area. Dilation is one of the main operations in morphology, together with erosion [
13]. Basically, dilation grows, or thickens, the objects in the binary image, thus making their textures more filled without small holes. Hence, one of the primary applications of dilations is for bridging holes in the image. The method and the extent of the thickening is controlled by the shape and the size of the used SE. Basically, the result of all morphological operations depends on the utilized SEs [
14]. The dilation operation of
A by SE
B, where
A and
B are sets in integer space
Z2, is determined as:
where
z denotes a translation in image space and
denotes the reflection of SE
B about its origin [
13]. Unlike dilation, which is a thickening operation, erosion shrinks, or thins, the shapes in a binary image. The erosion of
A by
B is determined as:
where
A is a set of foreground pixels,
B is a SE, and
z represents the foreground values. Simply, based on Equation (7), the erosion of
A by
B is a set of all points
z such that
B, translated by
z, is contained in set
A [
13].
The dilation operations in the algorithm are followed by the morphological closing operation with disk-shaped SE. It should be noted that since dilation and erosion are elementary operations in morphology, all the other morphological algorithms are based on these two principal operations [
14]. The closing operation tends to smooth sections of contours in the image; however, it generally fuses straight breaks and long thin gulfs, eliminates small cavities, and fills gaps in the contour of a shape in a binary image. The goal of the closing operation is to fuse small breaks of the CCS2 socket in a dilated image. The closing of
A by
B simply is a dilation of
A by
B, accompanied by erosion of the result by SE
B [
13]:
Next, a morphological filling operation is performed in order to fill the socket area, with a goal to form the binary mask of the CCS2 socket. The morphological hole-filling algorithm is based on dilation, complementation, and intersection operations. The following process fills all the holes with 1 s surrounded by values of 1 in a binary image:
where
B is the symmetric SE,
k is an iteration step,
is the object inside the binary image that contains all the filled holes,
c denotes the complementation operation, and
I is the binary image [
13]. The dilation in Equation (9) would fill the complete region of the image, but the intersection at each step with
limits the result to inside the area of interest. This algorithm is an example presenting the possibilities of a simple morphological operation to develop an efficient procedure in order to meet a desired property and result.
Figure 6b presents the result of the morphological filling operation. As can be seen, the whole CCS2 socket area is filled with binary 1 values. The small image components around the connector area will be eliminated in morphological post-processing in order to determine the binary mask of the socket.
Finally, the binary mask is obtained by the sequence of morphological closing and opening with disk-shaped SEs. The opening operation also smooths the contour of a shape; however, as opposed to closing, it breaks narrow isthmuses and eliminates thin protrusions. The opening of
A by SE
B is expressed as:
where the equation states that the opening of
A by
B is the erosion of
A by
B, accompanied by dilation of the result by SE
B [
13].
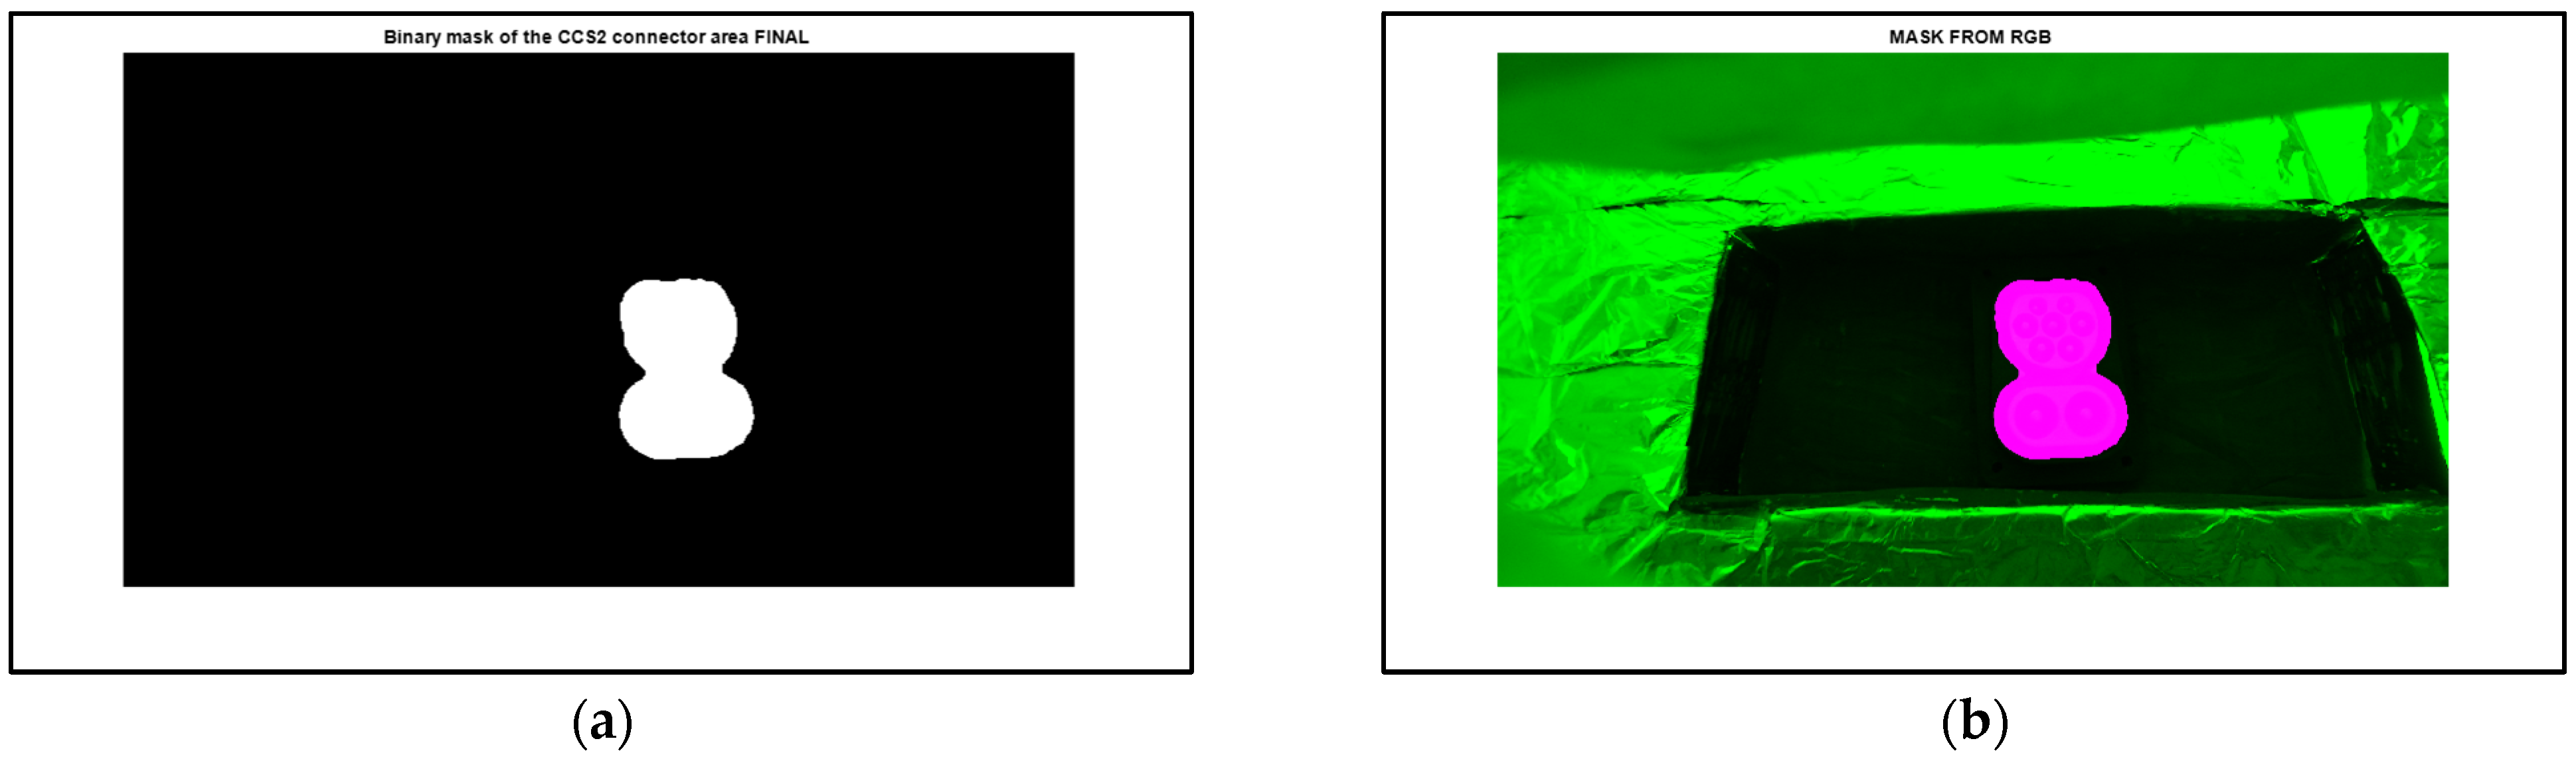
Figure 7a shows the formed binary mask of the CCS2 socket, while
Figure 7b displays the binary mask overlapping the original RGB image in order to present the accuracy of the detected mask. The pink surface represents the binary mask that overlaps the socket region in the input RGB image. As can be seen, the obtained binary mask is very accurate, and it completely masks the connector area.
To this point, the upper part of the image processing procedure is explained from
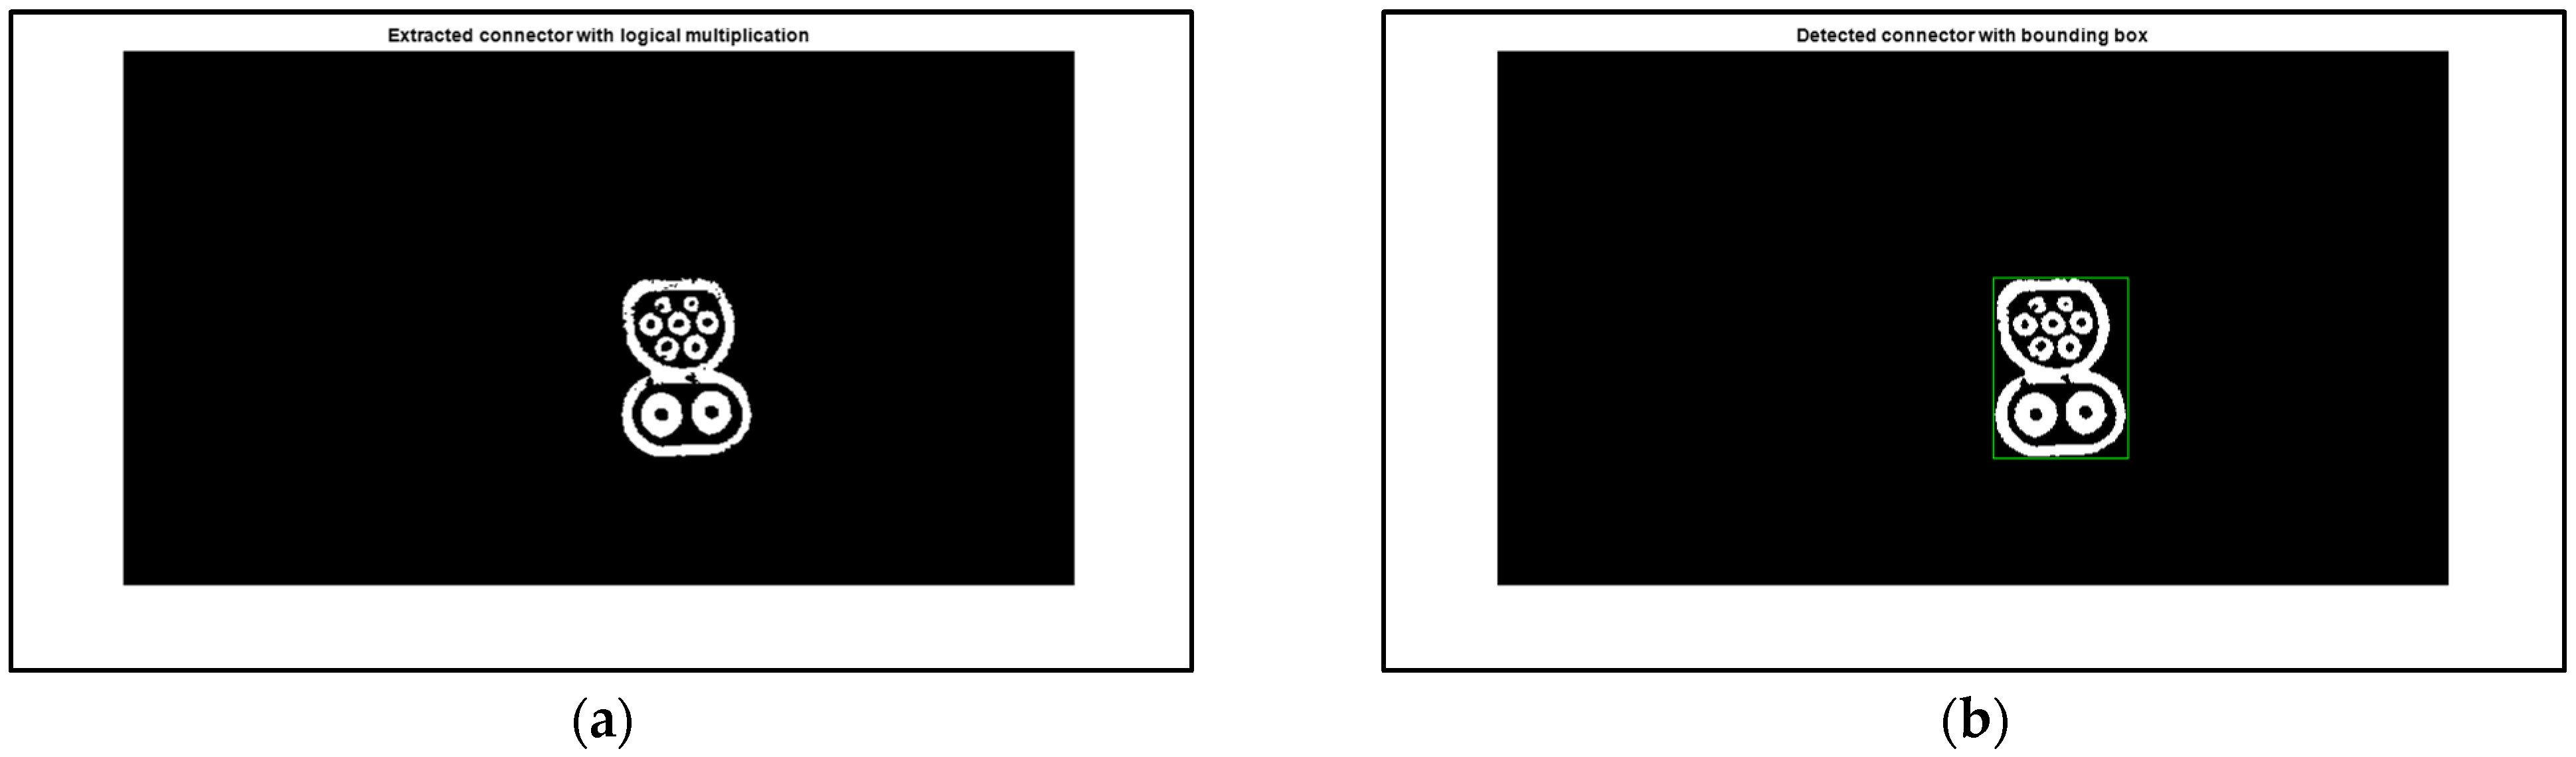
Figure 3. Further, the remaining steps of the algorithm will be explained. The following task is the extraction of the CCS2 socket shape from the RGB image using the extracted binary mask. This is accomplished with a simple logical image multiplication of the binary mask with the binarized image of the previously obtained result after median filtering, as shown in
Figure 8a. The resulting connector contains small gaps and holes that will be post-processed again with a sequence of morphological operations. This series of operations involves dilation, closing, opening, and erosion with small-sized, plus-shaped, and disk-shaped SEs. The reason for the usage of several operations with small SEs lies in the fact that it is mandatory to keep all the vital components of the socket, without a possible cutoff in it. The obtained result of the morphological post-processing is shown in
Figure 8b, with the corresponding bounding box around the CCS2 socket itself.
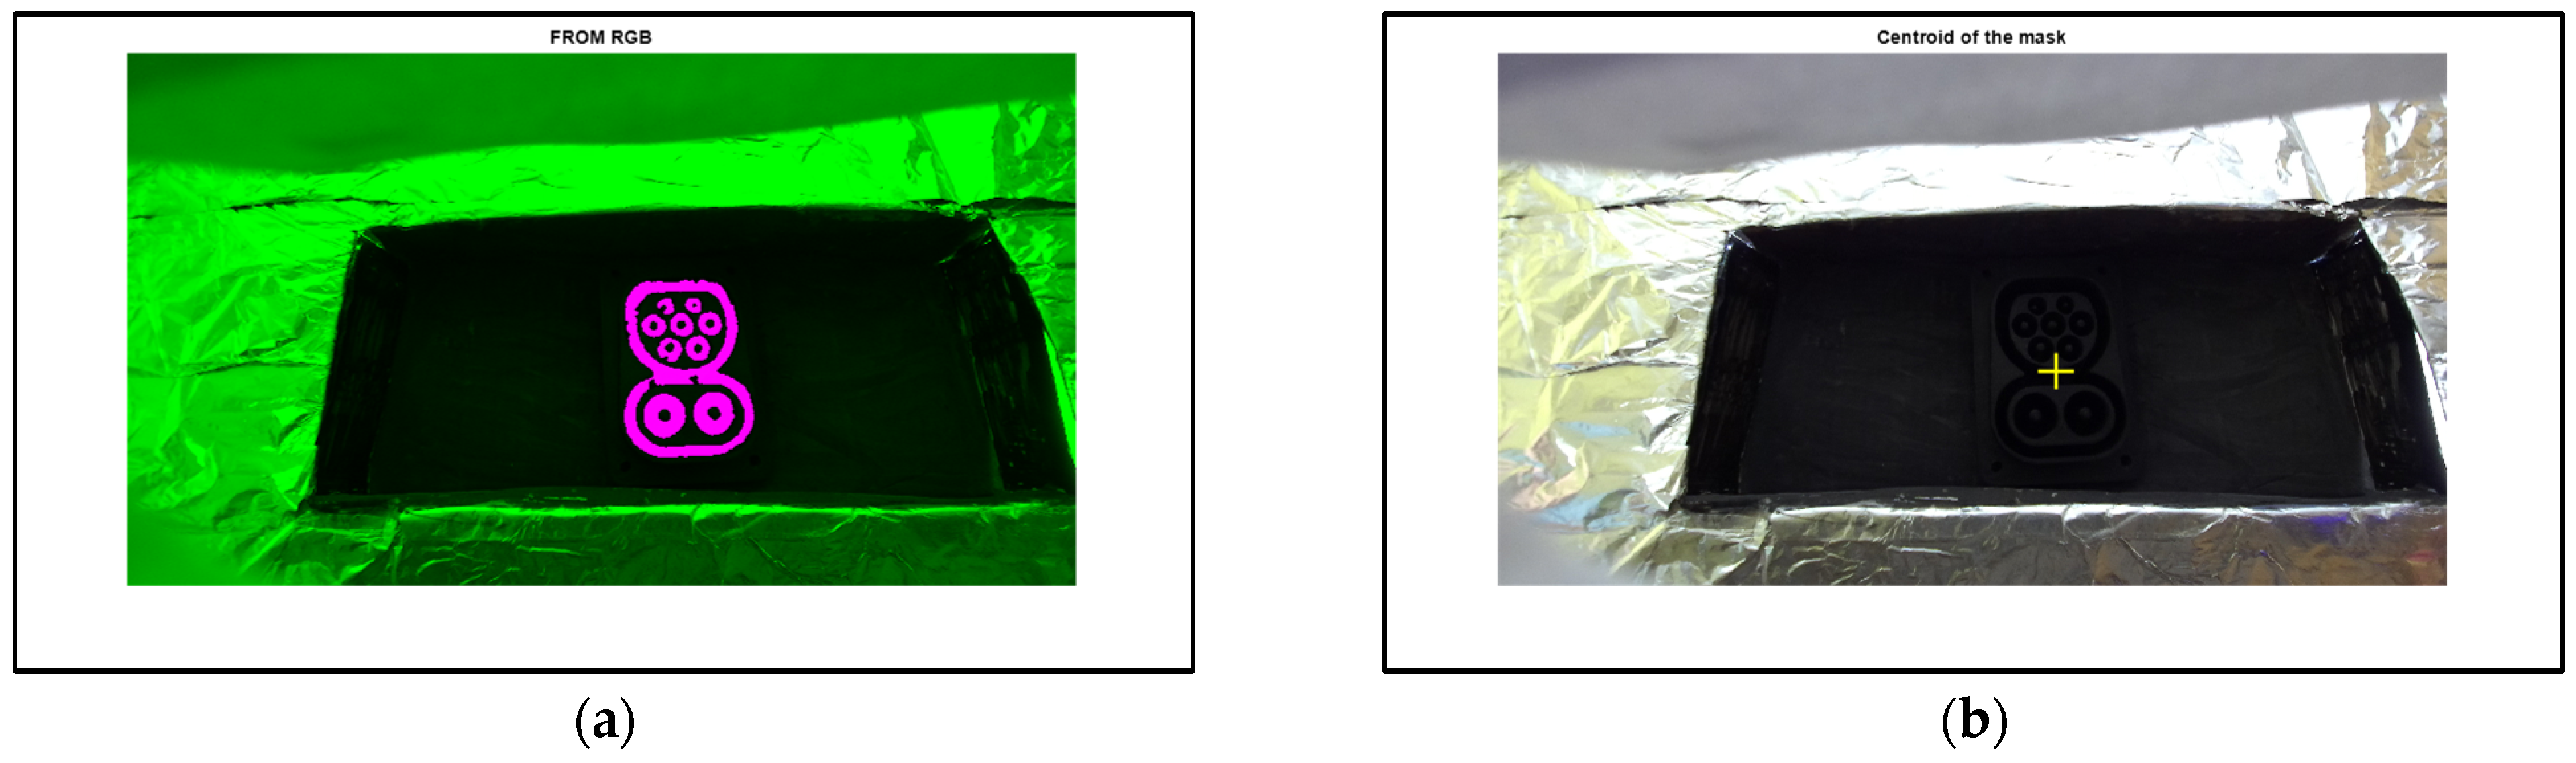
Figure 9a shows the accuracy of the CCS2 socket detection, where the extracted socket from the RGB image overlaps the input RGB image. Again, the pink surface that overlaps the charging socket region represents the extracted socket. It can be seen that the obtained contours and textures of the derived charging socket area fit well on the original image. In
Figure 9b, the centroid coordinate of the detected socket region is marked as a yellow cross in the input image. This coordinate will serve as crucial information for the robot’s control system during the positioning of a charger plug, before its connection to the CCS2 socket [
5,
6,
7,
8,
9,
10,
11].
After the centroid coordinate of the socket is determined, the next step is to extract the socket area from the original 32-bit depth resolution depth map in order to calculate the tilt angles of the socket relative to the ZED 2i camera position in space. Basically, the depth image is a projection of Z measured distance values on the XY plane of the image. These distance values will be used for the determination of tilt angles in the XZ and YZ planes, while the previously obtained binary mask will be used for the determination of the orientation angle in the XY plane of the image. The angle in the XZ plane represents the slope angle in the horizontal direction, while the angle in the YZ plane represents the slope in the vertical direction relative to the stereo camera position. The socket extraction is accomplished again with a simple logical image multiplication of the previously extracted and post-processed binary CCS2 socket image with the original input depth map. Thus, the resulting image contains only the original depth values that belong to the CCS2 socket.
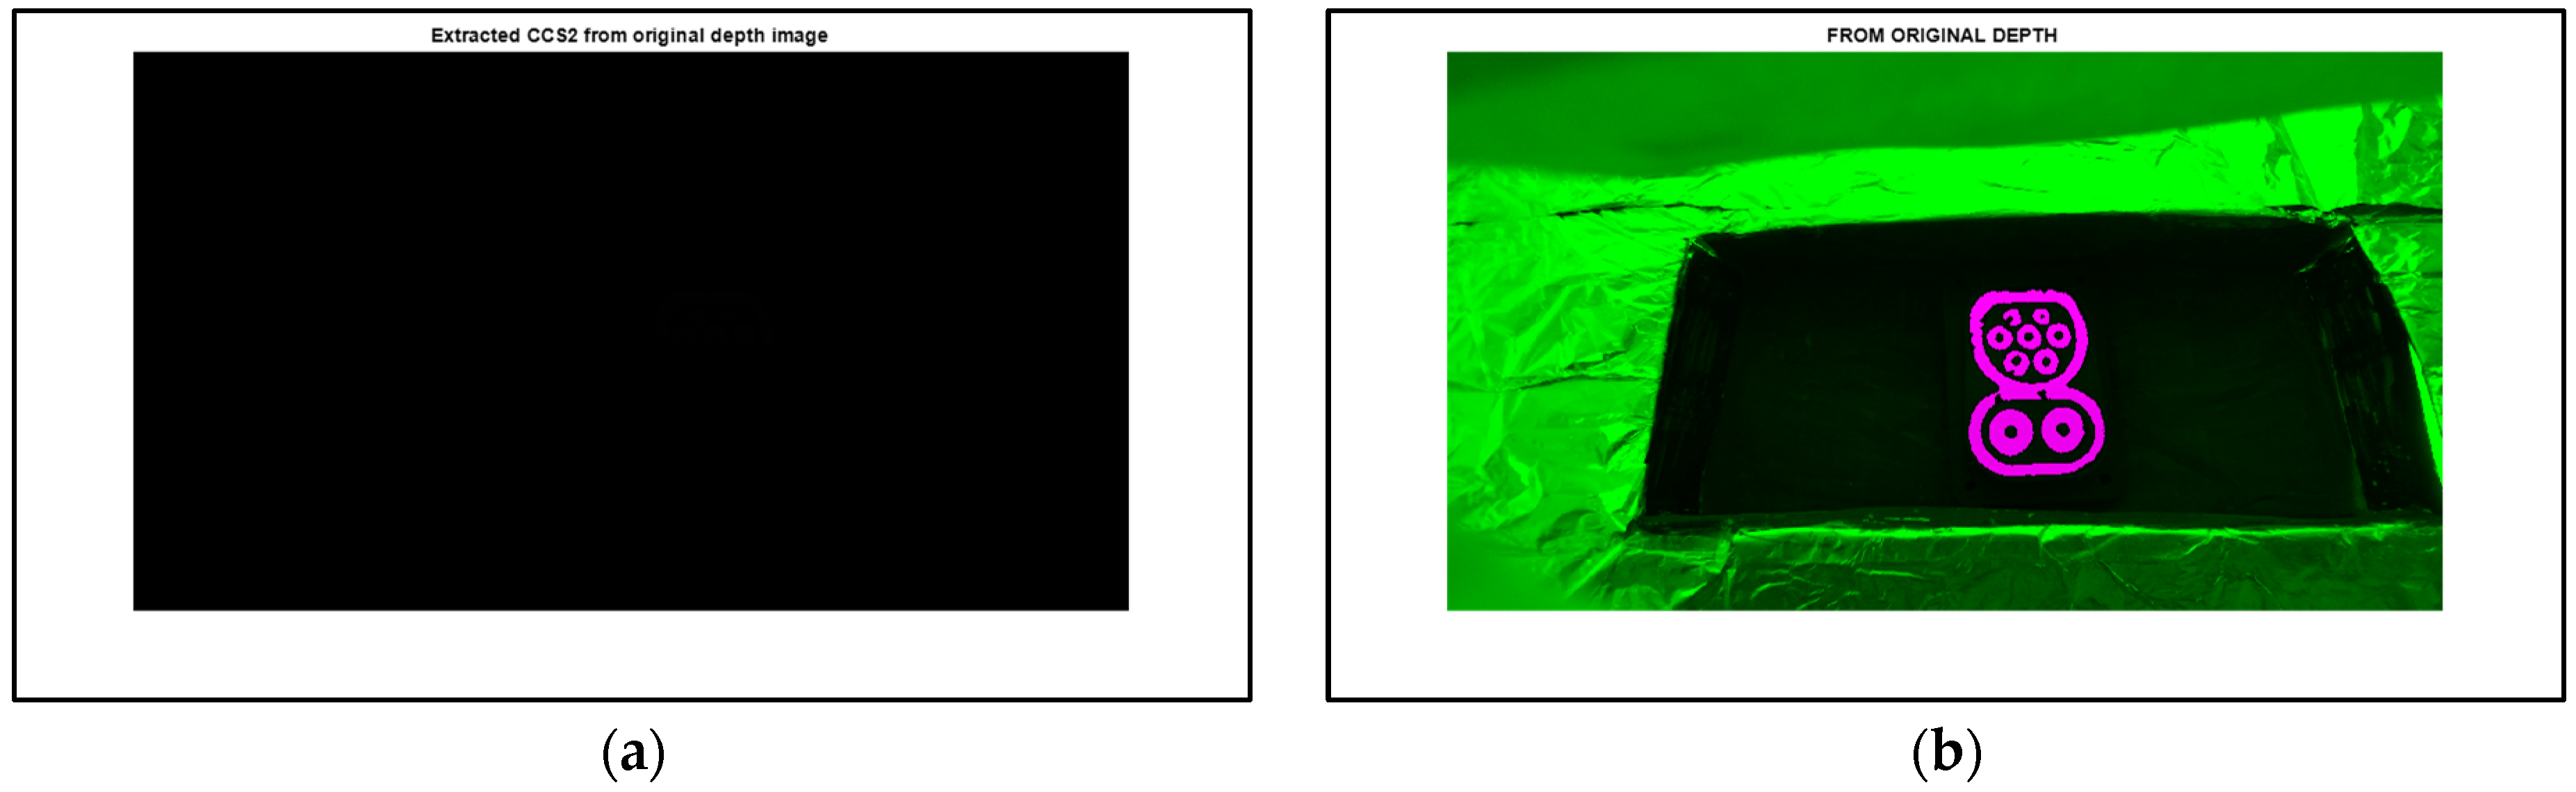
Figure 10a shows the result of the multiplication operation, where the binary image of the detected socket from the RGB image (
Figure 8a) is multiplied with the original input depth map in 32-bit depth resolution. Since the binary image is multiplied with the input depth map in 32-bit depth resolution, the content of the image cannot be displayed on common displays [
36].
Figure 9a is included for the generality of the presentation of the procedure. In
Figure 10b, the resulting image is converted to 8-bit depth resolution in order to be visible, and the accuracy of the detected CCS2 socket from the original depth map can be observed relative to the input RGB image. The pink surface region is the extracted CCS2 socket from the original depth map, and here it overlaps the input RGB image in order to highlight the accuracy of the detection.
It is desirable that the extracted socket from the depth map has the same or a similar quality as the extracted socket from the RGB image for the better tilt angle calculation of the socket; however, it also depends on the measured depth map quality. If the depth map does not contain sufficient information related to the socket region, even the appropriate socket detection from the input RGB image will not extract the socket from the depth map properly.
Finally, the determination of the tilt angles remained. First, the orientation angle in the XY plane of the input image is obtained via measuring image region properties and ellipse fitting procedure of the obtained binary mask [
38]. The calculated XY plane angle in this particular example is 6.4733 degrees. The two other angles are determined using simple trigonometry [
41] and using the known dimensions of the real socket itself. The first step is the cropping of the extracted CCS2 socket from the 32-bit depth resolution depth map using the previously obtained bounding box around the socket itself. Then, if the furthermost upper and furthermost lower rows with stereometry-calculated distances in the cropped socket area are averaged, the results will be the averaged farthest and nearest distances in vertical direction from the depth sensor’s plane in millimeters. Thus, using the known height (
H) in millimeters of the CCS2 socket, the tilt angle of YZ plane can be determined as:
where
zupper and
zlower are the averaged distance values in the vertical direction.
Similarly, if the furthermost left and right columns of the determined distances in the cropped socket are averaged, the results will be the averaged farthest and nearest distances in the horizontal direction from the depth sensor’s plane in millimeters, and using the known width (
W) in millimeters of the CCS2 socket, the tilt angle of XZ plane can be obtained as:
where
zleft and
zright are the averaged distance values in the horizontal direction.
Naturally, the resulting angles can have an ancestor of + or −, depending on the averaged distance values. In practice, this manifests itself as a slope of the top or bottom parts of the connector forward or backward, or as a slope of the left or right parts of the connector forward or backward. In this particular example, the angles are degrees and degrees. It is obvious that the determination of these angles depends on appropriate and high-quality CCS2 socket extraction from the original 32-bit depth map, as well on the generated high-quality depth map by the depth sensor.
Finally, all the determined angles and the detected centroid coordinate of the connector position will be forwarded to the UR robot’s controlling system, and based on these parameters, the robot will be able to connect the charger plug to the charging CCS2 socket.
In the end it should be noted that when the UR robot arrives, the depth sensor will be installed on the robot’s arm and the testing will be conducted live in real time on the vehicle body model with built-in CCS2 socket and with electric vehicles. Later, when the system is verified, the testing will be expanded to other available electric vehicles.
5. Experiments and Results
In this section, the experiments and their results are explained in detail. As it was mentioned in the Introduction, the goal and the main demand of the project is to use only proven and well-known digital image processing operations during the development of the socket detection algorithm. The algorithm was tested on artificial vehicle body models with a built-in CCS2 connector. Various backgrounds and illumination conditions were tested in order to analyze and determine the potentials and limitations of the deployed object detection algorithm based on common image processing methods.
One of the key factors in the development of the image processing algorithm is the generation of a high-quality, usable input image. In addition to the use of high-quality capturing devices, the main requirement is the formation of an appropriately illuminated environment without disturbing effects, which can ensure the repeatability of a quality image capturing. Thus, it should be noted that an artificial white lighting Light Emitting Diode (LED) illumination is used with paper shadowing during the image capturing in experiments to ensure the needed diffuse lighting conditions for the ZED 2i camera [
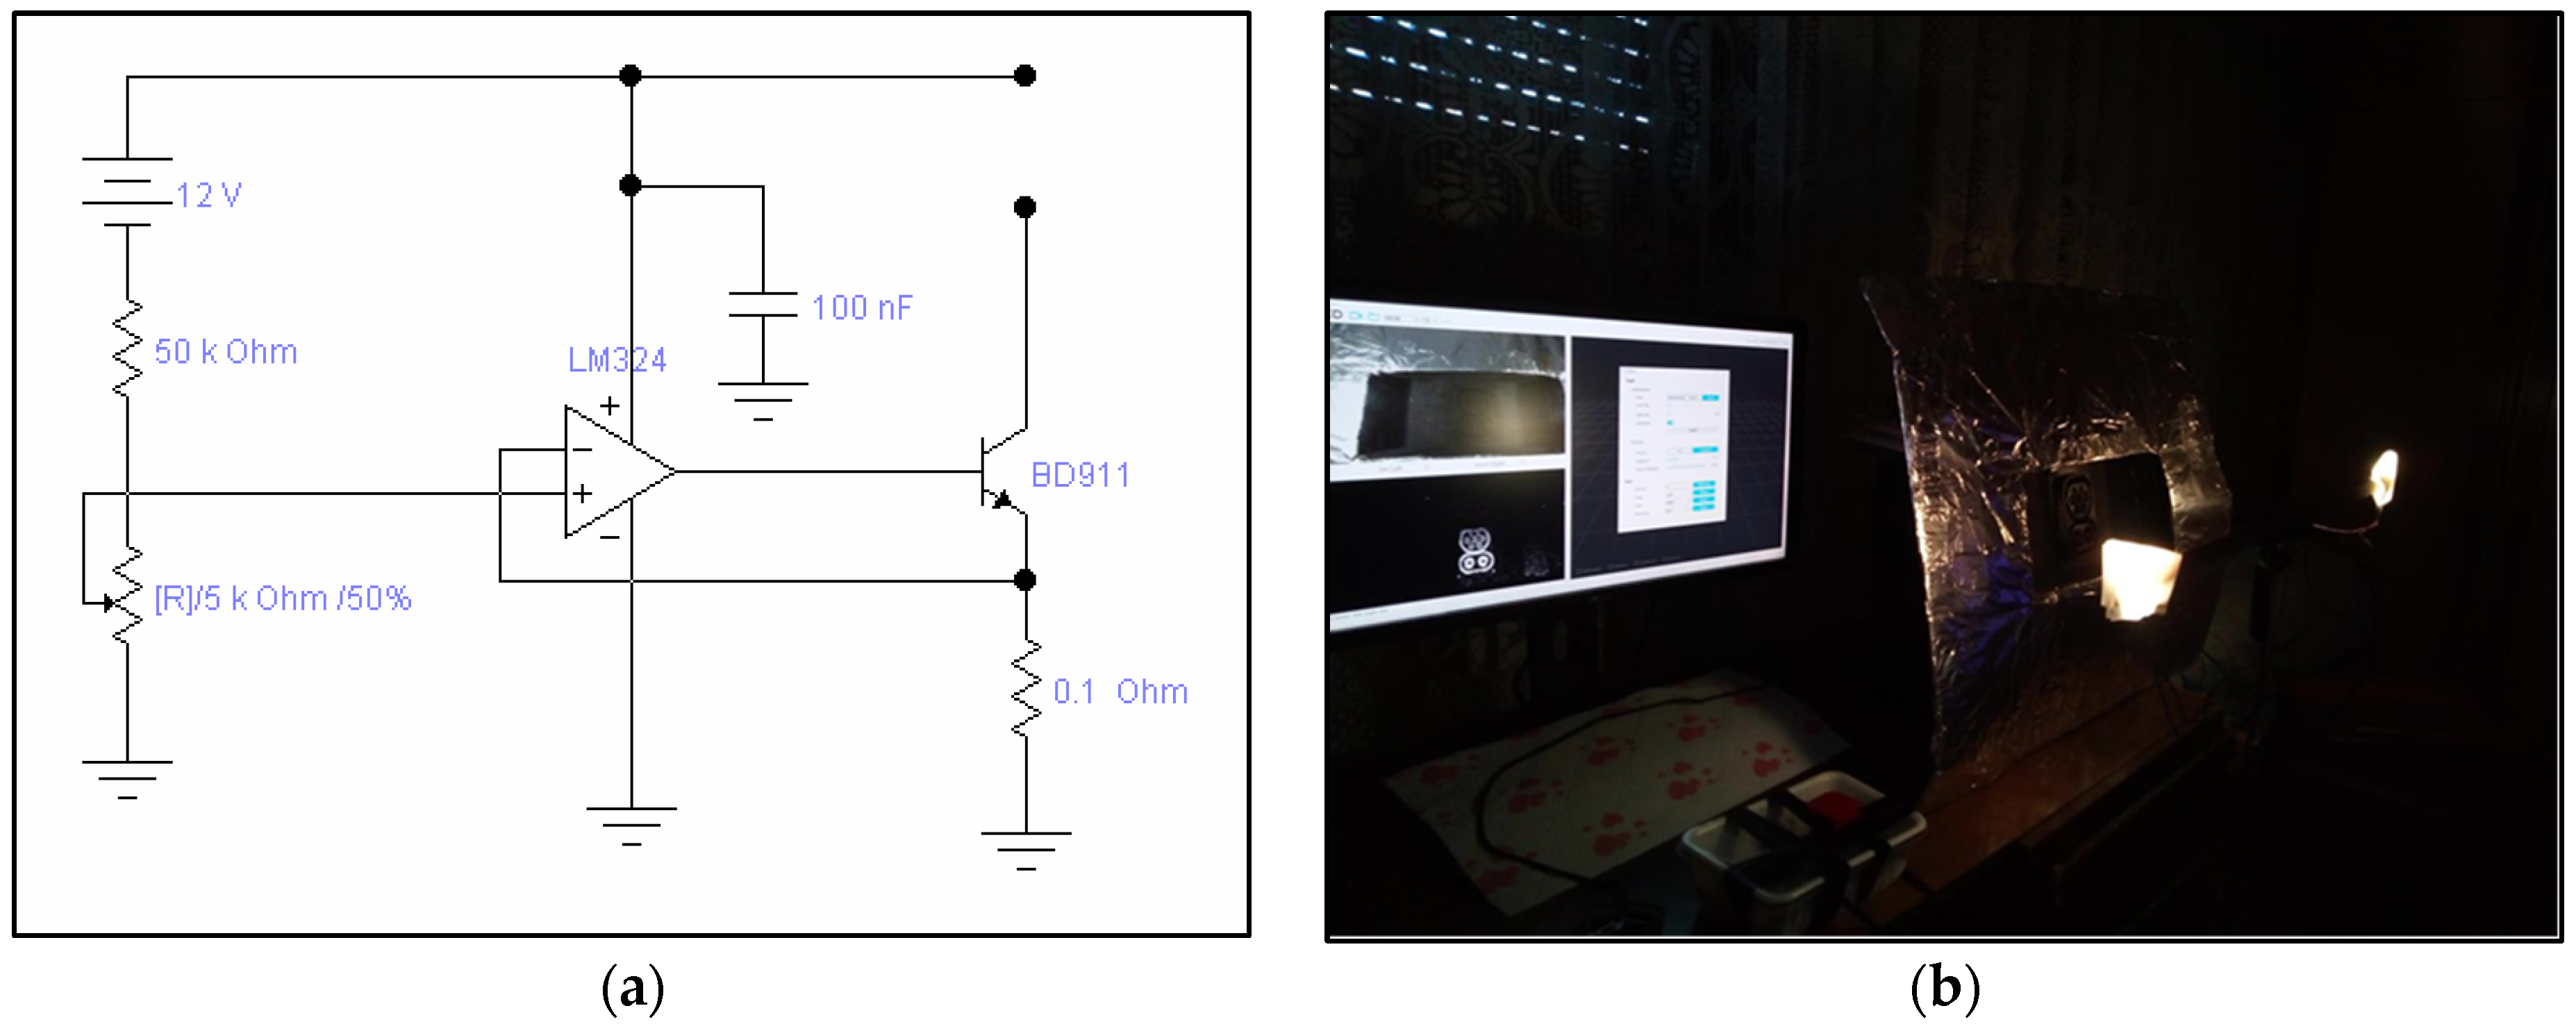
36]. This illumination source was proposed by Stereolabs’ engineering team during the consultations. The power of LED lights separately is 1.5 W, and they are connected to a 12 V voltage source. The intensity of LED lights is controlled with a simple regulation circuit presented in
Figure 11a. The LED lights are mounted in the same plane in a line with the ZED 2i, to an approximate 35 cm distance left and right from the depth sensor, and they provide directly diffuse illumination both to the car body model and to the CCS2 socket. Despite the lights’ regulation possibility, almost all the measurements were conducted with the maximum light intensity, since the visibility of the charging socket area is very poor due to its darkness. Moreover, it is possible to mount more LED sources or increase the intensity of the illumination; however, it is not shown to be the best solution, since too much light can cause reflection and it will simply blind the depth sensor, and the stereo device will not be able to generate an appropriate depth map [
36], while it could also spoil the RGB image. In contrast to highly intense lighting, if the lighting is insufficient, the details in the images of the left and right cameras will be insufficiently visible; thus, the stereo-matching algorithm will not have enough useful information to be able to generate a correct and accurate depth map [
36]. This is a commonly known issue when passive depth sensors are used in various applications, where the light source is close to the camera [
11,
36]. The depth sensor is mounted on a tripod together with the LED illumination sources and shadowing elements, as shown in
Figure 11b. The experiments were conducted at daylight, sunlight, shadow, under room lighting, and in a complete dark environment.
Further, since the aim was to examine the ultimate capabilities of the developed algorithm, the colors and shades of the vehicle body model are chosen so that the glare, noise, and artefacts are as pronounced as possible, or that the complete socket surrounding will be very dark to absorb light and thus spoil the input RGB and depth images. The socket and the surrounding where it is mounted are very dark (on real vehicles also) and, thus, they absorb light and the socket looks dark in the presented examples. Additionally, it should be noted that the vehicle body model is tilted a little to reflect the real situation, because real vehicles also narrow in a truncated pyramid shape in the upward direction around the socket position, and that is the reason why the presented examples will look like they are being captured from above slightly. Hence, the socket is observed from in front with minor displacements, and that will also be the intent in the real application. The depth sensor was positioned approximately 20–22 cm from the vehicle body model; thus, the CCS2 socket was approximately 24–28 cm from the camera. It should be mentioned that the minimal working distance of ZED 2i is 20 cm, since according to Stereolabs’ documentation, the dead zone of the sensor is starting from 19 cm [
36]. This means that this depth sensor cannot generate a depth map below this distance. Further, the proposed capturing distances were determined empirically in consultation with Stereolabs, since this problem is very specific due to the very dark and textureless CCS2 socket that should be detected with its tilt angles. Moreover, starting with the 30 cm distance, the depth sensor cannot generate an adequate and quality depth map with sufficient details of the socket area; hence, the proposed capturing distance [
36] was kept in all experiments. Later, when the UR robot will be involved in testing, a quality ultrasonic distance sensor will be utilized to bring the robotic arm with the stereo camera to the desired distance from the vehicle body. The electric vehicles will be properly positioned with physical borders and signs on a parking lot; knowing the model of the electric vehicle and the position of the charger socket on the specified vehicle, the robot will, with the help of these known parameters, position the robotic arm with the camera and distance sensor in front of the CCS2 charging socket at the proper distance and position.
Lastly, the goal of this research is to develop and examine the possibilities of the object detection algorithm with the ZED 2i depth sensor in challenging image recording situations.
Finally, since the ZED 2i device requires appropriate hardware which supports a Graphical Processing Unit (GPU), in experiments, an Intel i7-10700 2.90 GHz processor with 16 GB RAM memory and the NVidia GeForce GTX 1650 SUPER GPU is used. The proposed procedure is developed in Matlab [
41]. In future, the algorithm will be connected to the UR robot’s control system via ROS and Node-RED. Node-RED is a programming tool for wiring together various hardware devices inside the deployed system [
42].
Next, several examples will be presented with the main emphasis on the image processing results, without serving the numerical data for angles and coordinates, because the slope angles and centroid coordinates can be easily determined based on the extracted CCS2 socket. Thus, the determination of the angles and coordinates itself is affected by the efficiency of the algorithm in addition to the quality input RGB and depth images. In all figures, the pink surface in overlapped images will represent the region of the formed binary mask and the extracted socket, respectively, in order to visibly present the obtained results. Finally, it should be noted that in all experiments, the RGB image obtained from the left image sensor of the ZED 2i is used, since the built-in software of the depth sensor automatically aligns the generated depth map with the left RGB image of the depth camera [
36].
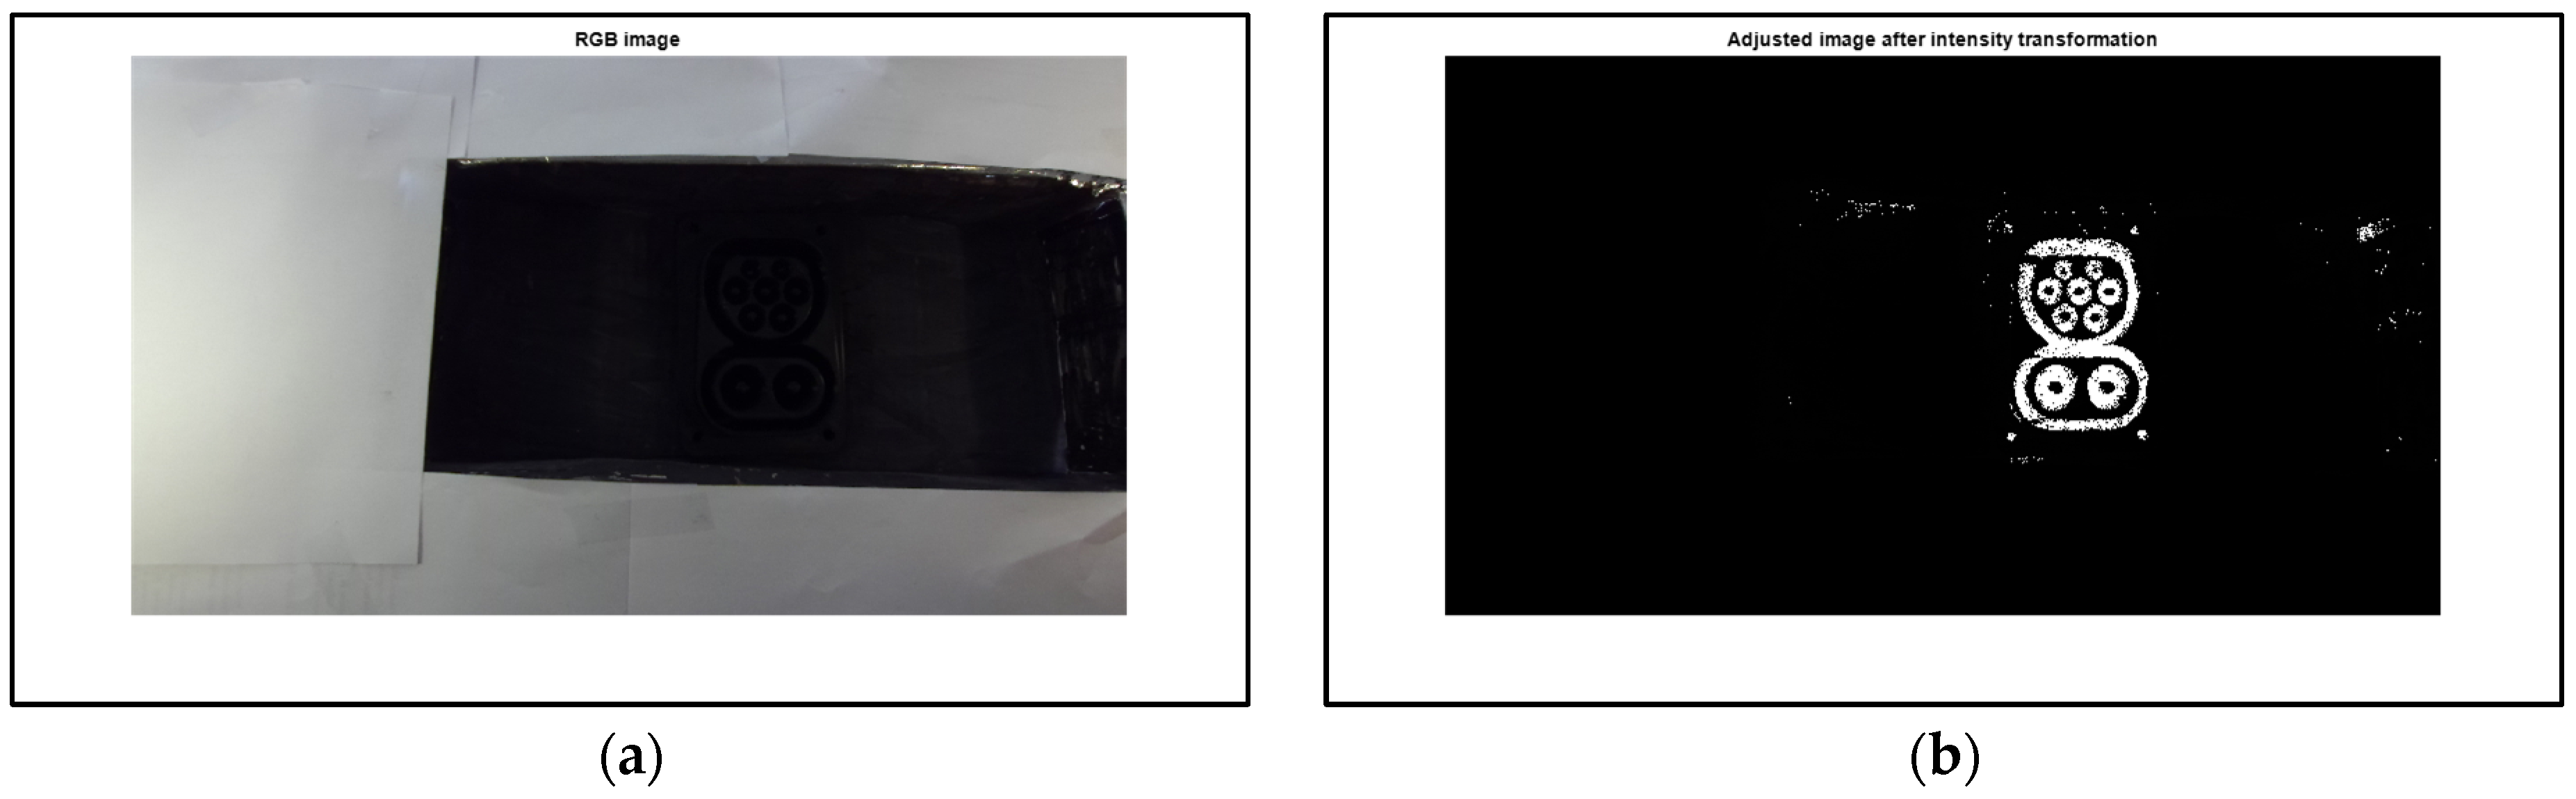
In
Figure 12a, a white vehicle body model is shown, where the image recording was performed at daylight. The white nuance of the body model is slightly matted, while the socket area is very dark and poorly visible due to the shadow from the right side. This is also a common situation in the real world, since the socket area will always be very dark, almost black, and its textures will always be hardly noticeable in all images.
The LED lights were on full power, and that is the reason for sufficient scene illumination.
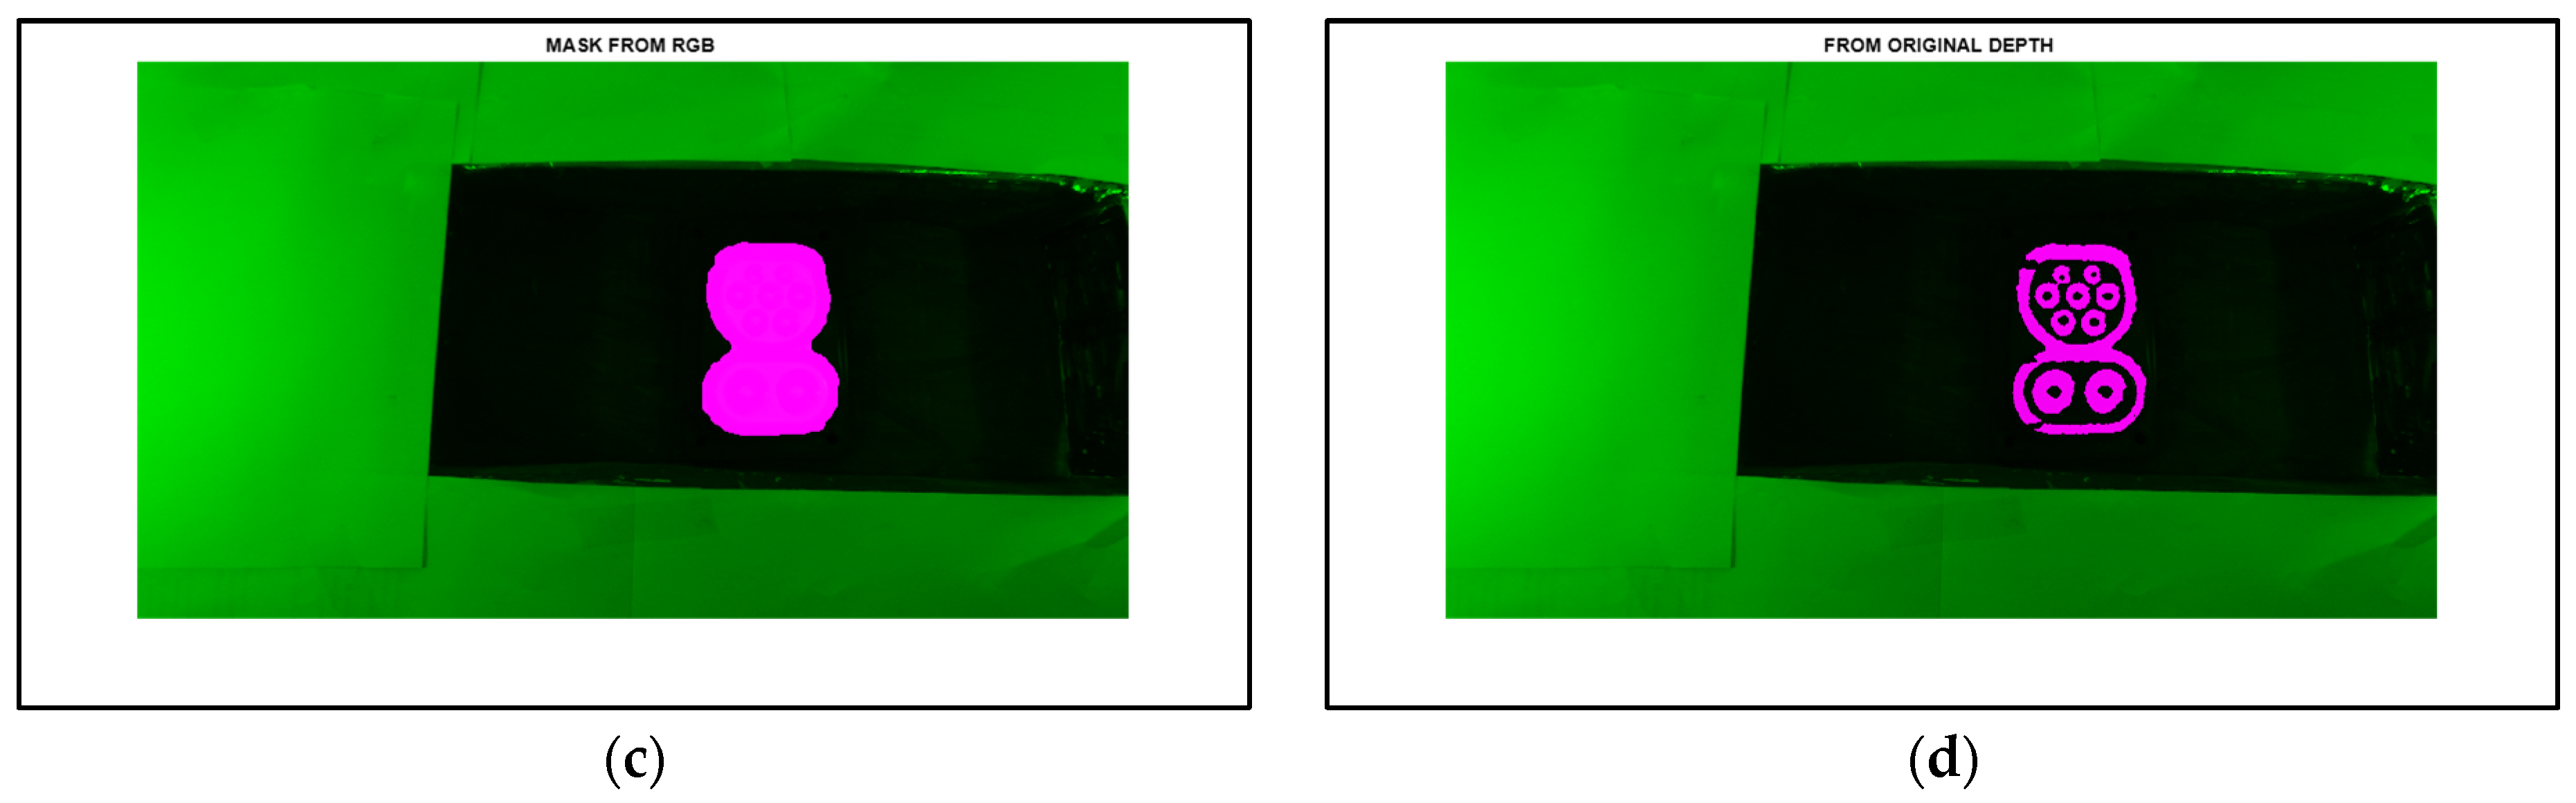
Figure 12b displays the result of the applied intensity transformation with gamma correction. As can be seen, the socket area is well retained in the resulting image, with a small number of surrounding components and noise. After executing the median filtering and morphological processing, as explained in the previous section, the binary mask of the socket region is obtained with high accuracy, as shown in
Figure 12c. Finally, using the binary mask and the previously proposed post-processing procedure, the CCS2 socket area from the original depth image is determined, as shown in
Figure 12d. The contours of the socket are slightly deficient; however, they contain sufficient information for appropriate slant calculation. Hence, the detected and extracted charging socket shape with its corresponding depth information will serve for the determination of tilt angles of the socket itself. Naturally, after the binary mask of the socket is derived, its centroid coordinate is also appropriately determined.
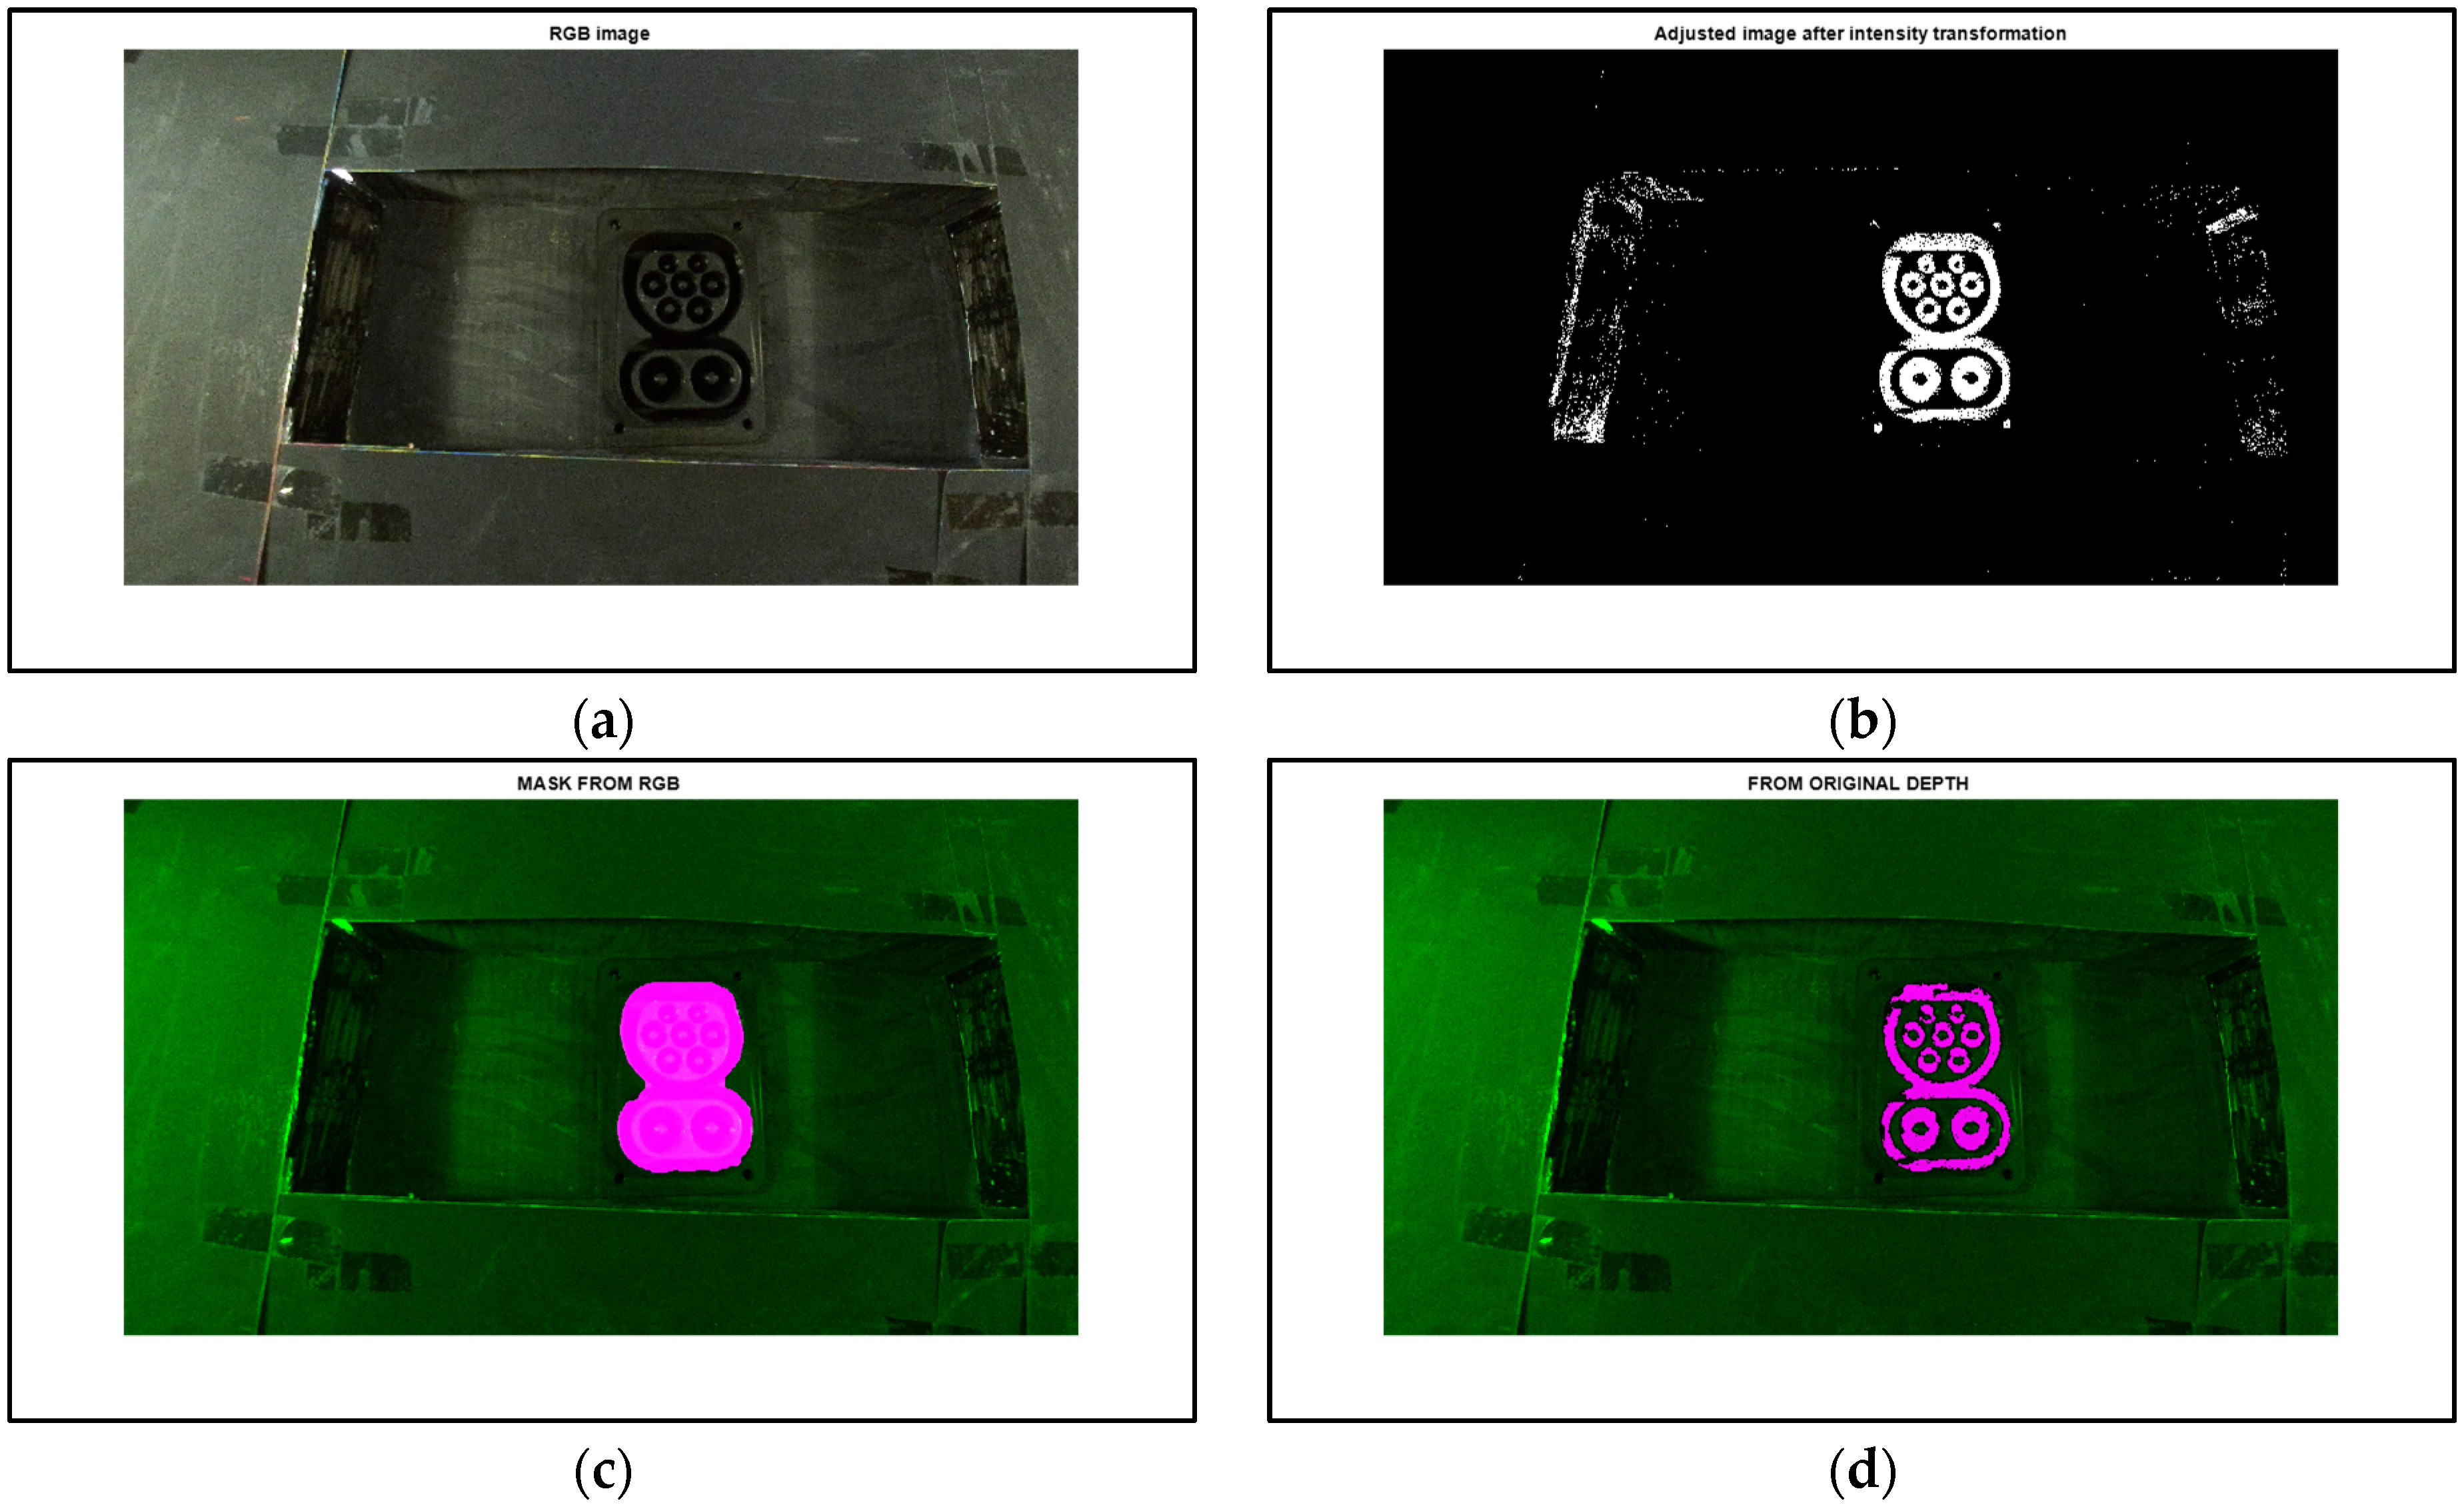
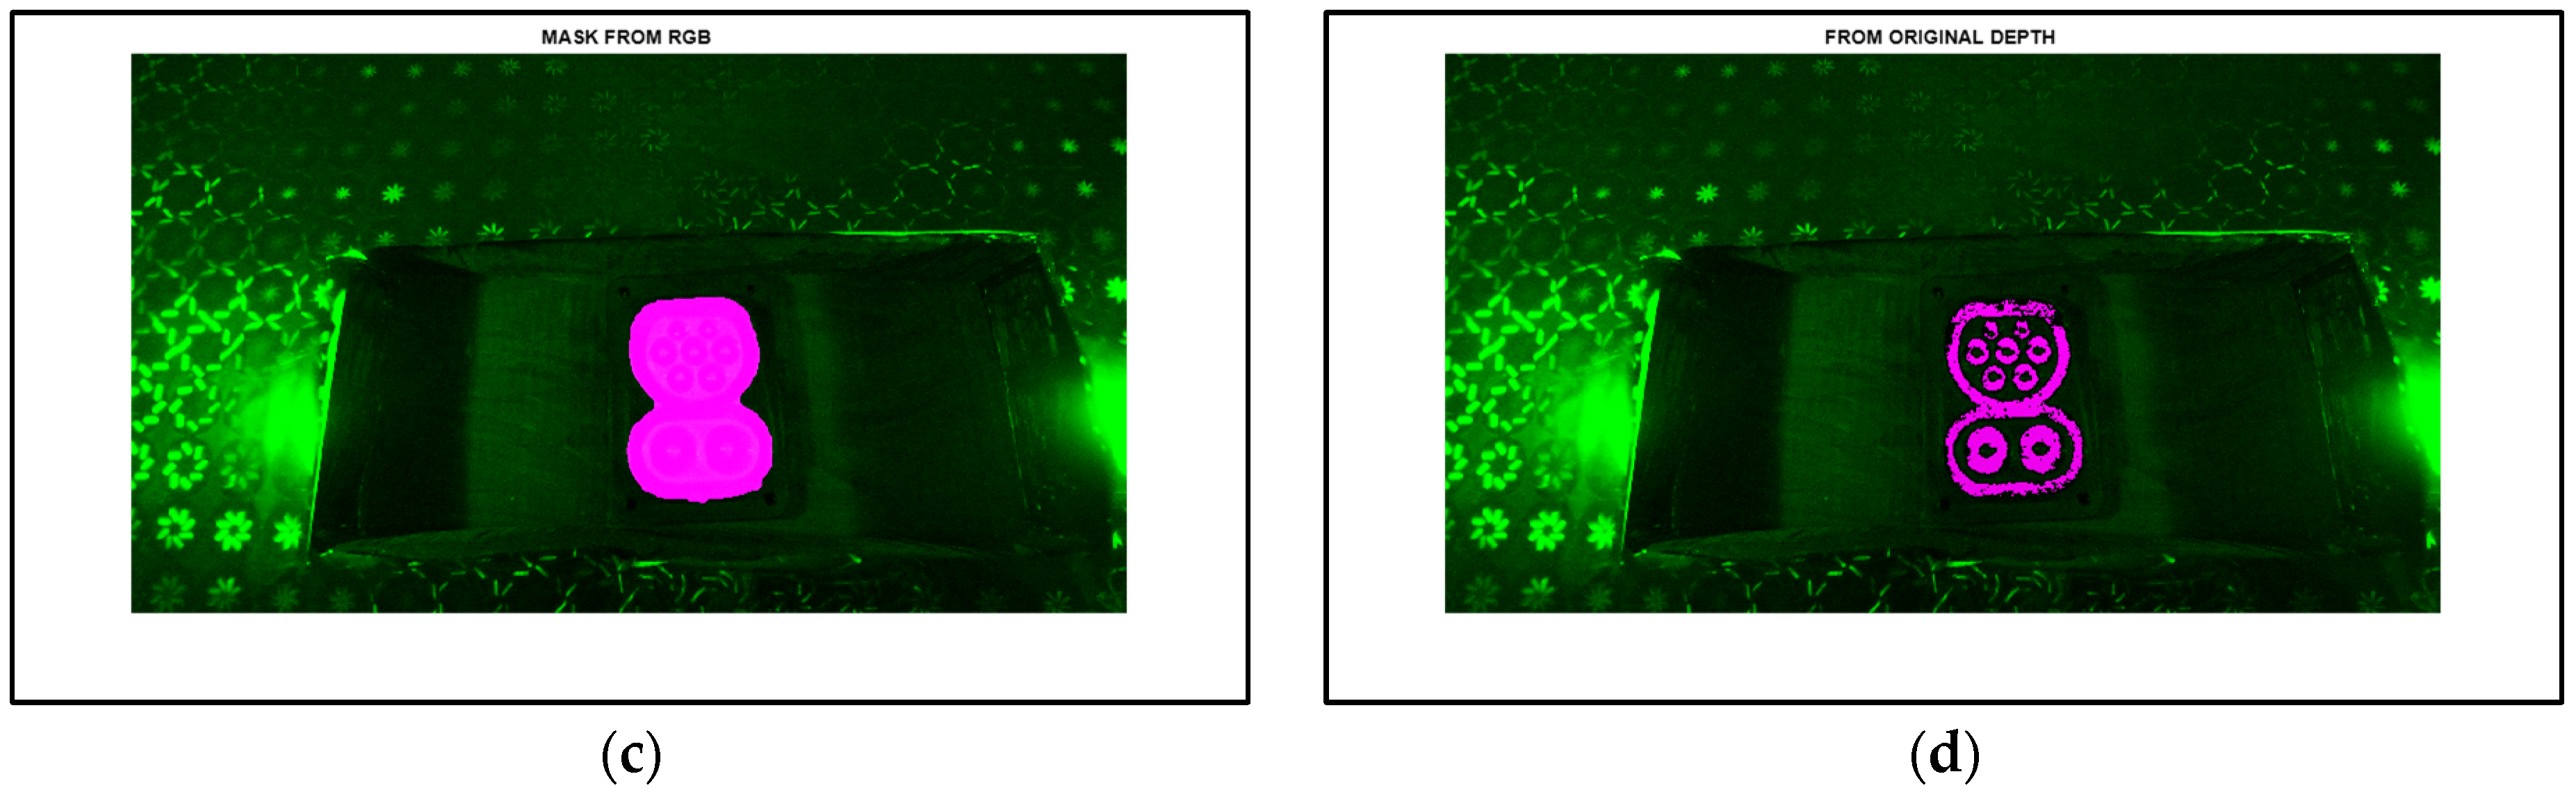
In the next example, a matted black vehicle body is chosen. As can be seen, the whole surrounding and the background of the socket is similarly dark. The LED lights are again fully turned on and the car body model with the socket is adequately illuminated. The image recording was conducted at daylight, with small shades visible from both sides of the socket area, as shown in
Figure 13a. The second image displays the effect of the intensity transformation. As shown in
Figure 13b, the CCS2 socket region is well highlighted; however, some surrounding image components remained from both sides of the socket, and there are some small black gaps inside the targeted object. Following the performed noise removal and morphological operations, the aimed binary mask of the socket is detected with high fidelity, as shown in
Figure 13c. The mask completely overlaps the socket in the original input image. In the end, after the final processing is accomplished, the connector is successfully detected and derived from the input depth map. The result of this extraction is presented in
Figure 13d. Due to the darkness and poor visibility of the input RGB image, the stereometric algorithm generated a low-quality depth map, and that is the reason for the damaged, torn-look socket textures in the resulting image. It is generally known that the main requirement of stereometry is the adequate visibility of all details in the left and right camera images in order to generate a depth map with adequate quality [
36]. However, despite the given low-quality depth map, the detection was successful and all the desired angles and coordinates were appropriately determined.
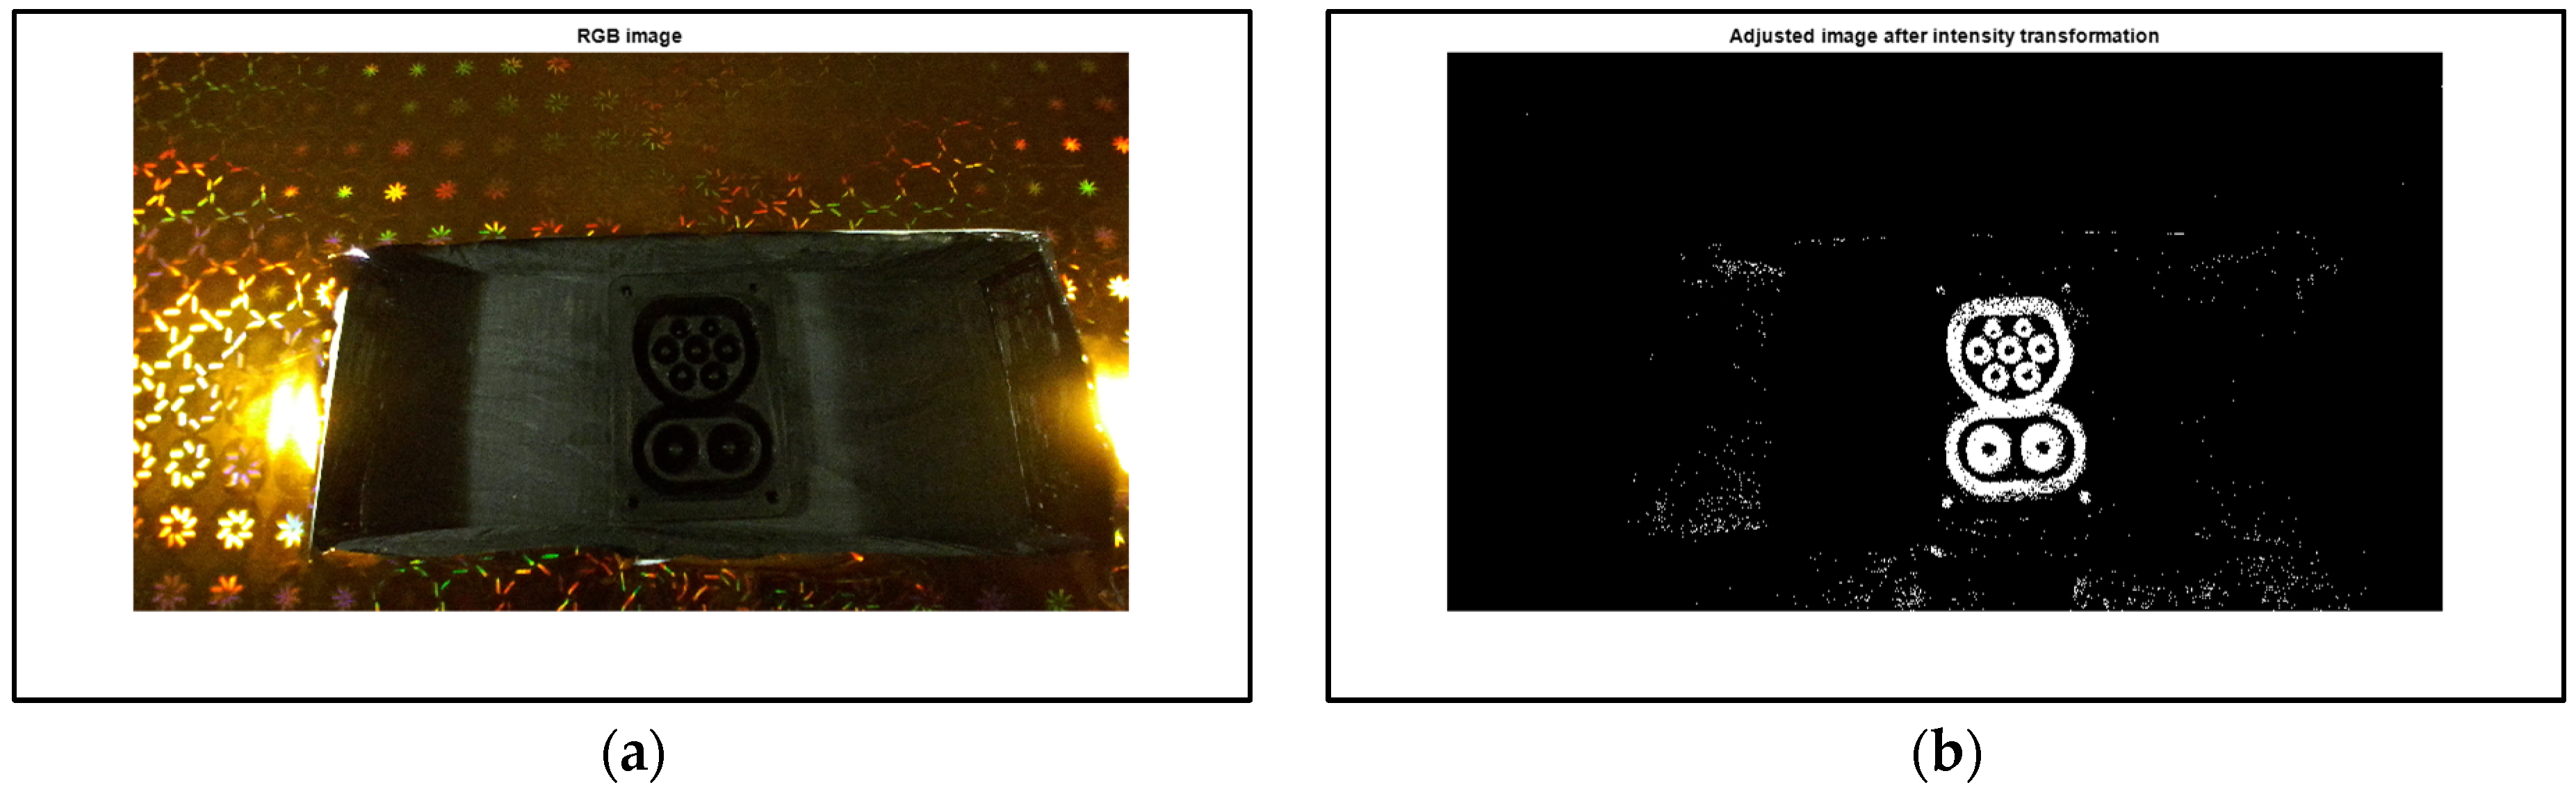
In the next experiment, in
Figure 14, a highly reflective yellow–gold-colored vehicle body model with bright small patterns was tested. The intensity of LED lights is maximal, and the reflection due to the illumination is very expressed near the connector region, as shown in
Figure 14a. The image was captured in the evening. The second example shows the outcome of the performed intensity transformation. The socket is highly distinguishable from the background, and only a small number of surrounding components remained. All those components are successfully removed with the proposed median filter [
41] and morphological filtering. As a result, in
Figure 14c, the binary mask is formed with high accuracy. Finally, executing the suggested post-processing operations, the CCS2 socket is detected and extracted, as shown in
Figure 14d. Again, the extracted connector contains small cracks; however, it is considered to be a satisfactory result and all the needed parameters are determined.
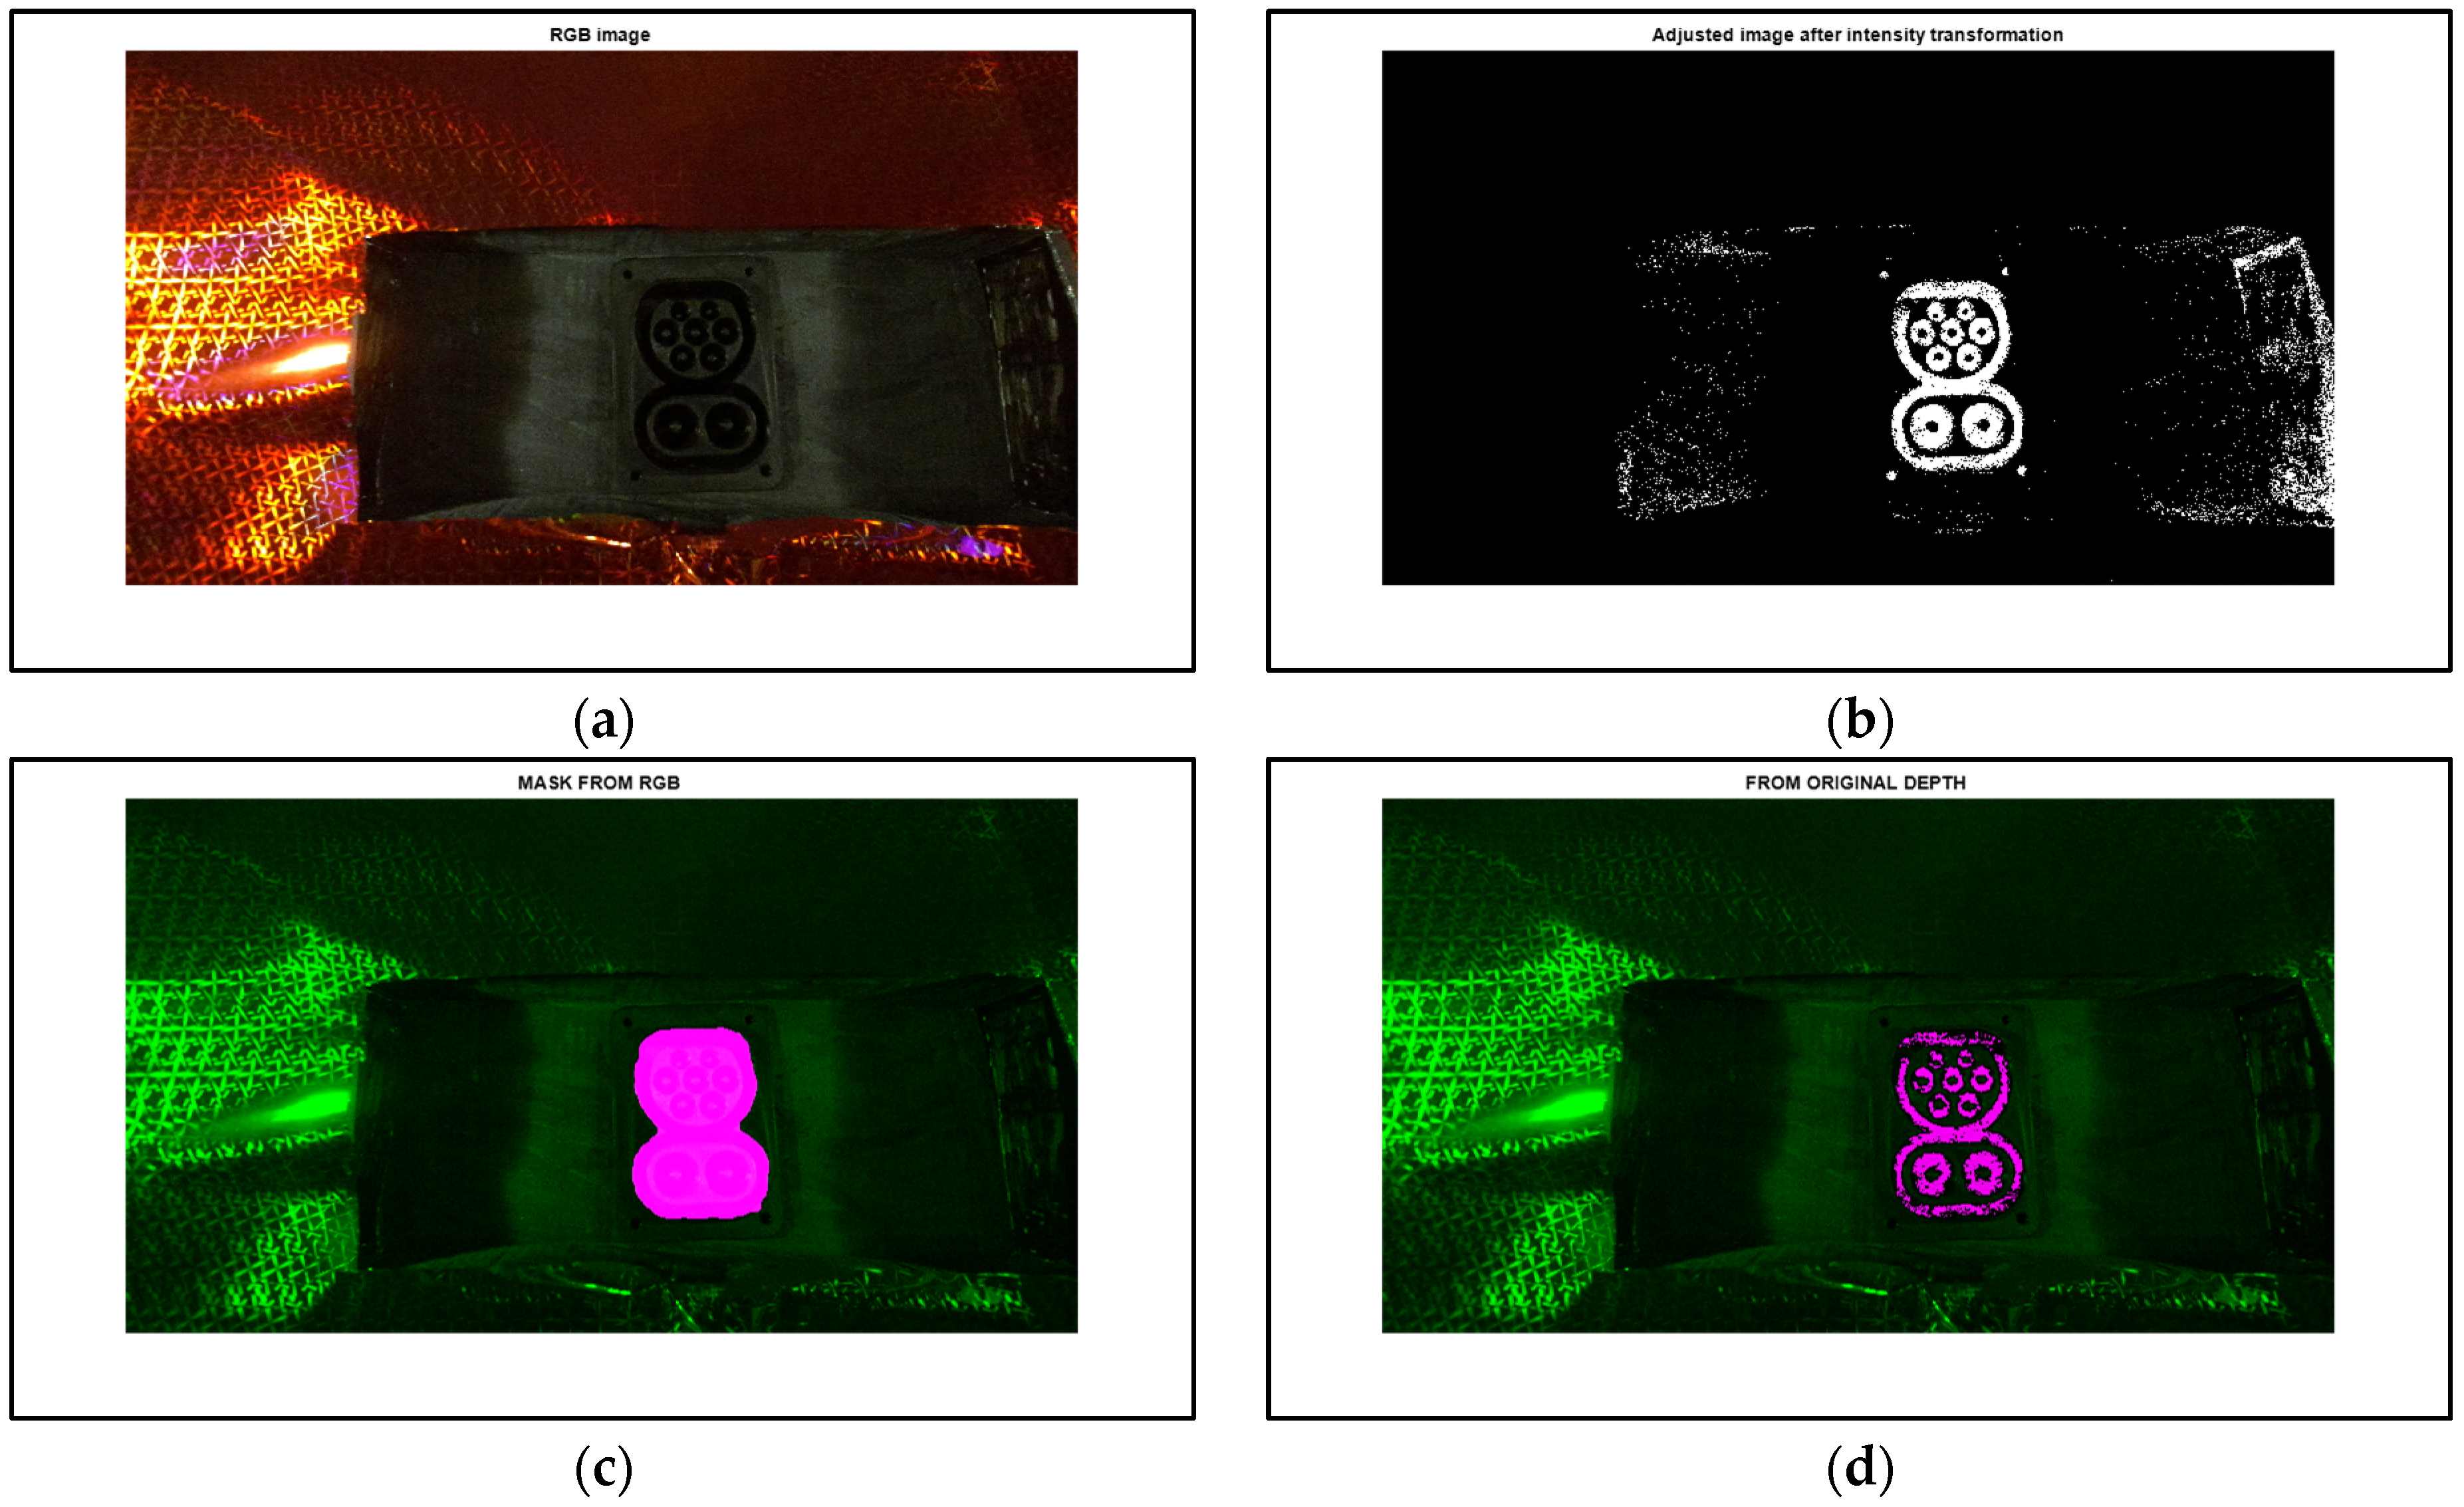
In the next example, a highly reflective red–gold-colored vehicle body model with bright small patterns was examined. Once more, the intensity of LED lights is maximal, and the reflection due to the illumination is very expressed close to the connector region, as shown in
Figure 15a. The image was captured at night.
Figure 15b shows the result of the execution of intensity transformation. The connector is highly visible and only a small number of image components remained; however, the upper left part of the socket is damaged slightly. After the noise removal and morphology operations are executed, the small image components are successfully removed, and a binary mask is obtained. The third example displays the binary mask overlapping the input image. As can be seen, the mask entirely covers the socket region with sufficient accuracy. Finally, performing the post-processing operations, the CCS2 socket is extracted, as shown in
Figure 15d. Again, the obtained socket contains small holes, it is ripped, and damaged slightly; however, all the required angles and coordinates are determined properly, since the extracted socket region provided sufficient depth information.
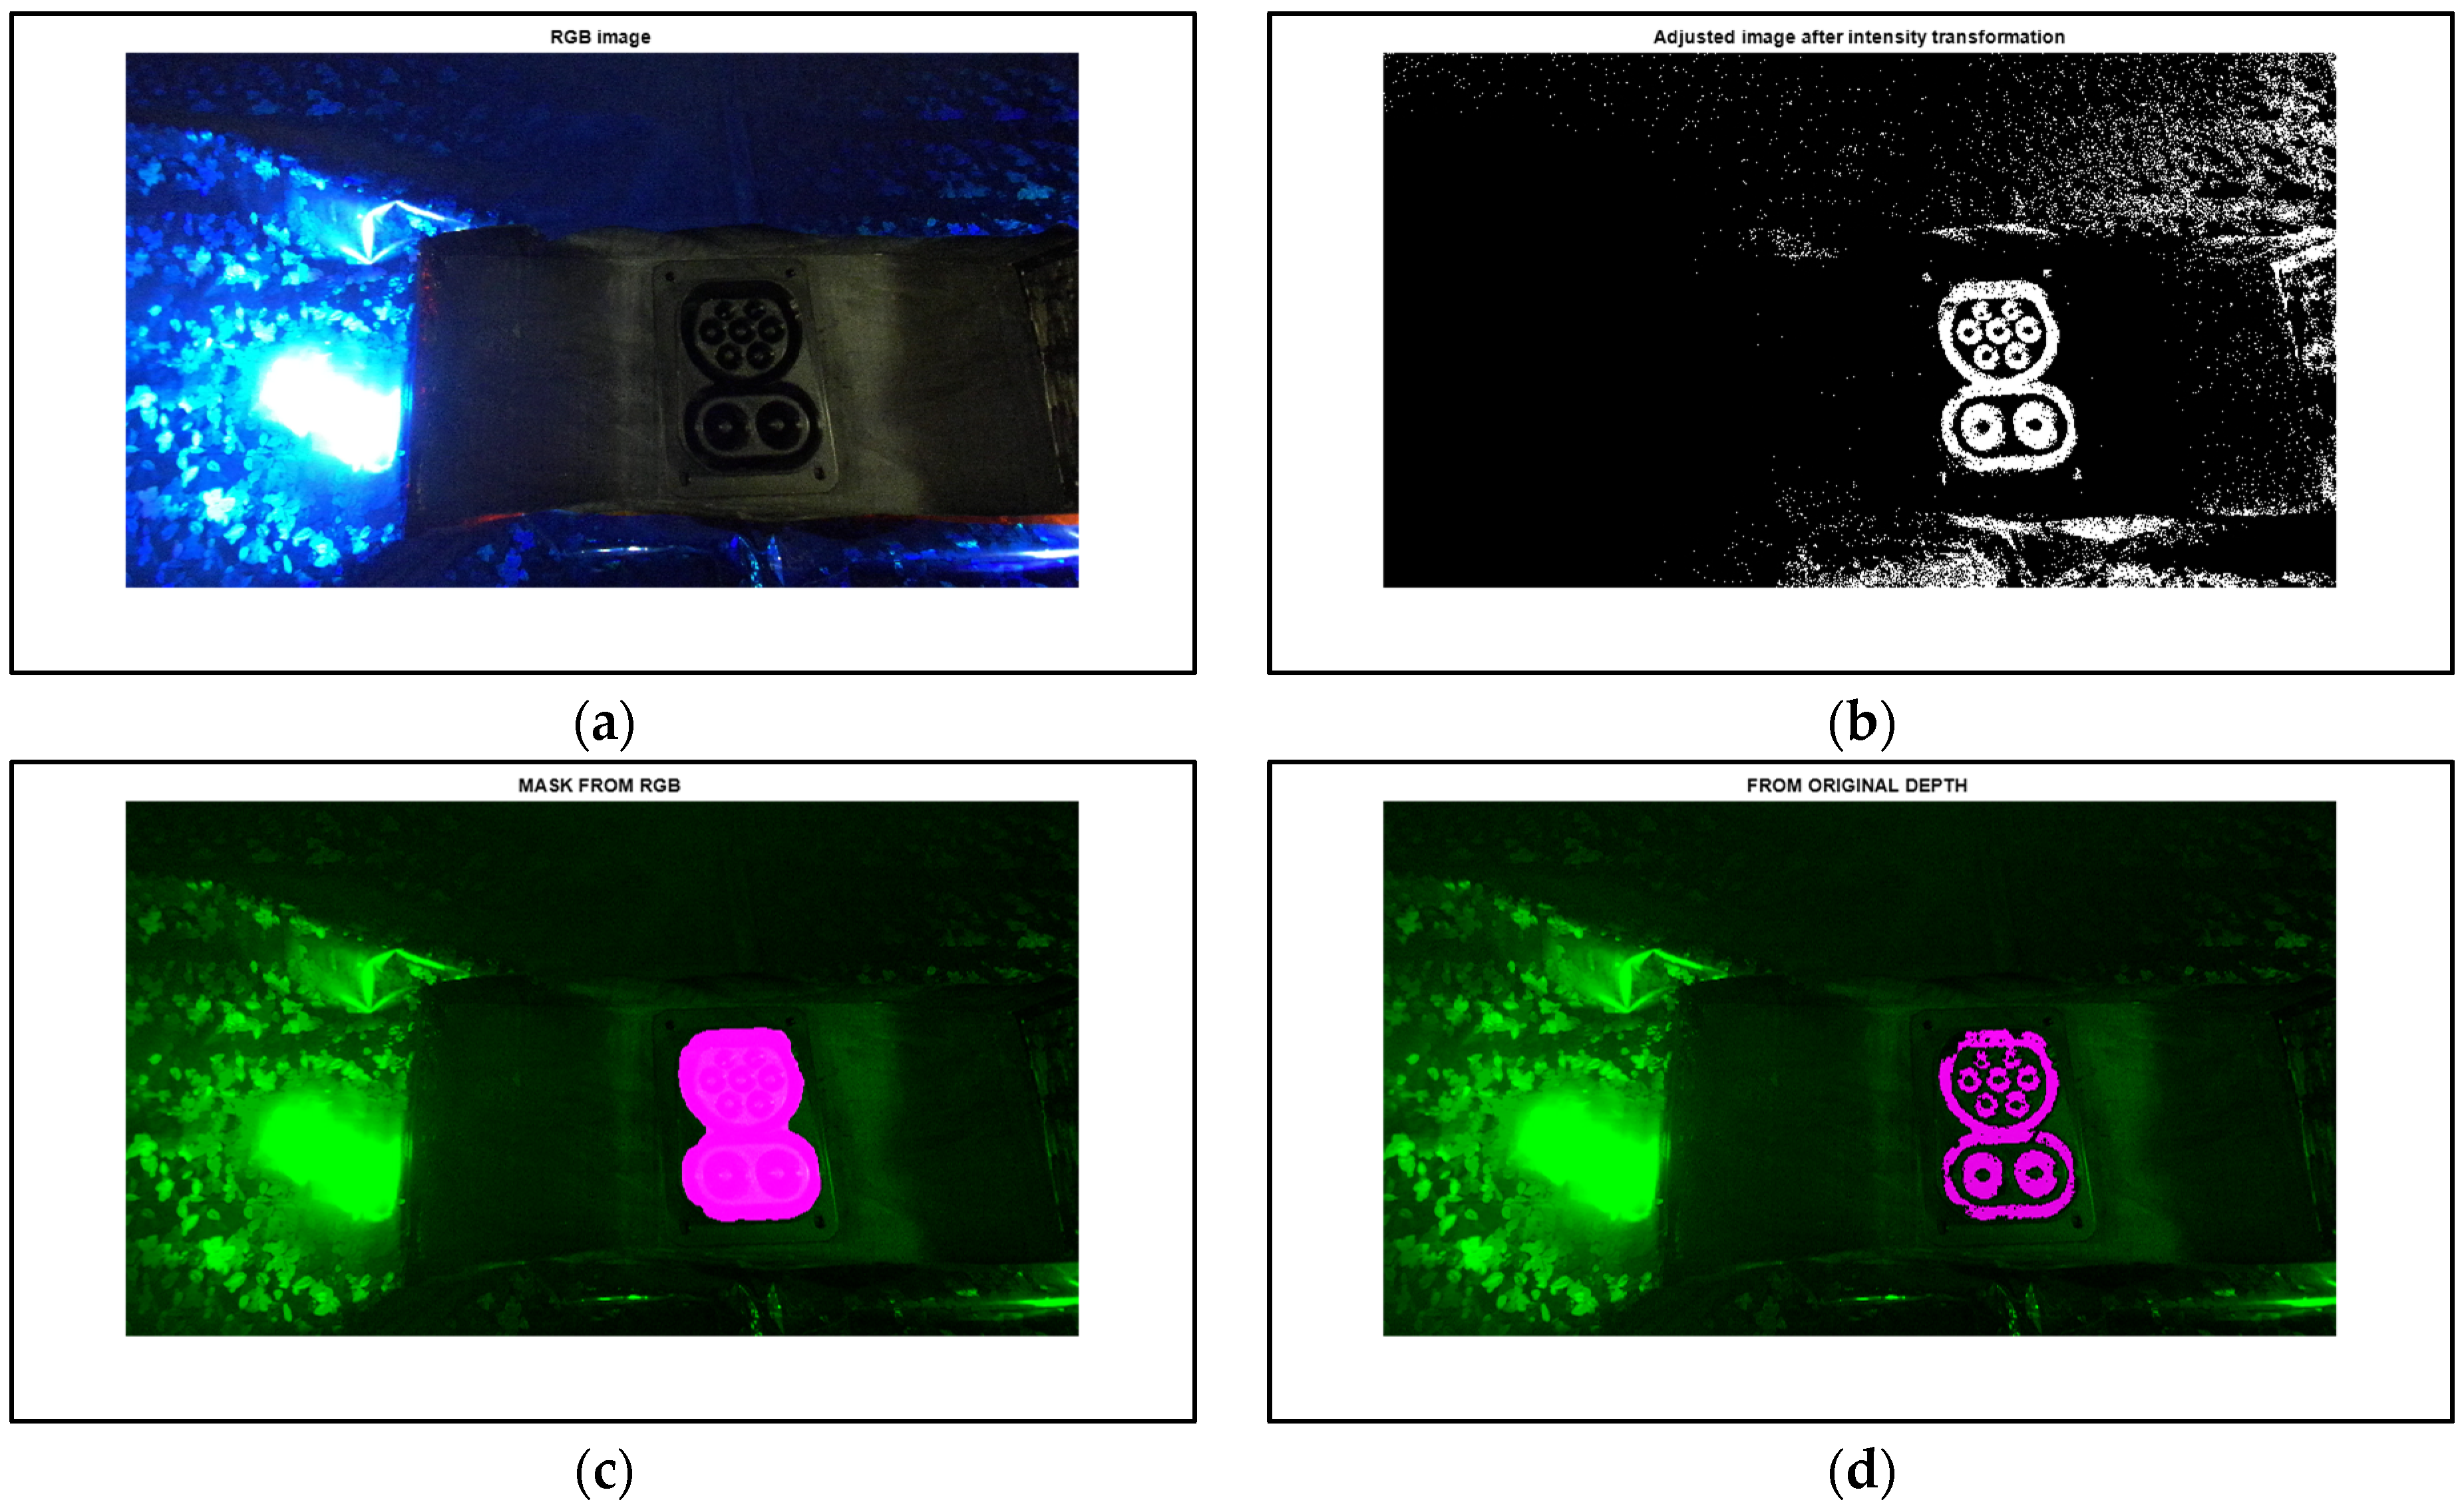
The final example presents a highly reflective blue–silver-colored car body model with bright small patterns. The LED lights intensity were fully on, and the reflection due to the illumination is very high in the connector region, as shown in
Figure 16a.
The image was captured in the evening with low intensity room lights turned on. The right part of the image is highly shadowed. In
Figure 16b, the outcome of the intensity transformation is shown. The connector is well noticeable, although a large number of image components remained in the right part of the image. After the median filtering and morphological processing were performed, all the remaining unwanted components were eliminated and the binary mask was formed successfully.
Figure 16c presents the binary mask surface. As can be seen, the mask overlaps the socket area with notable accuracy. In the end, executing the post-processing actions, the CCS2 socket is detected, as shown in
Figure 16d. Again, the extracted socket contains small gaps and its texture is slightly uneven; nevertheless, all the demanded tilt angles and centroid coordinates are calculated suitably, since it supplied adequate depth values from the extracted socket region.
In the end, it should be noted that the SEs in the morphological operations were defined empirically during the algorithm development. These SEs are size-dependent matrices, which means that they can be simply tuned depending on the size of the objects in the image, where the size of the shapes in the image depends on the model of the depth sensor, as well as on the range of the depth sensor from the object itself [
12,
36]. These modifications are very frequently made throughout the reproduction of this procedure. Additionally, the high-quality lens produces less dispersion when mapping the depth of the scene, and in the case of a poor-quality depth sensor with low quality lens, the socket detection and extraction cannot be successfully performed. This is because the determination of the Z distance values could be deficient, and this could result in missing the sufficient and accurate depth values in the socket surface that represents the CCS2 socket in the depth map. In this situation, the detection and extraction cannot be established.
Based on the experiments, the main limitations of the algorithm arise from inappropriate illumination conditions and artefacts caused by various influences such as shadows, light reflection, poor visibility, etc. All these issues can be solved with a proper illumination source that will provide a quality illuminated environment to the depth sensor, which will result in an adequately generated depth map.
The evaluation of the algorithm was performed on six previously presented vehicle body models with the mounted CCS2 socket under various lighting and capturing conditions. The successful detection rate was 94% based on 150 depth image measurements and the recorded corresponding RGB images. All the failed detections related exclusively to inadequate illumination conditions that deteriorated the appropriate socket detection and the proper generation of the depth map.
A comparison with other methods is very difficult, since all the proposed methods in the literature deal with the detection of Asian-type charging sockets, which have a different shape and content compared to the CCS2 socket. The CCS2 socket is a combined socket with two charging ports, with AC (Alternating Current) and DC (Direct Current) charging options. The Asian-type sockets contain only one charging port [
27,
28,
29,
30,
31,
32,
33,
34,
35]. Further, the presented procedure in this paper is using well-known, common image processing operations, and only the methods proposed by Zhang and Jin [
28] and Quan et al. [
30], where the reported success rates were 100% [
28] and 94.8% [
30], respectively, could be compared with it in some parts; however, the number of tested images/examples is not listed in the paper by Zhang and Jin. Overall, the proposed methods in the literature deal with the qualitative analysis without numerical results, or incomplete numerical results are reported without the listed image numbers in testing sets [
27,
28,
29,
30,
31,
32,
33,
34,
35]. However, due to the generality of the presentation,
Table 3 presents a comparison of the proposed method compared to other methods from the literature. As can be seen, the procedure presented in this paper achieved similar results regardless of the fact that only common and well-known image processing techniques were used in the algorithm development. It is expected that by improving the illumination quality of the scene and working in an industrial environment, the successful detection rate will be higher, hopefully near 100%.
Further, the qualitative comparison of the proposed method will be presented, comparing it to the Circular Hough Transform-based method proposed by Quan et al. [
30], since the testing conditions of their procedure is similar to the testing conditions in this research. A very important feature of the Asian-type socket is the regular circle-shaped frame around the electrical contacts; therefore, the Circular Hough Transform is very convenient for the detection of the Asian-type of sockets [
30]. The results of this detection approach are the coordinates of the circle centers with the corresponding radiuses. Moreover, as was noted, the Asian-type of charging socket has a different shape, content, size, and only one charging option. Thus, this comparison does not fully reflect the reality, since the compared algorithms are designed for different types of sockets that are not comparable in any matter. Further, in [
30], all the experiments were executed on only one dark vehicle body model (black panel) with the mounted Asian-type socket under various illumination conditions, while six differently colored vehicle body models were tested with the proposed algorithm in this study.
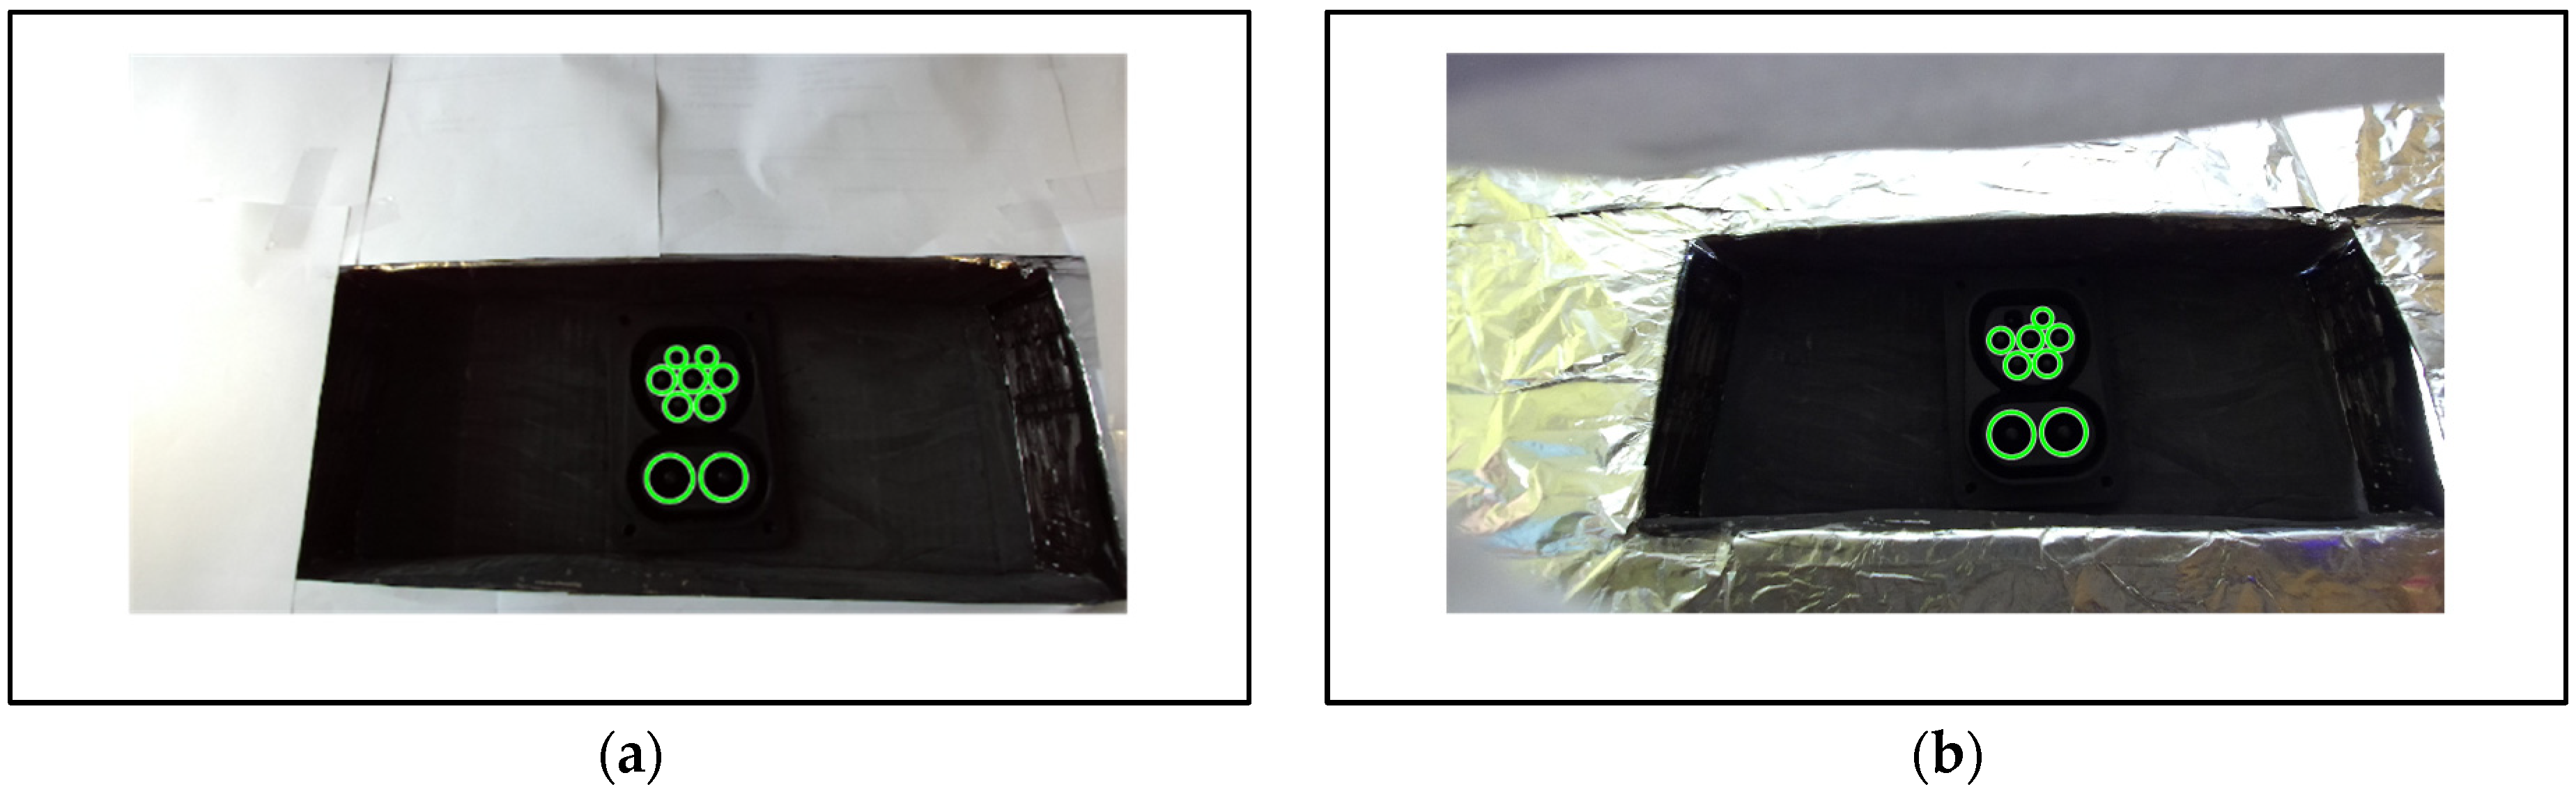
Figure 17 shows two examples from the comparison. The Circular Hough Transform is applied in the algorithm to specifically detect the circle-shape electrical contacts inside the socket body [
30], and the detection results are marked with green circles in the images.
Figure 17a presents an example of correct detection of the charging socket contacts, while the second image shows the result when one electric contact of the socket is not detected. The detection rate with the Circular Hough Transform is 90.7%; however, it should be noted that the comparison would be complete and appropriate if it was performed on the Asian-type of socket, since the Circular Hough Transform-based approach is developed specifically for that socket due to its circle-shaped frame [
30] around the electric contacts. Nevertheless, a meaningful comparison on the Asian-type of socket would also require an adaptation of the proposed algorithm due to the different shape of the socket, and that is outside the scope of this research.
Finally, this initial study entirely fulfilled the goal of the project, and the automatic detection of the charging socket with well-known image processing operations was achieved. The practical application of the obtained results will be tested in the future, where the experiments will be conducted with a robot on electric vehicles with adequate industrial illumination equipment. The future managerial implications are the rent of a certain number of electric vehicles for testing purposes and the construction of an adequate real-world parking space for experiments with the robot in an industrial environment.


