Article

Automatic Modulation Recognition Based on Deep-Learning Features Fusion of Signal and Constellation Diagram

1
State Key Laboratory of Complex Electromagnetic Environment Effects on Electronics and Information System (CEMEE), Luoyang 471003, China
2
School of Electronic Engineering, Xidian University, Xi’an 710071, China
3
Xi’an Satellite Control Center, Xi’an 710043, China
4
Academy For Network and Communications of CETC, Shijiazhuang 050081, China
*
Author to whom correspondence should be addressed.
These authors contributed equally to this work.
Electronics 2023, 12(3), 552; https://doi.org/10.3390/electronics12030552
Submission received: 12 December 2022 / Revised: 12 January 2023 / Accepted: 14 January 2023 / Published: 20 January 2023
(This article belongs to the Section Microwave and Wireless Communications)

Abstract

:
In signal communication based on a non-cooperative communication system, the receiver is an unlicensed third-party communication terminal, and the modulation parameters of the transmitter signal cannot be predicted in advance. After the RF signal passes through the RF band-pass filter, low noise amplifier, and image rejection filter, the intermediate frequency signal is obtained by down-conversion, and then the IQ signal is obtained in the baseband by using the intermediate frequency band-pass filter and down-conversion. In this process, noise and signal frequency offset are inevitably introduced. As the basis of subsequent analysis and interpretation, modulation recognition has important research value in this environment. The introduction of deep learning also brings new feature mining tools. Based on this, this paper proposes a signal modulation recognition method based on multi-feature fusion and constructs a deep learning network with a double-branch structure to extract the features of IQ signal and multi-channel constellation, respectively. It is found that through the complementary characteristics of different forms of signals, a more complete signal feature representation can be constructed. At the same time, it can better alleviate the influence of noise and frequency offset on recognition performance, and effectively improve the classification accuracy of modulation recognition.

1. Introduction

Automatic modulation recognition (AMR) is a critical step in signal detection and subsequent demodulation tasks [1], which aim to utilize prior information of signals to identify the modulation type in cognitive radio, electronic countermeasures, electromagnetic spectrum monitoring and other fields, etc. With the rapid development of communication technology and the increasing complexity of electromagnetic environment, the modulation types of signals have become more complex and diverse, and often have the characteristics of low intercept probability. These situations put forward higher requirements for modulation recognition.
Traditional AMR methods can be mainly divided into two categories: methods based on likelihood function [2,3,4] and methods based on feature extraction [5,6,7]. The former makes use of the Bayesian minimum error judgment criterion [8] to ensure the excellence of the identification results. However, such methods are sensitive to model parameters and lack generality and robustness [9]. The method based on feature extraction is based on the hand-crafted features, then on designing the backend classifier for final prediction. Features generally include instantaneous features, statistical features, spectral correlation features and transform domain features, etc. The traditional classifier adopts Decision Trees (DT) [10], K-Neareat Neighbor (KNN) [11], Support Vector Machine (SVM) [12], and Artificial Neural Network (ANN) [13]. Muller et al. used the SVM classifier for recognition based on instantaneous and phase characteristics, effectively alleviating the over-dependence of ANN classifier on training samples [14,15]. The methods based on an instantaneous feature have the advantages of small-amount computation and simple feature extraction process, which however is easy to be affected by channel noise and is difficult to tackle with low SNR circumstance. Therefore, the high-order cumulant (HOC) feature that is more robust to carrier offset and Gaussian noise is proposed. Mirarab et al. [16] used the eighth-order cumulant feature to distinguish 8PSK and 16PSK signals, the algorithm showed certain robustness to frequency offset. Wu et al. [17] provided a new direction for solving the problem of signal modulation recognition in blind channels by using the characteristics of fourth-order cumulants. In 2009, Orlic et al. [18] proposed the AMC method based on sixth-order cumulant, which further improved the signal recognition rate under real-world channel conditions. Wong et al. [19] proposed a new scheme combining HOC with the Naive Bayes (NB) classifier. The FB method completes the mapping of the signal sequence to different feature spaces by manually designing features, which face a large number of arithmetic and signal form changes. At the same time, the excessive dependence on features also makes the recognition effect of the FB method not ideal in the current complex electromagnetic environment.
With the development of deep learning (DL) theory, the research of modulation recognition methods based on DL gradually deepened and gradually replaced the traditional signal modulation recognition algorithm. Such algorithms are usually data-driven [20] and do not rely on design and extraction processes of complex hand-crafted features, but build compact signal representations through convolutional neural networks (CNN), which autonomically learn the feature information with high differentiation and robustness in the samples by using a large number of labeled data sets as the input samples of the network for training. This greatly improves the effectiveness of the extracted features and improves the recognition performance. Therefore, a large number of excellent modulation recognition methods have been derived using deep learning methods.
Compared with the traditional AMR method, the DL-based AMR methods include three types of feature representation:
(1) Feature representation. Using the original signal information, the signal is processed into a combination of a series of eigenvalues. Such as HOC characteristics, High-Order Moment (HOM) characteristics and other statistical characteristics. Hassank et al. [21] used HOM and Feedforward Neural Networks (FNN) to complete the AMR task. Xie et al. [22] utilized the neural network to extract sixth-order cumulant of signals, and achieved better recognition results under multipath and frequency offset conditions.
(2) Sequence representation. The signal is transformed into a vector, which is sent to the corresponding neural network as a sequence feature. Features in this pipeline include amplitude and phase sequence [23,24], IQ sequence [25,26] and FFT sequence [27], and so on. Wang et al. [28] used the knowledge-sharing CNN model to complete the learning of the common features of IQ samples under different Signal to Noise Ratio (SNR), improving the modulation recognition performance and generalization under different noise conditions. Liu et al. [29] combined CNN, gated recurrent unit and DNN to complete high-precision modulation recognition tasks.
(3) Image representation. The signal is transformed into a two-dimensional image, which includes constellation diagrams [30,31], time–frequency maps [32,33], cyclic spectrums [34,35], etc. Actually, the task is transformed into an image problem, and then the classic image recognition algorithm is used for recognition. Yang et al. [36] used constellation diagrams to train the network weights and realized the recognition of multiple modulated signals under different noises. Ma et al. [37] designed a new AMR algorithm using a low-order cyclic spectrum and deep residual network, which can effectively suppress impulse noise and extract discriminant features.
In addition to the feature-level AMR method, in view of network architectures, many excellent network structures have been proposed. In [38] achieved better recognition performance based on Constellation Graph Projection (GCP) algorithm and classical Deep Belief Network (DBN). In [39] used three-channel gray constellation diagrams and GoogleNet to effectively avoid the artificial feature design process and improve the classification accuracy of the signal. In [40] explored the classification performance of various convolutional neural networks (VGG16, VGG19, ResNet50, etc.). The VGG16 and VGG19 networks are composed of 16 or 19 small-size convolutional layers and three fully connected layers, respectively. ResNet50 is implemented by a five-stage residual connection block. By comparing the results, this paper finds the performance advantages of ResNet50 in signal modulation recognition based on constellation diagrams.
The above methods use the sequence or image representation of the signal, combined with the deep neural network to extract its features, and obtained better recognition results. However, only by combining signal preprocessing and deep learning methods to improve the existing algorithms, the following problems still remain to be solved: (1) Compared with the IQ signal, the constellation diagram loses some information of the signal. Meanwhile, the constellation diagram is sensitive to the frequency offset of the signal. When the signal sequence length is short, the constellation diagram features extracted by the network have poor robustness, and the classification results are easily affected. (2) Compared with the constellation diagram, the IQ signal is susceptible to noise. When the SNR is low, the signal feature extracted by the network lacks discrimination, and the classification result is not stable.
To solve the above problems, this paper proposes a deep-learning AMR structure of fusing IQ signal and constellation diagram, using dual branches to extract IQ signal and constellation depth features, respectively. In the signal branch, deep-learning architecture is utilized to map IQ signals to high-dimensional feature space. For the constellation diagram branch, a three-channel constellation diagram mapping module is embedded, and the feature is performed on each channel. Through the feature fusion of two branches, the feature information of the IQ signal and constellation diagram is complementary. At the same time, the algorithm can better alleviate the performance loss caused by noise and frequency bias. When SNR is −10 dB and the maximum random frequency bias is 50 kHz, the classification accuracy of 89% can be guaranteed.
The paper are organized as follows: Section 2 introduces the composition and internal details of the proposed feature fusion network, including convolution kernel parameters, step size, number, etc. In Section 3, parameters design and experiments of the proposed method are performed. Section 4 gives the conclusions.

2. Methods

In order to realize the feature matching and fusion between the IQ signal and constellation diagram, the IQ signal is used as the original input, and the projection process of the constellation diagram is embedded into the network structure.
Figure 1 is the signal and constellation diagram fusion network (SCFNet). The proposed model can be mainly divided into three parts: IQ feature branch, three-channel constellation diagram feature branch, and feature fusion module. SCFNet takes the IQ signal as the input and sends it to the dual-branch network structure for further processing.
The IQ branch takes the original IQ signal as input, six convolution-pooling layer groups are followed for feature mapping, and high-dimensional features are fused for the AMR. The constellation branch maps IQ signal to three-channel constellations by the enhanced constellation diagram (ECD) [41] algorithm, as shown in C 1 , C 2 and C 3 in Figure 1. C 1 is a linear mapping, which aims to map the constellation matrix C into an 8-bit grayscale image. C 2 is a logarithmic map, used to enhance the small values in C, designed to suppress pulse interference. C 3 is an exponential mapping, which is used to enhance the large value in C to suppress background noise. The expressions of the three mapping functions are as follows:
C 1 = f 1 ( C ) = C C m i n C m a x C m i n × 255
where C m a x and C m i n are the maximum and minimum values of matrix C, respectively.
C 2 = f 2 ( C ) = α 1 log 2 ( β 1 f 1 ( C ) + 1 )
C 3 = f 3 ( C ) = α 2 e f 1 ( C ) β 2 1
where α 1 , α 2 , β 1 , and β 2 are predefined constants.
After obtaining three constellation diagrams, the correspondence between the I and Q components is captured by one-dimensional convolution unidirectional sliding. For constellation diagram C 1 , one-dimensional convolution will slide from top to bottom to obtain the change of I with Q. For constellation diagram C 2 , it will be transposed to exchange I and Q, so as to obtain the change of Q with I. Since the constellation diagram is a two-dimensional representation of the signal, the two-dimensional convolution is also used to extract the features of C 3 . The above processing for the individual sub-branch of the constellation diagram makes full use of the information of the three-channel constellation diagram and improves the richness of features. The proposed method designs different branch structures for different characteristics. The network structure and parameters of each branch are introduced below.
For the C 1 and C 2 constellation diagrams, the branch network structure is shown in Table 1. The input I/Q signal dimension is 1024 × 2, and the pixel size of the constellation diagram is 64 × 64. It can be seen from Table 1 that the one-dimensional convolution of the 3 × 64 convolution kernel can reduce the two-dimensional constellation diagram features with an input size of 64 × 64 to one-dimensional features with a size of 64 × 1. Subsequently, the small-size convolution kernel of 3 × 1 will be used for processing in order to reduce the number of parameters. After the convolution of each layer, ReLU is used as the activation function. Finally, the outputs of both C 1 and C 2 constellation diagram branches are 16 × 1.
Table 2 shows the network structure of the C 3 constellation diagram branch. The branch uses two-dimensional convolution and maximum pooling to design the corresponding network structure, and uses a 3 × 3 small-size convolution kernel for feature extraction, thereby reducing the number of parameters and eventually outputting 4 × 4 two-dimensional features. The fusion module reshapes it into 16 × 1 high-dimensional features.
Table 3 is the IQ signal branch network structure, which has six convolution-pooling layers for feature extraction. In addition to the first layer, the real and imaginary parts of the IQ signal is subjected to a bidirectional one-dimensional convolution. The size of the remaining convolution kernels is set to 3 × 1, which can effectively reduce parameters amounts and save the operation and time overhead of training. It can be seen from the table that the original IQ signal is finally output as a 16 × 1 high-dimensional feature after dimensionality reduction, which is fused with the high-dimensional constellation diagram features.
As shown in Figure 1, the fused features are sent to the convolution-pooling assembly and two fully connected layers for final classification. Finally, the modulation type of the output signal is obtained. Because multi-layer convolution has been included in the branch before fusion, the fused features are not trained by the too deep convolutional neural network.

3. Experiments

In order to study the effectiveness of the proposed method based on multi-feature fusion, this section will design the optimal parameters through ablation experiments. Meanwhile, the performance of the feature fusion network is explored by the single feature following the classical feature extraction network. In the experiment, the classification accuracy index is used to measure the recognition effect, which is defined as follows:
a c c u r a c y = N t u r e N s i g n a l × 100 %
where N t u r e and N s i g n a l represent the number of signals correctly identified in the test set and the total number of signals, respectively.

3.1. Detailed Overview of Network Training

This section will design the parameters of the network from the aspects of dataset size and training learning rate. The proposed method is used to identify 4ASK, 2PSK, 4PSK, 8PSK, 16QAM, 32QAM, 64QAM and 128QAM signals, and the optimal parameters are adjusted and determined. The initial network learning rate is set to 0.001, the batch size is 64, the optimizer is Adam, and the IQ signal length is 1024 × 2. The total number of training epochs is 200, and the training time is 132.7 s.

3.1.1. Recognition Comparisons of the Proposed Methods under Various Signal Amounts

To study the influence of different dataset sizes on recognition accuracy, three datasets with different sizes are produced in this section. The dataset contains eight types of signals under five SNRs. Due to the complex channel environment in the actual signal transmission process, the received signal may have a frequency offset. In order to simulate the real transmission scenario, the maximum random frequency offset of the signal is set to 50 kHz. At each SNR, the number of samples for each type of signal is a fixed value of 1000. The number of single signal samples in the training set is set to 250, 500 and 750, respectively, and the rest is used as the test data set, that is, the three data sets contain 10,000, 20,000, and 30,000 signal samples, respectively. The simulation results are shown in Figure 2.
It can be seen from Figure 2 that the model based on dataset 3 training has the best classification performance and can obtain higher recognition accuracy. Due to the existence of noise, digital signals will have different degrees of error codes, which brings difficulties to subsequent modulation recognition. The effectiveness of features can alleviate the influence of noise to a certain extent. The more samples in the dataset, the greater the possibility of extracting effective features, and the better the trained model. The results in the figure also reflect this conclusion.

3.1.2. The Influence of Learning Rate on the Accuracy Performance

The learning rate is an important hyper-parameter in the training process of the deep neural network, which also affects the training effect of the model. In order to select the optimal learning rate, this section sets different learning rates. The simulation results are shown in Figure 3. As seen in Figure 3, different learning rates will lead to a big gap in classification accuracy. When the learning rate is 0.001, the model has the best classification performance. Too large or too small a learning rate will cause different degrees of accuracy loss. When the learning rate is too large, the network may not converge; when it is too small, the network may converge slowly or fall into the local optimum, and there is not a simple linear relationship between learning rate and classification accuracy.

3.2. Analysis of Experimental Results

3.2.1. Ablation Experiment

The modulation recognition algorithm proposed in this paper aims to improve the classification effect and anti-disturbance performance of the network by using complementary information between IQ signal features and constellation diagram features. To study the effectiveness of the proposed method and the fusion features, the following experiments will be carried out for different scenarios. The input dataset contains eight modulation signals under 11 SNRs, the training set and the test set contain 30,000 and 10,000 signals, respectively, and the IQ signal length is set to 1024 × 2.
Figure 4 is the accuracy curve of the modulation recognition method based on different features on the test set without frequency offset. The result shows that the classification accuracy of the recognition method based on joint features and constellation diagram is significantly superior to that of the method based on IQ signal. Under the set SNRs, the classification accuracy based on joint features is higher than that based on the constellation diagram. When the SNR is −10 dB, the accuracy of the method based on the IQ signal is only 75.5%, while the classification accuracy of the other two methods is more than 98%. Under the condition of no frequency offset, compared with the original IQ signal, the constellation diagram feature has a better characterization of the signal, which is conducive to the modulation classification of the signal.
To explore the influence of signal frequency offset on the performance of the proposed method and the traditional single-feature modulation recognition algorithm, an experimental scene with a maximum random frequency offset of 50 kHz is designed. There are eight modulation signals under 5 SNRs in the target dataset, the training set and the test set contain 30,000 and 10,000 signals, respectively, and the final experimental results are shown in Figure 5. It shows that the classification accuracy based on different features is reduced to some extent in the scene with frequency offset. When the SNR is −10 dB, the classification accuracy based on the single constellation diagram feature is reduced from 98% to 81%. In the presence of frequency offset, the constellation diagram point clusters will rotate to different degrees by making the received signal lose the original constellation position information on the IQ plane, which can identify not only the signal modulation mode well, but suffer poor recognition ability of the algorithm. Constellation diagram features are easily affected by frequency offset. Under the condition of high frequency offset, the recognition ability of the algorithm is poor. However, under various SNRs, the accuracy of the modulation recognition method based on joint features is higher than that of the other two methods based on single features. Thus, the joint feature effectively combines the advantages of two single features and can obtain better recognition results.

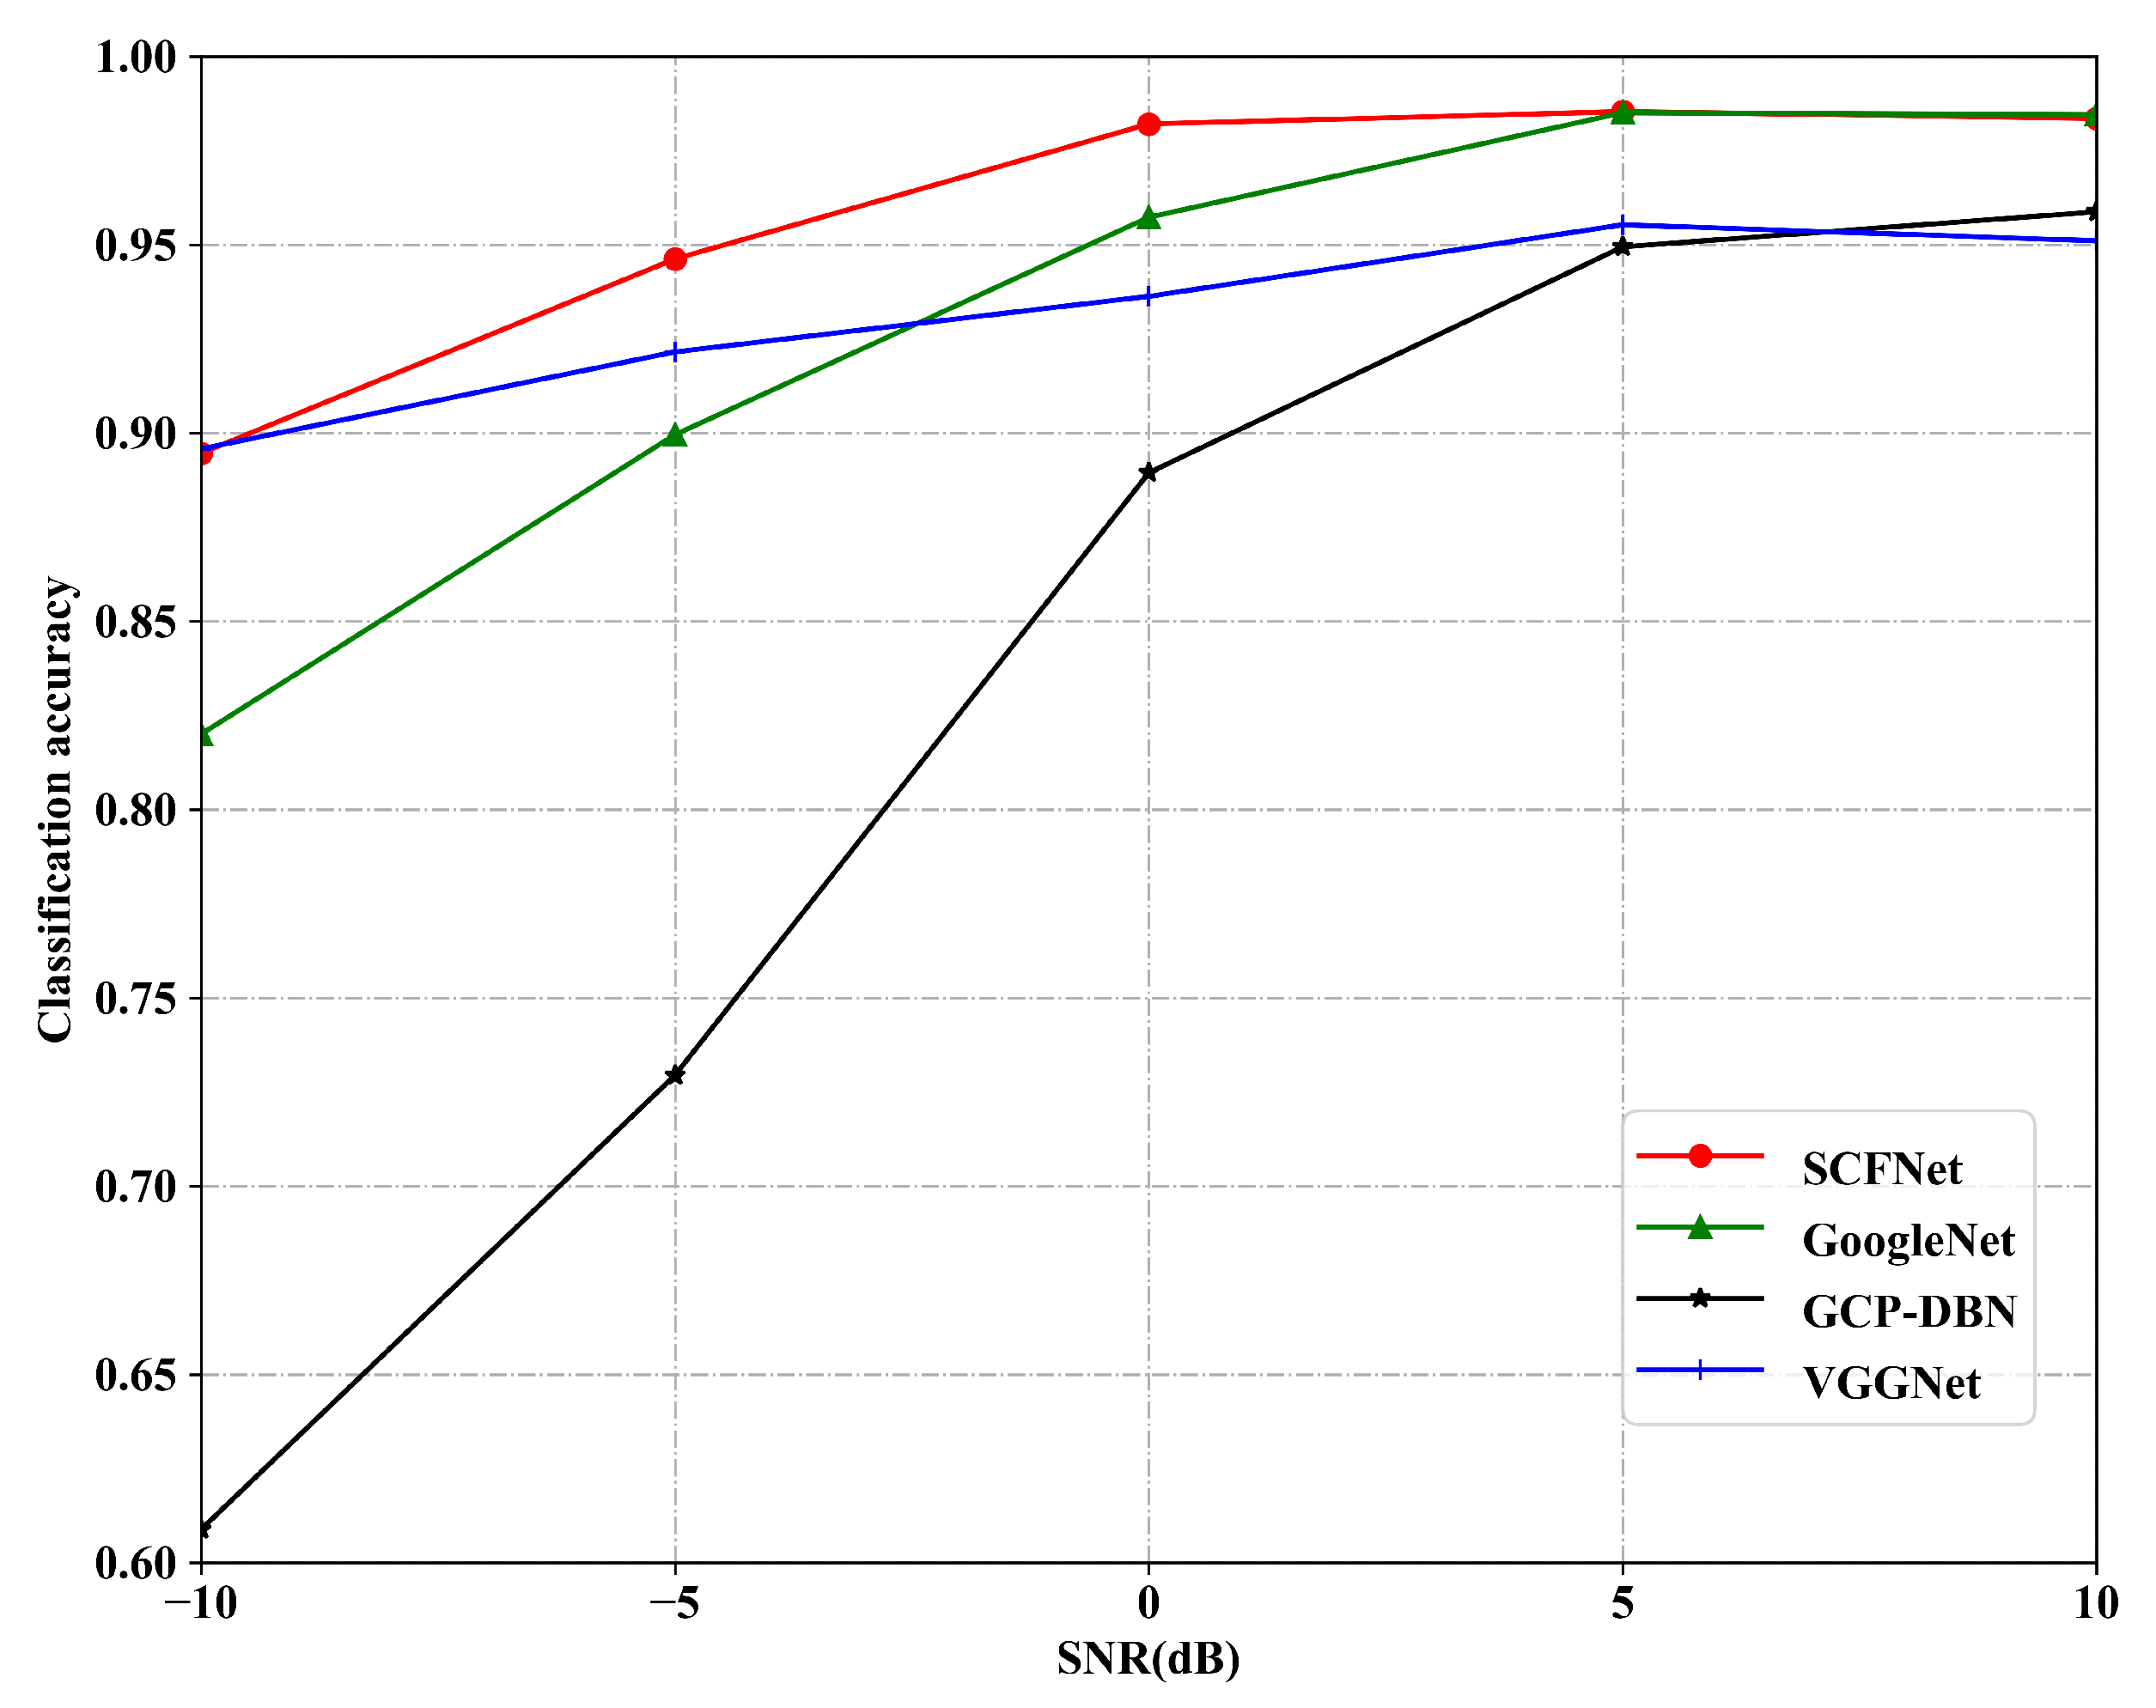
3.2.2. Contrast Experiments

After selecting the optimal parameters and verifying the effectiveness of fusion features, to further analyze the overall performance of the proposed method, this section compares the proposed method with other advanced network models applied to modulation recognition through simulation experiments according to the selected optimal parameters. The comparison methods include the classical convolutional neural network models GoogleNet, VGGNet, GCP–DBN, and so on.
The experiment uses 8 kinds of modulation signals under 5 kinds of SNRs as classification targets. Each type of signal in the data set has 1000 signal samples. The ratio of train set to test set is 3:1, and other parameters are set as shown in the Table 4, Fo and Fc represent the maximum random frequency offset and carrier frequency parameters of the signal, respectively.
Considering the classification accuracy of various methods on the test set for 8 common modulation signals of 4ASK, 2PSK, 4PSK, 8PSK, 16QAM, 32QAM, 64QAM, and 128QAM under the condition of frequency offset, the results are shown in the Figure 6, some experimental results are shown in Table 5.
The figure shows that the recognition performance of the GCP–DBN algorithm is more unstable. As the SNR gradually decreases, its classification accuracy decreases rapidly. At −10 dB, the classification accuracy is only about 60%, while the classification accuracy of the proposed method is 89%, which is much higher than GCP–DBN algorithm. Comparing the classification accuracy of different methods, it can be found that the classification rate of the proposed SCFNet method is higher than other methods. At the same time, compared with other network structures, the structure of SCFNet is simpler with fewer parameters and calculations. When the signal sample size in the dataset is large, the corresponding training time overhead can be reduced. Under the same conditions, SCFNet has better recognition performance.
To study the influence of frequency offset on the experimental results, and to facilitate the comparison of the anti-frequency offset performance of different methods, five maximum random frequency offsets of 0 kHz, 25 kHz, 50 kHz and 100 kHz are set when the SNR is −5 dB, and different datasets are made. The dataset composition is consistent with the previous experiment. The experimental results of the test set are shown in Figure 7. The HOC1 in the experiment is four high-order cumulant features of C42, |C40 | / | C42|, |C63 | 2 / | C42 | 3 and |C80 | / | C42 | 2 . HOC2 represents the five high order cumulant features of C40, C42, C43, C60 and C63. Under the above commonly used HOC features, the modulation signals selected in the experiment can be better distinguished The HOC1–SVM method uses the support vector machine as the classifier and maps the input data to the high-dimensional space through the kernel function, thereby establishing the maximum interval hyperplane, and classifying by maximizing the distance between the sample and the decision surface. HOC2–NaiveBayes utilizes the NaiveBayes classifier to output the final classification result using the optimal criterion.
The figure shows that in the scene without frequency offset, the classification accuracy of GoogleNet, VGGNet and SCFNet is similar and the recognition effect is better, while the classification accuracy of GCP–DBN, HOC1–SVM and HOC2–NaiveBayes is lower. With the increase of frequency offset, the classification accuracy of all algorithms has been reduced to varying degrees. In the same frequency offset scenario, the accuracy of GCP–DBN algorithm is generally lower than other algorithms, and the classification accuracy of the modulation recognition method based on SVM is slightly lower than that based on NaiveBayes. Combining Figure 6 and Figure 7, it can be found that the performance of GCP–DBN method is relatively unstable, and its classification accuracy will be greatly affected in the face of common interference in the process of signal transmissions, such as noise and frequency offset. For the three methods of GoogleNet, VGGNet and SCFNet, when the maximum random frequency offset is in the range of 25 kHz to 100 kHz, GoogleNet and VGGNet both decrease by more than 15%, while the classification accuracy of SCFNet decreases from 96% to 90%. It can be seen that the large frequency offset has a great influence on the recognition performance of various networks. However, SCFNet can alleviate the performance loss caused by noise and frequency offset, and has excellent modulation recognition performance in non-ideal large interference scenarios.

4. Conclusions

The experimental results show that the proposed method is with superior recognition performance under the conditions of low SNR and high frequency offset. In our scenario, SCFNet achieves the recognition rate of 90% to 95%. When the maximum frequency offset increases from 25 kHz to 100 kHz, the recognition accuracy of the classical convolutional neural network is reduced by at least 15%, while the classification accuracy of the proposed method only has a decrease within 6%. It can be seen that SCFNet has stronger robustness to the influence of noise and frequency offset. The main reason is that the multi-feature fusion network combines the feature information of IQ signal and constellation diagram, which improves the robustness of extracted features. Additionally, combination of signal information and constellation diagram representation enables to alleviate the influence of frequency offset and noise on recognition, which provides a new research idea to AMR. Considering that different types of single features are complementary, future work can focus on the fusion of more features, in order to alleviate the information loss during signal transmission and demodulation in the current complex electromagnetic environment.

Author Contributions

Conceptualization, Z.Z. and L.L.; methodology, Z.Z. and Z.Y.; formal analysis, L.L. and M.W.; funding acquisition, S.G., H.H., Z.Z. and L.L.; investigation, B.L.; supervision, L.L.; validation, Z.Y. and B.L.; visualization, S.G., Z.Z. and B.L.; writing—original draft, Z.Y. and Z.Z.; writing—review and editing, Z.Z. and L.L. All authors have read and agreed to the published version of the manuscript.

Funding

This work is partially supported by the Open Project of State Key Laboratory of Complex Electromagnetic Environment Effects on Electronics and Information System under Grants #CEMEE2022K0103A, the National Natural Science Foundation of China under Grants #62203343, #62071349 and #U21A20455, and Key Research and Development Program of Shaanxi (Program No. 2023-YBGY-223).

Institutional Review Board Statement

Not applicable.

Informed Consent Statement

Not applicable.

Data Availability Statement

Not applicable.

Acknowledgments

The authors wish to express their appreciation to the editors for their rigorous and efficient work and the reviewers for their helpful suggestions, which greatly improved the presentation of this paper.

Conflicts of Interest

The authors declare that they have no conflict of interest to report regarding the present study.

References

  1. Mao, Q.; Hu, F.; Hao, Q. Deep learning for intelligent wireless networks: A comprehensive survey. IEEE Commun. Surv. Tutor. 2018, 20, 2595–2621. [Google Scholar] [CrossRef]
  2. Häring, L.; Chen, Y.; Czylwik, A. Automatic modulation classification methods for wireless OFDM systems in TDD mode. IEEE Trans. Commun. 2010, 58, 2480–2485. [Google Scholar] [CrossRef]
  3. Salam, A.O.A.; Sheriff, R.E.; Al-Araji, S.R.; Mezher, K.; Nasir, Q. A unified practical approach to modulation classification in cognitive radio using likelihood-based techniques. In Proceedings of the 2015 IEEE 28th Canadian Conference on Electrical and Computer Engineering (CCECE), Halifax, NS, Canada, 3–6 May 2015; pp. 1024–1029. [Google Scholar]
  4. Xu, J.L.; Su, W.; Zhou, M. Likelihood-ratio approaches to automatic modulation classification. IEEE Trans. Syst. Man Cybern. Part C (Appl. Rev.) 2010, 41, 455–469. [Google Scholar] [CrossRef]
  5. Huang, S.; Lin, C.; Xu, W.; Gao, Y.; Feng, Z.; Zhu, F. Identification of active attacks in internet of things: Joint model-and data-driven automatic modulation classification approach. IEEE Internet Things J. 2020, 8, 2051–2065. [Google Scholar] [CrossRef]
  6. Dobre, O.A.; Abdi, A.; Bar-Ness, Y.; Su, W. Survey of automatic modulation classification techniques: Classical approaches and new trends. IET Commun. 2007, 1, 137–156. [Google Scholar] [CrossRef] [Green Version]
  7. Huang, S.; Yao, Y.; Wei, Z.; Feng, Z.; Zhang, P. Automatic modulation classification of overlapped sources using multiple cumulants. IEEE Trans. Veh. Technol. 2016, 66, 6089–6101. [Google Scholar] [CrossRef]
  8. Abdi, A.; Dobre, O.A.; Choudhry, R.; Bar-Ness, Y.; Su, W. Modulation classification in fading channels using antenna arrays. In Proceedings of the IEEE MILCOM 2004. Military Communications Conference, Monterey, CA, USA, 31 October–3 November 2004; Volume 1, pp. 211–217. [Google Scholar]
  9. Wei, W.; Mendel, J.M. Maximum-likelihood classification for digital amplitude-phase modulations. IEEE Trans. Commun. 2000, 48, 189–193. [Google Scholar] [CrossRef]
  10. Furtado, R.S.; Torres, Y.P.; Silva, M.O.; Colares, G.S.; Pereira, A.M.; Amoedo, D.A.; Valad ao, M.D.; Carvalho, C.B.; da Costa, A.L.; Júnior, W.S. Automatic Modulation Classification in Real Tx/Rx Environment using Machine Learning and SDR. In Proceedings of the 2021 IEEE International Conference on Consumer Electronics (ICCE), Las Vegas, NV, USA, 10–12 January 2021; pp. 1–4. [Google Scholar]
  11. Zhu, Z.; Aslam, M.W.; Nandi, A.K. Augmented genetic programming for automatic digital modulation classification. In Proceedings of the 2010 IEEE International Workshop on Machine Learning for Signal Processing, Kittila, Finland, 29 August–1 September 2010; pp. 391–396. [Google Scholar]
  12. Dong, S.; Li, Z.; Zhao, L. A modulation recognition algorithm based on cyclic spectrum and SVM classification. In Proceedings of the 2020 IEEE 4th Information Technology, Networking, Electronic and Automation Control Conference (ITNEC), Chongqing, China, 12–14 June 2020; Volume 1, pp. 2123–2127. [Google Scholar]
  13. Ya, T.; Lin, Y.; Wang, H. Modulation recognition of digital signal based on deep auto-ancoder network. In Proceedings of the 2017 IEEE International Conference on Software Quality, Reliability and Security Companion (QRS-C), Prague, Czech Republic, 25–29 July 2017; pp. 256–260. [Google Scholar]
  14. Muller, F.C.; Cardoso, C.; Klautau, A. A front end for discriminative learning in automatic modulation classification. IEEE Commun. Lett. 2011, 15, 443–445. [Google Scholar] [CrossRef]
  15. Nandi, A.K.; Azzouz, E.E. Algorithms for automatic modulation recognition of communication signals. IEEE Trans. Commun. 1998, 46, 431–436. [Google Scholar] [CrossRef]
  16. Mirarab, M.; Sobhani, M. Robust modulation classification for PSK/QAM/ASK using higher-order cumulants. In Proceedings of the 2007 6th International Conference on Information, Communications & Signal Processing, Singapore, 10–13 December 2007; pp. 1–4. [Google Scholar]
  17. Wu, H.C.; Saquib, M.; Yun, Z. Novel automatic modulation classification using cumulant features for communications via multipath channels. IEEE Trans. Wirel. Commun. 2008, 7, 3098–3105. [Google Scholar]
  18. Orlic, V.D.; Dukic, M.L. Automatic modulation classification algorithm using higher-order cumulants under real-world channel conditions. IEEE Commun. Lett. 2009, 13, 917–919. [Google Scholar] [CrossRef]
  19. Wong, M.D.; Ting, S.K.; Nandi, A.K. Naive Bayes classification of adaptive broadband wireless modulation schemes with higher order cumulants. In Proceedings of the 2008 2nd International Conference on Signal Processing and Communication Systems, Gold Coast, QLD, Australia, 15–17 December 2008; pp. 1–5. [Google Scholar]
  20. Zhu, Z.; Yi, Z.; Li, S.; Li, L. Deep muti-modal generic representation auxiliary learning networks for end-to-end radar emitter classification. Aerospace 2022, 9, 732. [Google Scholar] [CrossRef]
  21. Hassan, K.; Dayoub, I.; Hamouda, W.; Berbineau, M. Automatic modulation recognition using wavelet transform and neural network. In Proceedings of the 2009 9th International Conference on Intelligent Transport Systems Telecommunications (ITST), Lille, France, 20–22 October 2009; pp. 234–238. [Google Scholar]
  22. Xie, W.; Hu, S.; Yu, C.; Zhu, P.; Peng, X.; Ouyang, J. Deep learning in digital modulation recognition using high order cumulants. IEEE Access 2019, 7, 63760–63766. [Google Scholar] [CrossRef]
  23. Hong, S.; Zhang, Y.; Wang, Y.; Gu, H.; Gui, G.; Sari, H. Deep learning-based signal modulation identification in OFDM systems. IEEE Access 2019, 7, 114631–114638. [Google Scholar] [CrossRef]
  24. Zhang, Z.; Luo, H.; Wang, C.; Gan, C.; Xiang, Y. Automatic modulation classification using CNN-LSTM based dual-stream structure. IEEE Trans. Veh. Technol. 2020, 69, 13521–13531. [Google Scholar] [CrossRef]
  25. O’Shea, T.J.; Corgan, J.; Clancy, T.C. Convolutional radio modulation recognition networks. In Proceedings of the International Conference on Engineering Applications of Neural Networks; Springer: Cham, Switzerland, 2016; pp. 213–226. [Google Scholar]
  26. Zheng, S.; Qi, P.; Chen, S.; Yang, X. Fusion methods for CNN-based automatic modulation classification. IEEE Access 2019, 7, 66496–66504. [Google Scholar] [CrossRef]
  27. Kulin, M.; Kazaz, T.; Moerman, I.; De Poorter, E. End-to-end learning from spectrum data: A deep learning approach for wireless signal identification in spectrum monitoring applications. IEEE Access 2018, 6, 18484–18501. [Google Scholar] [CrossRef]
  28. Wang, Y.; Gui, G.; Ohtsuki, T.; Adachi, F. Multi-task learning for generalized automatic modulation classification under non-Gaussian noise with varying SNR conditions. IEEE Trans. Wirel. Commun. 2021, 20, 3587–3596. [Google Scholar] [CrossRef]
  29. Li, R.; Li, L.; Yang, S.; Li, S. Robust automated VHF modulation recognition based on deep convolutional neural networks. IEEE Commun. Lett. 2018, 22, 946–949. [Google Scholar] [CrossRef]
  30. Wang, Y.; Liu, M.; Yang, J.; Gui, G. Data-driven deep learning for automatic modulation recognition in cognitive radios. IEEE Trans. Veh. Technol. 2019, 68, 4074–4077. [Google Scholar] [CrossRef]
  31. Li, L.; Dong, Z.; Zhu, Z.; Jiang, Q. Deep-learning hopping capture model for automatic modulation classification of wireless communication signals. IEEE Trans. Aerosp. Electron. Syst. 2022. [Google Scholar]
  32. Zhu, Z.; Ji, H.; Zhang, W.; Li, L.; Ji, T. Complex convolutional neural network for signal representation and its application to radar emitter recognition. IEEE Commun. Lett. 2023. [Google Scholar] [CrossRef]
  33. Zeng, Y.; Zhang, M.; Han, F.; Gong, Y.; Zhang, J. Spectrum analysis and convolutional neural network for automatic modulation recognition. IEEE Wirel. Commun. Lett. 2019, 8, 929–932. [Google Scholar] [CrossRef]
  34. Yan, X.; Liu, G.; Wu, H.C.; Feng, G. New automatic modulation classifier using cyclic-spectrum graphs with optimal training features. IEEE Commun. Lett. 2018, 22, 1204–1207. [Google Scholar] [CrossRef]
  35. Cao, S.; Zhang, W. Carrier frequency and symbol rate estimation based on cyclic spectrum. J. Syst. Eng. Electron. 2020, 31, 37–44. [Google Scholar] [CrossRef]
  36. Yang, Z.; Zhang, L. Modulation Classification Based on Signal Constellation and Yolov3. In Proceedings of the 2021 4th International Conference on Information Communication and Signal Processing (ICICSP), Shanghai, China, 24–26 September 2021; pp. 143–146. [Google Scholar]
  37. Ma, J.; Jiang, F. Automatic Modulation Classification Using Fractional Low Order Cyclic Spectrum and Deep Residual Networks in Impulsive Noise. In Proceedings of the 2021 IEEE MTT-S International Wireless Symposium (IWS), Nanjing, China, 23–26 May 2021; pp. 1–3. [Google Scholar]
  38. Mendis, G.J.; Wei-Kocsis, J.; Madanayake, A. Deep learning based radio-signal identification with hardware design. IEEE Trans. Aerosp. Electron. Syst. 2019, 55, 2516–2531. [Google Scholar] [CrossRef]
  39. Peng, S.; Jiang, H.; Wang, H.; Alwageed, H.; Zhou, Y.; Sebdani, M.M.; Yao, Y.D. Modulation classification based on signal constellation diagrams and deep learning. IEEE Trans. Neural Netw. Learn. Syst. 2018, 30, 718–727. [Google Scholar] [CrossRef]
  40. Tian, X.; Chen, C. Modulation pattern recognition based on Resnet50 neural network. In Proceedings of the 2019 IEEE 2nd International Conference on Information Communication and Signal Processing (ICICSP), Weihai, China, 28–30 September 2019; pp. 34–38. [Google Scholar]
  41. Li, L.; Li, M.; Zhu, Z.; Li, S.; Dai, C. An Efficient Digital Modulation Classification Method Using the Enhanced Constellation Diagram. Available online: https://www.researchgate.net/publication/365374312_An_Efficient_Digital_Modulation_Classification_Method_Using_the_Enhanced_Constellation_Diagram (accessed on 17 November 2022).
Figure 1. Signal modulation recognition method based on multi-feature fusion.
Electronics 12 00552 g001
Figure 2. The influence of different signal amounts on classification accuracy.
Electronics 12 00552 g002
Figure 3. The influence of different learning rates on classification accuracy.
Electronics 12 00552 g003
Figure 4. The influence of different features on classification accuracy without frequency offset.
Electronics 12 00552 g004
Figure 5. The influence of different features on classification accuracy when the maximum random frequency offset is 50 kHz.
Electronics 12 00552 g005
Figure 6. Classification accuracy of different methods when the maximum random frequency offset is 50 kHz.
Electronics 12 00552 g006
Figure 7. Classification accuracy of different algorithms under multiple frequency offsets.
Electronics 12 00552 g007
Table 1. The constellation diagram branch network structure of C 1 and C 2 .
TypesSize/StepOutput Size
1D Convolution3 × 64/164 × 1
Average Pooling2 × 1/232 × 1
1D Convolution3 × 1/132 × 1
Average Pooling2 × 1/216 × 1
Table 2. The constellation diagram branch network structure of C 3 .
TypesSize/StepOutput Size
2D Convolution3 × 3/232 × 32
Max Pooling2 × 2/216 × 16
2D Convolution3 × 3/28 × 8
Max Pooling2 × 2/24 × 4
Table 3. The constellation diagram branch network structure of IQ signal.
TypesSize/StepOutput Size
1D Convolution3 × 3/11024 × 1
Average Pooling2 × 1/2512 × 1
1D Convolution3 × 1/1512 × 1
Average Pooling2 × 1/2256 × 4
1D Convolution3 × 1/1256 × 1
Average Pooling2 × 1/2128 × 1
1D Convolution3 × 1/1128 × 1
Average Pooling2 × 1/264 × 1
1D Convolution3 × 1/164 × 1
Average Pooling2 × 1/232 × 1
1D Convolution3 × 1/132 × 1
Average Pooling2 × 1/216 × 1
Table 4. Experimental parameter settings.
ParametersValue
SNR Range−10 dB~10 dB
Sampling Frequency5 GHz
Signal Length1024 × 2
Learning Rate0.001
Fo/Fc0.074
Table 5. Classification accuracy with maximum random frequency offset of 50 kHz.
Networks0dB−5 dB−10 dB
SCFNet98.2%94.6%89.5%
GoogleNet95.7%90.0%82.0%
VGGNet93.6%92.1%89.6%
GCP–DBN89.0%73.0%60.9%
Disclaimer/Publisher’s Note: The statements, opinions and data contained in all publications are solely those of the individual author(s) and contributor(s) and not of MDPI and/or the editor(s). MDPI and/or the editor(s) disclaim responsibility for any injury to people or property resulting from any ideas, methods, instructions or products referred to in the content.

