Abstract
Accurate video launching and propagation is significant for promotion and distribution of videos. In this paper, we propose a novel video propagation strategy that fuses user interests and social influences based on the assistance of key nodes in social networks (VPII). VPII constructs an estimation model for video distribution capacities in the process of video propagation by investigating interest preference and influence of social users: (1) An estimation method of user preferences for video content is designed by integrating a comparative analysis between current popular videos and historical popular videos. (2) An estimation method to determine the distribution capacities of videos is designed according to scale and importance of neighbor nodes covered. VPII further designs a multi-round video propagation strategy with the assistance of the selected key nodes, which enables these nodes to implement accurate video launching by estimating weighted levels based on available bandwidth and node degree centrality. The video propagation can effectively promote the scale and speed of video sharing and efficiently utilize network resources. Simulations-based testing shows how VPII outperforms other state-of-the-art solutions in terms of startup delay, caching hit ratio, caching cost and higher control overhead.
1. Introduction
The fast development of communication and network technologies provides ubiquitous access and sharing of services and resources on the Internet [1,2,3]. Video services, such as video-on-demand and live video, are very important applications and consume more than three-quarters of network traffic [4,5,6,7]. Although a large amount of valuable videos is generated and launched, they are not well-known on the Internet due to limited propagation and hypodynamic sharing. Video propagation on the Internet mainly relies on the scale of video demand and supply and accessibility to propagation channels [8,9,10]. Social networks provide an efficient channel to construct links between users and videos: video users not only use social links with each other to distribute information and videos, but also depend on their social influence to motivate other users to accept the pushed videos. Because social networks have characteristics of high clustering and small world, the short social distance between users in terms of the six degrees of separation stimulates fast video dissemination. Figure 1 shows social-based video sharing via a cascade spread mode used to express the nodes with different social influence levels. Mobile nodes use social links to push video to their social neighbors and supply video data for their social neighbors who want to fetch videos. However, the large-scale video sharing in social-based video propagation also consumes a large amount of network resources and causes unbalanced supply and demand [11,12,13,14,15,16], which limits scale and time of video propagation. Efficient video propagation needs to be based on controllable video launching, considering dynamic sharing conditions, such as available bandwidth and variational demand.
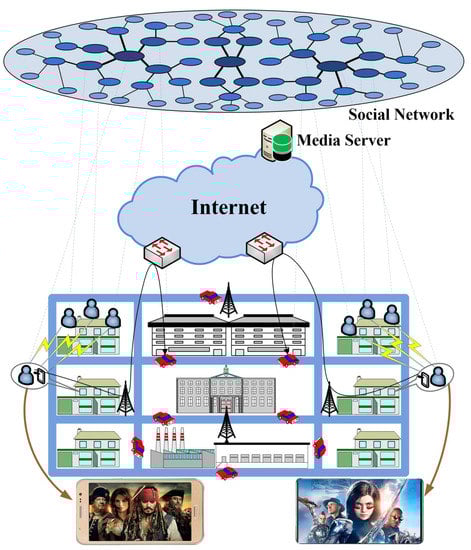
Figure 1.
Social-based video sharing in wireless mobile networks.
Being aware of user preferences and interests is very important for controllable video launching. User preferences concerning video content determine demand and determine what video genres are requested [17]. Strong correlation with user interests determines successful acceptance of video data [18], while weak correlation means that the videos will be unsuccessfully distributed. The social-influence-based communication between users can enhance interest level and extend interest range. Recently, numerous researchers have focused on social-based video propagation [19]. Video propagation that fuses interests and influences is an effective method of implementation with accurate launching and extensive propagation. For instance, a framework that can accurately identify and estimate the propagation process and influence of popular videos has been proposed in [20]. A video propagation method in a cloud content delivery network, which relies on the social-community-based strategies of video replication and request dispatching to obtain low monetary cost and low service latency was proposed in [21]. However, existing propagation methods do not consider user interests and social influences in the process of video dissemination; therefore, it is difficult to achieve accurately positioned video launches with low message overhead and low startup delay.
In this paper, we propose a novel video propagation strategy fusing user interests and social influences based on leveraging key nodes in social networks (VPII).VPII estimates key levels of nodes from the aspects of both interests and influence and uses selected key nodes in batches to push videos and supply video data for other request nodes, which effectively promotes scale and efficiency of video propagation through economic utilization of network resources. This approach ensures quality of experience (QoE) of users and quality of service (QoS) of video propagation. Simulation results show how VPII achieves much better performance results in comparison with other state-of-the-art solutions. The main contribution of our work is described as follows.
(1) VPII constructs an estimation model of key nodes by investigating interest preferences and social influence. VPII estimates the probabilities that nodes will fetch a specific video by considering current popular videos and historically popular videos and calculates social influence subjected by nodes from their social neighbors for requesting or accepting videos. VPII also estimates video circulation capacities of nodes according to the number and social importance levels of neighbor nodes covered (“infected”) by nodes.
(2) VPII further investigates the two weight factors: available bandwidth and node degree centrality to calculate the weighted key levels of nodes. VPII designs a multi-round video propagation strategy that uses selected nodes to implement accurate video launches in terms of dynamic video supply and demand at every propagation round, effectively reaching market equilibrium of video resources and providing cost-efficient use of bandwidth and storage resources of networks.
The rest of the paper is organized as follows. Section 2 describes the related work of video propagation. Section 3 presents measurement of key levels of nodes and a video propagation algorithm based on key nodes in VPII detailed design. Section 4 evaluates the performance of video propagation of VPII through a comparative simulation. Finally, Section 5 includes our conclusions.
2. Related Work
Some researchers focus on information propagation. For instance, a propagation model based on social sensor networks was proposed, which uses scenarios of social relationship types and restriction of negative influence to minimize propagation cost [22]. A nonlinear dynamic method of information diffusion for public emergencies based on the propagation dynamics was proposed, which constructs an information propagation model in terms of information communication characteristics of public emergencies and designs a dynamic diffusion network [23]. A bandwidth-intensive social content propagation method was proposed, which designs a mobility-aware content replication strategy for edge-network regions and a replication scheduling algorithm using historical, local and partial information to achieve efficient D2D propagation [24]. Traverso et al. proposed an information propagation strategy by investigating timing regularities and time differences of users, fusing social relationships and geographic location [25]. A socially aware scheduling algorithm was designed, which achieves a trade-off between cost and benefits under bandwidth budget constraints. An information diffusion of topic propagation in social media was proposed in order to accurately predict specific states of users with real-time variation of resources observed by users [26]. The dynamic process of information diffusion among users was denoted as an interconnected network which is addressed by the super-Laplacian matrix. An update model of auxiliary and external input was constructed as a multidimensional Brownian process, which shows the variations of user states in intrinsic interactions and external inputs. A Kalman predictor problem of user state prediction was formulated and was addressed by the a priori knowledge of the user state, which further promotes accuracy of prediction results of the user state. The above methods of information propagation employ the static user–passive mechanisms, which with difficulty can be adapted to video services with an active and passive mode of users.
The convergence of social networks and video services facilitate the range and scale of video data propagation from video sources to social users. Some researchers focus on social video sharing methods to address the challenges of social video sharing caused by boundless coverage and increased video content [27]. Wang et al. designed a mechanism for socially aware video delivery according to the revealed characteristics of social video propagation. Roy et al. discussed distribution of video traffic for mobile network operators and proposed a receiver-oriented location-aware scheduling scheme of video traffic in cellular networks [28]. Roy et al. proposed a social-stream-aware estimation method for sudden popularity bursts in online videos based on transfer learning [29]. A transfer learning algorithm which learns topics from social streams was designed by modelling the social prominence of videos, which promotes accuracy of predicted video spread trends. Wang et al. proposed a live video push strategy by adjusting traffic load between edge servers to promote propagation efficiency and range of live video data [30]. Each edge server cluster is related to multiple user groups, and the bandwidth resources of edge server clusters are stably allocated for corresponding user groups in terms of the relation between them, which enables the load of edge servers to be evenly kept. A proactive propagation algorithm of live video data replication was designed, which implements reliable data caching of live videos in the edge servers to ensure delivery quality of live video data. Niu et al. constructed a multi-source-driven asynchronous diffusion model for video sharing in social networks [31]. The latency that a social user activates with a single video source is estimated in terms of the latency of information propagation along social links, which follows the exponential mixture model. The influence-based propagation process of videos is described, which shows the exponentially decreasing user activation probability related to the increasing time. The activation probabilities of all users are determined by neighbors of their active neighbors. Sang et al. proposed a context-dependent propagation method of videos in heterogeneous information networks in order to address the problem of accurate video distribution in a complex information context [32]. The videos consist of the multimodal content features and global dependency structure in heterogeneous information networks. By investigation and propagation for global context cues of videos, the videos can be accurately recommended according to identification results of the learned embedding based on video context. However, the above methods do not synthetically employ user interests and social influence to promote scale and efficiency of video propagation with accurate launches.
Some researchers also focus on social video propagation with the assistance of key nodes in social networks. Cai et al. proposed a cloud gaming system with cooperative video sharing, which enables the group-based players to decode the corresponding videos with the assistance of each other via multiple network interfaces after the cloud servers encode and transmit multiple video streams [33]. Jiao et al. proposed a cluster-based video distribution method with the help of the selected relay nodes in clusters [34]. The nodes are grouped into multiple clusters, and the cluster head nodes of each cluster are selected as relay nodes according to multiple factors such as social influence. A video distribution method was designed, which achieves the mobility-aware cooperative video sharing based on collaboration between edge nodes. Hu et al. constructed a model of an indirect reciprocity game for the interaction between users. By using the Markov decision process, the users can make distributed decisions to maximize cooperation levels [35]. Shiroma et al. proposed a cooperative cache method by constructing a relationship between users and videos [36]. The users can decisde to cache content according to the match of their group ID and content group ID, which reduces the load of the base station by the distributed content caching. The extensive video caching and usage of D2D technology accelerate cooperative fetching of videos. Wu et al. proposed a D2D-based cooperative sharing method of videos by cooperative video caching and sharing [37]. By investigation of generality for historical watched records, sharing willingness, location distribution and QoE requirements of users, the appropriate video providers are allocated for video requesters according to the user generality of watched records, sharing willingness, location distribution and QoE requirements. However, the above methods also do not synthetically estimate propagation capacities of selected key nodes according to user interests and social influence, so that accurate video launching is effectively implemented.
Moreover, some researchers also focus on evaluation metrics of video quality and the video delivery based on deep learning. Tian et al. proposed a quality evaluation framework based on motion activity information where definition and smoothness of videos are measurement metrics of video quality [38]. Eswara et al. proposed a QoE evaluation framework which includes a learning-based playback model and an exponential rebuffering model where objective evaluation of popular video quality assessment and subjective evaluation of continuous time QoE are selected as the evaluation metrics [39]. Feng et al. analyzed the influence of the network packet on the video transmission quality, such as packet loss and jitter, and constructed a BP neural network evaluation model using video bit rate as a parameter [40]. Yao et al. proposed a bitrate-based no-reference (NR) VQA metric combining the visual perception of video contents [41]. The parameters, including bitrate, texture complexity and local contrast of image, temporal information of video and visual perception features, are selected as the evaluation metrics in a video quality assessment model.
Hu et al. proposed a centralized deep reinforcement learning association method based on a rainbow agent with a convolutional neural network (CNN) to generate decisions from observation [42]. The designed multi-agent deep DRL algorithm is used for resource scheduling and association of sub-problems using the networked-distributed partially observable Markov decision process (ND-POMDP). Tang et al. proposed a novel two-level decision framework with consideration of either a short-term multi-user QoE maximization or a long-term single-user point-to-point QoE maximization, which includes an optimization-based beamforming scheme and a deep reinforcement learning (DRL)-based rate adaptation scheme [43]. Choi et al. proposed an Internet-of-Vehicles network where the video streaming service is based on distributed caching that employs D2D links [44]. By maximizing the average video quality based on the constraints of playback delays and a data rate guaranteed for cellular vehicles, the video delivery decisions can be jointly optimized. The deep reinforcement learning without the knowledge of global channel state information is used to solve the problem of the stochastic shortest path problem. Kwon et al. proposed a deep deterministic policy using gradient-based power control of an mmWave base station (mBS) and proactive cache allocation toward mBSs in distributed mmWave Internet-of-Vehicles (IoV) networks [45]. Shi et al. proposed a cooperative-learning-based scheme for the smart Edge servers with caching and prefetching to improve the QoE of adaptive video streaming [46]. The edge servers store the most beneficial content, which reduces redundant video transmissions and network transmission delay using prefetched content. A novel QoE-oriented deep neural network model was designed and used to formulate the most advantageous decisions of caching and prefetching.
3. VPII Detailed Design
3.1. VPII Architecture
Figure 2 illustrates the design of VPII architecture which includes the two components measurement of key levels of nodesand video propagation strategy. The social networks use social channels between users to distribute videos, which effectively promote scale and speed of video sharing. The key nodes, which have a strong desire of video fetching, great social influence and enough upload bandwidth in social networks, can speed up the video spread process and greatly increase the scale of video copies.
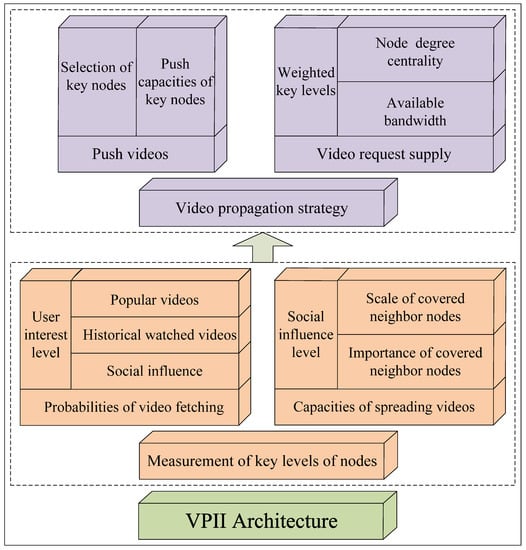
Figure 2.
Relationship between components and elements of VPII.
(1) Measurement of key levels of nodes: The potential key nodes should have a strong desire for video fetching with high interest levels for the propagated videos, which ensure the potential key nodes are willing to store video copies and spread videos via “pull” and “push” ways. By calculation of similarities between currently popular videos and historical watched videos, the content-based interest levels of users can be estimated. By measuring social influence levels incurred by social neighbors of users for desire levels of video fetching, the social-based influence levels of users can be estimated. The interest estimation fusing video content and social influence can ensure highly accurate probabilities of video fetching. On the other hand, by investigating scale levels and social importance of neighbor nodes infected by the potential key nodes, the spread capacities of potential key nodes in the future can be accurately estimated. The nodes which have a strong desire for video fetching and great social influence should be selected as the key nodes.
(2) Video propagation strategy: The social networks make use of “pull” and “push” ways to spread videos. The selected key nodes use their social influence to push videos with high successful probabilities and supply their upload bandwidth to meet the demand of active requests. In order to control spread, the batch-wise activation of key nodes are implemented in terms of available bandwidth and key levels of key nodes, so that the key nodes that have extensive social connections, strong social influence and enough upload bandwidth should be preferentially covered (activated). The video cascade propagation from key nodes to their neighbor nodes uses the high propagation success rate to balance the supply and demand of upload bandwidth at the initial propagation of videos and ensure the data delivery performance with low wait delay and low packet loss rate.
3.2. Measurement of Key Level
A social network can be defined as where V is the set of nodes G; E is the set of edges between nodes in G. G is a logical network where the construction of edges relies on results of real communications between nodes. G has the huge scale of nodes, but the distance between nodes in G is not far in terms of six degrees of separation based on the small world of social networks [47]. In other words, the small world of social networks can effectively support fast speed, high success ratio and a large scale of video propagation. Propagation of a video can seemingly have extensive coverage in G with the help of short social distance between nodes. However, a small number of videos has relatively extensive popularity in networks. Obviously, the social distance is not a decisive factor for the popularity of video propagation. Social networks have the characteristics of small world; some nodes have abundant social links and strong social influence and undertake the link tasks of social relationship. These nodes which use social links and influence to promote propagation of resources are considered the key nodes. Specifically, the key nodes use social links to supply video data for other nodes or push video data to their neighbor nodes and further rely on the social influence to enable the neighbor nodes to accept the pushed video data. If the key nodes are selected before propagation of videos, the video systems use the key nodes to promote the propagation scale of videos.
We assume that the visibility of video information for each node is one at the initial moment of video propagation; in other words, all nodes in G can obtain video information by message broadcasting of the video source nodes. “Pull” and “push” are the two ways of video propagation. When a node wants to obtain video resources, sends the request message to a or multiple nodes (“pull”) or waits for the pushed video data from other nodes (“push”). If has obtained video data and successfully supplies or pushes video data for many nodes, can be considered as the key nodes. The coverage levels of for propagation of and the interest-related probability that obtained data of video are the important factors for estimation of key levels of . Let be the interest-related probability that obtained data of video . The value of is calculated by the probability that accepts and the influence factor that is influenced by the number of ’s one-hop neighbor nodes which fetch data from . can be defined as:
The videos are classified as different categories in terms of theme and content of videos, such as comedy and science fiction. Most users have similar interest distributions: intense interest for a few video categories and bland for numerous video categories. The stronger the interest of users is, the higher the probability that the users accept videos is. For instance, a user has high interest for the basketball game. The basketball game of the NBA is accepted regardless of the Lakers or the Warriors. Let be a set of video categories where each video has a unique category; is the number of items in ; is the similarity value of content between and . The information (e.g., title, introduction, directors, actors, etc.) of and is constructed as the two vectors, respectively; The included angle cosine of two vectors can be used as the value of .
is the average value of content-based similarity values between and all items in and is considered as the predicted probability; can be defined as:
where k is a positive integer and is the number of videos which belong to and are propagated at the same period time; denotes that multiple videos which belong to the same video category and contemporaneously are propagated in networks; denotes that a unique video which belongs to is propagated in networks. When the videos of multiple categories are propagated in networks, there is a game among different video categories. The videos rely on the adaptation level between the belonged categories and the interest preference of users to be accepted by users. When the multiple videos which belong to the same category are propagated in networks, there is also a game between them. In fact, can be considered as a game factor, which means that the users accept the videos with the same category using the same probability.
denotes the important level of a video category relative to other categories and is also considered as the probability that accepts videos in ; can be defined as:
where is the number of items in which is accepted by ; returns the number of all video categories. is the total number of all videos in all video categories which is accepted by ; is a regulatory factor; means that the probability that accepts is suited to the content-based correlation levels between and items in ; means that the probability that accepts is suited to the historical behaviors of video playback of . means that there is a balance content-based correlation levels and historical behaviors.
In social networks, if the two nodes build a direct communication relationship and the message interaction between them does not depend on forwarding of other nodes, they have one-hop neighbor relationship, and the social distance between them in social network is one. Let be the set of one-hop neighbor nodes of in G. The two nodes and in G directly implement communication (e.g., “pull” and “push” of video data), so the edge between them is built, and they have the neighbor relationship in G. The social relationship level between and is closer than the nodes which do not have the edge with them; uses the edges to interact with the neighbor nodes, so that there are different levels of social relationship between and the neighbor nodes. If and neighbor nodes in have high-frequency video sharing behaviors of interaction, they have a close social relationship. For instance, if and a neighbor node in always meet the request of video data with each other, there is a close social relationship between and . If and always accept the pushed video data with each other, and also have a close social relationship. Further, the behaviors of fetching videos of ’s neighbor nodes generate different influence for in terms of the close levels of social relationship. When has data of and obtains the information that the close neighbor nodes accept , the probability that makes the same decision (acceptance or rejection of ) with the close neighbor nodes may be high. On the other hand, the influence of nodes which have a low-coupling social relationship for is low. Therefore, can be defined as:
is a set of ’s neighbor nodes which accept ; returns the number of nodes in ; is the number of videos which is accepted by in terms of the influence of neighbor nodes. is the historical ratio of influence-based video fetching of and also is considered as the experiential probability of fetching of . is also a regulatory factor like . w is the weight of edge between and a neighbor node in ; is the cumulative sum of edge weight between and nodes in which accept ; is the total sum of edge weight between , and all nodes in . of and ’s one-hop neighbor node can be defined as:
where is the interaction frequency between and ; is the total frequency of interaction between and all nodes in ; is the successful number of interaction between and ; is the total successful number of interaction between and all nodes in . is the interaction level of relative to among all nodes in ; is the propagation level of video data of relative to all nodes in . The investigation of interaction and propagation levels for the nodes in is the two important factors of edge weight w; interaction and propagation have the close relation: (1) The interaction between nodes is the precondition of propagation. (2) The propagation reflects the effectiveness of interaction between nodes. The high-frequency interaction can promote the probability of successful propagation; the high probability of successful propagation further enhances the driving force of interaction. The larger the value of w is, the higher the probability of successful video propagation is. is a time-related statistical value, which is different from . For instance, and are the starting and statistical time, respectively. The value of is calculated according to the number of during the period time from to . Therefore, the value of is related with time and relies on the value of during the time period. According to the Equations (1) and (2), can be defined as:
where is also a regulatory factor like . On the other hand, the value of dynamically changes according to the increase in the number of nodes which are covered by . The nodes make use of the edges to implement “pull” and “push” of data for propagation in social networks. In the process of “pull”, wants to obtain data of and sends to the request message to neighbor nodes. If a neighbor node has data of , delivers data of to and achieves covering . If the neighbor nodes do not have data of , they forwards the request messages to their neighbor nodes. The request messages are forwarded along the edges and are responded to by the nodes carrying data of . In the process of “push”, accepts push of data of a neighbor node , which denotes that is covered by via “push”. If enables most of the nodes in G to be covered via “pull” and “push”, plays an important role for the video propagation and can be considered as the key node. If enables a large number of neighbor nodes to be covered during a period of time, can be considered as the candidate key node. Because the key nodes are selected before the starting time of the propagation period of , the number of neighbor nodes covered by during the propagation period should be a predicted value. In other words, the prediction of coverage levels of nodes in G is an estimation for the selection of key nodes before propagation of .
In the case where is a neighbor node of and the value of of can be calculated by the similarity between and the accepted videos in according to the historical playback records of , which is the content-based probability of fetching , is the probability that is covered by for propagation of via “pull” and “push” between and . Here, “pull” means that responds to the request for ’s data of , and “push” means that receives ’s data pushed by . is the predicted value in terms of the statistical information that is covered by and is defined as:
where is the number that is successfully covered by for all videos in , and is the number of “pull” from to and “push” from to for all videos in . Not all interactions of “pull” and “push” between and are successfully implemented. For instance, when receives a request message for video data from and does not store the requested video resource, does not supply video data for and only forwards the request message to other neighbor nodes. When receives a pushed message of video data from and is uninterested in the pushed video, rejects the pushed video. Therefore, the probability that is covered by for propagation of can be defined as:
If a threshold value is used to estimate whether is covered by for propagation of , denotes that is interested in and is covered by via “pull” or “push”. denotes that is not covered by via “pull” or “push” ’s neighbor nodes which may be covered by for propagation of form a set by comparison between and . The nodes in are the predicted results. The propagation process of can be divided into multiple period time rounds. The time length of each propagation round can be defined as playback time of . is the set of nodes which is covered by at round of , and returns the number of nodes in at round of . The value of at round of can be calculated according to the following equation.
where returns the number of nodes in ; is the set of nodes which have stored data of in ; returns the intersection set of , and ; is the difference set between the predicted set and the set of nodes which have been covered in . is the set of nodes which have been covered in G, and denotes the set of nodes which have not been covered in G; is a ratio of the cumulative sum of weight values of predicted nodes covered by relative to the set of nodes which have not been covered in G. Because is a predicted result, the value of can be calculated before the starting time of the propagation round. can be calculated according to the predicted coverage levels of neighbor nodes of at the propagation round. However, the difference between the predicted and real results of can be used to optimize the estimation of coverage levels of other nodes at the propagation round, which brings the negative influence for the selection accuracy of key selection at the next propagation round. can be re-defined as:
where is an influence factor which is used to regulate the weight values of nodes which are not covered; increases linearly with the increase in the number x of the propagation round; is the frequency that receives the push of data from ’s neighbor nodes (we assume that ’s neighbor nodes push data of only once); returns the number of ’s neighbor nodes and . For instance, a node is the one-hop neighbor node of multiple nodes in G. If is not covered by ’s neighbor nodes in G after x propagation round of and receives many push requests for data, the probability that is covered by ’s neighbor nodes via “pull” or “push” may increase at the next propagation round of in terms of the linear threshold theory. Moreover, is also a prior factor: entropy between predicted and real results of covered neighbor nodes of for historical propagation of videos. For instance, before propagation of , is the key node of multiple videos; enables ’s neighbor nodes to store the propagated videos according to the predicted neighbor nodes with high coverage probability. Let be the set of nodes which belong to the predicted set and are not covered by in the process of propagation of . Let be the set of nodes which do not belong to the predicted set and are covered by in the process of propagation of . The value of can be defined as:
where and return the number of nodes in and , respectively, and denotes the ratio between the number of covered items in all neighbor nodes and number of all neighbor nodes. Further, the value of can be defined as:
where returns the number of videos in a video set , becomes the key nodes in the propagation process of videos in , and is the mean value of the coverage success rate of for the propagation of videos in . is the probability that accepts and can be calculated in real time according to the historical playback records of . Because the number of videos watched by increases stably, the value of is also stable during the propagation process of . The value of can also be calculated in real time or period time by the current ratio of the number between neighbor nodes which have played and all neighbor nodes and historical influence-based playback records. can be calculated according to the current coverage levels of neighbor nodes of at the propagation round. Therefore, when starts to be propagated in G, the value of can be calculated and be periodically updated according to the variation of values of and during the period time of the propagation round. According to values of and , the key levels of for propagation of video at the round can be defined as:
At the initial propagation round, , but the values of and may be not equal to 0, so the value of can be calculated or updated before the starting time of each propagation round of .
3.3. Video Propagation Based on Key Nodes
The video propagation in social networks shows a cascade process, so scale and capacity of key nodes determine scale and efficiency of video propagation. Except for the key nodes, video propagation is implemented according to the supply of video data for request nodes. They also use their social influence to achieve successful push of data with high probability. However, all key nodes are not activated at once due to the limited upload bandwidth of source nodes carrying video data. The key nodes are wholesale activated according to the priority based on key levels. The key nodes make use of extensive social connections and strong social influence to promote the coverage range of video propagation so that they should be preferentially covered. However, the promotion of range and efficiency of video coverage also causes a fast increase in the demand for network bandwidth required by video delivery. If the key nodes have enough bandwidth and numerous neighbor nodes, they can successfully handle the converged request of video data. The successful delivery of video data not only increases the coverage range of video propagation, but also the new covered nodes become the new suppliers of upload bandwidth. The video cascade propagation from key nodes to their neighbor nodes uses the high propagation success rate to balance supply and demand of upload bandwidth at the initial propagation of videos and ensure the data delivery performance with low wait delay and low packet loss rate. On the other hand, if the key nodes do not have adequate upload bandwidth to respond to the video data request of nodes, the number of video copies is not quickly increased, and the startup delay of request nodes is lengthened; If the key nodes have low node degree centrality, the limited channels of video propagation restrict the scale of video copies and do not utilize upload bandwidth resources of key nodes. Therefore, the available bandwidth and node degree centrality should be considered in the process of selection of key nodes except for interest preference and coverage capacities of key nodes.
When multiple videos propagate in G, the nodes in G may be selected as the key nodes of multiple videos. The bandwidth resources of key nodes compete for the propagation of multiple videos. The bandwidth resources of key nodes should be dynamically allocated in terms of predicted popularity levels of videos. For instance, the videos that are in the primary stage of propagation need more upload bandwidth resources than those in the end stage of propagation; The videos that have a large number of potential covered nodes also need more upload bandwidth resources than those with a small number of potential covered nodes. The allocated upload bandwidth of key nodes at the round of propagation can be defined as:
where is the available bandwidth of ; k is the number of propagated videos at round, returns the number of in at round, is the number of ’s neighbor nodes which may be covered by for propagation of at round, and is the allocated ratio of upload bandwidth of for propagation of at the round. The larger the values of of nodes are, the stronger the key levels (propagation capacities) of nodes will be. Because the key level values of nodes are in the range , the nodes with the values of key levels in are considered as the nodes which do not have the propagation capacities. For instance, before the starting time of the propagation round of , the key levels of all nodes for propagation of are estimated and form a set . All nodes are also considered as candidate key nodes and form a set . The nodes that have stored data of form a set . The following steps show the process of propagation of based on the selection of key nodes at the round and is described in Algorithm 1 “Propagation of based on key nodes”:
(1) and the items in are greater than 0. The nodes corresponding to the items in form a candidate set of key nodes at the propagation round of . Upload bandwidth and node degree centrality should be considered the weight values of key levels and be added into the estimation of key levels of nodes before the selection of key nodes. The available upload bandwidth determines the number of nodes that accept services of video data delivery of . The more sufficient the available upload bandwidth of is, the stronger the capacity of propagation of will be. The capacity of propagation of based on the available upload bandwidth at the round for can be defined as:
where is the number of request nodes which are served by via data delivery of and is defined as:
where is the average packet loss rate of in the process of data delivery of all videos, and is the transmission rate of data required by playback of . The values of of all candidate key nodes are calculated and form a set ; and are the maximum and minimum values in , respectively; . The node degree centrality of can be defined as:
where returns the number of neighbor nodes of , is the normalization value of node degree centrality of , which reduces the negative influence caused by variation of number of nodes in G, and . The weighted key levels of nodes in can be calculated according to the following equation.
The values of of nodes in are in the range [0, 1]. The items in are descendingly sorted in terms of the weighted key levels.
(2) Distribution and scale of data requests in G are different during the different propagation rounds of . Variation of distribution and scale of data requests result in a change in the balance between supply and demand of upload bandwidth. If the scale of requests is far larger than the current supply capacities of upload bandwidth in G, the more key nodes should be selected to meet the demand of blowout upload bandwidth. If the scale of requests is less than the current supply capacities of upload bandwidth in G, the selection of key nodes should be suspended in order to save the resources of upload bandwidth in networks. Therefore, the demand value of upload bandwidth should be predicted before the selection of key nodes. The predicted demand value of upload bandwidth at the round of propagation can be defined as:
where is the predicted number of increased covered nodes every unit time at the round, which includes two types of node fetching data of via active request and push acceptance; is the length of playback time of and is also the time length of the round; is the number of covered nodes at the round; is the predicted value of upload bandwidth at the round of propagation. The value of is calculated according to the grey forecasting model (GFM). The time length of the round is equally divided into multiple time slots . The value of at each time slot can be defined as , where is the number of covered nodes during and is the time length of . The covering rate of nodes corresponding to each time slot can be calculated and form a time-ordered sequence set where . The covering rate of nodes corresponding to each time slot at the round can be calculated according to the GFM, and the value of can be obtained according to the cumulative sum of the predicted covering rate of nodes at the round. The covering rate of nodes at the initial round cannot be obtained, so the mean value of the real covering rate of all videos in at the initial round can be considered as the predicted value of of at the initial round. When a neighbor node of is the member in of and is covered at the round, it should be removed from of at the round. Let be the cumulative sum of available upload bandwidth in at the round. If , the scarce supply of upload bandwidth requires that the key nodes be selected, preferentially covered and step (3) implemented. If , the redundant supply of upload bandwidth means that there is no need to add new key nodes and implement step (5).
(3) is a number of the selected key nodes at the round of propagation of ; returns the number of items in and is the upper bound of ; is the lower bound of where is the means value of upload bandwidth of nodes in . If , the nodes in are selected as the key nodes and are preferentially covered. If where , all nodes in are selected as the key nodes. The period time length of the current round is defined as , which means that propagation of should enter a new round in order to select new key nodes after the available upload bandwidth of all nodes in is consumed. The decrease in period time of the propagation round promotes the real-time levels of updating supply and demand of upload bandwidth, which speeds up the iteration of the propagation round and relieves the supply shortage of upload bandwidth by increasing the new key nodes.
(4) The key nodes are selected from . They immediately fetch data from by sending request messages and accepting the push of data. The nodes in of key nodes have a high probability of fetching data of , so the key nodes should preferentially push data of to nodes in their in terms of the descending values of . Moreover, the key nodes also need to handle the request messages of data from their nodes. For instance, when a neighbor node of uses the edges with social neighbor nodes to send a request message for data, responds and delivers data from to . Moreover, when the neighbor node of receives a request from a neighbor node of and does not deliver data of for the request nodes, also forwards the request message to , and directly returns the response message to the request nodes.
(5) When the current round finishes, the values of parameters in all equations are updated according to the distribution of copies in G. The covered nodes at the round are also removed from . All nodes in G remove the nodes which have been covered from their . After the values of of nodes in are re-estimated, the nodes in with are added into . If is the empty set, the propagation process of based on the selection of key nodes returns step (6); Otherwise, the process returns step (1).
(6) The process of key nodes for propagation of is ended.
| Algorithm 1 Propagation of based key nodes |
| 1: x is round number of propagation of ; |
| 2: is length of round; |
| 3: and are constructed; |
| 4: calculates of nodes in ; |
| 5: while |
| 6: |
| 7: for (h = 0; h < ; h++) |
| 8: ; |
| 9: end for |
| 10: calculates value of ; |
| 11: calculates value of ; |
| 12: if |
| 13: and ; |
| 14: for () |
| 15: if |
| 16: ; |
| 17: is selected as key node; |
| 18: ; |
| 19: else break; |
| 20: end if |
| 21: end for |
| 22: ; |
| 23: is starting time of round; |
| 24: is current time; |
| 25: while |
| 26: key nodes implement push and supply data request; |
| 27: end while |
| 28: end if |
| 29: removes new covered nodes from ; |
| 30: recalculates value of in ; |
| 31: reconstructs ; |
| 32: recalculates of nodes in ; |
| 33: ; |
| 34: end while |
4. Experiments and Results
4.1. Testing Topology and Scenarios
We compare the performance of the proposed VPII solution with that of the two state-of-the-art solutions: OCP [48] and SECS [49] which are deployed in a mobile network environment by using the Network Simulator 3 (NS-3). The simulation area is set as a square scenario with 3000 × 3000 m. There are 500 mobile nodes which maintain random movement behaviors during 500 s simulation time. Before the beginning of the simulation, the mobile nodes have the initial position coordinates. They are allocated a constant velocity and target position and move with the allocated velocity along the path consisting of initial and target position coordinates. When the mobile nodes arrive at the appointed target position coordinates, they immediately are allocated the new target position coordinates and the new movement speed and move to the new target position coordinates with the new movement speed, which means that the stay time of mobile nodes is set to 0 s. The speed range of mobile nodes is set to [1, 30] m/s. The number of videos that are requested by the mobile nodes is 40, and the popularity of all videos follows the Zipf distribution [50]. The initial probabilities that the mobile nodes request videos during the whole simulation time is calculated according to the following equation [51]:
where r is the popularity ranking, is the popularity ranking of the n-th video, denotes the Zipf exponent that describes the skewness for the video request behaviors of users. The larger the value of is, the more concentrated the video requests will be. is the Zipf exponent of the n-th video; i is the popularity ranking of videos; M is the total number of videos, and M = 40 according to the settings of the simulation. When the mobile nodes request a video, the playback times are randomly allocated for the request nodes. After the mobile nodes finish the playback according to the allocated playback time, they continue to request a new video with the request probabilities. The length and size of every video are set to 100 s and 25 MB, respectively. The playback bitrate of all videos is 2000 kbps. The number of videos cached in the local buffer of mobile nodes is in the range [5, 20] and is allocated for every mobile node. The propagated videos rely on the source nodes which store initial video data to distribute videos. The number of videos cached by all source nodes is set to 20, and every video has 10 source nodes, which means that 20 source nodes provide initial video data. Initially, the mobile nodes request videos follows the Poisson distribution. Every node has a historical trace of video sharing with other nodes to support estimation of interest preference and measurement of social influence and relationship. If the time span T from the time that the mobile nodes send the request messages to the potential video supply nodes to the time that the supply nodes return the first video data is larger than the threshold value , the request nodes re-send the new request messages. The value of is defined as:
where ; is the time span used to collect the values of T of request nodes, and = 100 s. The simulation scenarios have 36 base stations which are uniformly distributed and are used as the access points (APs) to transmit and forward video data. The 5G industrial standardization is used to reset the physical and MAC layer and modulation schemes of network units. The MAC protocol uses the 802.11p, and the upper bound of data rate is set to 27 Mbps. The maximum communication range is 250 m, and the MAC channel delay is 250 ms. The propagation loss model employs the Friis propagation loss model (FPLM) in NS3 [52], which is designed for an unstructured clear path between receivers and transmitters to eliminate the performance degraded by random shadowing effects. The FPLM effectively erases the random effects caused by shadowing for the simulation results. The D2D settings of the 5G network follows the settings in the popular studies [53].
4.2. Performance Evaluation
We compare the performance of VPII with SECS and OCP in terms of the startup delay (SD), caching hit ratio, caching cost and control overhead, respectively.
Startup delay (SD): The difference value between the time that a request node receives the first video data sent by a video supplier and the time that sends the video request message to is considered as the startup delay. The average SD values of the solutions VPII, SECS and OCP every 5 s with the increasing simulation time are shown in Figure 3. The average SD values of the solutions VPII, SECS and OCP with different number ranges of video caching are shown in Figure 4.
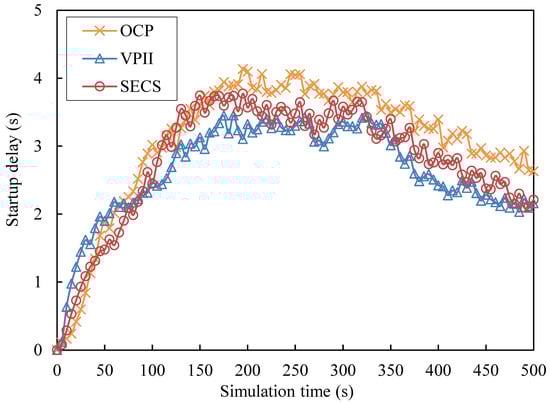
Figure 3.
Startup delay against simulation time.
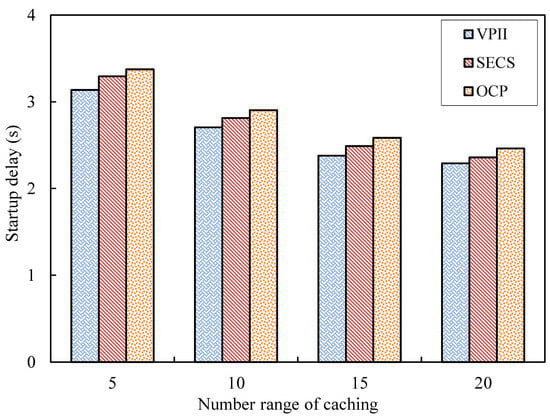
Figure 4.
Startup delay against number of cached videos.
As Figure 3 shows, the three curves corresponding to VPII, SECS and OCP have a fall trend after a fast rise with continuous fluctuation during the whole simulation time. The blue curve of VPII experiences a fast rise from t = 0 s to t = 180 s and keeps a stable trend from t = 190 s to t = 260 s. The SD values of VPII also have a rise after a fall from t = 270 s to t = 310 s and maintain a fast fall from t = 320 s to t = 500 s. The red curve of SECS has an fast increase process from t = 0 s to t = 150 s, keeps a slight decrease from t = 160 s to t = 260 s and experiences a fast fall after a slight rise from 270 s to 500 s. The orange curve of OCP has an evident rise from t = 0 s to t = 190 s and keeps a slight fall trend with a fluctuation from t = 200 s to t = 500 s. Although the SD values of VPII is larger than those of SECS and OCP during the initial simulation time, the blue curve of VPII has lower SD levels than those of curves of SECS and OCP during most of the simulation time. The peak value of the blue curve of VPII is less than those of curves of SECS and OCP.
As Figure 4 shows, the three bars corresponding to the solutions of VPII, SECS and OCP have the same fall processes with different ranges of numbers of video caching. The blue bars of VPII keep a fast fall from caching number 5 to 15 and has a slight reduction from caching number 15 to 20. The bars of SECS and OCP also have the same variation trend as VPII, namely a fast fall from caching number 5 to 15 and a slight reduction from caching number 15 to 20. The bars of VPII are lower than those of SECS and OCP with various numbers of video caching.
The SD values depend on the transmission delay of request messages, first video data and delay of request handling. The intensive request for popular videos brings a large amount of demand for upload bandwidth, which lengthens the delay of request handling and bandwidth allocation of supply nodes and leads to network congestion. The congestion results in long delay of transmission of request messages and first video data. VPII calculates the probability of users fetching videos to estimate interest levels of users and calculates the scale of spreading videos of users to estimate social influence levels of users. The high probabilities of fetching videos from candidate key nodes are preconditions of video propagation based on the assistance of key nodes. Estimation of social influence levels of candidate key nodes is the prediction of the possible scale of video propagation in the future. VPII uses interest levels and social influence levels to measure video propagation capacities of social users. In order to accurately estimate scale of video propagation, VPII estimates capacities for spreading videos according to scale and the importance of neighbor nodes covered by users. VPII designs a video propagation strategy with the assistance of key nodes and uses the selected key nodes in batches to push videos and provide video data for other request nodes in terms of the weighted key level based on investigation of available bandwidth and node degree centrality of key nodes. Because the key nodes can effectively push videos, the delay of video lookup and request handling can be reduced, which reduces the startup delay of request nodes. In order to control the propagation process, VPII predicts the demand scale of upload bandwidth before the selection of key nodes, which effectively ensures balance between supply and demand. Therefore, VPII can effectively relieve contradiction between demand and supply so that VPII has lower SD levels than SECS and OCP. On the other hand, because the periodic selection of key nodes of VPII does not adapt to the fast increase of request nodes during the initial simulation time, the SD values of VPII are larger than those of SECS and OCP. SECS builds groups consisting of users with common and similar interests and requires the intragroup nodes share videos with each other, which promotes success probabilities of video lookup based on the common interest of intragroup nodes. SECS designs a video caching management based on sharing performance awareness to implement caching and replacement of videos, which can implement real-time regulation of videos cached in local buffer to meet the dynamic demand of users. The performance-aware caching strategy can effectively address the variation of video demand, which promotes lookup success probabilities of videos and reduces delay of video lookup. However, while the performance-aware caching strategy focuses on addressing the problem of demand range of videos, the scale of video demand is overlooked. Further, SECS does not predict demand scale of users, so the fast arrival of intensive requests results in an overflow of handling capacities of supply nodes, which increases delay of request handling and bandwidth allocation. Moreover, intensive requests also bring a large amount of demand for upload bandwidth, so the congestion also leads to a further increase of delay of request messages and first video data. Therefore, the SD values of SECS are larger than those of VPII. OCP can predict the demand variation of the whole system by exchange of state between nodes. OCP requires the nodes cache and replace local videos in terms of the same caching time via message broadcasting. However, OCP does not consider social influence between users for the intention of fetching videos from users, which cannot ensure prediction accuracy of demand. The low prediction accuracy results in large difference levels between the predicted demand and the real demand, so the imbalance between supply and demand leads to scarce supply of upload bandwidth, which results in the long delay of request handling and bandwidth allocation. Moreover, the uniform caching time according to the caching decision also leads to the slow response for the dynamic demand, so the transmission delay of request messages and first video data and the delay of request handling increase. Therefore, the SD values of OCP are higher than those of VPII and SECS.
Caching hit ratio (CHR): When a node has stored a video in local buffer, receiving and dealing with a request message of from another node and transmitting data from to can be a cache hit. The ratio between the number of successful cache hits and the total number of all video requests is defined as the caching hit ratio. In order to clearly show the CHR simulation results, the average values of CHR during a time span of every 5 s are shown in Figure 5. The average CHR values of the solutions of VPII, SECS and OCP with different number ranges of video caching are shown in Figure 6.
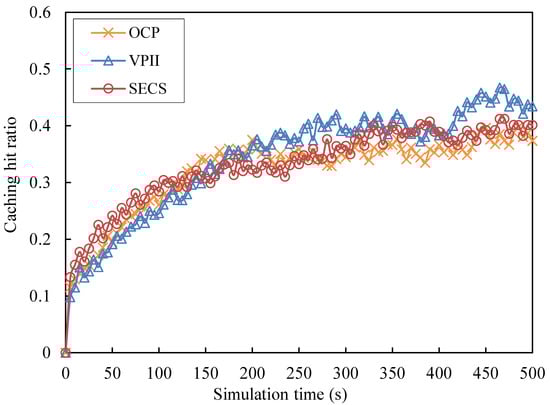
Figure 5.
Caching hit ratio against simulation time.
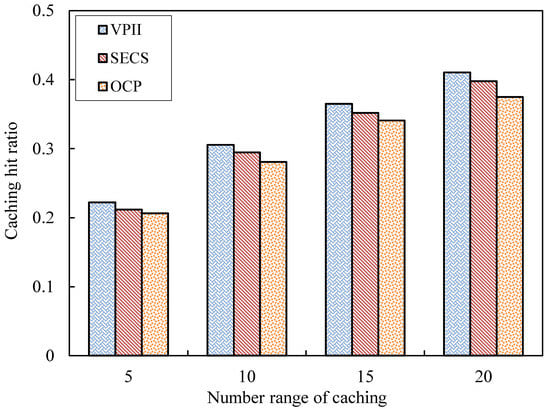
Figure 6.
Caching hit ratio against number of cached videos.
As Figure 5 shows, the three curves corresponding to VPII, SECS and OCP have a rise trend with continuous fluctuation during the whole simulation time. The blue curve of VPII experiences a relatively fast rise from t = 0 s to t = 280 s, keeps a stable trend from t = 290 s to t = 390 s and experiences a fast fall after a fast rise from t = 400 s to t = 500 s. The red curve of SECS has a fast increase process from t = 0 s to t = 200 s, keeps a stable state from t = 210 s to t = 270 s and experiences a slow rise from t = 280 s to t = 500 s. The orange curve of OCP also has a fast rise from t = 0 s to t = 200 s, experiences a slight fall from t = 210 s to t = 230 s and keeps a slow rise trend with a fluctuation from t = 240 s to t = 500 s. The CHR values of VPII are slightly less than those of SECS and OCP from t = 0 s to t = 150 s, but the blue curve of VPII is higher than those of the curves of SECS and OCP from t = 160 s to t = 500 s. The CHR peak value of VPII is less than those of curves of SECS and OCP.
As Figure 6 shows, the three bars corresponding to the solutions of VPII, SECS and OCP have the same rise processes with the different ranges of numbers of video caching. The blue bars of VPII rise quickly from caching number 5 to 10 and have a stable increase from caching numbers 10 to 20. The bars of SECS and OCP also have the same variation trend as those of VPII. The CHR values of three solutions are close to the same levels at caching number five. However, the increment of CHR values for VPII is higher than that of SECS and OCP from caching number 10 to 20. The bars of VPII are higher than those of SECS and OCP with various ranges of number sof video caching.
VPII estimates video propagation capacities according to probabilities of video fetching and social influence levels of candidate key nodes. VPII further uses scale and importance of covered neighbor nodes to estimate capacities for spreading videos bt candidate key nodes, which accurately estimates the scale of video propagation. VPII predicts the demand scale for upload bandwidth before selecting key nodes and designs a video propagation strategy with assistance of key nodes and uses the selected key nodes in batches to push videos and provide video data for other request nodes to achieve a balance between supply and demand. The key nodes can effectively push videos, which increases the number of successful cache hits and reduces the number of active requests. Moreover, VPII uses the key nodes to spread videos, which promote scale and range of category diversity and bandwidth scale of video supply, effectively reducing delay in video lookup and request handling. Therefore, the CHR values of VPII are larger than those of SECS and OCP. SECS requires that intragroup nodes share videos with each other based on the built groups consisting of users with common and similar interests, which achieves a high success ratio of video lookup and reduces delay in video lookup. SECS employs a performance-aware video caching management to dynamically cache and regulate video copies in a local buffer, which can economically meet the demand for videos, promote lookup success probabilities and reduce delay of video lookup. However, SECS does not predict the demand scale of users, so the overflow of handling capacities of the supply nodes caused by the fast arrival of intensive requests increases the delay of request handling and bandwidth allocation. The retransmission of request messages caused by lookup failure and response overtime reduce the CHR values of SECS. Therefore, the CHR values of SECS are less than those of VPII. OCP uses exchange of state between nodes to predict the demand variation of the whole system in order to implement accurate caching to meet demand. However, OCP employs the same caching time to spread caching decisions by message broadcasting, so OCP does not regulate scale of video copies in terms of variation of video demand in real time, thereby increasing the probabilities of imbalance between supply and demand. Moreover, OCP overlooks the social influence between users in fetching videos for users, which results in low prediction accuracy of demand. The imbalance between supply and demand of scale and range results in the long delay of request handling and bandwidth allocation. Therefore, the SD values of OCP are higher than those of VPII and SECS.
Caching Cost (CC): The mobile nodes act as the carriers of video copies, so the increase of video copies can provide upload bandwidth and effectively support scalability of video systems. The more the number of mobile nodes which take part in storing video copies is, the higher the cost of video sharing will be. Therefore, the ratio between the number of nodes which take part in storing video copies and the total number of nodes is defined as the caching cost. In order to clearly show the CC simulation results, the average value of CC every 10 s is shown in Figure 7. The average CC values of VPII, SECS and OCP with different number ranges of video caching are shown in Figure 8.
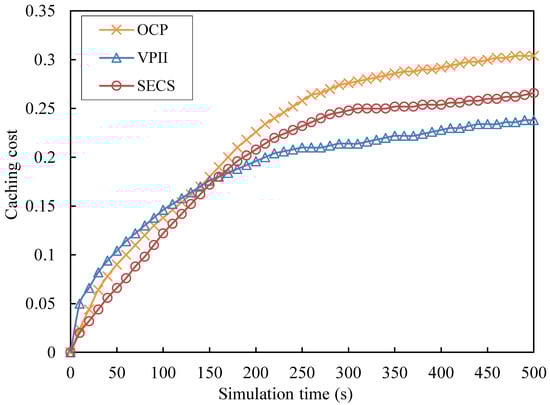
Figure 7.
Caching cost against simulation time.
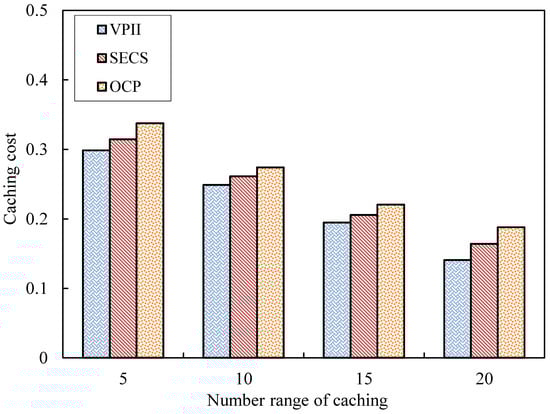
Figure 8.
Caching cost against number of cached videos.
As Figure 7 shows, the three curves corresponding to VPII, SECS and OCP maintain an increase process with continuous fluctuation during the whole simulation time. The blue curve of VPII has a fast increase from t = 0 s to t = 240 s and keeps a stable rise from t = 250 s to t = 500 s. The red curve of SECS keeps an fast increase from t = 0 s to t = 300 s, experiences a stable rise from t = 310 s to t = 270 s and experiences a slow rise from 280 s to 500 s. The orange curve of OCP also has a fast rise from t = 0 s to t = 250 s and experiences a slight increase from t = 260 s to t = 500 s. The CC values of VPII are slightly larger than those of SECS and OCP from t = 0 s to t = 150 s, but the blue curve of VPII is lower than those of SECS and OCP from t = 160 s to t = 500 s.
As Figure 8 shows, the three bars corresponding to the solutions of VPII, SECS and OCP maintain a significant decline trend with different ranges of number of video caching. The blue bars of VPII maintain a fast fall from caching number 5 to 20. The CC values of VPII have a decrease from caching number 5 to 20. The red bars of SECS also has a fast fall with the increasing number range of video caching. The CC values of SECS decrease from caching number 5 to 15 and have a slight decrease from caching number 15 to 20. The orange bars of OCP have major decrease from caching number 5 to 10 and keep decreasing more slowly from caching number 10 to 20. The CC values of VPII are less than those of SECS and OCP with various ranges of number of video caching.
VPII relies on the key nodes to implement video push and provide and allocate available video resources for the request nodes. VPII predicts scale of video demand in the future to regulate number of key nodes. Because VPII estimates the social influence and spread capacities of key nodes, VPII can accurately estimate video demand scale in terms of the spread capacities of key nodes and potential video requests. VPII can moderately control process and scale of video spread and ease the contradiction between supply and demand by the selection of key nodes. Initially, VPII selects more key nodes to promote scale of video copies and ensure scale and diversity of supplied video copies. VPII keeps the appropriate number of key nodes to balance supply and demand by increasing the scale of nodes that have stored one or multiple videos in a local buffer. Therefore, the caching cost of VPII is lower than that of SECS and OCP from t = 160 s to t = 500 s. SECS clusters the mobile nodes with common interests into the same group and requires the intragroup nodes share videos with each other via “pull” and “push” ways. The spread rate of videos determines the number of nodes which have stored videos in a local buffer, so the CC values of VPII keep low levels during the initial stage. SECS has a performance-aware caching management in terms of spread and demand scale, but SECS does not allocate video caching for the intragroup. The CC values of SECS maintain a slow rise with increasing request nodes. OCP can predict the demand scale of videos for the whole system by exchanging node state and implementing video caching with a uniform time. The number of nodes that have stored videos relies on the demand scale in OCP. Because OCP employs the queuing model to replace local videos at the same time, the timeliness of caching replacement of OCP is lower than those of VPII and SECS. Therefore, the CC values of OCP are larger than those of VPII and SECS.
Control Overhead (CO): Control messages are used to allocate and regulate video cache copies and collect and interact in mobile node state. The bandwidth consumption caused by control messages can be defined as the control overhead. In order to clearly show the CO simulation results, the average value of CO every 10 s is shown in the Figure 9. The average CO values of VPII, SECS and OCP with different number ranges of video caching are shown in Figure 10.
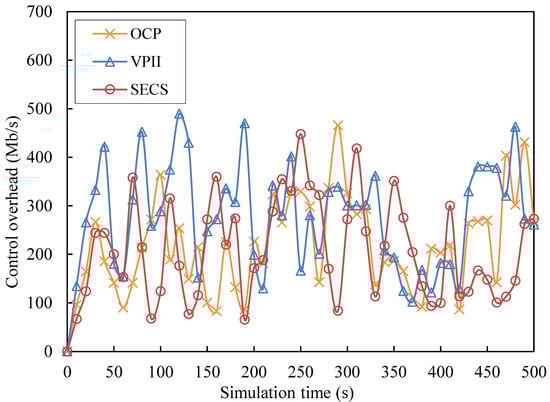
Figure 9.
Control overhead against simulation time.
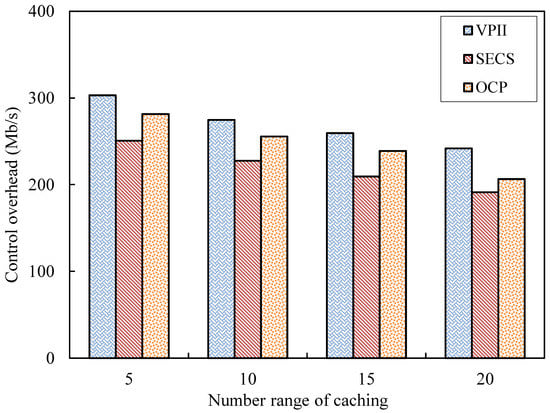
Figure 10.
Control overhead against number of cached videos.
As Figure 9 shows, the three curves corresponding to VPII, SECS and OCP have severe fluctuation during the whole simulation time. The blue curve of VPII has a severe fluctuation from t = 0 s to t = 330 s, keeps a relatively stable trend from t = 340 s to t = 420 s and also has severe jitter from t = 430 s to t = 500 s. The red curve of SECS keeps severe jitter from t = 0 s to t = 390 s and experiences a relatively stable trend with fortuitous jitter from t = 390 s to t = 500 s. The orange curve of OCP has srelatively low levels of severe jitter from t = 0 s to t = 500 s. The CO values of VPII are slightly larger than those of SECS and OCP during the whole simulation time and have the larger peak value than those of SECS and OCP.
As Figure 10 shows, the three bars corresponding to the solutions of VPII, SECS and OCP maintain a slow fall with the different ranges of number of video caching. The blue bars of VPII fall quickly from caching number 5 to 10 and have a slight decrease from caching number 10 to 20. The red bars of SECS also fall quickly from caching number 5 to 10 and decrease slightly from caching number 10 to 20. The orange bars of OCP have a small decrease from caching number 5 to 15 and decrease more from caching number 15 to 20. The CO values of VPII are larger than those of SECS and OCP with various ranges of number of video caching.
VPII continuously collects information, including interests and social influence of mobile nodes to estimate spread capacities of candidate key nodes. Moreover, VPII also collects information of request scale in networks to predict demand scale. Therefore, the CO values of VPII are larger than those of SECS and OCP. SECS needs to collect information of interest and sociability of nodes to construct node groups and maintain the structure of node groups by collecting node states. Moreover, SECS also collects information of sharing capacities of nodes to estimate sharing performance and manage local video copies of nodes. However, the frequency and range of information collection of SECS are less than those of VPII. Therefore, the CO values of SECS are less than those of VPII. OCP periodically exchanges state list among users in order to predict the demand variation. OCP controls video caching and replacement of nodes by message broadcasting. Therefore, the range of message exchange of OCP is larger than SECS. However, OCP can regulate period time of caching and replacement of videos by predicting video demand, which reduces control overhead. OCP has lower CO than VPII and has higher CO than SECS.
5. Conclusions
In this paper, we propose a novel video propagation strategy fusing user interests and social influences based on the assistance of key nodes in social networks (VPII). VPII estimates key levels of nodes for video propagation capacities in terms of interest-based probability that nodes fetch videos and scale of nodes spreading videos. VPII designs a multi-round video propagation strategy: the weight of key levels of nodes is estimated according to available bandwidth and node degree centrality, and the selected key nodes implement accurate launching and distribution of videos according to a dynamic variation of the relationship between supply and demand of videos. Simulation results show that VPII obtains lower startup delay, higher caching hit ratio, lower caching cost and higher control overhead than SECS and OCP. However, there are some limitations for our work (e.g., integration, effectiveness and consistency of evaluation metrics of key levels and high control overhead for estimation and regulation of key nodes). Future works will focus on multiple ways and methods of promoting video propagation and optimization of evaluation metrics of propagation models using machine learning based on real data of video sharing.
Author Contributions
Writing—original draft preparation S.J., writing—review and literature search T.W., writing—review and data analysis X.S., writing—review and data curation L.L. All authors have read and agreed to the published version of the manuscript.
Funding
This research was funded by the Training Plan for Young Backbone Teachers of Colleges and Universities in Henan under Grant nos. 2020GGJS191, Special project of key research and development Plan of Henan Province under Grant nos. 221111111700, Open Foundation of the Guangxi Key Laboratory of Trusted Software (Grant no. KX202040) and Innovation Team of University Science and Technology of Henan Province under Grant nos. 22IRTSTHN016 and 23IRTSTHN017 and the National Natural Science Foundation of China (NSFC) under Grant Nos. 42071198.
Conflicts of Interest
The authors declare that there is no conflict of interest regarding the publication of this paper.
References
- Zhong, L.; Chen, X.; Xu, C.; Ma, Y.; Wang, M.; Zhao, Y.; Muntean, G. A Multi-User Cost-Efficient Crowd-Assisted VR Content Delivery Solution in 5G-and-Beyond Heterogeneous Networks. IEEE Trans. Mob. Comput. 2022. [Google Scholar] [CrossRef]
- Nahar, T.; Rawat, S. Efficiency enhancement techniques of microwave and millimeter-wave antennas for 5G communication: A survey. Trans. Emerg. Telecommun. Technol. 2022, 33, e4530. [Google Scholar] [CrossRef]
- Jeon, G.; Bellandi, V.; Chehri, A.; Albertini, M.K. Potential of sixth-generation technologies for emerging future wireless networks. Trans. Emerg. Telecommun. Technol. 2022, 33, e4480. [Google Scholar] [CrossRef]
- Xu, C.; Qin, J.; Zhang, P.; Gao, K.; Grieco, L.A. Reinforcement Learning-based Mobile AR/VR Multipath Transmission with Streaming Power Spectrum Density Analysis. IEEE Trans. Mob. Comput. 2021, 21, 4529–4540. [Google Scholar] [CrossRef]
- Agrawal, J.; Kapoor, M.; Tomar, R. A ferry mobility based direction and time-aware greedy delay-tolerant routing (FM-DT-GDR) protocol for sparse flying ad-hoc network. Trans. Emerg. Telecommun. Technol. 2022, 33, e4533. [Google Scholar] [CrossRef]
- Yu, Q.; Yu, H.; Wang, Y.; Pham, T.D. SUM-GAN-GEA: Video Summarization Using GAN with Gaussian Distribution and External Attention. Electronics 2022, 11, 3523. [Google Scholar] [CrossRef]
- Li, Y.; Wang, C.; Hong, J.; Zhu, J.; Guo, J.; Wang, J.; Guo, Y.; Wang, W. Video Vectorization via Bipartite Diffusion Curves Propagation and Optimization. IEEE Trans. Vis. Comput. Graph. 2022, 28, 3265–3276. [Google Scholar] [CrossRef]
- Tan, B.; You, W.; Huang, C.; Xiao, T.; Tian, S.; Luo, L.; Xiong, N. An Intelligent Near-Infrared Diffuse Reflectance Spectroscopy Scheme for the Non-Destructive Testing of the Sugar Content in Cherry Tomato Fruit. Electronics 2022, 11, 3504. [Google Scholar] [CrossRef]
- Ostrowski, P.K.; Katsaros, E.; Wesierski, D.; Jezierska, A. BP-EVD: Forward Block-Output Propagation for Efficient Video Denoising. IEEE Trans. Image Process. 2022, 31, 3809–3824. [Google Scholar] [CrossRef]
- Matsumoto, K.; Amitani, R.; Yoshida, M.; Kita, K. Trend Prediction Based on Multi-Modal Affective Analysis from Social Networking Posts. Electronics 2022, 11, 3431. [Google Scholar] [CrossRef]
- Xiao, H.; Xu, C.; Ma, Y.; Yang, S.; Zhong, L.; Muntean, G. Edge Intelligence: A Computational Task Offloading Scheme for Dependent IoT Application. IEEE Trans. Wirel. Commun. 2022, 21, 7222–7237. [Google Scholar] [CrossRef]
- Al-Zubi, R.T.; Darabkh, K.A.; Khattabi, Y.M.; Issa, M.T.A. Markov-based analysis for cooperative HARQ-aided NOMA transmission scheme in 5G and beyond. Trans. Emerg. Telecommun. Technol. 2022, 33, e4444. [Google Scholar] [CrossRef]
- Bhatia, M. Energy efficient IoT-based informative analysis for edge computing environment. Trans. Emerg. Telecommun. Technol. 2022, 33, e4527. [Google Scholar] [CrossRef]
- Guan, Y.; Zhang, X.; Guo, Z. PrefCache: Edge Cache Admission With User Preference Learning for Video Content Distribution. IEEE Trans. Circuits Syst. Video Technol. 2021, 31, 1618–1631. [Google Scholar] [CrossRef]
- Li, Q.; Chen, S.; Tan, S.; Li, B.; Huang, J. One-Class Double Compression Detection of Advanced Videos Based on Simple Gaussian Distribution Model. IEEE Trans. Circuits Syst. Video Technol. 2022, 32, 2496–2500. [Google Scholar] [CrossRef]
- Chiang, Y.; Hsu, C.-H.; Wei, H.-Y. Collaborative Social-Aware and QoE-Driven Video Caching and Adaptation in Edge Network. IEEE Trans. Multimed. 2020, 23, 4311–4325. [Google Scholar] [CrossRef]
- Elgabli, A.; Liu, K.; Aggarwal, V. Optimized Preference-Aware Multi-Path Video Streaming with Scalable Video Coding. IEEE Trans. Mob. Comput. 2020, 19, 159–172. [Google Scholar] [CrossRef]
- Elgabli, A.; Felemban, M.; Aggarwal, V. GroupCast: Preference-Aware Cooperative Video Streaming With Scalable Video Coding. IEEE/ACM Trans. Netw. 2019, 27, 1138–1150. [Google Scholar] [CrossRef]
- Hu, H.; Wen, Y.; Feng, S. Budget-Efficient Viral Video Distribution Over Online Social Networks: Mining Topic-Aware Influential Users. IEEE Trans. Circuits Syst. Video Technol. 2018, 28, 759–771. [Google Scholar] [CrossRef]
- Liu, J.; Yang, Y.; Huang, Z.; Yang, Y.; Shen, H.T. On the Influence Propagation of Web Videos. IEEE Trans. Knowl. Data Eng. 2014, 26, 1961–1973. [Google Scholar] [CrossRef]
- Hu, H.; Wen, Y.; Chua, T.-S.; Huang, J.; Zhu, W.; Li, X. Joint Content Replication and Request Routing for Social Video Distribution Over Cloud CDN: A Community Clustering Method. IEEE Trans. Circuits Syst. Video Technol. 2016, 26, 1320–1333. [Google Scholar] [CrossRef]
- Guler, B.; Varan, B.; Tutuncuoglu, K.; Nafea, M.; Zewail, A.A.; Yener, A.; Octeau, D. Using Social Sensors for Influence Propagation in Networks With Positive and Negative Relationships. IEEE J. Sel. Top. Signal Process. 2015, 9, 360–373. [Google Scholar] [CrossRef]
- Liu, X.; He, D.; Liu, C. Information Diffusion Nonlinear Dynamics Modeling and Evolution Analysis in Online Social Network Based on Emergency Events. IEEE Trans. Comput. Soc. Syst. 2019, 6, 8–19. [Google Scholar] [CrossRef]
- Wang, Z.; Sun, L.; Zhang, M.; Pang, H.; Tian, E.; Zhu, W. Propagation- and Mobility-Aware D2D Social Content Replication. IEEE Trans. Mob. Comput. 2017, 16, 1107–1120. [Google Scholar] [CrossRef]
- Traverso, S.; Huguenin, K.; Trestian, I.; Erramilli, V.; Laoutaris, N.; Papagiannaki, K. Social-Aware Replication in Geo-Diverse Online Systems. IEEE Trans. Parallel Distrib. Syst. 2015, 26, 584–593. [Google Scholar] [CrossRef]
- Mahdizadehaghdam, S.; Wang, H.; Krim, H.; Dai, L. Information Diffusion of Topic Propagation in Social Media. IEEE Trans. Signal Inf. Process. Over Netw. 2016, 4, 569–581. [Google Scholar] [CrossRef]
- Wang, Z.; Liu, J.; Zhu, W. Social-aware video delivery: Challenges, approaches, and directions. IEEE Netw. 2016, 30, 35–39. [Google Scholar] [CrossRef]
- Roy, A.; De, P.; Saxena, N. Location-based social video sharing over next generation cellular networks. IEEE Commun. Mag. 2015, 53, 136–143. [Google Scholar] [CrossRef]
- Roy, S.D.; Mei, T.; Zeng, W.; Li, S. Towards Cross-Domain Learning for Social Video Popularity Prediction. IEEE Trans. Multimed. 2013, 15, 1255–1267. [Google Scholar] [CrossRef]
- Wang, H.; Tang, G.; Wu, K.; Wang, J. PLVER: Joint Stable Allocation and Content Replication for Edge-Assisted Live Video Delivery. IEEE Trans. Parallel Distrib. Syst. 2022, 33, 218–230. [Google Scholar] [CrossRef]
- Niu, G.; Fan, X.; Li, V.O.K.; Long, Y.; Xu, K. Multi-Source-Driven Asynchronous Diffusion Model for Video-Sharing in Online Social Networks. IEEE Trans. Multimed. 2014, 16, 2025–2037. [Google Scholar] [CrossRef]
- Sang, L.; Xu, M.; Qian, S.; Martin, M.; Li, P.; Wu, X. Context-Dependent Propagating-Based Video Recommendation in Multimodal Heterogeneous Information Networks. IEEE Trans. Multimed. 2021, 23, 2019–2032. [Google Scholar] [CrossRef]
- Cai, W.; Leung, V.C.M. Multiplayer cloud gaming system with cooperative video sharing. In Proceedings of the 4th IEEE International Conference on Cloud Computing Technology and Science, Taipei, Taiwan, 3–6 December 2012. [Google Scholar]
- Jiao, J.; Guo, S.; Wang, Y.; Yang, Y. Energy-Efficient Cooperative Scalable Video Distribution and Sharing in Mobile Social Networks. In Proceedings of the 15th International Conference on Mobile Ad-Hoc and Sensor Networks, Shenzhen, China, 11–13 December 2019. [Google Scholar]
- Hu, B.; Cheung, G.; Zhao, H.V. Incentive analysis for cooperative distribution of interactive multiview video. In Proceedings of the 2012 IEEE International Conference on Acoustics, Speech and Signal, Kyoto, Japan, 25–30 March 2012. [Google Scholar]
- Shiroma, T.; Nakajima, T.; Wu, C.; Yoshinaga, T. A Light-Weight Cooperative Caching Strategy by D2D Content Sharing. In Proceedings of the 2017 Fifth International Symposium on Computing and Networking, Aomori, Japan, 19–22 November 2017. [Google Scholar]
- Wu, D.; Liu, Q.; Wang, H.; Yang, Q.; Wang, R. Cache Less for More: Exploiting Cooperative Video Caching and Delivery in D2D Communications. IEEE Trans. Multimed. 2019, 21, 1788–1798. [Google Scholar] [CrossRef]
- Tian, D.; Shen, L.; Yao, Z. Motion activity based wireless video quality perceptual metric. In Proceedings of the 2001 International Symposium on Intelligent Multimedia, Video and Speech Processing, Hong Kong, China, 2–4 May 2001. [Google Scholar]
- Eswara, N.; Manasa, K.; Kommineni, A.; Chakraborty, S.; Sethuram, H.P.; Kuchi, K.; Kumar, A.; Channappayya, S.S. A Continuous QoE Evaluation Framework for Video Streaming Over HTTP. IEEE Trans. Circuits Syst. Video Technol. 2018, 28, 3236–3250. [Google Scholar] [CrossRef]
- Feng, C.; Huang, L.; Tan, X.; Xu, W. Network Packet Level Based Video Quality Assessment Metric. In Proceedings of the International Conference on Computational Intelligence Theory, Systems and Applications, Ilan, Taiwan, 10–12 December 2015. [Google Scholar]
- Yao, J.Y.; Liu, G. Bitrate-Based No-Reference Video Quality Assessment Combining the Visual Perception of Video Contents. IEEE Trans. Broadcast. 2019, 65, 546–557. [Google Scholar] [CrossRef]
- Hu, F.; Deng, Y.; Aghvami, A.H. Cooperative Multigroup Broadcast 360° Video Delivery Network: A Hierarchical Federated Deep Reinforcement Learning Approach. IEEE Trans. Wirel. Commun. 2022, 21, 4009–4024. [Google Scholar] [CrossRef]
- Tang, K.; Kan, N.; Zou, J.; Li, C.; Fu, X.; Hong, M.; Xiong, H. Multi-User Adaptive Video Delivery Over Wireless Networks: A Physical Layer Resource-Aware Deep Reinforcement Learning Approach. IEEE Trans. Circuits Syst. Video Technol. 2021, 31, 798–815. [Google Scholar] [CrossRef]
- Choi, M.; Shin, M.; Kim, J. Dynamic video delivery using deep reinforcement learning for device-to-device underlaid cache-enabled Internet-of-vehicle networks. J. Commun. Netw. 2021, 23, 117–128. [Google Scholar] [CrossRef]
- Kwon, D.; Kim, J.; Mohaisen, D.A.; Lee, W. Self-adaptive power control with deep reinforcement learning for millimeter-wave Internet-of-vehicles video caching. J. Commun. Netw. 2020, 22, 326–337. [Google Scholar] [CrossRef]
- Shi, W.; Wang, C.; Jiang, Y.; Li, Q.; Shen, G.; Muntean, G.-M. CoLEAP: Cooperative Learning-Based Edge Scheme With Caching and Prefetching for DASH Video Delivery. IEEE Trans. Multimed. 2020, 23, 3631–3645. [Google Scholar] [CrossRef]
- Lawrence, E.E.; Latha, R. Analysis of six degrees of separation in Facebook using Ant colony optimization. In Proceedings of the International Conference on Circuits, Power and Computing Technologies, Nagercoil, India, 20–21 March 2015. [Google Scholar]
- Xu, C.; Wang, M.; Chen, X.; Zhong, L.; Grieco, L.A. Optimal information centric caching in 5G device-to-device communications. IEEE Trans. Mob. Comput. 2018, 17, 2114–2126. [Google Scholar] [CrossRef]
- Jia, S.; Zhou, Z.; Li, W.; Ma, Y.; Zhang, R.; Wang, T. Social-Aware Edge Caching Strategy of Video Resources in 5G Ultra-Dense Network. Mob. Inf. Syst. 2021, 2021, 6625629. [Google Scholar] [CrossRef]
- Li, W. Random texts exhibit Zipf’s-law-like word frequency distribution. Inst. Electr. Electron. Eng. Trans. Inf. Theory 1992, 38, 1842–1845. [Google Scholar] [CrossRef]
- Li, Q.; Zhang, Y.; Pandharipande, A.; Ge, X.; Zhang, J. D2D-Assisted Caching on Truncated Zipf Distribution. IEEE Access 2019, 7, 13411–13421. [Google Scholar] [CrossRef]
- Aldalbahi, A.; Rahaim, M.; Khreishah, A.; Ayyash, M.; Little, T.D.C. Visible Light Communication Module: An Open Source Extension to the ns3 Network Simulator With Real System Validation. IEEE Access 2017, 5, 22144–22158. [Google Scholar] [CrossRef]
- Zhang, H.; Liao, Y.; Song, L. D2D-U: Device-to-Device Communications in Unlicensed Bands for 5G System. IEEE Trans. Onwireless Commun. 2017, 16, 3507–3519. [Google Scholar] [CrossRef]
Disclaimer/Publisher’s Note: The statements, opinions and data contained in all publications are solely those of the individual author(s) and contributor(s) and not of MDPI and/or the editor(s). MDPI and/or the editor(s) disclaim responsibility for any injury to people or property resulting from any ideas, methods, instructions or products referred to in the content. |
© 2023 by the authors. Licensee MDPI, Basel, Switzerland. This article is an open access article distributed under the terms and conditions of the Creative Commons Attribution (CC BY) license (https://creativecommons.org/licenses/by/4.0/).