1. Introduction
Map prediction is crucial in intelligent transportation, especially in bird’s eye view (BEV) map generation, which leverages in-vehicle cameras with real-time capabilities [
1]. BEV map generation [
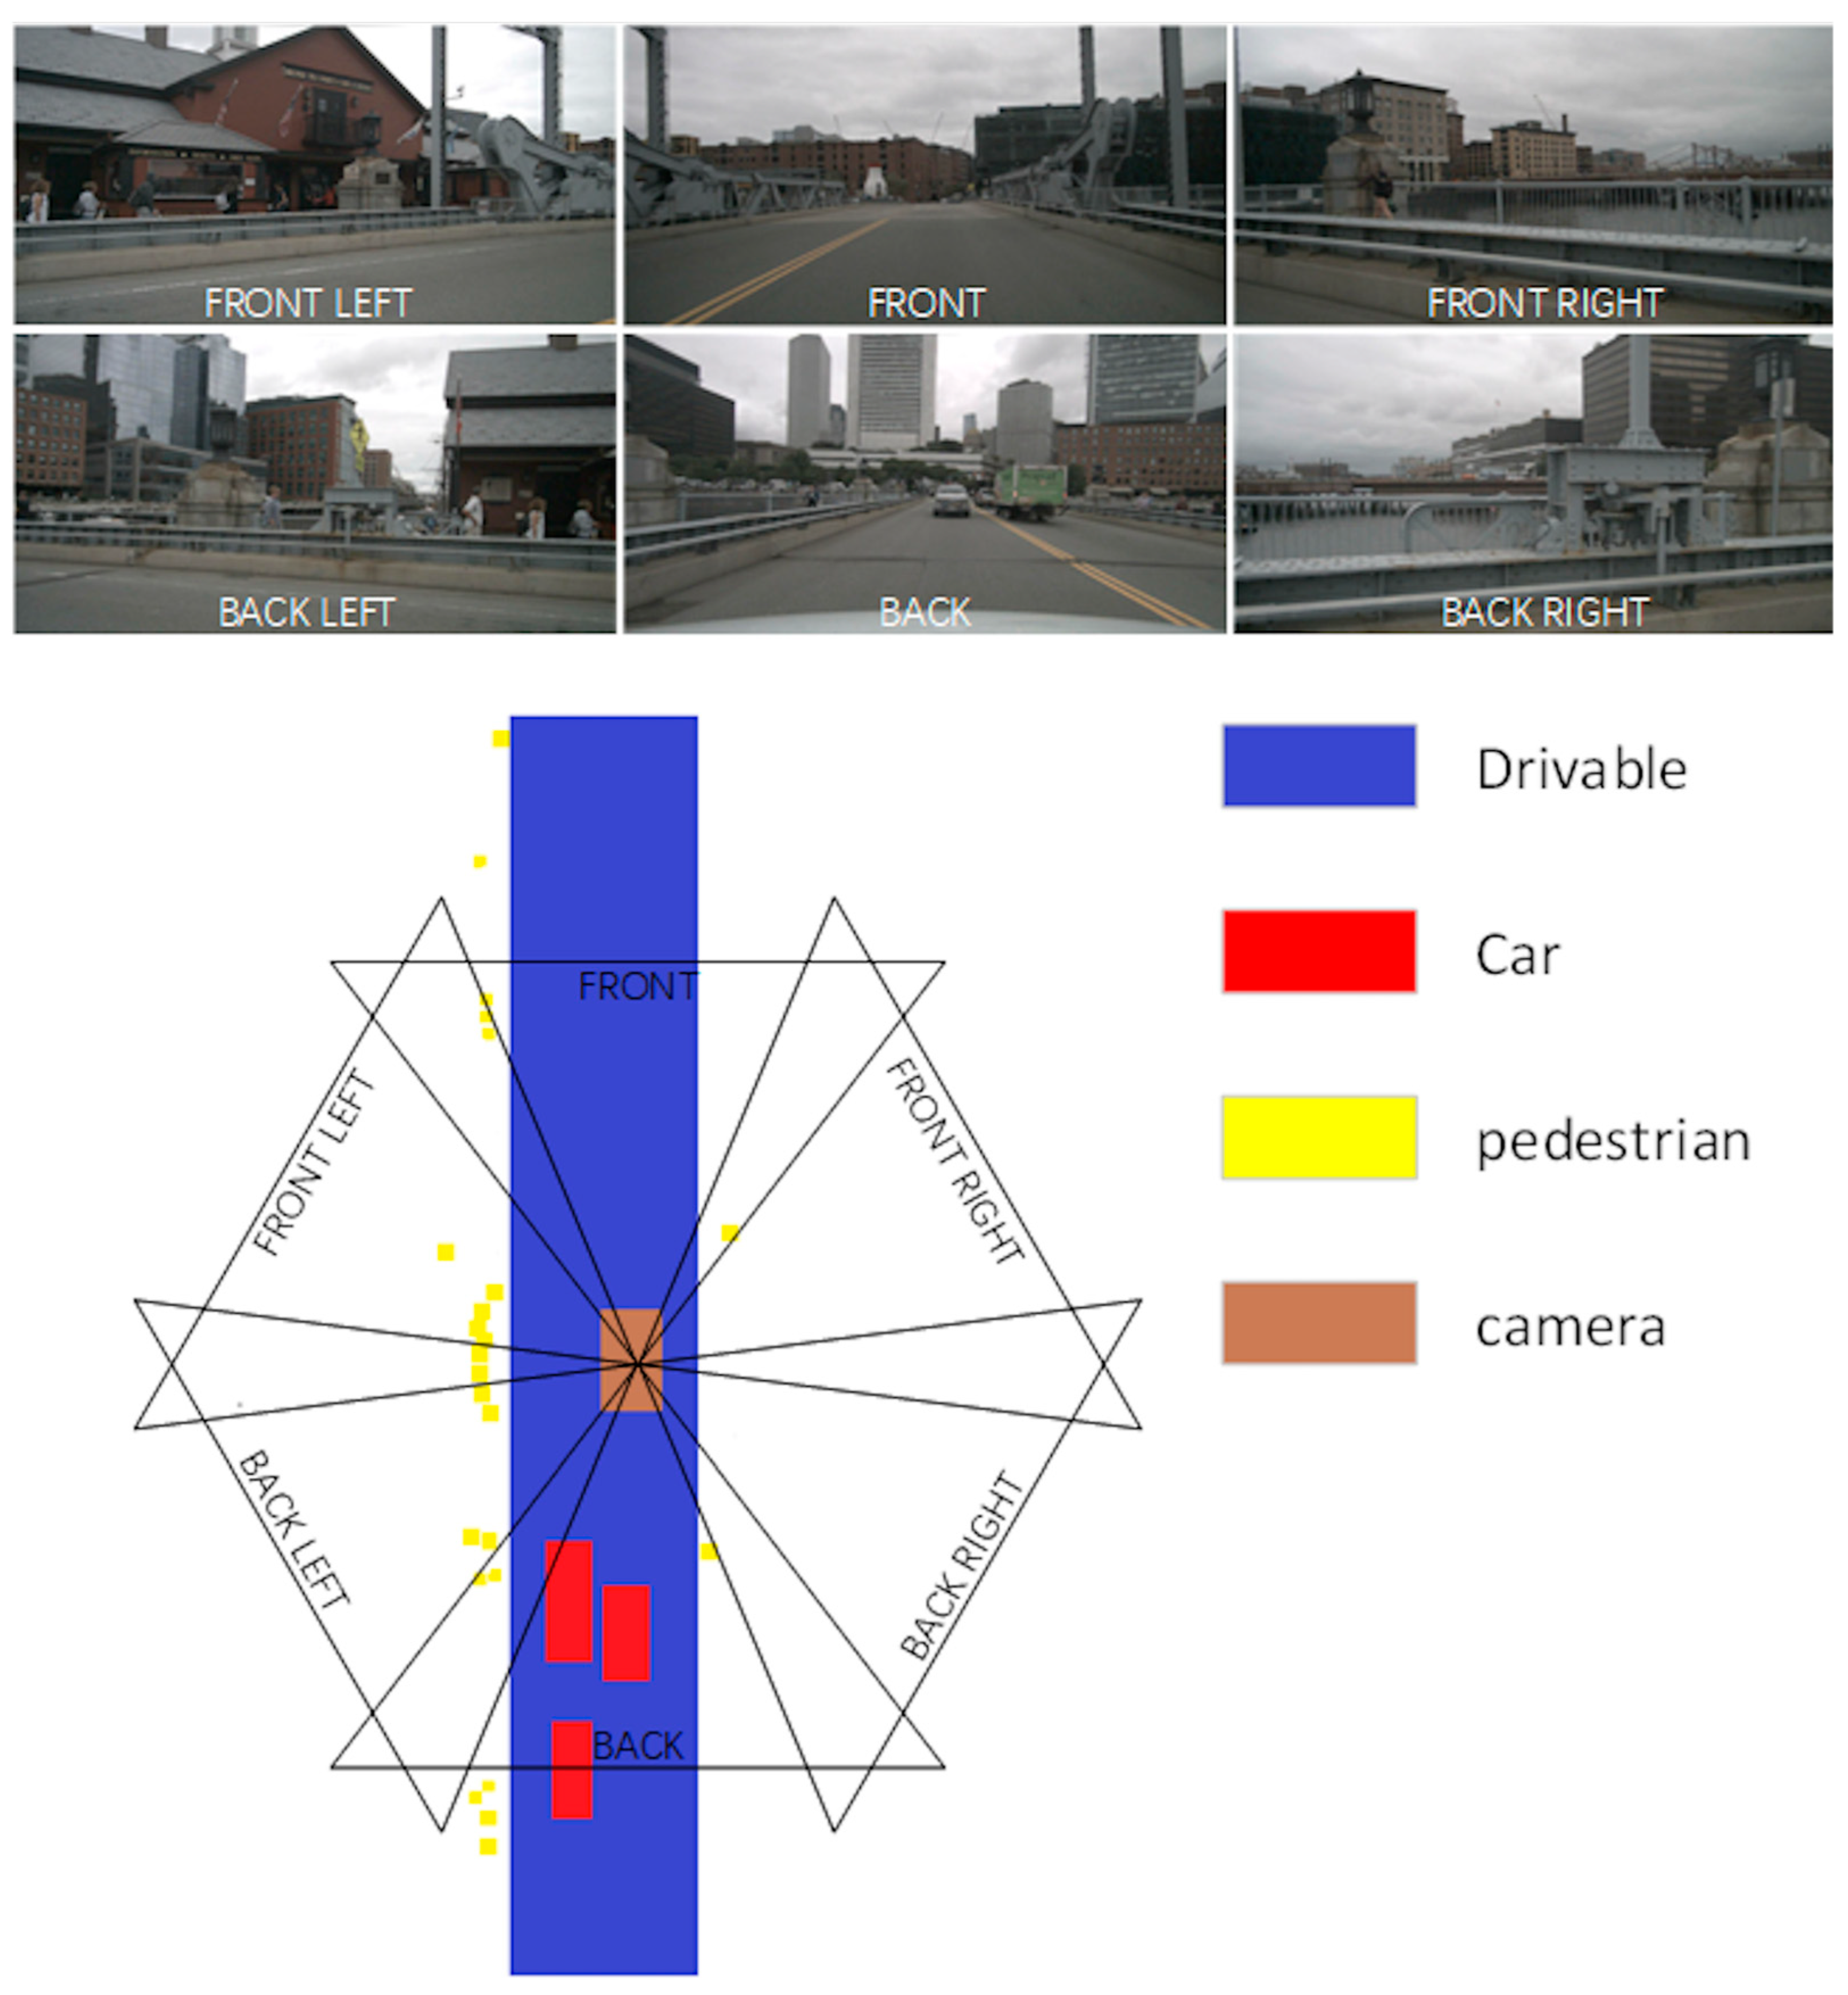
2] is a pivotal task within intelligent transportation, offering vital data for environmental perception and path planning in autonomous driving systems. As shown in
Figure 1, six more comprehensive perspectives are used to capture moving vehicles and passing pedestrians.
Two primary methods for BEV map generation exist, one based on target detection [
3] and the other on semantic segmentation [
4]. In the target detection approach, a deep neural network identifies obstacles in images and then maps their locations onto the BEV map using external camera and radar parameters [
5]. On the other hand, the semantic segmentation method involves a deep neural network classifying images at the pixel level [
6], then projecting the classification outcomes onto the BEV map using the same external parameters [
7]. Each method has its merits and demerits. Target detection is more precise in locating obstacles but may overlook small or occluded objects [
8]. In contrast, semantic segmentation is comprehensive but may need more clarity or misclassifications.
BEV is a technique that transforms images from the camera perspective to the bird’s-eye view, which can be used for semantic segmentation, vehicle detection and tracking, and other tasks in intelligent transportation. BEV can provide a more intuitive and global scene representation, which helps to understand the traffic flow and behavior. The key challenge of BEV is how to deal with the semantic and positional uncertainty in the images, and how to perform effective transformation between different planes. The above content describes a method that uses a neural network model to solve these problems, which can predict the binary variables for each class, the transformation matrix between planes, and the semantic segmentation on the BEV surface from the input image. This method is end-to-end and does not require additional annotation or prior knowledge. This method has a wide research scope in intelligent transportation, and it can be extended to multiple cameras, dynamic scenes, and different road types. This method also has an impact on the early work on BEV, such as using geometric transformation, projection matrix, or depth estimation to achieve BEV. These works have some limitations, such as the dependence on the camera parameters, the assumption of the scene, or the demand for computational resources. This method tries to overcome these limitations, and improve the accuracy and robustness of BEV, to further promote the technology in urban multimodal transportation.
Recent research focusing on converting images into BEV maps is on the cutting edge [
9,
10,
11,
12], with relatively few reports available. This approach utilizes monocular or binocular cameras to capture road scenes and transforms them into a bird’s-eye view through projection. This significantly enhances the perception capabilities of autonomous driving systems by providing more spatial information, including vehicle location, direction, speed, road geometry, and topology [
13]. Image-to-BEV map research is broadly categorized into geometry-based and deep learning-based methods. Geometry-based methods necessitate prior knowledge of camera parameters and road plane equations for transformation based on perspective projection principles [
14]. Deep learning-based methods, however, employ neural networks to learn transformation functions directly from images, eliminating the need for explicit camera parameters or road plane assumptions. Each method has its strengths and weaknesses, with simpler geometry-based approaches requiring accurate calibration and road plane assumptions. In contrast, deep learning-based methods [
15] offer flexibility and robustness but demand substantial training data and computational resources. Nonetheless, these methods primarily cater to real-time in-vehicle navigation and have limitations in predicting small and medium-sized targets at long distances, dealing with unclear outlines, and addressing position drift. This limits their applicability in data-driven smart transportation systems [
16]. To address this issue, we posit that converting image features into BEV features, particularly in the top-down process, does not sufficiently mine small-scale spatial information.
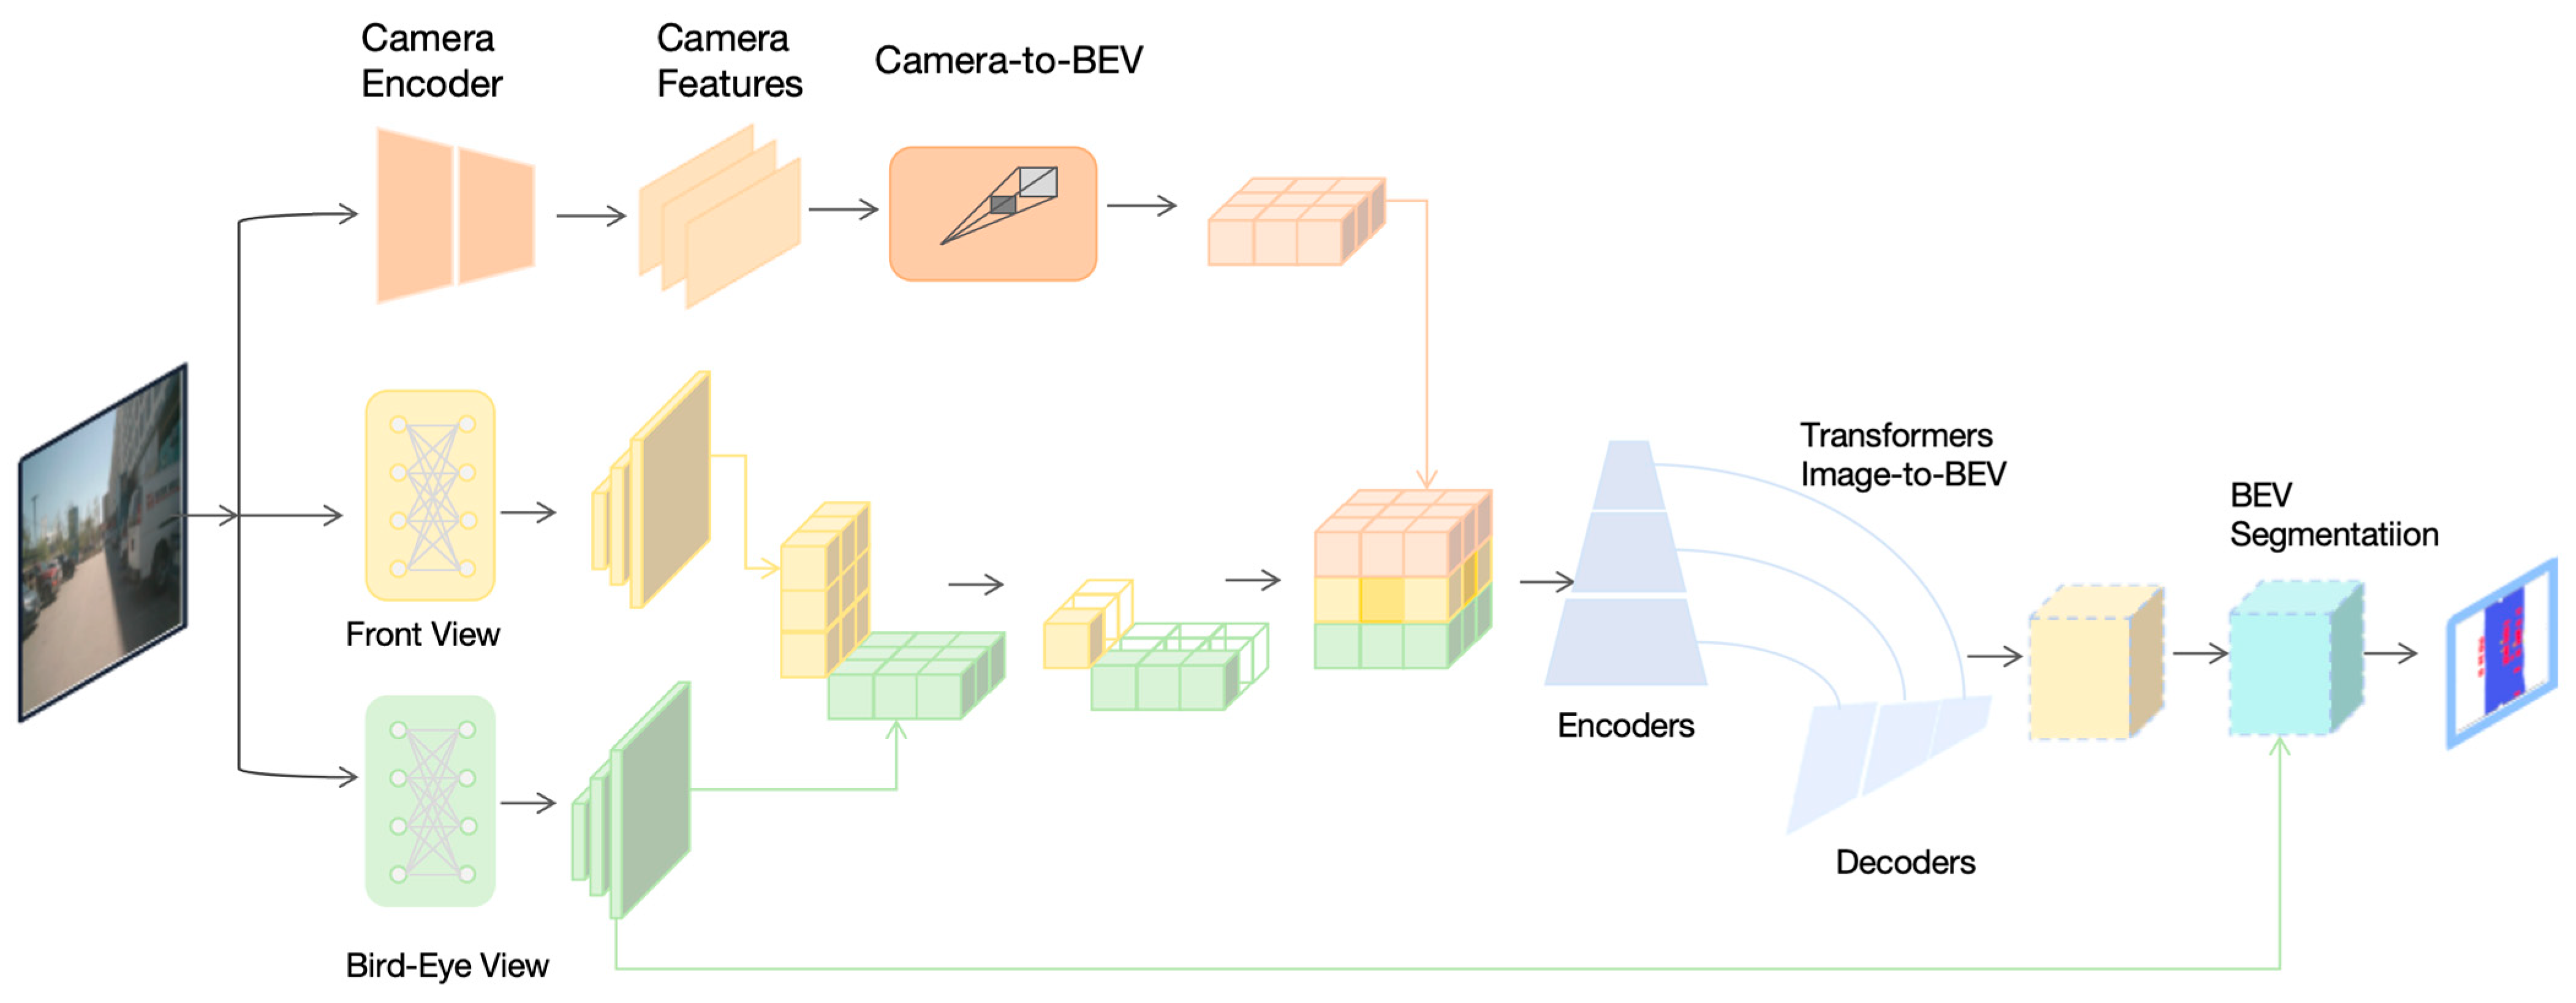
Our alignment model is fundamentally geared towards understanding the alignment relationship between the vertical scan lines present within the image and the polar coordinates in the BEV. We adopted a Transformer-based alignment model with a bidirectional transformer model which includes modifying the attention mechanism so that the model can better account for contextual information on both sides of the input sequence. This can be achieved by modifying the way the attention score is calculated so that the model considers both the first and second half of the input sequence when calculating contextual weights. This meticulously captures the pairwise interaction between a scanline and its corresponding polar coordinates within the BEV projection to achieve this objective. The Transformer architecture is particularly well suited for addressing image-to-BEV translation challenges. Its ability to reason about the complex interdependencies among objects, depth, and scene lighting results in globally consistent representations. Within our approach, this Transformer-based alignment model is seamlessly integrated into an end-to-end learning framework. This framework takes as input a monocular image and its internal matrix, enabling it to predict semantic BEV maps for both static and dynamic categories, as shown in
Figure 1. Predicting semantic BEV maps for both static and dynamic categories is a challenging task because it involves dealing with various sources of uncertainty and complexity. Some of the possible challenges are (1) Static categories, such as buildings, roads, and sidewalks, may have different shapes, sizes, and orientations in the image plane, which require accurate estimation of their depth and boundaries to map them to the BEV surface. (2) Dynamic categories, such as cars, pedestrians, and cyclists, may have occlusions, motion blur, and varying poses in the image plane, which require robust detection and tracking to map them to the BEV surface. (3) The transformation between the image plane and the BEV surface may depend on the camera parameters, the scene geometry, and the road layout, which may not be known or consistent in different scenarios. (4) The semantic BEV map may have different resolutions, scales, and perspectives, which require adaptive and flexible representation and visualization.
2. Related Work
2.1. Map Generation in Intelligent Transportation
Map generation is a critical issue within intelligent transportation, with far-reaching navigation, planning, and safety implications [
17]. Currently, various methods are employed for map generation [
18,
19,
20], with the most prevalent ones involving remote-sensing satellites and vehicle-mounted cameras.
Remote sensing satellites utilize sensors on board the satellite, including optical cameras, radars, or laser scanners, to capture images and data from the ground [
21]. Subsequently, these data are processed and analyzed to generate maps [
22]. This approach offers distinct advantages, as it can cover expansive areas, deliver high-resolution and multi-spectral information, and remain unaffected by weather and lighting conditions. Nonetheless, it has drawbacks, such as extended data transmission and processing times [
23], infrequent map updates, and the inability to depict specific details accurately and rapidly changing information, such as real-time road conditions and traffic flow [
24].
In contrast, vehicle-mounted cameras strategically positioned on vehicles [
25], including front and rear-view mirrors or dashboard cameras, capture real-time images and data from the road. These data are then processed and analyzed to create maps. The primary strength of the method lies in its capacity to deliver real-time road information [
26], effectively reflecting dynamic changes in the map and offering detailed features like road signs, traffic signals, and lane demarcations. However, it is not without drawbacks, as image quality may fluctuate due to weather and lighting conditions, and it necessitates the participation of many vehicles to ensure data consistency and accuracy.
In this context, LiDAR data, as an emerging technology, introduces new possibilities for map generation. LiDAR can provide high-precision three-dimensional maps that are not limited by lighting and weather conditions, so it is widely used in BEV-based intelligent transportation scenarios. Machine learning algorithms can be trained on LiDAR data to identify and segment roads, vehicles, pedestrians, etc., allowing for more accurate and real-time map generation. This method overcomes some limitations of traditional methods while providing richer information and bringing new opportunities for the development of intelligent transportation systems.
2.2. BEV Maps Prediction
BEV map prediction is a methodology that employs bird’s-eye view maps to estimate the position and orientation of three-dimensional objects [
27]. This approach significantly enhances the perception capabilities of autonomous driving systems, contributing to improved safety and efficiency.
The fundamental principle behind BEV map prediction involves projecting three-dimensional objects onto a two-dimensional plane, simplifying the challenges associated with object detection and tracking [
28]. The process of BEV map prediction encompasses several key steps: First, acquiring raw data from sensors like lidar, cameras, radar, and more, and performing preprocessing tasks such as filtering, calibration, and registration. Next, the system extracts features like edges, corner points, colors, textures, and others [
29,
30] from the raw data. These features are then used for object detection, identifying the category, location, and size of the object. The results of object detection are subsequently employed for object tracking, facilitating the estimation of the motion state and posture of the object. Finally, the tracked object data are projected onto the BEV map, and further processing steps like fusion, filtering, and optimization are carried out.
BEV map prediction boasts several advantages, notably its ability to effectively reduce data volume and computational complexity. It enhances the precision and robustness of detection and tracking processes, while also improving the understanding and visualization of the scene. However, the primary challenge in BEV map prediction lies in the necessity to coordinate and fuse information from various sensors. Additionally, addressing issues like occlusion, overlap, and noise is critical for ensuring the accuracy of the predictions.
2.3. Attention-Powered Image Translating
Attention-powered image translation is a methodology that leverages the attention mechanism to facilitate the transformation of images across various domains. The attention mechanism initially found its roots in natural language processing (NLP) to address the alignment problem within sequence-to-sequence (seq2seq) models. The core concept behind the attention mechanism is enabling the model to concentrate on the most pertinent sections of the input data when generating output, thereby improving the performance and interpretability of the model.
As deep learning has advanced, the attention mechanism has entered computer vision (CV) to handle various image-to-image conversion tasks, including style transfer, image restoration, and image super-resolution. Attention-powered image translation, a framework for image-to-image translation, capitalizes on the attention mechanism. It can produce an output image that aligns with the input image while adopting the desired style based on its content and the style of the target domain. One of the critical advantages of attention-powered image translation is its ability to perform image conversion across multiple domains without requiring paired data, while retaining the structure and intricate details of the input image throughout the process.
In image translation, the attention mechanism helps the model emphasize essential areas within the input image, facilitating the generation of an output image that aligns with the target domain. When applied to tasks like target detection and semantic segmentation, the attention mechanism aids the model in extracting local and global image features and enhancing feature interaction.
Several articles have effectively harnessed the attention mechanism for image translation, target detection, and semantic segmentation. “Attention-Guided Image-to-Image Translation with Adversarial Learning” [
29]: This article introduces an image-to-image translation approach guided by attention, employing attention maps to direct the generator in generating an output image consistent with the target domain. Additionally, it uses a discriminator to supervise the attention map to enhance attention map quality and interpretability. “Attention-Aware Feature Pyramid Network for Object Detection” [
30]: This article proposes a feature pyramid network based on attention perception. Incorporating attention modules across various feature pyramid levels strengthens the information flow and fusion between features, consequently boosting target detection performance. “Attention-Guided Semantic Segmentation with Cross-Attention and Self-Attention” [
31]: This article outlines a semantic segmentation method guided by attention. It introduces a cross-attention module between the encoder and decoder to achieve alignment between the input image and the output segmentation map. Furthermore, it incorporates a self-attention module within the decoder to ensure internal consistency of the output segmented maps.
2.4. Small-Size Object Prediction in Computer Vision Tasks
Object detection of small targets is an important research direction in computer vision, which aims to identify small-sized objects from images or videos and give their locations and categories [
32]. This task is significant in many practical applications, such as medical image analysis, driverless driving, and security monitoring. However, target detection of small targets also faces many challenges, such as low resolution [
33], occlusion, background interference, and category imbalance. These factors lead to the performance of target detection of small targets being much lower than that of large targets [
34], especially in complex scenes. In order to solve these problems, researchers have proposed many methods in recent years, including improving feature extraction, enhancing feature fusion [
35], designing specialized loss functions, introducing attention mechanisms, and utilizing multi-scale information. However, these methods still cannot completely solve the difficulty of target detection of small targets because small targets themselves lack sufficient information and distinguishability. Therefore, target detection of small targets is still a direction worthy of further research.
Semantic segmentation is an essential task in computer vision, which aims to assign each pixel in an image to a category, thereby achieving a detailed understanding of the image content. Semantic segmentation of small objects is a challenging sub-problem of semantic segmentation [
36], which involves detecting and segmenting objects with small sizes, large numbers, and different shapes in images, such as crowds, cells, and particles. The research on semantic segmentation of small targets has important theoretical significance and practical value. It can be applied to medical image analysis, remote sensing image interpretation, intelligent monitoring, and other fields. However, semantic segmentation of small targets also faces many difficulties, mainly including the size of small targets being much smaller than the receptive field [
24], resulting in insufficient feature extraction and inaccurate classification; the distance between small targets is very close, and occlusion and confusion are prone to occur. It is challenging to distinguish boundaries; small targets have various shapes and need a unified expression, making it difficult to establish a practical model [
37]; and the number of small targets is enormous, which increases computational complexity and memory consumption and reduces efficiency.
There currently needs to be a perfect solution to these problems. Most existing methods are based on deep learning, using convolutional neural networks (CNN) to extract image features and combining different strategies [
38] to improve the detection and segmentation of small targets. For example, some methods capture targets of different sizes by designing multi-scale or pyramid-structured networks; some methods enhance the feature representation of small targets by introducing attention mechanisms or adaptive sampling; and some methods use conditional random fields (CRF) or generative adversarial networks (GAN) to optimize boundary details of small objects. However, these methods still have some limitations, such as sensitivity to hyperparameters, needing to be more robust to noise and illumination changes, and high demand for training data and computing resources. Therefore, semantic segmentation of small objects is still an open and exciting research direction worthy of further exploration and innovation.
3. Method
The input is N × M first-view observations sampled from a spatial location in a 3D environment, where N is different angles and M is different modalities (e.g., RGB images and depth images). The output is a top-down view semantic map, which is a map captured by a camera from a certain height from top to bottom, and each pixel is annotated with a semantic label. What we define is cross-view semantic segmentation, i.e., given the first-view observation as input, the algorithm must generate a semantic map from the top-down view. From semantic segmentation, the categories, locations, shapes and attributes of different objects in the environment, as well as the relationships between them, can be obtained. There are 14 semantic categories in this experiment, including roads, sidewalks, buildings, trees, cars, pedestrians, etc. At the same time, the relationship between the plane and the BEV is obtained through the perspective transformation module (VTM). The VTM transforms the feature map of the first perspective from the first perspective space to the top-down perspective feature space and fuses them into. A final feature map is then decoded by a decoder into a top-down semantic map.
3.1. Image Feature Translating
As shown in (1),
Y represents the formulation scenario,
represents the learning neural network model trained to resolve semantic and positional uncertainties, and I generates a semantic segmentation bird’s-eye view of
Y, a matrix
including the input image
. Next, we predict a set of binary variables
for each class, transformations between planes
and BEV surfaces
. A representation that only encodes semantics and depth is constructed in the image plane. We use an end-to-end method to perform semantic segmentation on BEV to achieve transformation from
to
. I represents the image in intelligent transportation. Mapping the image to the BEV surface requires a mapping to determine the relationship between the pixels and the BEV aurora. There is a one-to-one correspondence between each random vertical scan line and the relevant ray. As shown in the
Figure 2, the discretized static depth of the element on the vertical scan line of the image is at most r meters away from the camera. In the image sequence
,
H here represents the height of the column. Find the BEV ray
, and
d here represents the radial direction from the camera. Distance,
, represents radial elements.
This mapping can be viewed as the process of assigning the semantic objects in to their position slots on the BEV plane and on the ray. This includes learning the alignment between input scan lines and output polar rays via an attention mechanism.
Semantically segmented image columns and their corresponding polar BEV ground truths, the relationship between columns and ground truth rays mentioned here is hard aligned (explicit assignment of each pixel to a unique semantic category, i.e., each pixel can only belong to a class), i.e., each pixel in the ray corresponds to a single semantic class in the image column, so we have to resolve the only uncertainty: the depth of each pixel.
However, we must assign features that help solve semantics and depth, so the challenging alignment task is unsuitable now. Instead, we need soft alignment (soft alignment methods allow each pixel to be assigned to multiple semantic categories with a certain probability and, therefore, can produce richer segmentation results, reflecting the uncertainty of the segmentation results), where each of the polar rays pixels is assigned a combination of elements in the image column, a context vector.
Specifically, when generating radial elements, we use convex combinations of elements in image columns
(they are used in many aspects such as weights, sparse representations, mixture distributions, and optimization problems. By rationally using convex combinations, we can better establish and solve problems in deep learning models.) and the radial position
of elements
along polar rays.
, where
h represents the input sequence, and
H represents the height of the image column.
represents a position query encoding the relative position along a polar ray of length
e, where
c represents the context. Generate context
c based on input sequence
h generates context based on input sequence
h and query
y. The input sequence
h and query
y are projected through
and
to the corresponding representation of query
Q and key
K, as shown in (2) and (3):
Generate unstandardized alignment scores after projection
in (4).
Then, as shown in (5), we use Softmax to normalize the energy scalar to generate a probability distribution in memory:
The weighted sum of the final context k is computed using the context phase volume:
In this way, the generation context allows each radial groove to independently collect information from the image column and represents the initial assignment from the image to its BEV corresponding position group. This approach is similar to boosting pixels based on depth. However, it is promoted to a depth distribution and is therefore able to overcome the common pitfalls of sparsity and elongated object frustums. This means that the image context available to each radial slot is decoupled from its camera distance.
Finally, in order to generate BEV features, at radial position r performs a global operation on the specified context for all radial positions c = {}.
3.2. Encoder and Decoder
From a spatial location in the 3D environment, we first sample N first-view observations from N angles and M and modalities (N = 6, M = 2) at even angles to capture all-round information in intelligent transportation. N first view observations are encoded by M encoders respectively for M corresponding modalities. The first view observations are encoded by M encoders for M corresponding modalities. These CNN-based encoders extract N spatial feature maps for the first graph input, and then all these feature maps are fed into the view transformer module (VTM).
The view converter module converts these view features from the first view space to the top-down view feature space and fuses them to obtain a final feature map, which already contains sufficient spatial information. Finally, convolutional decoder alignment is used for decoding to predict top-down view semantic maps.
However, the encoder-decoder architecture has succeeded in classic semantic segmentation; our experiments show that it performs poorly in cross-view semantic segmentation tasks. This is because the receptive field of view of the output spatial feature map is roughly aligned with the input spatial feature map in standard semantic segmentation architectures.
However, in cross-view segmentation, each pixel painted in the top-down view should consider all input first-view feature maps, not just the local receptive field region. After considering the shortcomings of current semantic segmentation structures, we designed the View Transformer Module (VTM) to learn the dependencies of all spatial positions between the first view feature map and the top-down view feature map. VTM does not change the shape of the input feature map so that it can be plugged into any existing encoder-decoder-type network architecture for classical semantic segmentation. It consists of the View Relationship Module (VRM) and View Fusion Module (VFM). The central plot of
Figure 2 illustrates the entire process: the first view feature map is flattened while the channel dimensions remain unchanged. Then, we use the view relationship module R to learn the relationship between any two-pixel positions in the flattened first-view feature map and the flattened top-down view feature map.
where
m,
n ∈ [0,
HW) are the indices along the flat dimension of the top-down view feature map
t and the first view feature map
f, respectively,
models the relationship between the m-th pixel on the top-down view feature map and each pixel on the first-view feature map. Here, we simply use the multilayer perceptron (MLP) in the view relation module R. Afterwards, the top-down view feature map is reshaped back to H × W × C. Each first view input has its own VRM to obtain the top-down view feature map
based on its own observations.
We use VFM to fuse these top-down view feature maps to aggregate information from all observation inputs. View encoders and decoders. To balance efficiency and performance, we use ResNet-18 as the encoder. We remove the last Residual Block and Average Pool layers so that the resolution of the encoded feature map remains large, thus better preserving the details of the view. We adopt the pyramid pooling module used in [
39] as the decoder. Regarding the view transformer module, for each view relationship module, we simply use a two-layer MLP. We chose this because a two-layer MLP does not bring much extra computation, so we can make our model follow the principle of being lightweight and efficient. The input and output dimensions of VRM are both HIWI, where HI and WI are the height and width of the intermediate feature map, respectively. As for the view fusion module, we simply sum all features to keep the shape consistent.
Simulation to reality. For generator G, we use the architecture of a 4-view VPN. We adopt the same architecture as in [
40] for discriminator D. It has five convolutional layers, each followed by a leaky ReLU with a parameter of 0.2 (except the last layer). We extract semantic masks from real-world images using HRNet [
41] pre-trained on the nuScenes [
42] dataset.
3.3. Loss Design
Since the training signal provided to the predicted occupancy grid must resolve semantic and positional uncertainties, we use the same multi-scale Dice loss. The average dice loss for
K classes at each scale
u is:
where
is the ground truth binary variable grid cell, and
is the predicted sigmoid output of the network and is a constant used to prevent division by zero.
During the training phase, we forward a set of input images from the source target domain {} to and optimize them with the commonly used segmentation loss .
Then, we use
to extract the feature map of the image after passing through the Softmax layer from {
} and
also uses the discriminator to distinguish whether
comes from the source domain. The loss function for optimizing
can be expressed as shown in (9):
where
is the cross-entropy loss of semantic segmentation, and
is designed to train
and interfere with the discriminator
D. The loss function of the discriminator
is the cross-entropy loss of the binary source.
4. Experiments and Discussion
4.1. Experimental Settings and Dataset
We use the NuScenes dataset to evaluate the effectiveness of treating image-to-BEV conversion as a translation problem. The dataset contains 1000 20 s video clips shot in Boston and Singapore, annotated with 3D bounding boxes and vectorized road maps. Each data sample in NuScenes contains first-view RGB images taken from six directions (front, front right, back right, back, back left, front left), as well as different modalities. We selected 919 data samples without top-view masks for unsupervised training and 515 data samples with binary top-view masks for evaluation. We conducted ablation experiments on the lookback direction, the role of long-distance horizontal context, and the influence of polar position information in monotonic attention. For the generator , we use the architecture of 4-view VPN. It has five convolutional layers, and each convolutional layer except the last layer is followed by a leaky ReLU with a parameter of 0.2.
Research in intelligent transportation has been pursuing more accurate vehicle, pedestrian, and road perception to improve the performance and safety of autonomous driving systems. This article relies on multiple sensors onboard the vehicle, including six ring-shaped RGB cameras. These cameras are mounted around the vehicle, providing an all-round view. Specifically, these cameras can capture images around the road in real time, forming a complete ring view to help vehicle systems perceive their surroundings. In order to better understand and utilize these image data, metrics like “IOU” (Intersection over Union) are often used to evaluate the performance of this BEV map generation algorithm. IOU is a metric used to measure the degree of overlap between an algorithm-generated map and a real map. In this case, IOU can measure the overlap between objects (such as vehicles and pedestrians) in the algorithm-generated BEV map and objects in the real world. A higher IOU value means that the map generated by the algorithm is closer and more accurate to the real situation. Therefore, the goal of this research is to develop a high-quality BEV map generation algorithm by utilizing the six ring-shaped RGB cameras on the vehicle to perceive the main view of the road surface in real time and use evaluation indicators such as IOU to measure its performance, thereby improving the performance of the autonomous driving system and environmental awareness and path planning capabilities. These works are significant to achieve safer and more efficient intelligent transportation systems.
The positioning accuracy can be measured by the overlap between the generated map and the real map, the intersection-over-union (IOU) ratio.
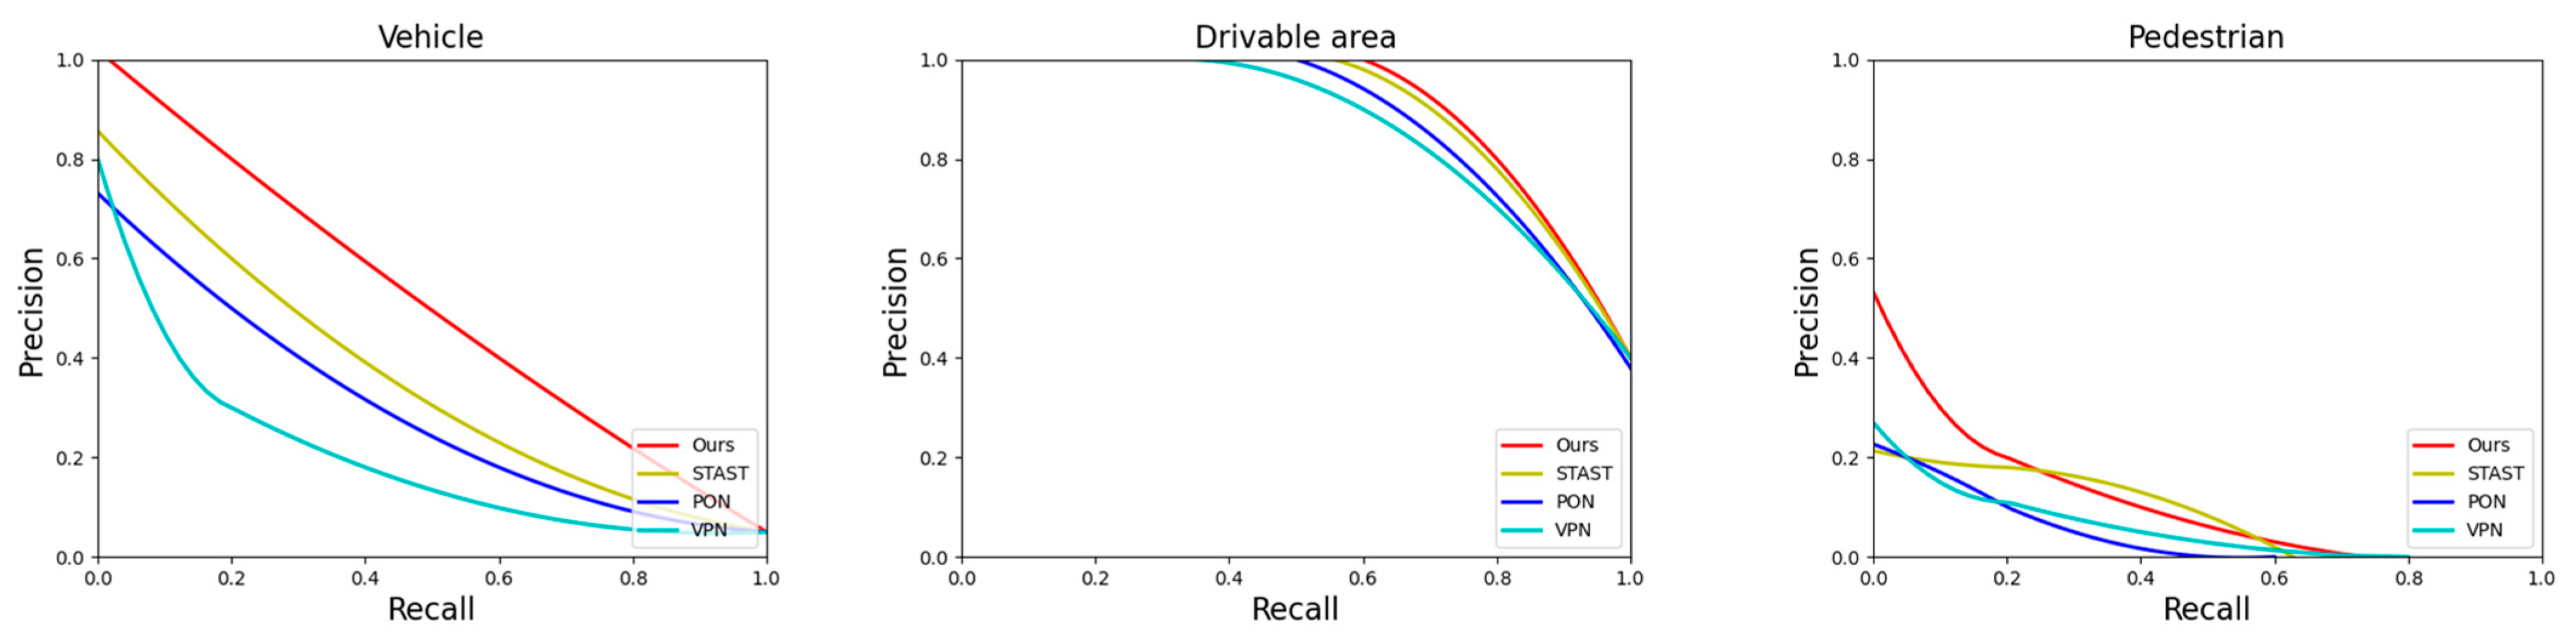
The P–R curve is a two-dimensional curve with precision and recall as the vertical and horizontal axis coordinates. The more convex and to the upper right, the better the effect. The overall trend is drawn by selecting the corresponding precision and recall rates at different thresholds. The higher the precision, the lower the recall. When the recall reaches 1, it corresponds to the positive sample with the lowest probability score. At this time, the number of positive samples is divided by all those greater than or equal to the threshold. The number of samples is the lowest precision value. The area enclosed by the P–R curve is the AP value. The larger the area, the higher the recognition accuracy. The higher the AP value, and vice versa.
In target detection, each category can draw a P–R curve based on recall and precision. AP is the area under the curve, and mAP is the average AP of all categories.
4.2. Comparison Results and Discussion
In this paper, we evaluate the performance of different semantic segmentation models in urban scenarios. We used three metrics: drivable (accuracy in drivable areas), car (accuracy in cars), and ped (accuracy in pedestrians). We compare four existing models: VPN, PON, STA-ST, and TIIM-ST, as well as our proposed new model. Our model outperforms other models on all metrics, indicating that our model is better able to capture detailed and semantic information in urban scenes.
Specifically, as shown in
Table 1, our model achieves 78.2% on drivable, which is 3.7% higher than the best existing model TIIM-ST; 40% on car, which is 0.3% higher than TIIM-ST; and on ped, it reached 10.2%, 0.7% higher than TIIM-ST. These results illustrate that our model has strong robustness and generalization ability when dealing with complex and diverse urban scenes. At the same time,
Figure 3 can more intuitively show the superiority of our proposed method for small target prediction compared with existing methods.
4.3. Qualitative Results and Discussion
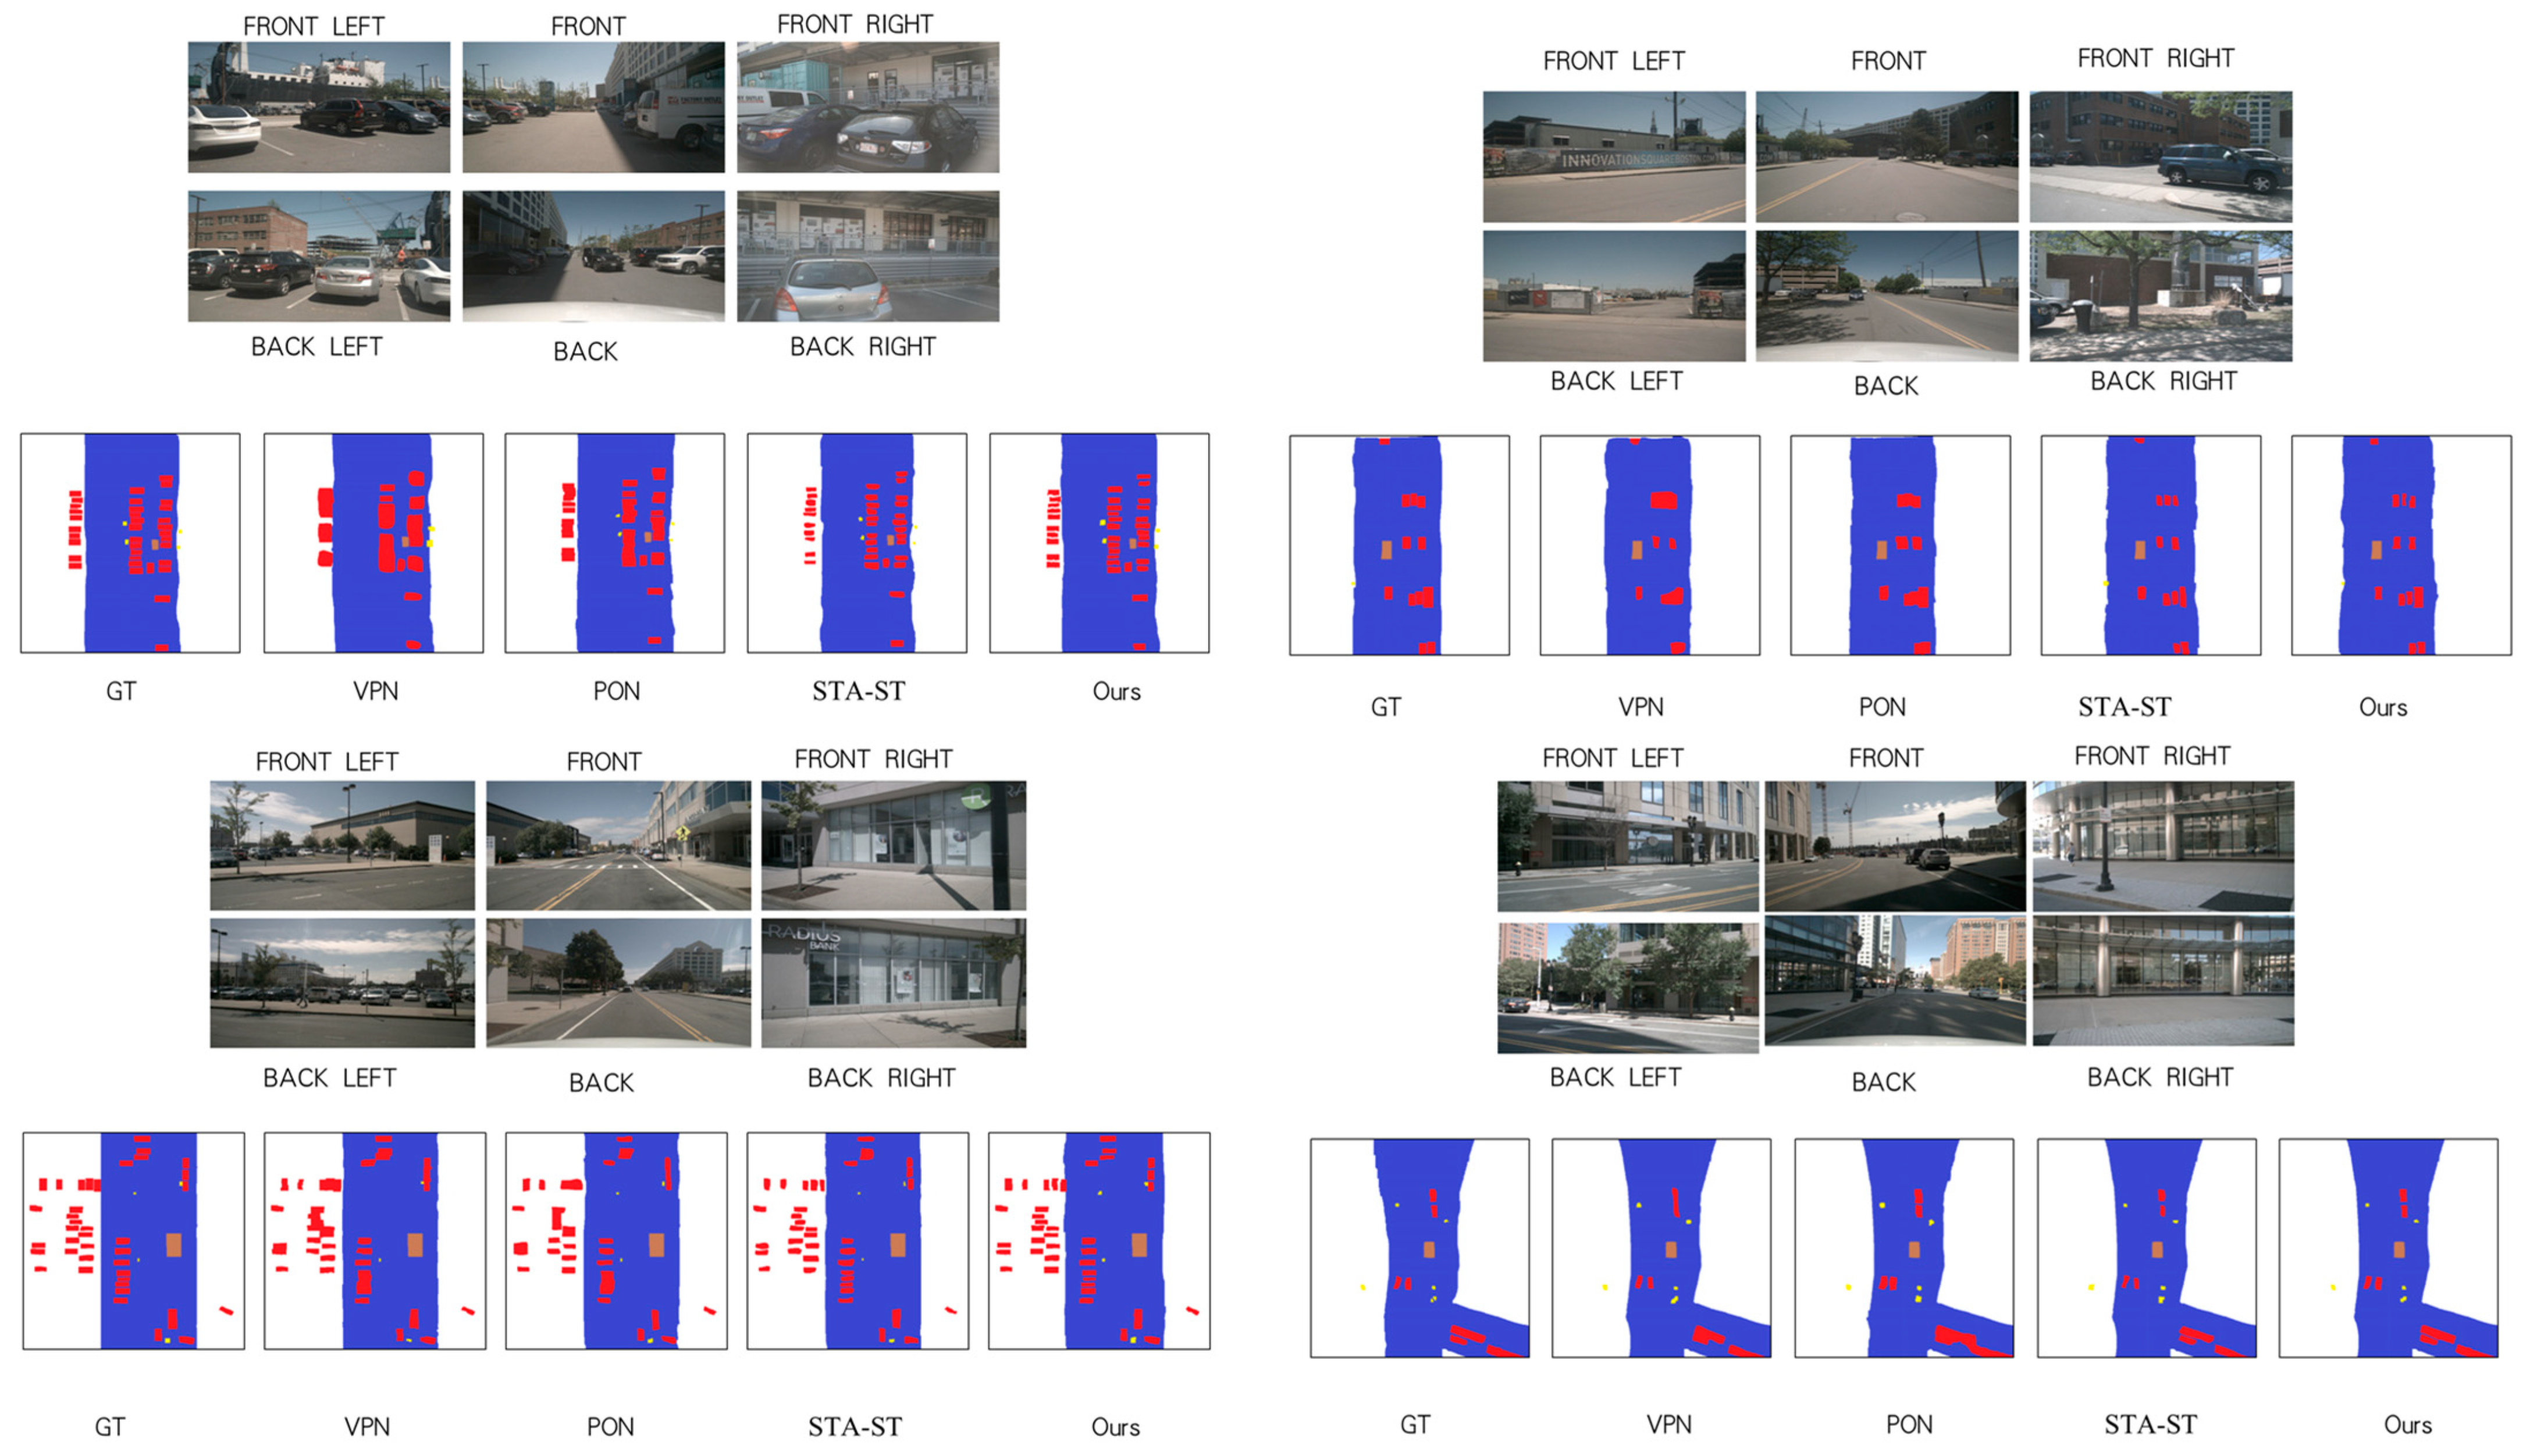
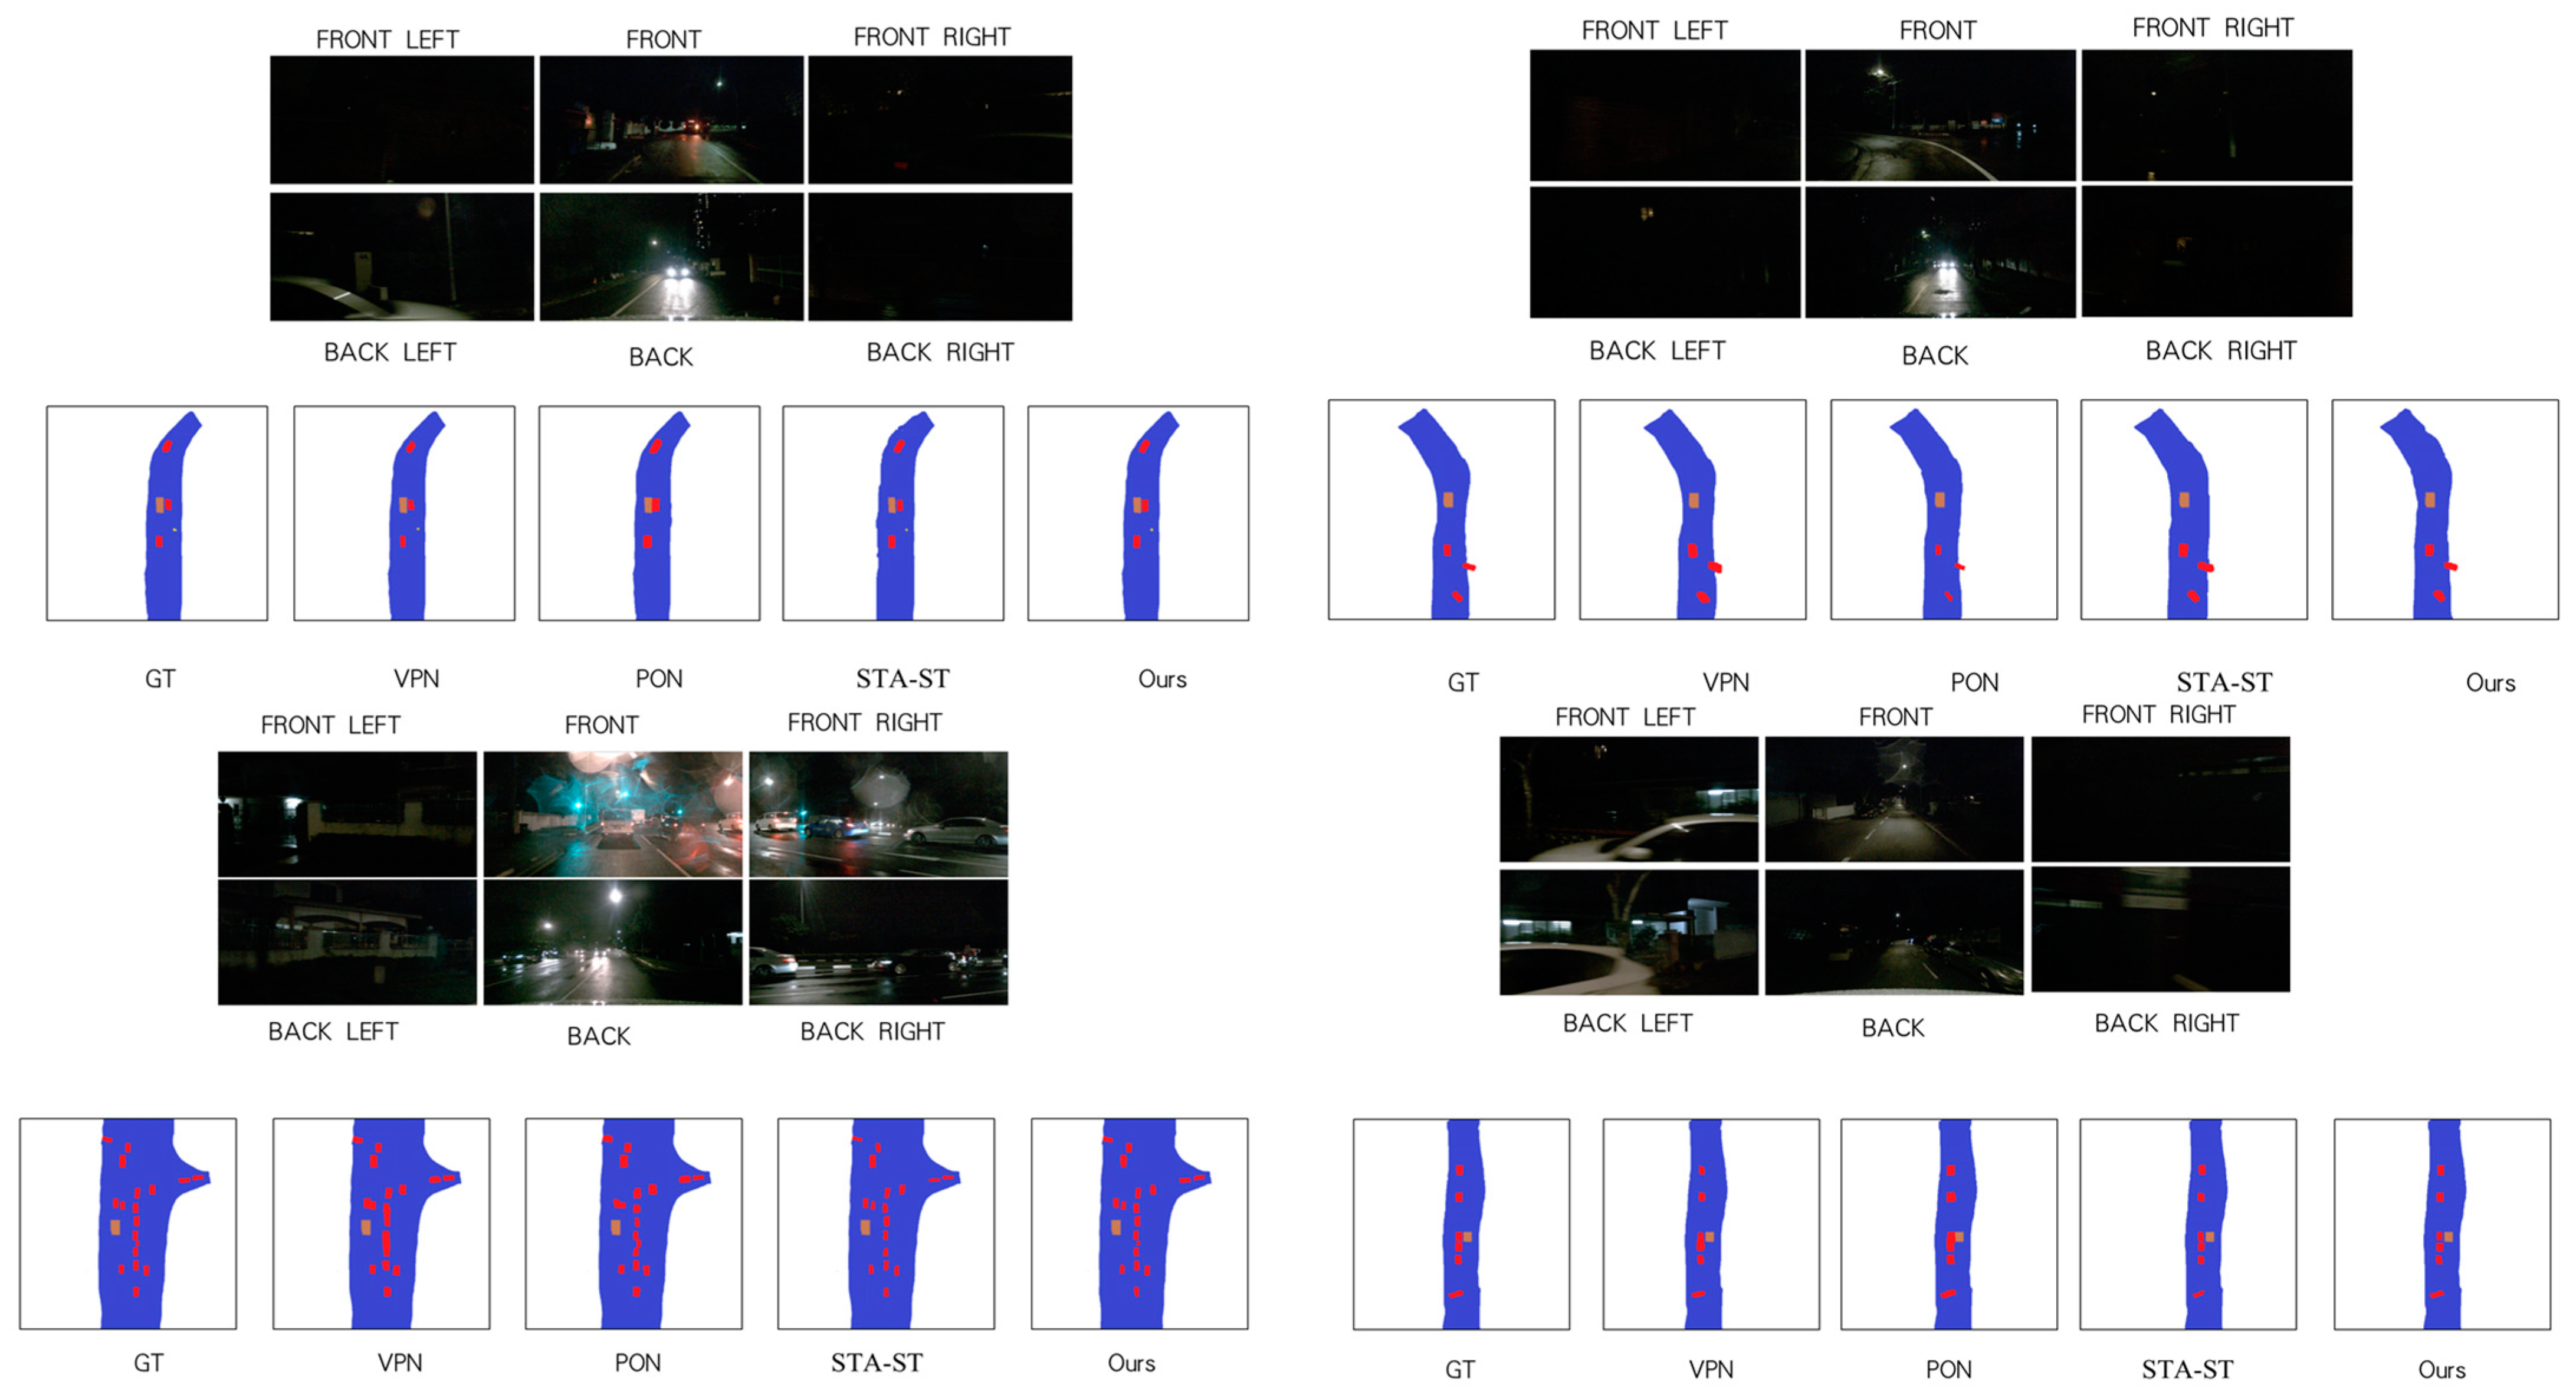
As can be seen in
Figure 4 and
Figure 5, from the day and night effect display pictures, our model can generate clear and realistic scene images under different lighting conditions. Our model can also mark the positions and trajectories of vehicles and pedestrians in images, as well as information such as roads and lane lines, to provide drivers with more visual references. In contrast, other models generated images that were either too blurry or had obvious distortion or artifacts that did not reflect the real scene well. Our method can adapt to different sensor configurations and data sources, such as lidar, cameras, radar, etc. Our method does not rely on specific sensor types or data formats but utilizes multi-modal data fusion technology to effectively integrate and represent data collected by different sensors. This enables our method to be tested on the NuScenes dataset and has good generalization ability and robustness.
Our method can handle complex traffic scenarios and multi-objective interaction problems, such as avoidance, overtaking, lane changing, etc., between vehicles. Our method not only considers the motion status and target of a single vehicle, but also considers the influence and feedback of surrounding vehicles and pedestrians. Our method uses a model based on attention mechanism and graph neural network to capture the relationships and dependencies between different targets and generate more accurate and safer trajectory predictions based on this information.
4.4. Discussion
Our paper makes significant contributions in the following key areas:
We introduce a comprehensive framework featuring a View Parsing Network, which incorporates three essential modules: the generation of BEV graphs from images, the construction of constrained and data-efficient transformer networks based on physical principles, and the integration of formulas with monotonic attention inspired by the language domain. This framework excels in the accurate prediction of small objects at a distance and proves highly beneficial for tasks like vehicle and pedestrian detection, as well as traffic flow monitoring within intelligent transportation scenarios.
Leveraging the principles of physics, we develop an innovative transformer network that exhibits convolutional characteristics concerning the horizontal x-axis, all while maintaining exceptional spatial awareness. We seamlessly fuse our model with the monotonic attention mechanism, drawn from the domain of natural language processing. This combination facilitates more precise mapping by emphasizing information situated below a specific point in the image. The synergistic effect of these components yields optimal performance, substantially enhancing the capabilities of our model.
Our post-experimental results demonstrate our proficiency in generating BEV graphs from images represented as a set of 1D sequence-to-sequence transformations. We elucidate how axial attention significantly boosts performance by introducing temporal awareness and showcasing state-of-the-art results across an extensive dataset, the NuScenes dataset. Additionally, we apply domain adaptation techniques to enable the transfer of our model into real-world data without necessitating any supplementary annotations. Overall, our experiments underscore the superior performance of our model, particularly in the prediction of small objects.
4.5. Ablation Study
In this section, as shown in
Table 2, we use ablation study to evaluate the effectiveness and robustness of our proposed BEV (Bird’s Eye View) method for intelligent transportation applications. We compare our method with four other methods, namely: 1 (looking up): this method uses a simple perspective transformation to transform the image from front view to top view, and then uses a pre-trained CNN to perform semantic segmentation and object detection; 2 (looking both ways): this method uses a bi-directional perspective transformation to transform the image from front view and side view to top view, and then uses a pre-trained CNN to perform semantic segmentation and object detection; 3 (BEV-plane): this method uses a plane-based BEV generation method to transform the image from front view to top view, and then uses a pre-trained CNN to perform semantic segmentation and object detection; 4 (both-planes): this method uses a plane-and-curve-based BEV generation method to transform the image from front view and side view to top view, and then uses a pre-trained CNN to perform semantic segmentation and object detection.
We use three metrics to evaluate the performance of different methods, namely the accuracy of drivable area (Drivable), car (Car), and pedestrian (Ped). From the table, we can see that our method achieves the highest accuracy for all three metrics, which are 78.2%, 40%, and 10.2%, respectively, while the other four methods have average accuracies of 73.5%, 35.2%, and 8.3%, respectively. These results show that our method can effectively utilize multimodal information, including image, radar, and laser, to generate high-resolution BEV images, and use deep neural networks to perform semantic segmentation and object detection. Our method can also adapt to different weather and lighting conditions, as well as different road types and structures. Our method has strong advantages and robustness for applying BEV in intelligent transportation systems.
4.6. Multiple-Object Prediction
Multiple-object prediction is the task of predicting the locations and categories of multiple objects in a scene, such as cars, pedestrians, bikes, etc. This task is important for intelligent transportation systems, as it can help to monitor and manage the traffic flow and safety. Based on the results shown in the table, we can see that our method outperforms the other four methods in this task. As shown in
Table 3, our method achieves the highest mean accuracy of 25.8%, while the other four methods have mean accuracies of 17.4%, 19.1%, 23.7%, and 25.7%, respectively. Our method also achieves the highest or second-highest accuracy for most of the object categories, such as drivable, crossing, walkway, carpark, car, bus, etc. These results demonstrate that our method can effectively detect and classify multiple objects in various scenes and conditions, using a novel bird’s eye view (BEV) representation.
4.7. Dynamic and Static Timing Prediction
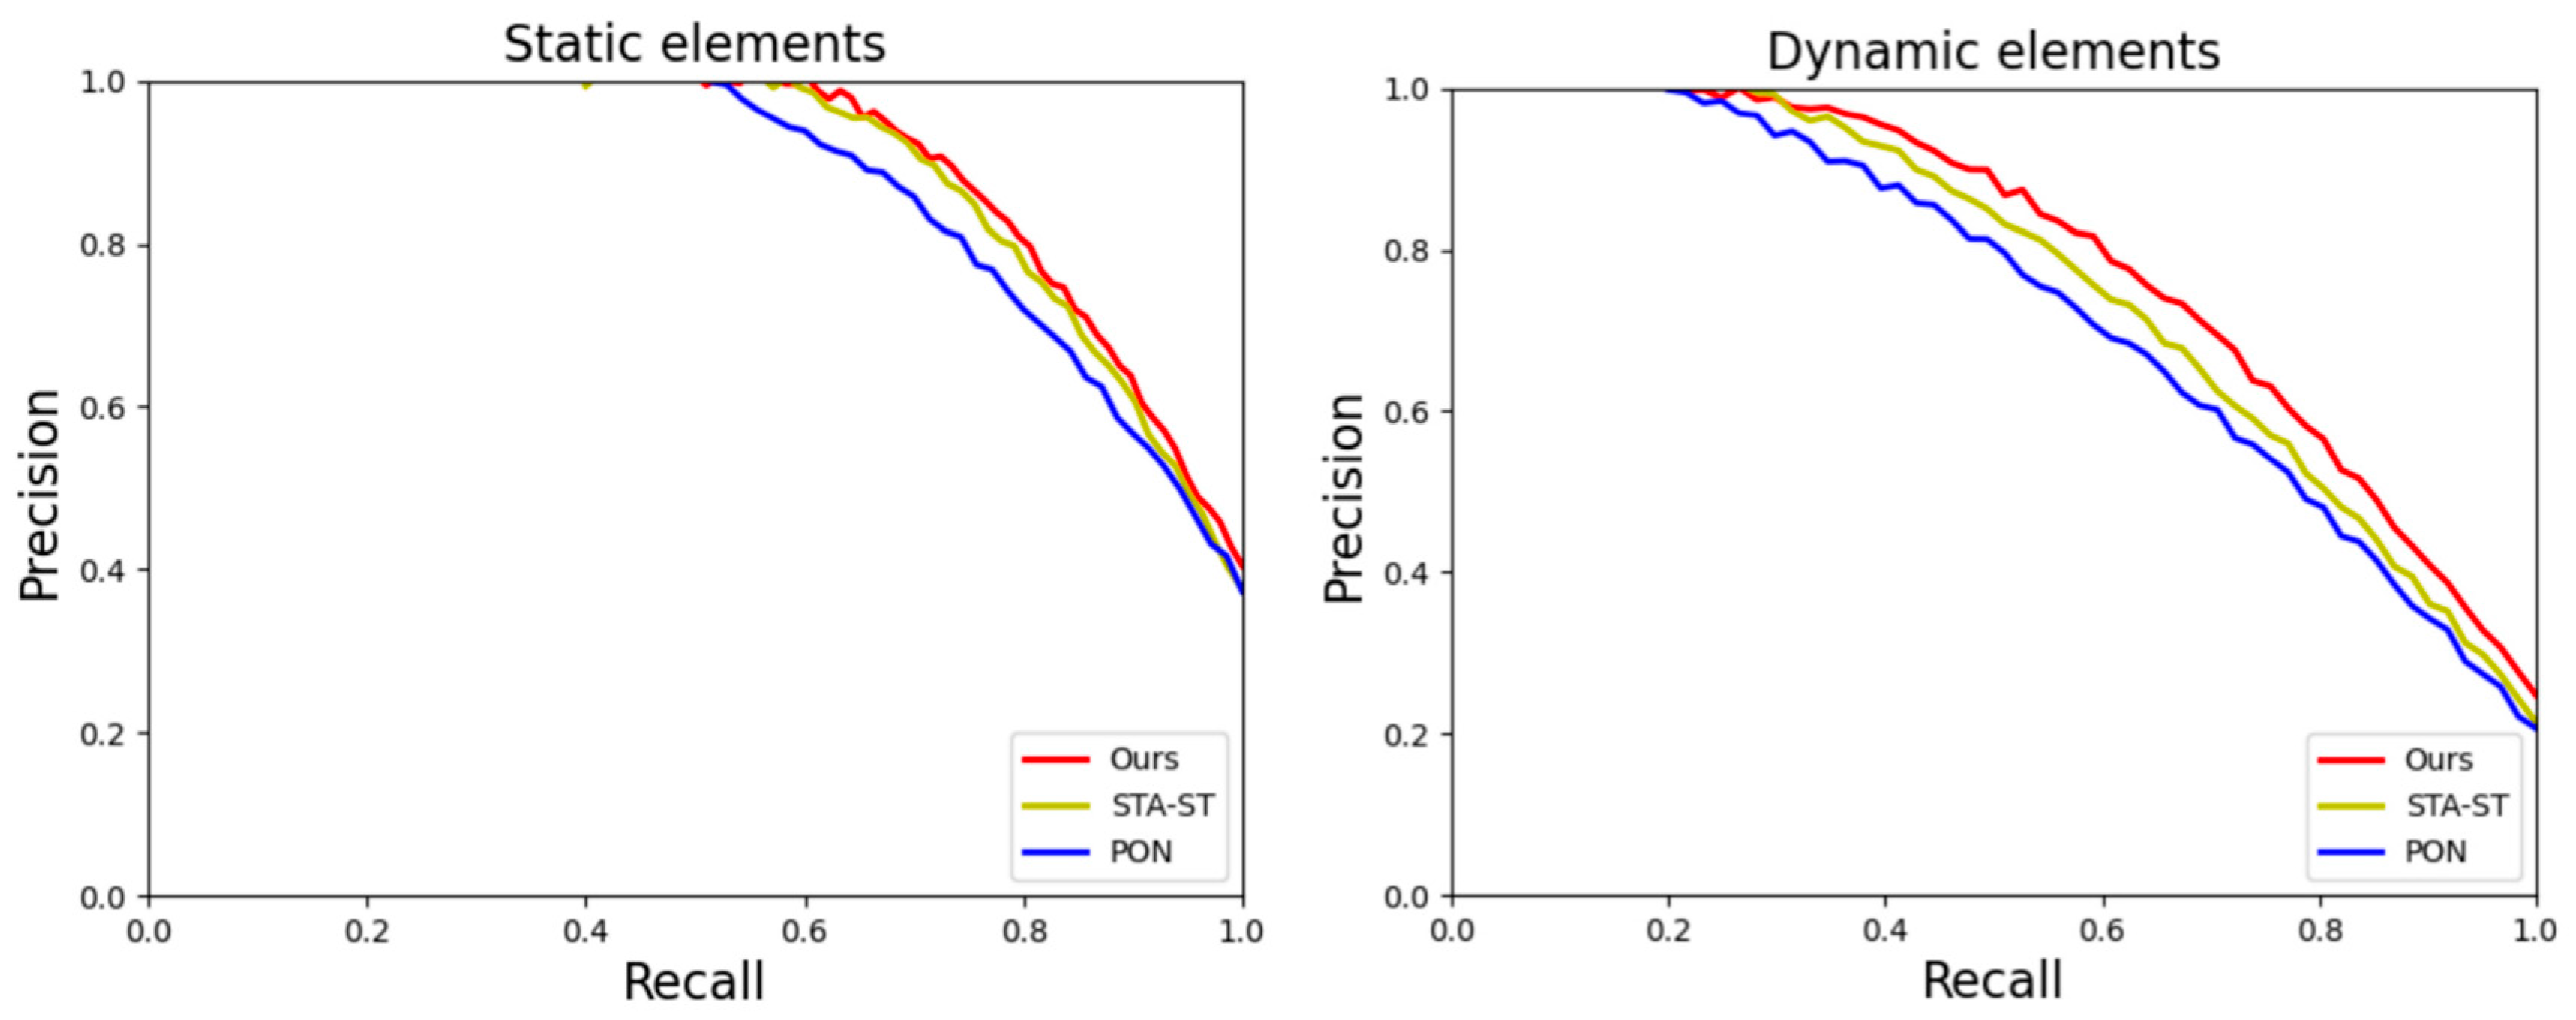
As shown in
Figure 6, the PR graphs for static (Drivable) and dynamic elements (vehicle, Pedestrian, Large vehicle, Bicycle, Bus, Trailer, Motorcycle), which are obtained by adjusting different confidence thresholds, and different points on the coordinate system represent different recall and precision.
The P–R curve is an important tool for evaluating the performance of a model, and by finding a balance between recall and precision, a more comprehensive understanding of the model’s performance can be obtained. In the context of intelligent transportation, we are particularly interested in dynamic temporal prediction, the ability to accurately predict targets in motion in a traffic scenario. For a given recall, a higher detection accuracy means that the model is more accurate to the target while maintaining a high recall. In this experimental comparative analysis, we can clearly observe the performance of our method on the P–R curve. Our method is not only able to achieve a high recall, but also achieves superior detection accuracy at the corresponding recall. This suggests that our algorithm represents a better result for a given recall setting in terms of dynamic timing prediction.
As shown in the figure, this result is crucial for practical applications of ITS. Highly accurate dynamic timing prediction means that the motion trajectories of vehicles, pedestrians, bicycles, and other targets can be more accurately captured and predicted by the model, thus improving the overall safety and efficiency of transportation systems. Through comparative analysis, we are able to better understand the performance of different algorithms on the dynamic timing prediction task, which provides a strong support for the technological advancement in the field of intelligent transportation.
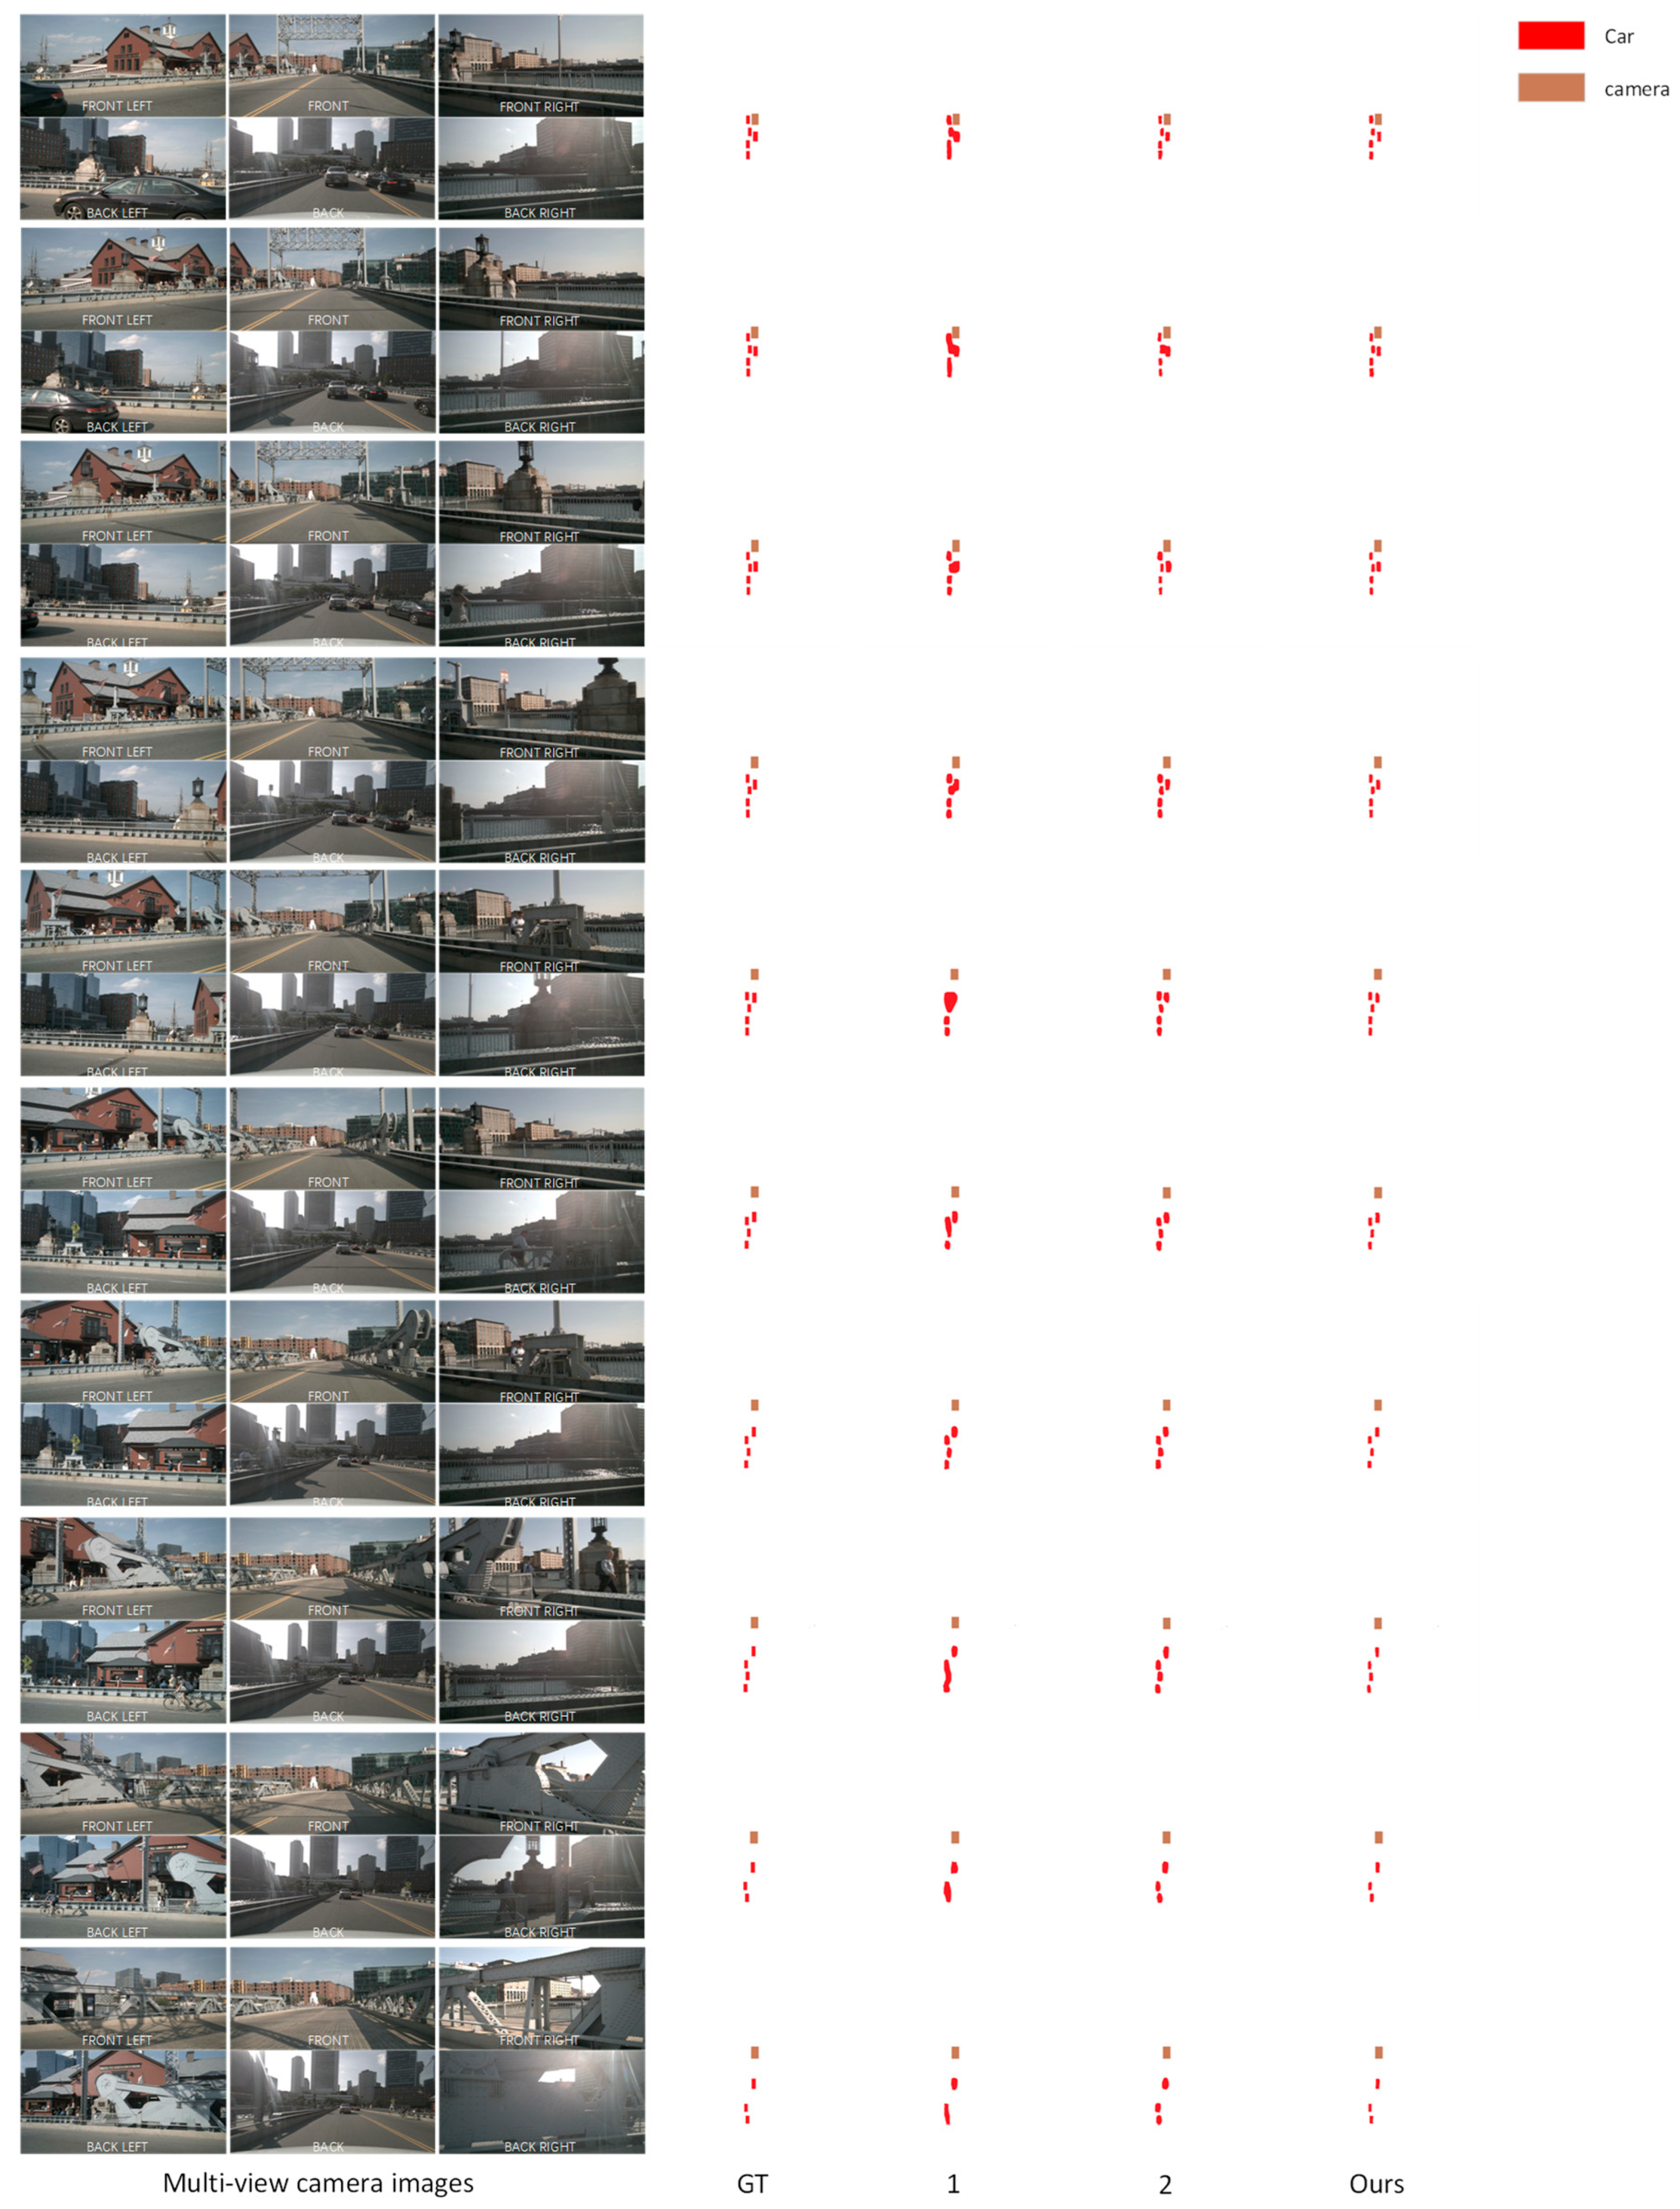
In BEV (Bird’s Eye View)-based intelligent transportation systems, continuous time prediction of automotive elements in the scene is a key task. This prediction involves not only the position and speed of the target car, but also an accurate estimation of its shape, size and orientation. With the NuScenes dataset, we are able to validate and demonstrate our prediction models in a real traffic environment. As shown in
Figure 7, we demonstrate a visual comparison of different models predicting car elements on 10 consecutive keyframes in the NuScenes dataset. This comparison clearly shows the effectiveness and limitations of different models in dealing with complex traffic scenarios. By integrating data from multiple viewpoints, our network is able to more accurately capture the dynamics of cars, including their trajectories and behavioral patterns.
In addition, our model makes it possible to take into account historical data and future trends when predicting the dynamics of automotive elements. In ITS applications, this approach not only improves prediction accuracy, but also generates smoother and more coherent motion trajectories, which are critical for understanding complex traffic situations and making accurate driving decisions. Accurate prediction not only improves the safety of self-driving vehicles, but also optimizes traffic flow, reduces congestion, and improves the efficiency of the entire transportation system. In conclusion, our approach provides strong technical support for efficient and safe traffic management in BEV-based intelligent transportation systems.
5. Conclusions
In our research, we propose an innovative Transformer network application designed to map images and video sequences into a bird’s-eye map or top view of the environment, which is significant to intelligent transportation. Our approach adopts mathematical formulations of physical constraints, validates these formulations through resection studies, and combines recent advances in monotonic attention to confirm our intuition about which contextual information of points is more important in this map generation process. Experimentally, we demonstrate that our novel approach achieves state-of-the-art performance in instantly mapping a widely recognized dataset. This technology can be used in autonomous vehicles in intelligent transportation to help them better understand the road and environment around them.
Furthermore, we propose the concept of a cross-view semantic segmentation task to enhance environment awareness, which has substantial application prospects in the context of intelligent transportation. We introduce a neural architecture called View Parsing Network (VPN) to solve this task. Through experimental results, we demonstrate that VPN can be applied to mobile robots to enhance their perception of the surrounding environment by providing a lightweight and efficient top-down perspective semantic map. In many cases, object height information is unnecessary, so VPNs are lighter and more efficient than traditional 3D-based methods, which are more expensive in terms of data storage and computing requirements. This research provides more efficient and cost-effective solutions for intelligent transportation systems and helps improve environmental understanding and map generation, especially in autonomous vehicle technology.
To provide a basis for further work, we also plan to explore how to extend our approach to other scenes and transitions between viewpoints. Furthermore, we would like to investigate how to exploit multimodal information, such as sound or radar signals, to improve the quality and robustness of map generation and semantic segmentation. Finally, we would also like to explore how our approach can be combined with reinforcement learning or planning algorithms to realize more intelligent and adaptive mobile robot behavior in intelligent traffic scenarios.
The innovative prospects of applying Transformer networks in intelligent transportation systems offer great promise for shaping the future of autonomous vehicles and environmental perception. Integrating our proposed mapping and segmentation techniques into actual autonomous vehicle systems. This could lead to safer and more reliable transportation, as vehicles equipped with our technology will have a greater ability to interpret and adapt to complex environments. Furthermore, our approach can potentially be integrated into smart city infrastructure, helping to develop more efficient and adaptive traffic management systems. Future research can focus on extending the scope of our proposed cross-view semantic segmentation task to a wider range of environmental elements. This could include identifying dynamic objects such as pedestrians, cyclists, and other vehicles, thereby improving the overall situational awareness of autonomous systems. By solving real-world challenges and continually refining our approach based on feedback from field deployments, we ensure our technology meets the evolving needs of intelligent transportation systems. Overall, our research not only proposes cutting-edge technologies in the field of smart transportation, but also lays the foundation for a future in which advanced mapping and sensing systems play a key role in creating safer, more efficient, and greener transportation ecosystems.


