Article

A Dynamic Emotional Propagation Model over Time for Competitive Environments

1
College of Computer and Data Science, Fuzhou University, Fuzhou 350108, China
2
Fujian Provincial Key Laboratory of Networking Computing and Intelligent Information Processing, Fuzhou University, Fuzhou 350108, China
3
Digital Fujian Institute of Financial Big Data, Fuzhou University, Fuzhou 350108, China
4
Institute of Computing Technology, Chinese Academy of Sciences, Beijing 100190, China
5
Research Center for Cyberspace Security, Peng Cheng Laboratory, Shenzhen 518000, China
*
Author to whom correspondence should be addressed.
Electronics 2023, 12(24), 4937; https://doi.org/10.3390/electronics12244937
Submission received: 6 November 2023 / Revised: 28 November 2023 / Accepted: 6 December 2023 / Published: 8 December 2023
(This article belongs to the Special Issue New Advances in Affective Computing)

Abstract

:
Emotional propagation research aims to discover and show the laws of opinion evolution in social networks. The short-term observation of the emotional propagation process for a predetermined time window ignores situations in which users with different emotions compete over a long diffusion time. To that end, we propose a dynamic emotional propagation model based on an independent cascade. The proposed model is inspired by the interpretable factors of the reinforced Poisson process, portraying the “rich-get-richer” phenomenon within a social network. Specifically, we introduce a time-decay mechanism to illustrate the change in influence over time. Meanwhile, we propose an emotion-exciting mechanism allowing prior users to affect the emotions of subsequent users. Finally, we conduct experiments on an artificial network and two real-world datasets—Wiki, with 7194 nodes, and Bitcoin-OTC, with 5881 nodes—to verify the effectiveness of our proposed model. The proposed method improved the F1-score by 3.5% and decreased the MAPE by 0.059 on the Wiki dataset. And the F1-score improved by 0.4% and the MAPE decreased by 0.013 on the Bitcoin-OTC dataset. In addition, the experimental results indicate a phenomenon of emotions in social networks tending to converge under the influence of opinion leaders after a long enough time.

Graphical Abstract

1. Introduction

1.1. Background and Motivation

With the advancement of the Internet and communication technologies, social media online platforms have emerged as a fundamental means for people to obtain information. The propagation of emotions among individuals can be described as a replicative process and is termed “contagion” [1]. Emotional contagion in psychology means humans’ tendency to automatically mimic and synchronize behaviors with each other and thus converge emotionally [2]. Emotional propagation models aim to study how an individual affects the opinions or behaviors of others. Bharathi et al. [3] pointed out that opinion leaders who can lead large-scale emotional propagation are essential for a company’s advancement. To choose a more influential opinion leader, they suggested a competitive environment to expand the influence maximization problem. A competitive environment means that numerous companies offering alternative products will compete for customers. Modeling the process of emotional propagation in a competitive environment significantly contributes to understanding the law of opinion evolution and assisting decision making on social media, such as viral marketing [4], information cascade prediction [5], and recommendations [6].
Information diffusion models have attracted lots of attention as the foundation for emotional propagation. Early non-graph models tried to construct a framework similar to infectious disease models like susceptible–infective–removed (SIR) [7] to describe the information diffusion process. However, they ignore some essential differences, such as specific features and diffusion mechanisms [8]. Thus, graph models such as Linear Threshold (LT) [9] and Independent Cascade (IC) [10] are proposed for exploring the factors that influence propagation probability based on social network structures. In addition, stochastic processes are applied to model the time effect in information diffusion, such as the reinforced Poisson process [11] and the Hawkes process [12]. These approaches have explored the factors influencing information diffusion from several angles, including user states, network structures, and temporal features.
Some academics conducted additional research on emotional propagation based on information diffusion. Dong et al. [13] summarized the existing works in two categories: discrete opinion models and continuous opinion models. The traditional discrete opinion models [14,15,16] usually regarded individual emotions as binary. Then, more fine-grained emotions [17], such as happiness, anger, and sadness, are introduced to accommodate the richness of opinions in social networks. The continuous opinion models [18,19] expanded individual opinions into a range of real numbers from 0 to 1, displaying various intensities of emotion. This continuous opinion model gives each user a unique emotion and allows a direct representation of the process of emotional change.
To summarize, SIR and its variant models such as spreader–ignorant–stifler (SIS) [20] present better interpretability of the social diffusion phenomenon through different user states; IC and LT models are more suitable for dealing with downstream applications such as influence maximization [21]. The existing emotional propagation method based on the independent cascade [22] calculates emotion changes within a predetermined time window. However, as an event gets hotter and lasts longer, people’s attention will fluctuate [23]. In other words, people will update their emotions in a competitive environment over time. Therefore, the static assumption—each active node has only one chance to infect others during one diffusion process in the independent cascade model—cannot satisfy such a phenomenon. It makes emotional evolution move in a single direction, incompatible with the competitive evolution among different emotions under objective laws. Thus, dynamic emotional evolution analysis subject to time change is necessary and is shown in Figure 1.

1.2. Objectives and Contributions

This paper focuses on the problem: how users with different emotions affect one another within a competitive environment. Then, we propose two detailed research objectives to complete an explainable emotional propagation model.
  • To study how to build an appropriate emotional propagation rule in a competitive environment with the ability to capture the influence of opinion leaders.
  • To study how individuals’ emotions evolve over time.
To solve this problem, we propose a Dynamic Emotional Propagation model based on Independent Cascade (DepIC). We regard each emotion as a different piece of information to expand the activation mechanism of the IC model. Users who are activated may change their emotions in our proposed model instead of only inactive users being affected. Then, we construct an emotional propagation algorithm inspired by the three interpretable factors of attractiveness, time-decay effect, and exciting mechanism in the reinforced Poisson process. The algorithm shows a sustained influence of opinion leaders on emotional propagation. Finally, we introduce three time-decay functions to describe the time effect in the social network.
In general, the technical contribution of our paper can be summarized as follows:
  • Instead of the predetermined partial time snippet, the proposed method models a continuous emotional propagation process over a complete event with a time-decay effect.
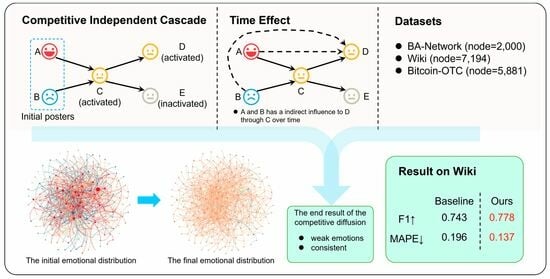
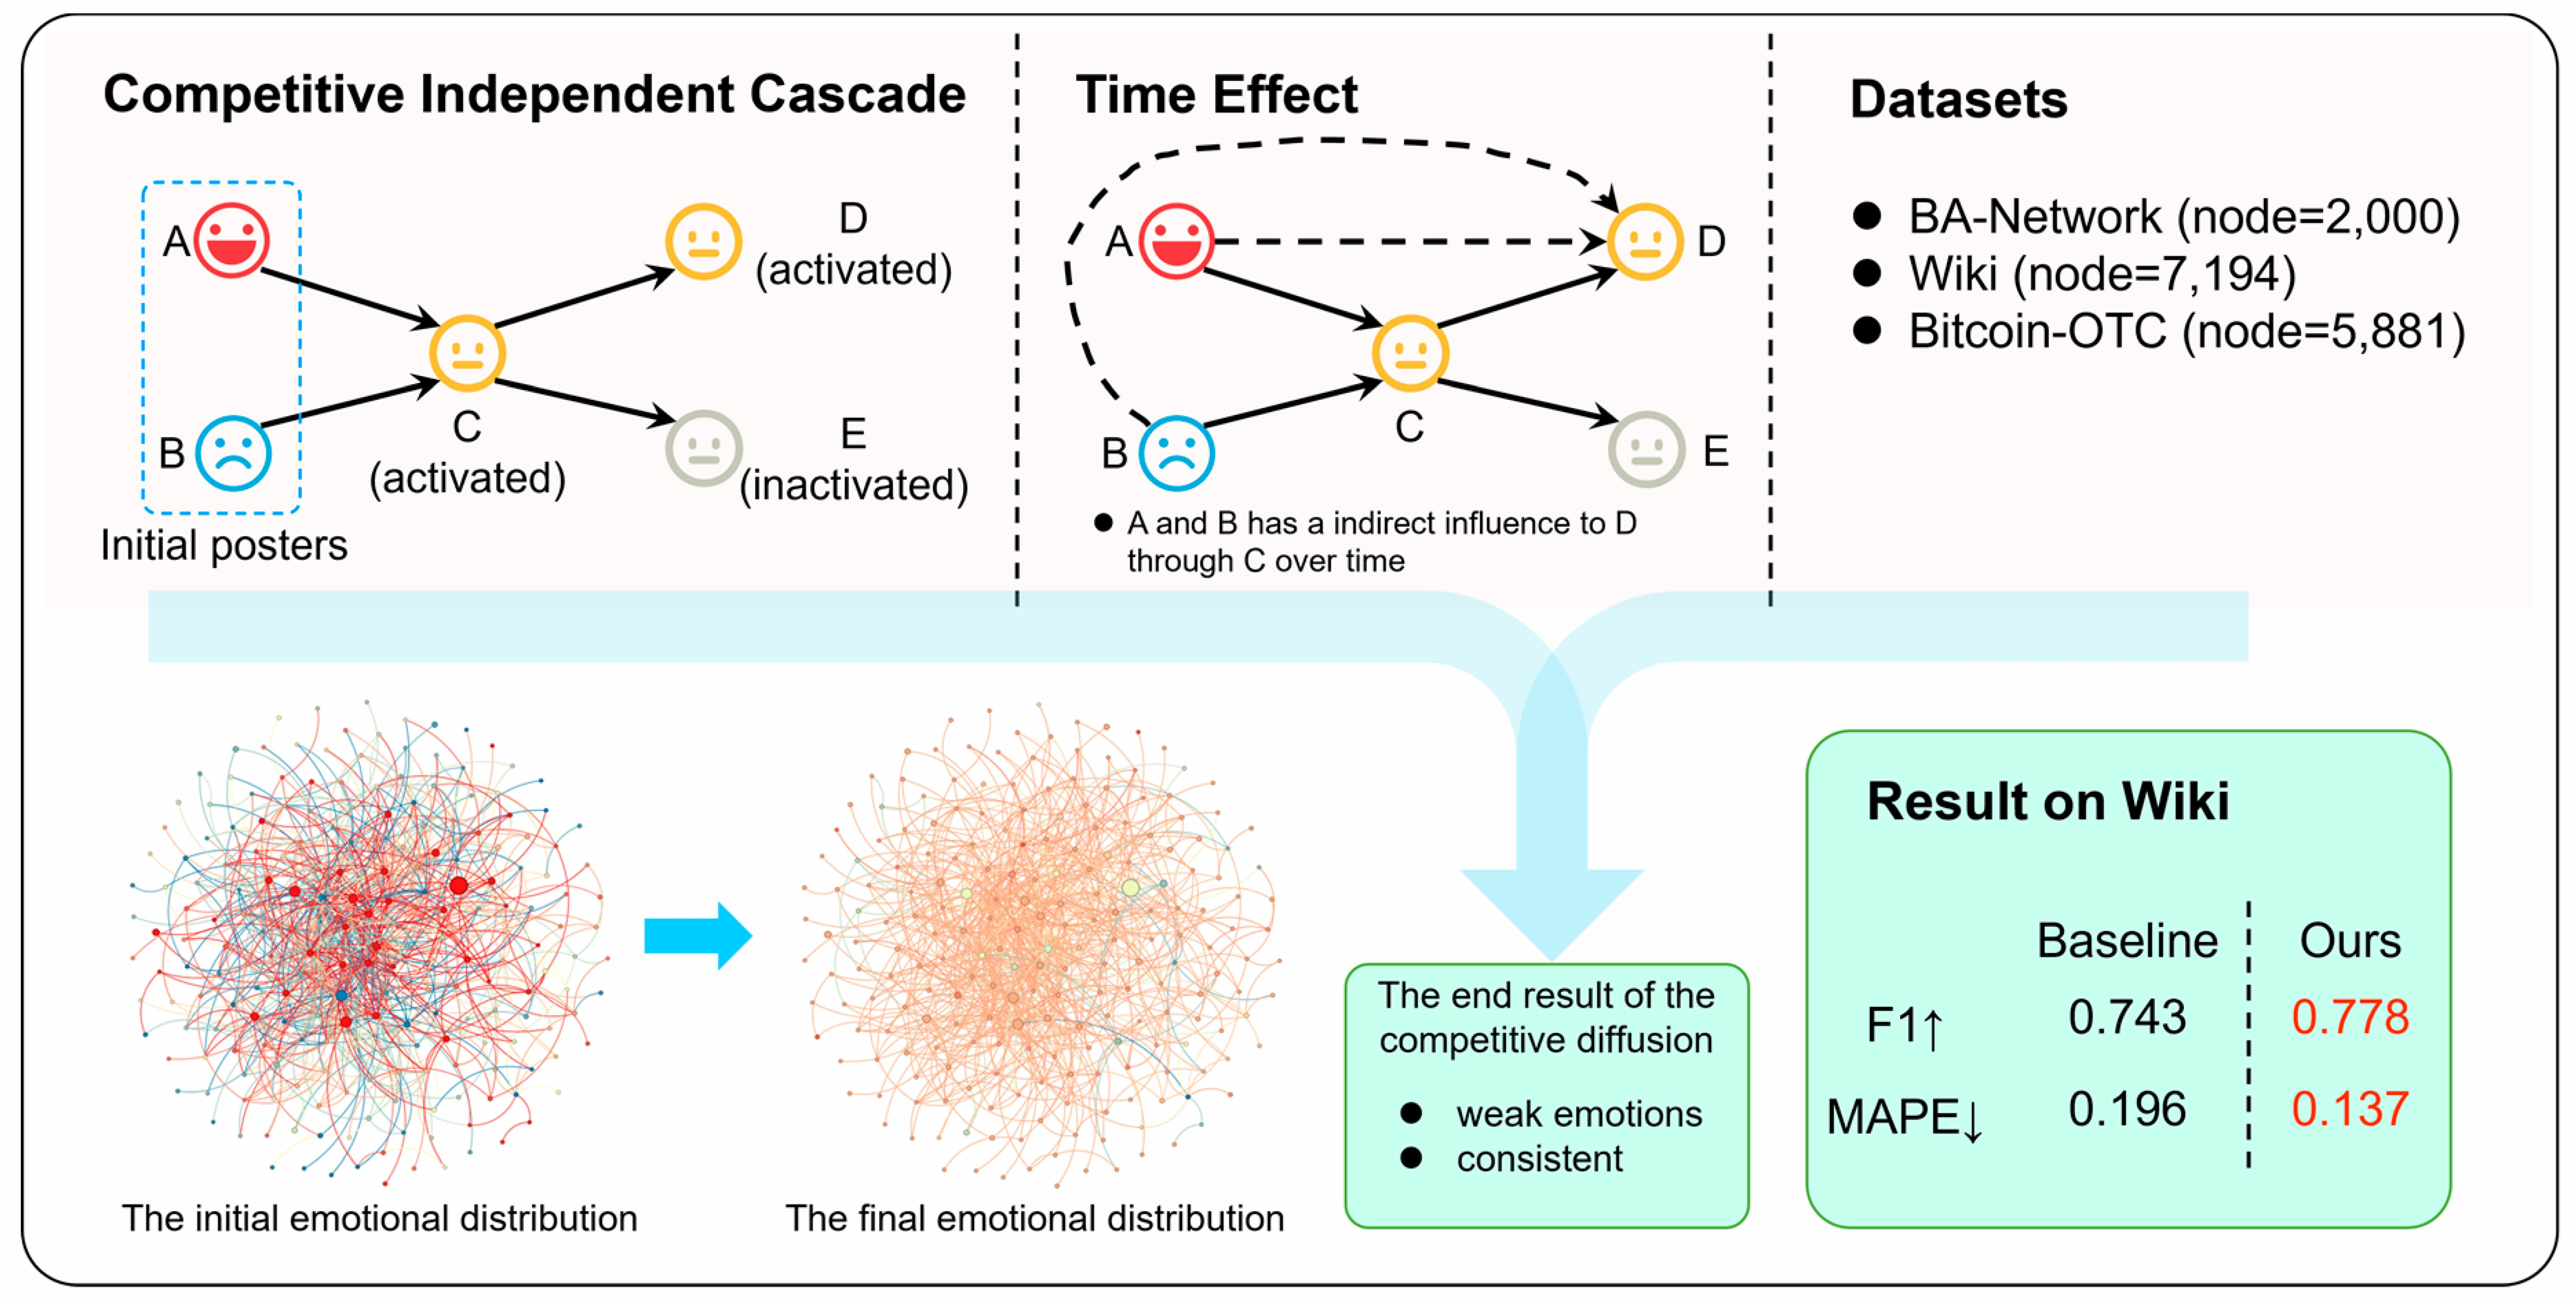
  • We propose a novel dynamic emotional propagation model based on an independent cascade to describe the competitive environment.
  • Experimental results prove that our proposed model outperforms baseline methods in emotional propagation research. It reveals that emotions in social networks are assimilated by opinion leaders, eventually become weak, and tend to be consistent.
The rest of the paper is organized as follows: Section 2 introduces some related literature about information diffusion and emotional propagation. In Section 3, we provide the problem formalization and describe our proposed DepIC model. Our experimental results are presented in Section 4 along with a discussion of the effects of different parameters. Then, Section 5 provides a discussion of the theoretical and practical implications. Lastly, our key findings and future works are concluded in Section 6.

2. Related Work

The aim of emotional propagation research is to find suitable mechanisms to describe opinion evolution. Information diffusion provides a basic condition for emotional propagation. Next, we review some prior works on information diffusion and emotional propagation.

2.1. Information Diffusion

Li et al. [24] divided existing information diffusion models into two categories: time-series methods and data-driven methods. We summarize representative works about information diffusion in Table 1.
(1) Time-series methods attempt to summarize the pattern of the data and use mathematical expressions to portray the diffusion process of the propagation model over time. Recently, more and more models have been proposed to adapt to the differences between social network and traditional contagion models. Xiong et al. [25] proposed SCIR, which added the contacted states to the SIR model to indicate users who read the information but did not choose to share it. Weng et al. [28] pointed out that traffic is another key factor for interpreting network evolution besides triadic closure in purely topological mechanisms. Zhang et al. [26] investigated the effect of the community structure and scale-free degree distribution on a stochastic SIR model. Ohsaka et al. [29] proposed a novel algorithm aimed at reducing influence graphs. Kong et al. [27] developed a general relation between self-exciting processes and epidemic models through three novel mathematical components. The LT and IC models explored the influence of network structure. Saito et al. [30] proposed AsIC and AsLT models that allowed users to activate asynchronously by adding a time-delay parameter. Chen et al. [42] also described the time-delayed diffusion process by introducing the “meet probability” between users. Zhang et al. [43] proposed an approach for influence probability calculation and considered influence decay with time and cascade depth. Some methods based on the stochastic process directly estimate the propagation probabilities among users in social networks. Shen et al. [11] proposed a generative probabilistic framework based on the reinforced Poisson process, capturing three key ingredients: fitness of an item, a general temporal relaxation function, and a reinforcement mechanism. Liu et al. [31] learned the susceptibility and influence of individuals by the survival analysis model, which was utilized to determine the diffusion probability among them. Nickel and Le [12] utilized a characteristic sparsity pattern from the diffusion process in the actual world. Their method enabled the computation of the precise likelihood and gradients of a Multivariate Hawkes Process without regard to the underlying network’s ambient dimensions. Zhang et al. [32] modeled the influence of opinions on information diffusion based on the multivariate marked Hawkes Process. Yan et al. [44] pointed out that sentiment polarity and reposting play an essential role in promoting information diffusion.
(2) Data-driven methods seek to automatically capture one or multiple features from the data through machine learning to observe the information diffusion process. Common features include structural features [33], temporal features [34], and user features [35]. However, end-to-end models based on deep learning have shown strong performance and gradually supplanted traditional feature-based methods in modern technology. The DeepCas model [36] demonstrates for the first time that the end-to-end representation learning framework is suitable for the cascade prediction task. Cao et al. [37] proposed the DeepHawkes model, which simulated the interpretable factors of the Hawkes process and utilized GRU to model the cascade information. Then, numerous new deep learning models were proposed to extract cascade, user, and some other features, such as HiDAN [38], DyHGCN [39], and TempCas [40]. Further, Liu et al. [45] were inspired by the field dynamics theory in psychology and proposed an end-to-end model that includes the fields of extrinsic environment and intrinsic cognition. Fatemi et al. [46] tried to introduce a graph convolutional neural network to the SIR model and improved its performance. Jain et al. [41] identified opinion leaders based on a graph neural network and analyzed their influence on information diffusion.
In summary, the time-series methods exhibited interpretability, which is still an important way to reveal the diffusion phenomena in social networks. However, the diffusion process only distinguishes users by various states, which makes users tend to be homogeneous and makes it difficult to express their different opinions. The purpose of the data-driven methods is to predict the future trend of the information cascade rather than to explore the diffusion mechanism in the social network. Although they demonstrated superiority in prediction performance because of deep learning, they barely refer to time-series modeling experience for extracting representative and comprehensive features. Thus, they are not suitable for modeling emotional propagation mechanisms.

2.2. Emotional Propagation

Dong et al. [13] divided emotional propagation methods into two categories: discrete opinion models and continuous opinion models. We summarize representative works about emotional propagation in Table 2.
(1) Discrete opinion models divide emotions into several classes. The Voter model [14] is the simplest method: individuals randomly adopt the opinion of one neighbor. The Ising model [15] is the most widely used discrete opinion model and considers the influence of both local and global individuals in the process of opinion updating. The Sznajd model [16] is based on the Ising model and allows individuals to abandon their original opinion during the information diffusion process. Recently, Wang et al. [17] proposed a fine-grained emotion classification that expands the range of emotions from binary to seven classes. Lee et al. [47] proposed a novel model for binary opinion dynamics in a structurally balanced network. Basu and Sly [48] proposed a variant of the Voter model in which individuals can choose to change their friends instead of their opinions in a dynamic network. Wang et al. [54] tried to capture the influence strength among users automatically from the relationship between emotive statuses and the topics that are distributed across the tweets. Yin et al. [49] modeled several negative emotions and explored the spread and mutation mechanisms among them.
(2) Continuous opinion models use continuous real values to represent emotions. The Deffuant model [18] assumed that each individual carries an opinion value from 0 to 1. When the opinion propagated by the user is less than the trust threshold, the value would be updated. Hegselmann and Krause [19] extended the Deffuant model and proposed the Hegselmann–Krause model that updated the opinion value based on all neighbors with a similar opinion instead of only one user. Dong et al. [50] analyzed the structure of a social network to develop a consensus-building process wherein all individuals are capable of achieving consensus. Gu et al. [51] proposed a co-evolution model that integrates the two phenomena together, i.e., social network generation and opinion evolution. Xiong et al. [22] proposed an emotional independent cascade model wherein an individual’s emotion can affect their friends continuously in the subsequent diffusion process. Du et al. [52] attempted to expand emotion to the role-detection task based on emotional contagion methods. Liang and Duan [53] proposed a three-way decision framework to investigate competitive behavior in social networks.
In summary, some research tried to express a greater number of different emotions in discrete opinion models. However, compared to continuous-opinion models, they still have difficulty describing the potential relationship among different emotions and the process of emotion change. Competitive behavior has received some attention. The emotions of users in a competitive environment change in response to events. The IC model assumes that each individual has only one chance to affect others during activation, which cannot describe opinion evolution in a competitive environment. In addition, existing continuous opinion models take less account of the effect of time factors on opinion evolution. There is still room for improvement in modeling the way that different emotions change over time.

3. Method

In this section, we start with the problem formalization of emotional propagation. Then, we introduce our method. Finally, we present the complete algorithm along with its specific details and implementation.

3.1. Problem Formalization

Here, we provide some definitions for related terminology. There is a social network based on the relationships among users, where users express their emotions and support or opposition. Let the social network G = ( U , E ) be a directed graph. U = { u 1 , u 2 , , u N } is the user set, where N is the number of users. The adjacency matrix E = [ e u , v ] R N × N represents relationships among users in the social network, where e u , v = 1 means an edge exists between user u u and u v . The matrix Y N × T is used to denote the emotions of users at different times, where y u t means the emotion of user u at time t T . In this problem, we consider emotions in three categories: {positive, neutral, negative}.
The purpose of this paper is to predict the emotions of users at time T. The given inputs include a social network G, a specific time T, and the emotions of users within time [ 1 , T 1 ] . The goal can be formalized as:
F = G ( U , E ) , T , Y 1 , , T 1 Y T

3.2. Reinforced Poisson Process

The reinforced Poisson process [11], a stochastic event model, proved its remarkable power to predict popularity. The crucial aspect of such a process-based approach lies in modeling a rate function that is represented as:
x d ( t ) = λ d f d ( t ; θ d ) i d ( t )
where x d is the transmission rate of an individual, λ d is the intrinsic attractiveness of users, f d ( t ; θ d ) is the time-decay function modulated by parameters θ d , and i d is the accumulated impacts from prior users received up to time t. This model captures three critical factors in popularity dynamics: (1) The influence of users: influential users are able to spread messages more easily due to their high number of connections. (2) Time-decay effect: the impact of a message on a social network will fluctuate over time. (3) Exciting mechanism: each previous forwarding contributes to a continuous impact on subsequent interactive behaviors.
The reinforced Poisson process captures the “rich-get-richer” phenomenon, which corresponds to the rule that opinion leaders in social networks continuously and strongly influence emotional propagation. Then, we will compare the interpretable components of the reinforced Poisson process with our proposed emotional propagation method based on the IC model.

3.3. Model Description

We proposed a novel emotional propagation model to describe the opinion evolution in the social network, which includes an information-diffusion process based on the IC model and emotional calculation with a time-decay mechanism. In our proposed model, DepIC, we assume that the emotions of all users are updated as a continuous process. Specifically, instead of only one emotional calculation when the activation occurs, emotional interaction between two users will still take place during the subsequent diffusion process. Such an emotional cascade path makes opinion leaders gain greater influence throughout the network.
Here, we introduce some significant concepts used in the proposed eIC model.
Definition 1 
(Inactive Users). These are individuals in the social network who are either unaware of the event or are temporarily disinterested in it.
Definition 2 
(Active Users). These are individuals in the social network who have posted or retweeted relevant messages about the event. Their emotions have changed and they try to influence inactive users.
Definition 3 
(Emotion e). Emotions express the attitude of a user toward the event. We use a continuous opinion calculation method to quantify the sentiments of different users. The emotion e is a real value O i ( t ) within the interval [ 0 , 1 ] . The emotion polarity is divided into three categories based on its value. The matrix Y N × T = [ y i t ] { 1 , 0 , 1 } N × T denotes that emotion e is {negative, neutral, positive}, respectively. The function is:
Y i ( t ) = 1 O i ( t ) [ 0.00 , 0.33 ] 0 O i ( t ) ( 0.33 , 0.67 ) 1 O i ( t ) [ 0.67 , 1.00 ]
Definition 4 
(Emotional Cascade Path p a t h ( u , v , e ) ). This is a sequence that consists of users arranged in a particular order like { u 1 , u 2 , } . We use p a t h ( u , v , e ) = 1 to represent that there is an emotional link about e between user u and v. If not, p a t h ( u , v , e ) = 0 . The connection will be established and recorded when users have an emotional interaction.
Definition 5 
(Attractiveness λ ). As indicated by the reinforced Poisson process, each user has a unique appeal. To capture the influence and susceptibilities of users, attractiveness is introduced as a weight to evaluate the propagation probability among users. It is affected by the user’s social network activity.
Definition 6 
(Time-Decay Function f ( t ; θ ) ). The second crucial factor of the reinforced Poisson process is the aging effect, which is described by the time-decay function. It is worthwhile to notice that the strength of opinion propagation is closely related to the change in time.
Definition 7 
(Emotion Exciting Mechanism i ( t ) ). The final critical factor of the reinforced Poisson process is an exciting mechanism, which allows earlier posters to be more influential in the subsequent diffusion process. Opinion leaders usually have greater control over the trend of the event and continue to influence other users in the social network over time.
The IC model [10] assumes each active user will attempt to activate his inactive neighbors v N ( u ) with a probability p u , v at one time step. If successfully activated, user v becomes a new active user and attempts to affect others in the next time step. And only during that time step, the new active user has the opportunity to influence others. Based on the above rules, we add some details to adapt the emotional propagation problem. Though the message comes from the same event, negative, neutral, and positive emotions can be considered different opinions. Differing from the standard IC model, where a user can only be activated once, there are three activation states in our proposed propagation method that correspond to different emotions. When inactive user v is activated by active user u with emotion e, a path will be recorded as p a t h ( u , v , e ) = 1 . Other active users with emotion e can no longer attempt to affect user v.
Attractiveness: The propagation probability p u , v , which is affected by user attractiveness, is an important parameter in the social network. Users who have frequently participated in diffusion are believed to have significant influence. On the other hand, people who receive more information have higher susceptibilities. Thus, the attractiveness λ u , v , which means the acceptability of user v to messages from u, is calculated by:
λ u , v = O U T u η u × I N v η v
where O U T i and I N i refer to the times that a user i posts and receives messages, respectively, and η i is the total interaction number of user i with others. The former and the latter multiplication represent the influence of user u and the susceptibility of user v, respectively. Moreover, we obtain the propagation probability p u , v between users u and v by the following equation:
p u , v = 1 e α · λ u , v
where α is a parameter to control the probability dynamically.
Time Decay Functions: The power-law model is frequently employed in social networks to show the long-tail effect:
f P O W ( t ; θ ) = t t u c ( θ + 1 )
where t u is the activation time of user u, and c is the minimum time difference. The relaxation function used in the reinforced Poisson process is a log-normal distribution. The parameter θ is replaced by μ and σ . We modified the time item with the activation time difference between users:
f N O R ( t ; μ , σ ) = 1 2 π σ t exp ( t t u μ ) 2 2 σ 2
Wu and Huberman [23] mentioned a phenomenon: when an event first appears, it attracts much attention and the cascade number builds up quickly. After a couple of hours, its transmission rate slows down because of lacking novelty and prominent visibility. This phenomenon illustrates that diffusion probability increases to a peak and then sharply declines. The parameters μ and σ in Equation (7) can be considered as the time of peak occurrence and the change rate of opinion evolution intensity, respectively. Gomez-Rodriguez et al. [55] also described such a propagation trend through the Rayleigh model:
f R A Y ( t ; θ ) = θ ( t t u ) e 1 2 θ ( t t u ) 2
The specific analysis of time-decay functions is introduced in Section 4.5 when we examine the simulation experiment.
Emotional Propagation: With the spread of events, opinion interactions between users take place and influence emotions. When an inactive user v is activated by user u, the emotional influence from u to v is calculated by:
ξ u , v = β e · ( O u ( t ) O v ( t ) )
where β e is a parameter to adapt the influence strength of emotion e. Significantly, considering the trust threshold [18], the impact between users with conflicting emotions cannot be excessive. When a positive user affects a negative user, the effect only equals affecting a neutral user and vice versa.
Emotion Exciting Mechanism: According to the reinforced Poisson process, previous attention will trigger more subsequent attention. This phenomenon is denoted by an exciting mechanism i ( t ) = m + i 1 , where i ( t ) is the current number of active users, m are the initial active users, and i 1 is the number of active users in the last diffusion. Similarly, more opinion leaders with the same emotion can promote the spread of such an emotion e. Thus, we designed a continuous opinion propagation method as the emotional exciting mechanism. Specifically, each link in the emotional cascade path p a t h ( u , v , e ) will cause an emotional calculation at each time step. However, because of time decay, an opinion leader keeping the same intensity of emotional influence all the time is unrealistic. We integrate the time-decay function to fit the users’ influence strength over time and anticipate their emotional states in the future. The emotional values O v ( t + 1 ) of v will be updated by u:
O v ( t + 1 ) = O v ( t ) + f ( t ; θ ) ξ u , v
Let i v e ( t ) represent the set of upstream users founded from user v along p a t h ( u , v , e ) = 1 at time step t, i.e., i v e ( t ) = { u 1 , u 2 , , u u , u v | p a t h ( u 1 , u ) = 1 } . Then, the emotional value O v ( t ) of user v will be updated by this emotional path i v e ( t ) in the next time step as follows:
O v ( t + 1 ) = O v ( t ) + i = 2 | i v e ( t ) | f ( t ; θ ) ξ i 1 , i
Moreover, when user v is activated at time step t, we can estimate his final emotional values O v ( T ) .
Likelihood of Final Emotion: We combine Equations (8) and (9) for the following equation and obtain the result:
O v ( T ) = O v ( t ) + k = t T j = 1 | e | i = 2 | i v j ( t ) | f ( t ; θ ) ξ i 1 , i = O v ( t ) + k = t T j = 1 | e | i = 2 | i v j ( t ) | θ ( k t ) e 1 2 θ ( k t ) 2 · β e ( O i 1 ( t ) O i ( t ) )
where | e | is the number of emotions, and i v j ( t ) means the jth emotional cascade path of user v. The users can be activated by each emotion e only once due to the IC model.
Interpretability: This paper describes the phenomenon of emotional propagation by augmenting three factors of the reinforced Poisson process. We estimated the influence of an emotion through the attractiveness of its posters, the time effect, and the exciting by opinion leaders. Then, we extended the IC model so that different emotions could influence and compete with each other in the diffusion. A possible emotional propagation example is given in Figure 2. First, active users A and B attempt to activate their neighbors C, D, and E at time step 1. Then, at time step 2, users C and D are activated by users B and A separately. User C follows a negative emotion from user B. And D accepts a positive emotion from user A. User E is not activated and withdraws from the propagation of negative emotion from user B. Finally, due to the time-decay mechanism, the influence from user A to D is weakened. A negative emotion from user C makes the emotion of user D turn neutral again at time step 3. The Algorithm 1 shows the implementation details of the proposed DepIC model.
Algorithm 1 Algorithmic description of DepIC
Input: N: The number of users.
E: The N × N matrix storing the social relationship of users.
T: The number of evolutionary steps.
A 0 : A set storing the initial opinion leaders.
O: The N-dimensional vector storing the emotional values of users.
Output:Y: The N × T matrix storing the emotions of users at each time step.
1:
initialize p a t h [ N , N ] = 0 , e [ N , 3 ] = 0 //Corresponding to p a t h ( u , v , e ) . Note that the emotion corresponding to the opinion leader’s is equal to 1 instead of 0 in the array e.
2:
while  t [ 0 , T ]  do
3:
    while  ( u , v ) p a t h [ N , N ] )  do
4:
        update emotional value O [ v ] , as shown in Equation (10)
5:
    end while
6:
    while  u A t 1  do
7:
         A t = { }
8:
        while  v N ( u )  do
9:
           if  e [ v , Y u ( t ) ] = = 0  then
10:
               calculate the propagation probability p u , v , as shown in Equation (5)
11:
               if v is activated by u with porbability p u , v  then
12:
                   update emotional value O [ v ] , as shown in Equation (10)
13:
                    p a t h [ u , v ] = 1 , e [ v , Y u ( t ) ] = 1
14:
                    A t A t v
15:
               end if
16:
           end if
17:
        end while
18:
    end while
19:
    while  u N  do
20:
        record the emotions of user Y [ u , t ] , as shown in Equation (3)
21:
    end while
22:
end while
23:
t = t + 1
24:
return Y
Here, we introduce several semantic steps of the algorithm.
  • Lines 3–5 update the emotional values of all users according to the emotional cascade path at each time step.
  • Lines 6–10 walk through all the activated users from previous time steps and calculate the propagation probability to judge whether their inactive neighbors should activate or not.
  • Lines 11–15 will happen if an activation action occurs. The user v who is activated successfully by u would update his/her emotional value, build up the link in the emotional cascade path, and become the active user in the next time step.
  • Lines 19–21 transform the emotional value into specific emotions in each time step.

4. Experiments

In this section, we introduce the datasets and experimental settings. To verify the effectiveness of the proposed model, we compare our DepIC model to several baselines and provide some performance analyses.

4.1. Datasets

We created a Barabasi–Albert scale-free network using the Python package NetworkX to explore the effects of various parameters. Moreover, two public real-world datasets were used to analyze performance. Table 3 shows the statistics of the datasets. The degree distributions of these datasets are shown in Figure 3.
BA Network [56] includes 2000 nodes. It was generated from three initial nodes, and other nodes were added in order. For a new node, it is easier to choose a node with high degrees. We explored the influence of different time-decay functions and analyzed the related parameters through simulation experiments on the network.
Wiki is a free online encyclopedia. The dataset is provided by Leskovec et al. [57,58] on the website (http://snap.stanford.edu/data/wiki-Elec.html (accessed on 5 November 2023)). The Wikipedia community decides whether to elect a contributor as an administrator through public discussions or voting. This dataset contains the voting data from September 2004 to January 2008, which constitutes a directed network. The network means who voted for whom in each election and if the elector resulted with a promotion or not. There are nearly 2800 records of administrator elections with about 7000 users in this dataset.
Bitcoin-OTC is a trade platform for trading with Bitcoin and constitutes a who-trusts-whom network. The dataset is available via Kumar et al. [59,60] on the website (http://snap.stanford.edu/data/soc-sign-bitcoin-otc.html (accessed on 5 November 2023)). It is a signed directed network that demonstrates users’ reputations to help regular users avoid trading with risky users and spans the time period from November 2010 to January 2016. The dataset provides 35,592 trusted relationships between users in increments of 1 from −10 (total distrust) to +10 (total trust).

4.2. Evaluation Metric

Emotional propagation aims to predict the final emotions based on the initial states of users in the social network. To make the task easy to evaluate, we simplify and regard it as a binary classification problem. We follow the same setting used in [22]. The neutral and negative emotions are both regarded as the negative class, and the positive emotion is treated as the positive class. Precision, Recall, and F1-score are used to evaluate the prediction performance in this paper. We first give some definitions for metrics. T P means the actual label of the emotion is positive and the prediction result is positive, too. F P means the actual label is negative but the prediction result is positive. F N means the actual label is positive but misjudged as negative. T N means both the actual label and prediction result are negative. The specific calculations for Precision, Recall, and F1-score are as follows:
P r e c i s i o n = T P T P + F P
R e c a l l = T P T P + F N
F 1 s c o r e = 2 × P r e c e s i o n × R e c a l l P r e c e s i o n + R e c a l l
Further, we also use the Mean Absolute Percentage Error (MAPE) to evaluate the performance in predicting the sizes of two classes. It is computed as:
M A P E = 1 M i = 1 M y ^ y y
where M is the number of classes, i.e., M = 2 for positive and negative classes, The variable y ^ is the predicted number for one class, and y is the true number.

4.3. Baselines

To illustrate the performance of our proposed DepIC model, we select the following methods as baselines and compare them in the same datasets.
ESIS [17] classified emotions into fine-grained classes based on the spreader–ignorant –stifler (SIS) model. We classified these sentiments into three types: positive, neutral, and negative, as in the eIC model [22]. This method is a discrete opinion model. We used the IC model instead of the SIS model and investigated it as a continuous opinion model.
eIC [22] proposed an emotional contagion method based on the IC model. An important difference is that eIC introduced a sliding time window to catch emotional states over time, while ours used a continuous function to describe the time-decay phenomenon.
TSSM [54], a topic-enhanced sentiment-spreading model, integrated the topic-enhanced mechanism and considered users’ interests to refine the spreading strength. It is one of the best models for predicting the emotions of users.

4.4. Experimental Settings

We adopted the IC model as the framework of our proposed DepIC model in this paper. During the experiment, we chose the Rayleigh as the time-decay function. Considering that users on the Internet prefer information with strong emotions, we regarded positive and negative users as rivals competing with each other. Neutral users, due to their relatively weak emotional intensity, are less likely to influence others. Therefore, in the experiment, we assumed that neutral users were the targets of the competing parties and could not participate in the process of affecting others. The variables β p o s and β n e g represent the credibility of positive and negative information, respectively. The initial emotion value of an opinion leader is 1 or 0. As for a common user u, it is sampled from y u 0 = x , x U ( 0 , 1 ) , where U ( 0 , 1 ) refers to a uniform distribution. A user usually encounters many messages with different emotions. We accumulated the positive e + , negative e , and neutral actions e 0 with 1, −1, and 0, respectively. The final emotion e ( u ) of a user is calculated by Equation (15). In the Bitcoin-OTC dataset, we chose 25 positive users and 50 negative users who have higher degrees as the initial opinion leaders. Table 4 presents the specific parameter settings of the experiment.
e ( u ) = 1 e + + e + e 0 < 0 0 e + + e + e 0 = 0 1 e + + e + e 0 > 0

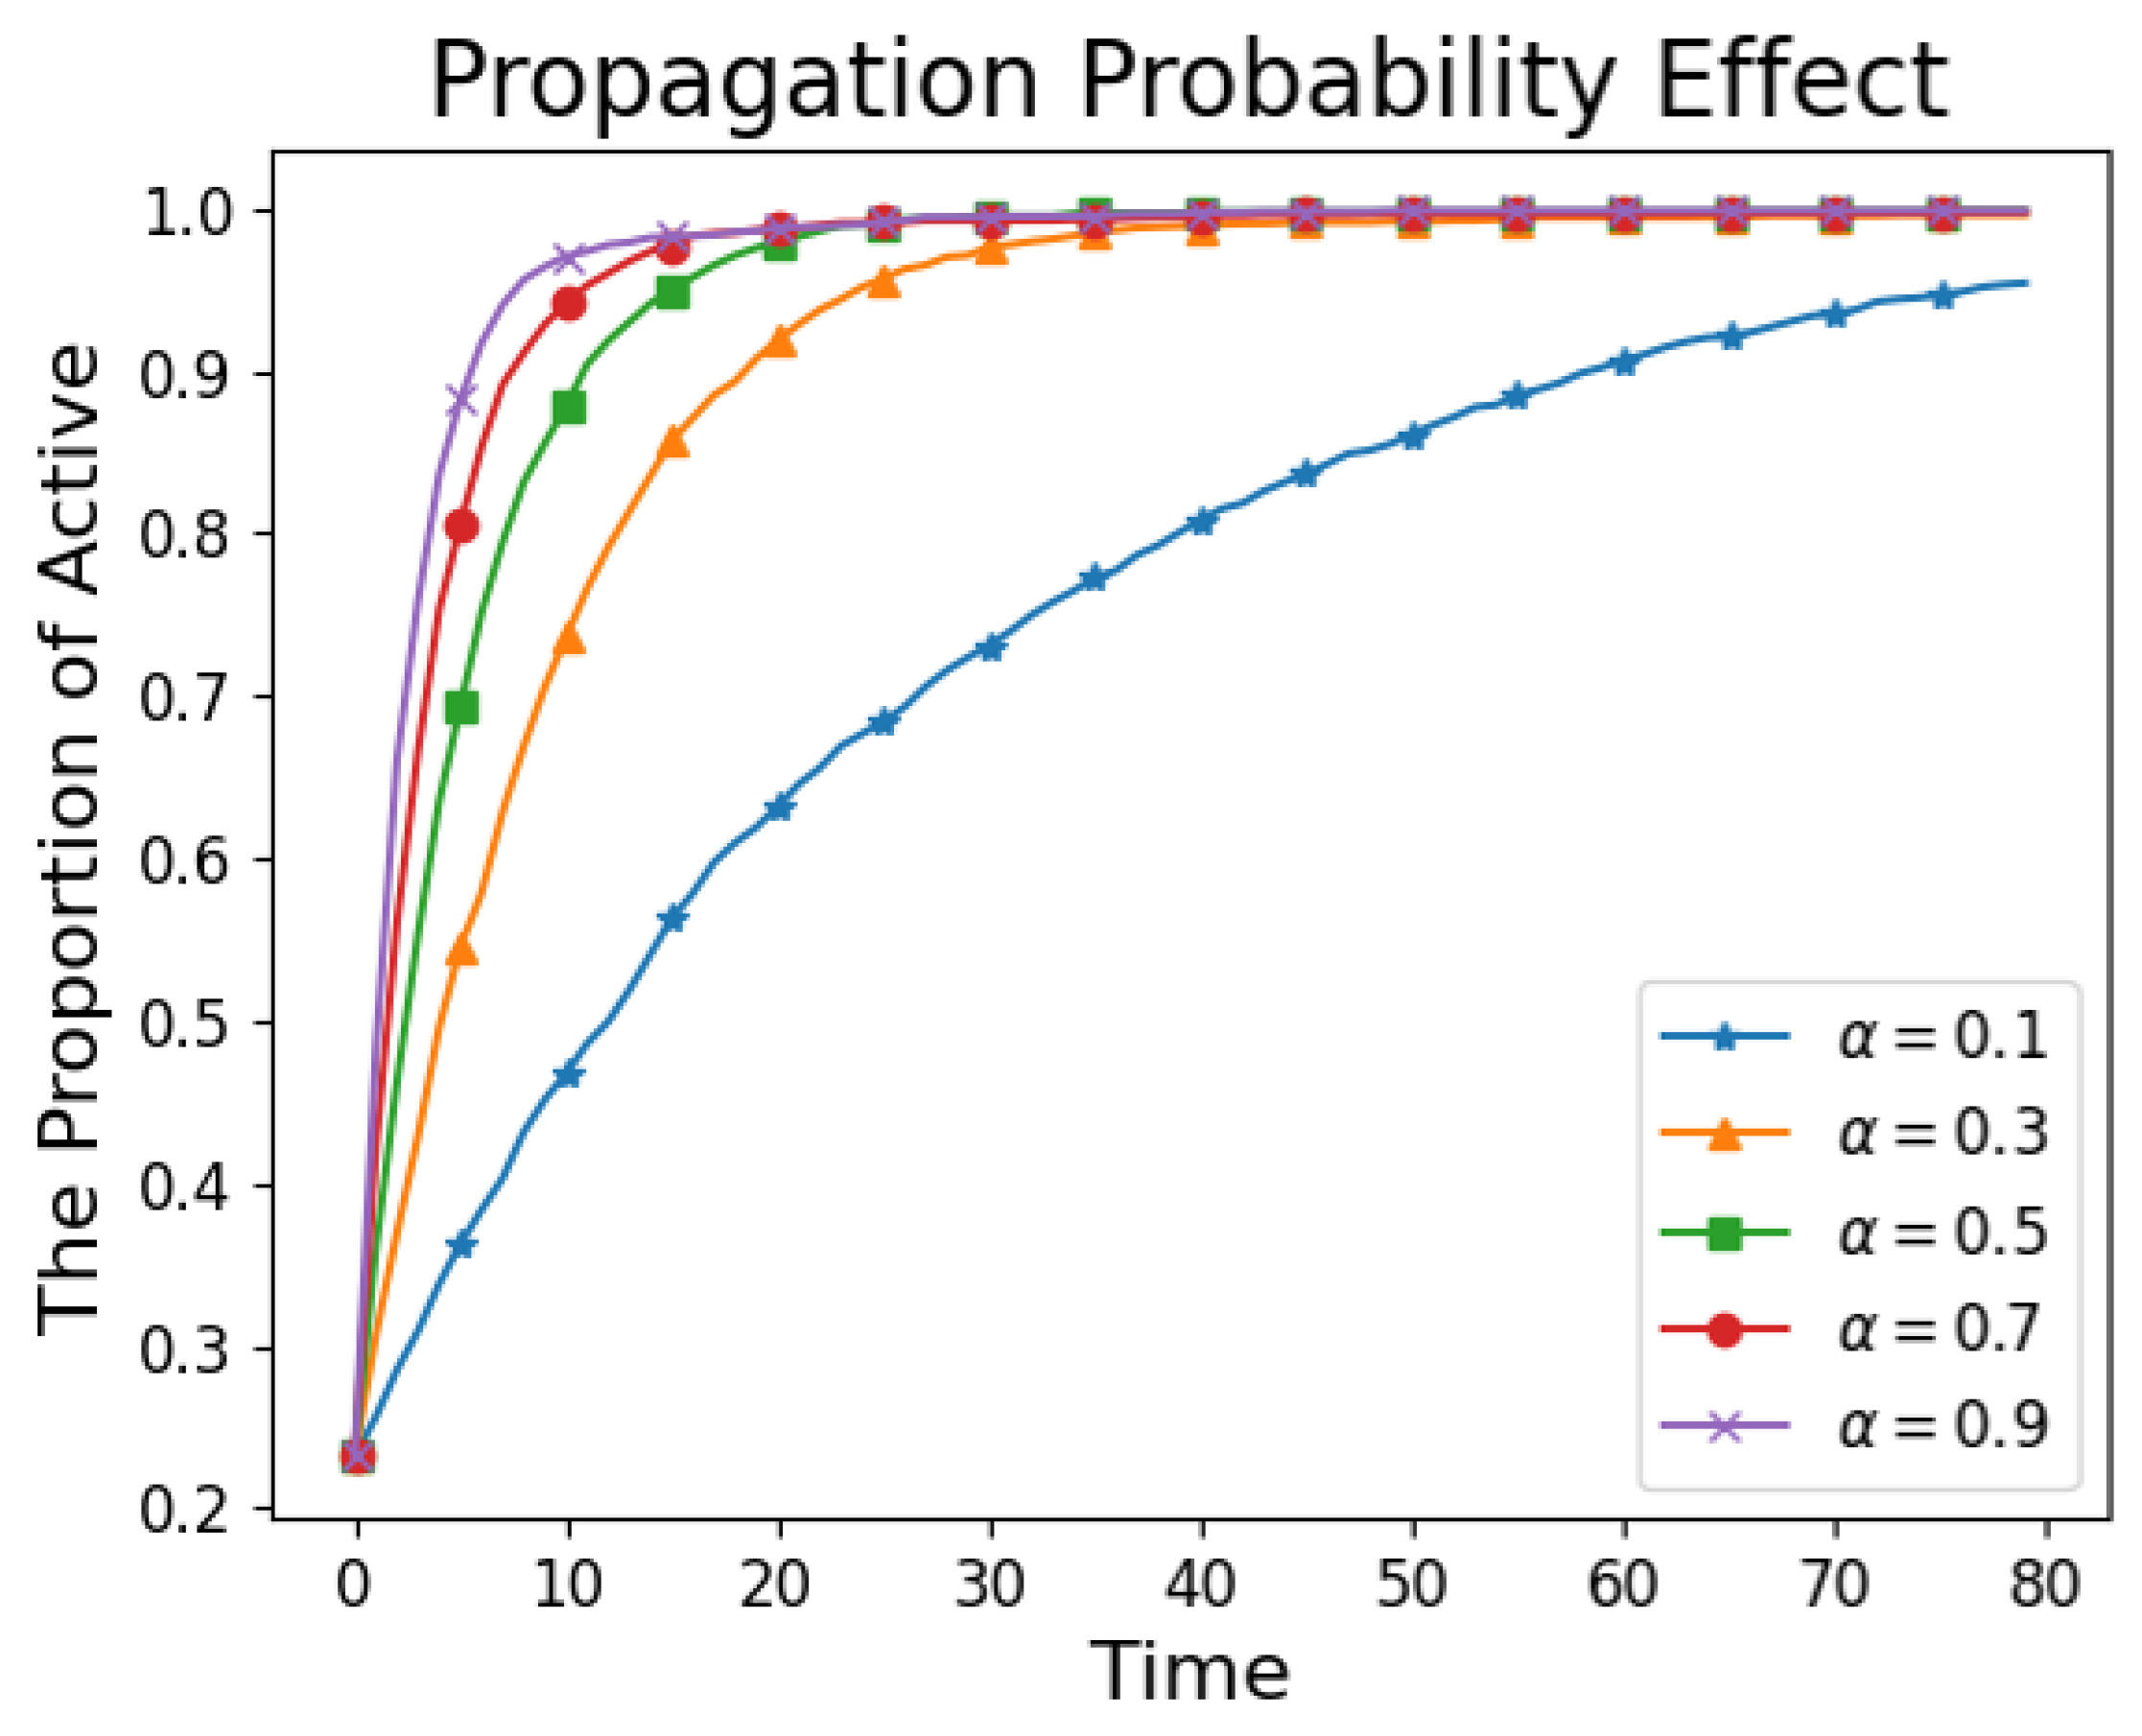
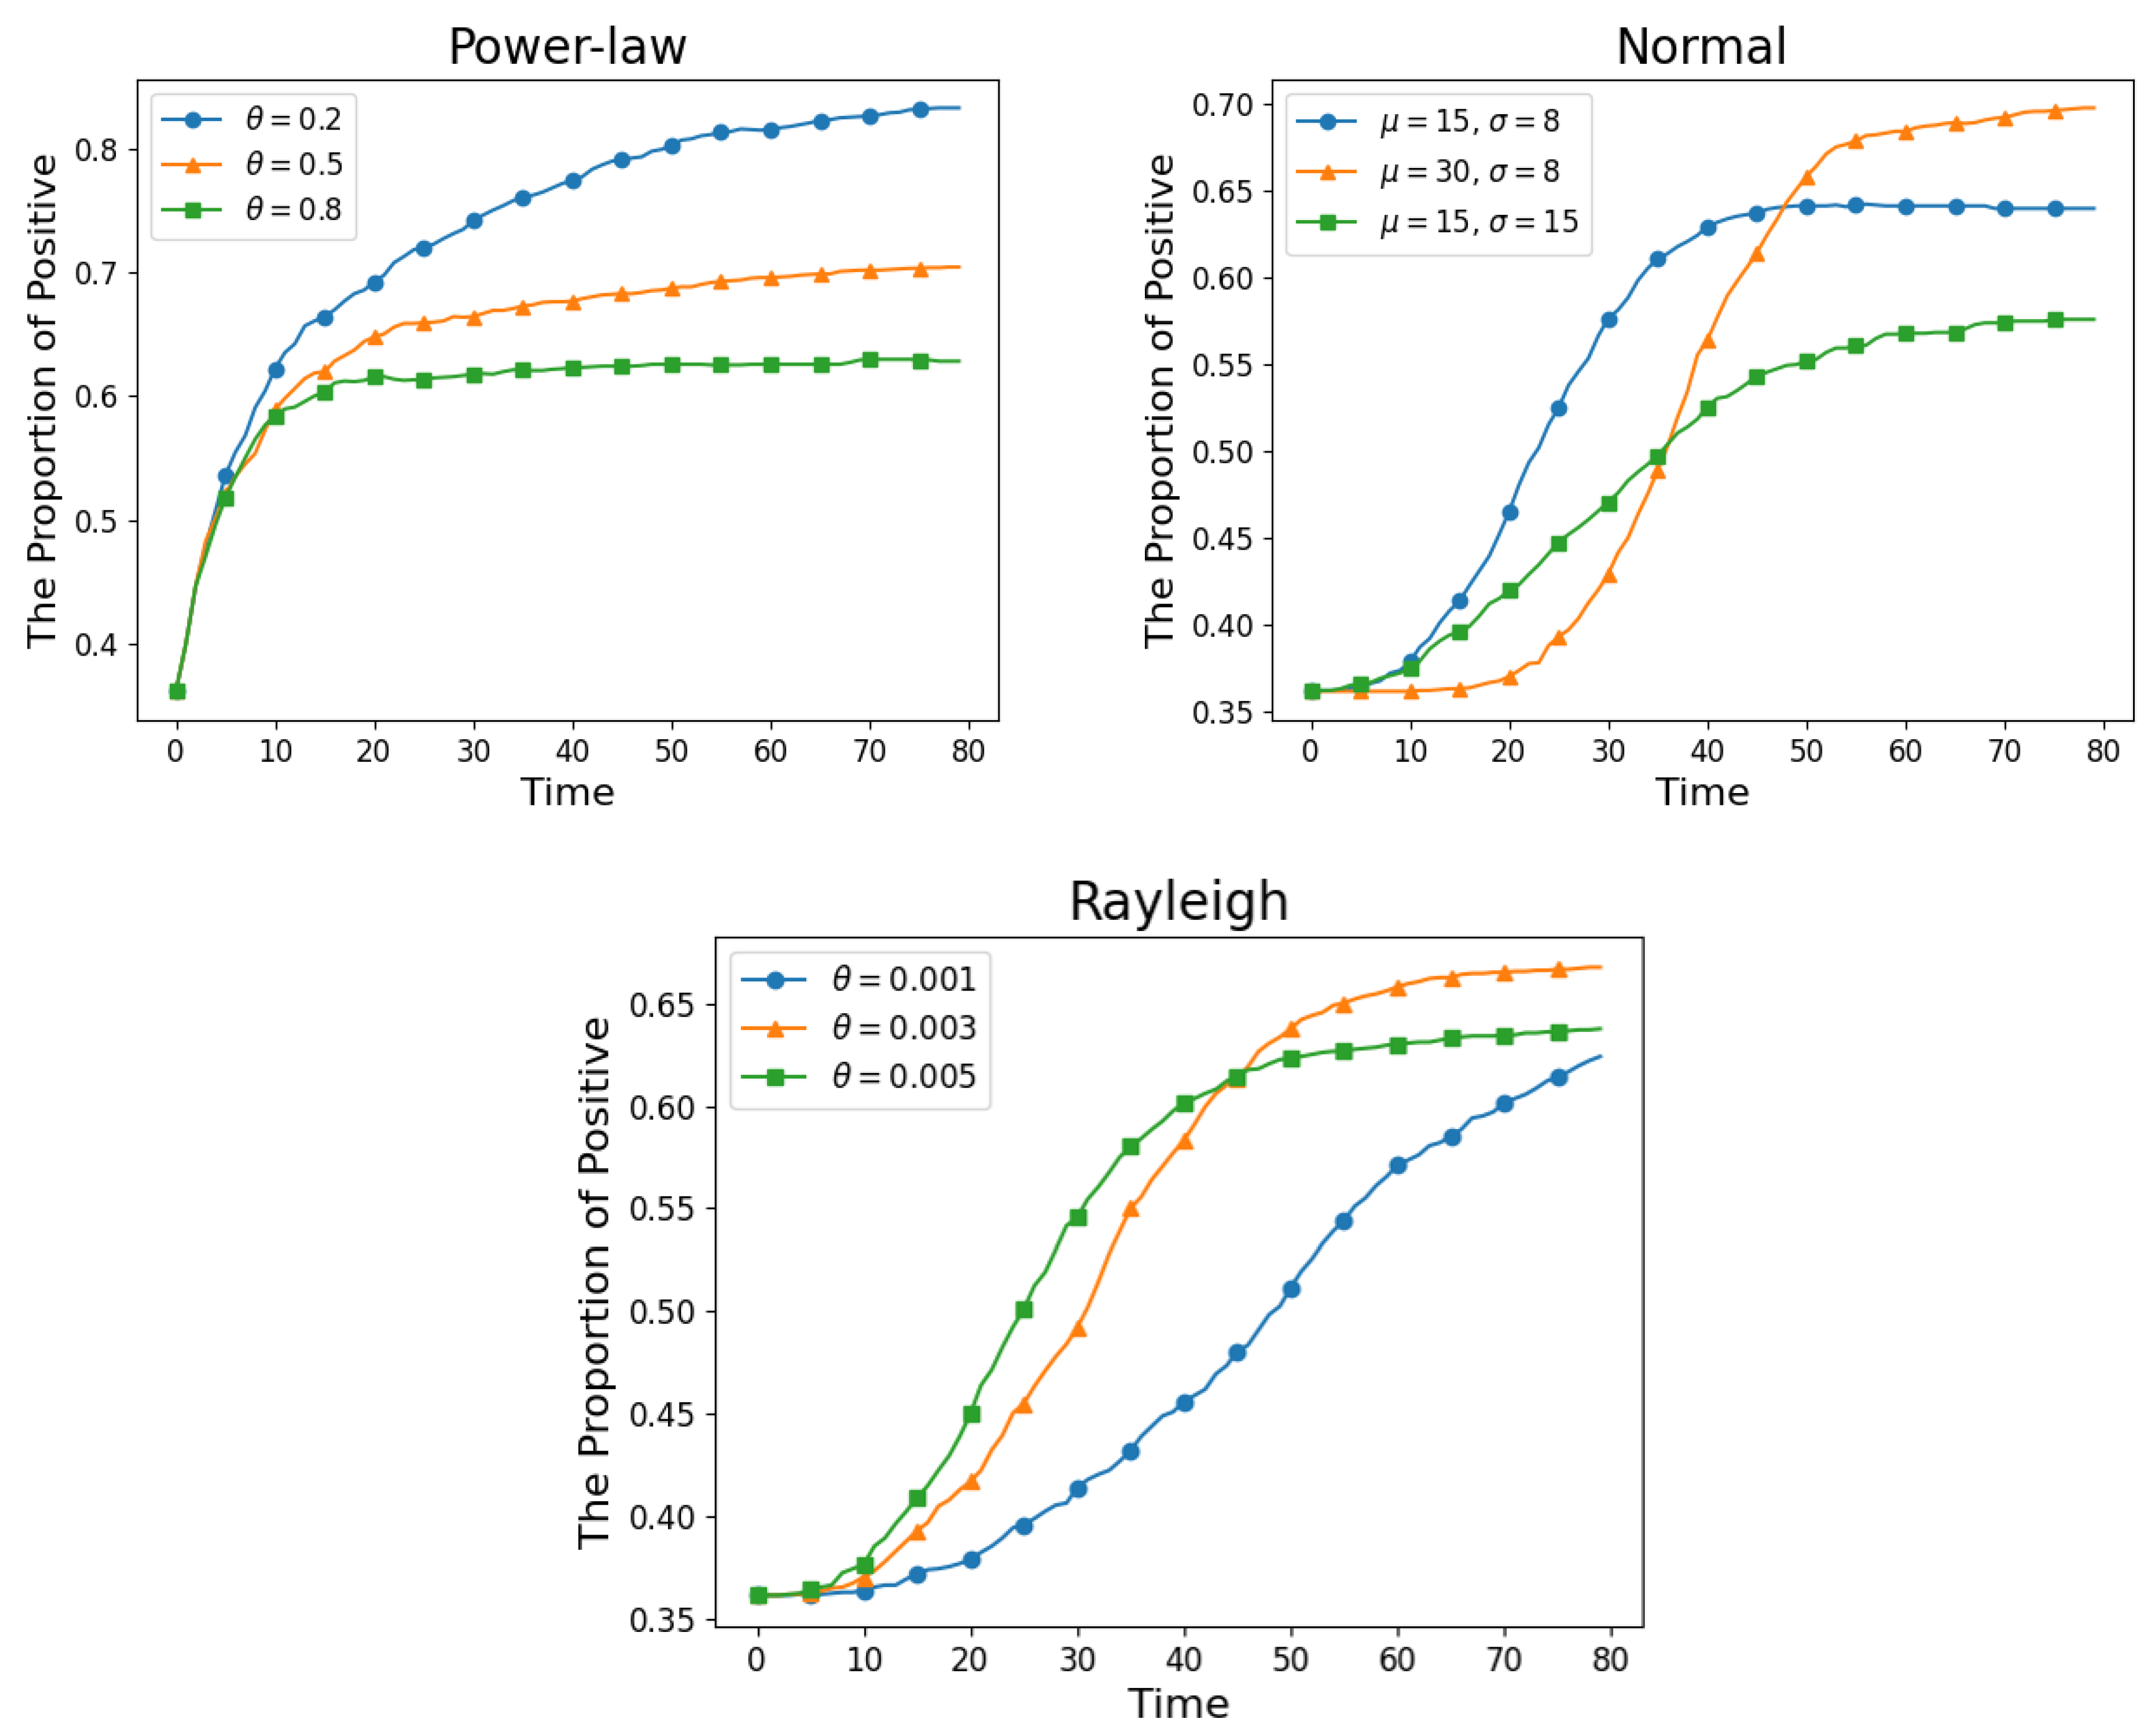
4.5. Simulation Experiment

We analyzed the influence of different parameters and time-decay functions on the generated BA network. We showed how the active user changes with the propagation parameter α . As shown in Figure 4, the proportion of active users increases while the parameter α rises. When α is less than 0.3, it has a greater impact on slowing down the activation rate. When α exceeds 0.3, the users will be activated quickly.
In addition, we explored the differences in time-decay functions and the effects of their parameters. As shown in Figure 5, we counted the proportion of positive users at each time step using three functions separately. As for the power-law function, its distribution exhibits a rapid increase in the positives at the beginning of diffusion. Then, the propagation rate of emotion decays quickly over time. It is suitable for describing the diffusion trend of hot events that often develop and update emotions rapidly. As for the normal function, the propagation rate follows a bell shape, with a majority of values clustering around a central region and sloping down as they move away from the center. Its diffusion trend gradually rises to a peak and then slows down. A greater μ means a delay in the arrival of the rapid growth period. And the σ determines the slope of the curve. The slope, which represents the emotional propagation rate, will be reduced with the growth of σ . As for the Rayleigh function, the trend of its graph is similar to the normal function. It is easier to configure, with one parameter, θ , that controls the occurrence of the peak in terms of rapid growth and the slope of the curve simultaneously.
In conclusion, the power-law function describes a long-tail effect in that the majority of emotional propagations cluster at the beginning of the event. Normal and Rayleigh functions are suitable for another “rise and fall” pattern as described in [61]. The main difference between them is that the normal function is more flexible and precise in controlling the occurrence of the propagation peak and the length of the epidemic time by two parameters separately. And Rayleigh can achieve an approximate result with one parameter.

4.6. Experimental Results

We compared the proposed model with the baselines on two real public datasets as presented in Table 5 to verify its effectiveness.
The experimental results on the two datasets demonstrate that our proposed DepIC model achieves an improvement for both the F1-score and MAPE metrics. Our model has better performance for Recall, and the final F1-scores improve by 3.5% and 0.4% on Twitter and Bitcoin-OTC, respectively. And the MAPE metric was reduced by 0.059 and 0.013, respectively. The results proved the DepIC model outperformed other baselines in emotional propagation. However, the main contribution of the TSSM model is to design three kinds of factor functions to capture the effect of topic distributions on sentiment status. We adopted a uniform distribution for the initial topic distribution because we did not explore a text-based social network, which may limit the performance.
The overall superiority of DepIC over the baselines is due to the consideration of time. ESIS and TSSM do not take into account the temporal influence, which suggests that the emotional propagation with time decay is closer to the real situation. The eIC model explored emotional contagion in a heterogeneous structure. It fused emotions for a user in different message layers by sliding a time window. However, this method leads to a one-way flow of emotions on the single-layer network. This resulted in a degradation in performance due to the change in the network environment.
Overall, the consideration of the complete time of an event makes the proposed DepIC model achieve better performance. It provides a new way to explore the emotional propagation mechanism in the social network. We will take this into account for our upcoming work.

4.7. Case Study

To show how our proposed model affects the process of emotional propagation, we calculated the status density including inactive and active users at each time step, as shown in Figure 6. Then, we filtered out nodes for which the degrees were less than 30 in the Bitcoin-OTC dataset. And we visualized the graph to exhibit the initial and final emotional distributions in propagation, as shown in Figure 7.
As shown in Figure 6, the proportion of active users continues to rise. This means the information gradually spreads to the whole social network. There is a slight rise in the number of neutral users in the first several steps and a gradual drop after a peak. The reason may be that the neutral users are still waiting for the development of the event. Further, positive and negative users near the boundaries also transform into more neutral stances when influenced by opinion leaders whose emotions do not coincide with their own. With the further influence of positive leaders, the number of negative users keeps descending. And neutral users also choose to believe the positive information. Eventually, most of the users participate in the diffusion and reach a consensus on the positive emotions.
Moreover, we screened some semantic users and visualized the change in their emotional distribution on propagation to analyze the influence of opinion leaders. As shown in Figure 7, though the initial number of positive leaders is less than that of negative leaders in the experimental setting, higher degrees still give them more powerful influence. Figure 7b shows that the individual nodes with contrasting colors in Figure 7a eventually converge to a similar color. Orange means a weak positive emotion, which is calm but shows emotional polarity. This illustrates that the final emotions in the social network began to solidify, and positive emotions received popular recognition. It implies the information has been fully disseminated and exchanged, which makes a great impact on both positive and negative users. This reveals two laws and is consistent with actual propagation phenomena. (1) Opinion leaders play a key role in emotional propagation. Even if their number is small, their powerful influence can still control the emotional trend of the whole social network. (2) The emotions of users will influence each other rather than remain unchanged. A user who receives more and more information from others over time will gradually grasp the full picture of the event and update his emotions about it. Such an emotional swing fosters discussions of events among all users in the social network, eventually leading to weak and similar emotions as the clues to events become more evident.

5. Theoretical and Practical Implications

In this section, we provide a discussion of the theoretical and practical implications of this paper.

5.1. Theoretical Implication

Emotional propagation is a foundational problem in social network analysis and offers theoretical insights and explanations for social sentiment mining applications. Our work focuses on emotional propagation over long periods of time in a competitive environment. Different from the existing models with a predetermined time window, our proposed model places a significant emphasis on simulating the emotional propagation among users across continuous time. In addition, previous research on the competitive influence maximization problem usually assumed that users’ emotions remained static once confirmed. However, due to the influence of opinion leaders in the social network, users often develop different opinions on the same event after they receive new information. This poses difficulties in observing the process of users’ emotional change. Our research demonstrates that introducing the time effect to calculate user emotions in a competitive environment is feasible.
At the methodology level, we propose the DepIc model. Based on the explanation of the three key factors that affect information diffusion through the reinforced Poisson process, our work extended the propagation rules based on the independent cascade model to support the emotional changes that occur during the propagation process for users in a competitive environment. Then, an emotional computing method was proposed to depict the influence of opinion leaders on other users. Finally, we utilized and discussed the role of different time-decay functions to further improve the prediction performance of emotional propagation. Inspired by the interpretable factors of the reinforced Poisson process, our research shows that opinion leaders and the time-decay effect enhance predicting emotional propagation, helping the public understand and analyze the trends in social opinion.

5.2. Practical Implication

The results can help with decision-making on social media about harmful information control or advertising recommendations. We discussed the influence of various parameters on emotional propagation in a simulation experiment on the BA network and verified the performance of the proposed DepIC model on two real public datasets: Wiki and Bitcoin-OTC. Our method achieves a better result for the F1-score and the MAPE metric compared to the baselines. The case study of our experiment also demonstrates the interpretability of our method. Users exchange their opinions under the influence of opinion leaders. After sufficiently long periods of time, the users’ emotions would tend to be consistent and decrease in intensity. This corresponds to the fact mentioned by Wu and Huberman [23] that the novelty of a story would fade over time, and fewer individuals would devote their attention to it. The results can provide inspiration for downstream applications such as influence maximization and harmful information immunization. In situations with limited budgets, timely intervention and the selection of top opinion leaders can better spread influence in a competitive environment.

6. Conclusions

We suggested a dynamic emotional propagation model based on an independent cascade in a competitive environment in this paper. The primary creative idea is that the proposed model describes a continuous emotional propagation method for the IC model and simulates the influence of time decay. Experiments on an artificial network and two public real-world datasets provided analyses about the effects of different parameters and confirmed that our model is useful. In the future, we intend to realize some applications like influence maximization based on the proposed model to further explore information diffusion tasks in the social network.

Author Contributions

Conceptualization, Z.C. and B.X.; methodology, Z.C.; software, Z.C.; validation, T.C. and Z.Y.; formal analysis, Z.C.; investigation, Z.C.; resources, X.L.; data curation, Z.C.; writing—original draft preparation, Z.C.; writing—review and editing, B.X. and T.C.; visualization, Z.C.; supervision, X.L.; project administration, X.L.; funding acquisition, X.L. All authors have read and agreed to the published version of the manuscript.

Funding

This research was funded by National Natural Science Foundation of China by FUNDER grant number 61976054.

Data Availability Statement

Data available in a publicly accessible repository that does not issue DOIs. Publicly available datasets were analyzed in this study. This data can be found here: http://snap.stanford.edu/data/wiki-Elec.html; http://snap.stanford.edu/data/soc-sign-bitcoin-otc.html.

Conflicts of Interest

The authors declare no conflict of interest.

References

  1. Dezecache, G.; Jacob, P.; Grèzes, J. Emotional contagion: Its scope and limits. Trends Cogn. Sci. 2015, 19, 297–299. [Google Scholar] [CrossRef] [PubMed]
  2. Hatfield, E.; Cacioppo, J.T.; Rapson, R.L. Emotional contagion. Curr. Dir. Psychol. Sci. 1993, 2, 96–100. [Google Scholar] [CrossRef]
  3. Bharathi, S.; Kempe, D.; Salek, M. Competitive Influence Maximization in Social Networks. In Proceedings of the Internet and Network Economics; Springer: Berlin/Heidelberg, Germany, 2007; Volume 4858, pp. 306–311. [Google Scholar] [CrossRef]
  4. Tu, S.; Neumann, S. A Viral Marketing-Based Model For Opinion Dynamics in Online Social Networks. In Proceedings of the ACM Web Conference 2022, WWW ’22. Association for Computing Machinery, Virtual, 25–29 April 2022; pp. 1570–1578. [Google Scholar] [CrossRef]
  5. Zhong, C.; Xiong, F.; Pan, S.; Wang, L.; Xiong, X. Hierarchical attention neural network for information cascade prediction. Inf. Sci. 2023, 622, 1109–1127. [Google Scholar] [CrossRef]
  6. Huang, L.; Ma, Y.; Liu, Y.; Danny Du, B.; Wang, S.; Li, D. Position-Enhanced and Time-Aware Graph Convolutional Network for Sequential Recommendations. ACM Trans. Inf. Syst. 2023, 41, 1–32. [Google Scholar] [CrossRef]
  7. Kermack, W.O.; McKendrick, A.G. A contribution to the mathematical theory of epidemics. Proc. R. Soc. London. Ser. A Contain. Pap. A Math. Phys. Character 1927, 115, 700–721. [Google Scholar] [CrossRef]
  8. Lü, L.; Chen, D.B.; Zhou, T. The small world yields the most effective information spreading. New J. Phys. 2011, 13, 123005. [Google Scholar] [CrossRef]
  9. Granovetter, M. Threshold models of collective behavior. Am. J. Sociol. 1978, 83, 1420–1443. [Google Scholar] [CrossRef]
  10. Goldenberg, J.; Libai, B.; Muller, E. Talk of the network: A complex systems look at the underlying process of word-of-mouth. Mark. Lett. 2001, 12, 211–223. [Google Scholar] [CrossRef]
  11. Shen, H.; Wang, D.; Song, C.; Barabási, A. Modeling and Predicting Popularity Dynamics via Reinforced Poisson Processes. In Proceedings of the Twenty-Eighth AAAI Conference on Artificial Intelligence, Québec City, QC, Canada, 27–31 July 2014; pp. 291–297. Available online: http://www.aaai.org/ocs/index.php/AAAI/AAAI14/paper/view/8370 (accessed on 5 November 2023).
  12. Nickel, M.; Le, M. Modeling Sparse Information Diffusion at Scale via Lazy Multivariate Hawkes Processes. In Proceedings of the Web Conference 2021 WWW ’21. Association for Computing Machinery, Ljubljana, Slovenia, 19–23 April 2021; pp. 706–717. [Google Scholar] [CrossRef]
  13. Dong, Y.; Zhan, M.; Kou, G.; Ding, Z.; Liang, H. A survey on the fusion process in opinion dynamics. Inf. Fusion 2018, 43, 57–65. [Google Scholar] [CrossRef]
  14. Clifford, P.; Sudbury, A. A model for spatial conflict. Biometrika 1973, 60, 581–588. [Google Scholar] [CrossRef]
  15. Galam, S.; Gefen, Y.; Shapir, Y. Sociophysics: A new approach of sociological collective behaviour. I. mean-behaviour description of a strike. J. Math. Sociol. 1982, 9, 1–13. [Google Scholar] [CrossRef]
  16. Sznajd-Weron, K.; Sznajd, J. Opinion evolution in closed community. Int. J. Mod. Phys. C 2000, 11, 1157–1165. [Google Scholar] [CrossRef]
  17. Wang, Q.; Lin, Z.; Jin, Y.; Cheng, S.; Yang, T. ESIS: Emotion-based spreader-ignorant-stifler model for information diffusion. Knowl. Based Syst. 2015, 81, 46–55. [Google Scholar] [CrossRef]
  18. Deffuant, G.; Neau, D.; Amblard, F.; Weisbuch, G. Mixing beliefs among interacting agents. Adv. Complex Syst. 2000, 3, 87–98. [Google Scholar] [CrossRef]
  19. Hegselmann, R.; Krause, U. Opinion dynamics and bounded confidence: Models, analysis and simulation. J. Artifical Soc. Soc. Simul. 2002, 5. Available online: http://jasss.soc.surrey.ac.uk/5/3/2.html (accessed on 5 November 2023).
  20. Moreno, Y.; Nekovee, M.; Vespignani, A. Efficiency and reliability of epidemic data dissemination in complex networks. Phys. Rev. E 2004, 69, 055101. [Google Scholar] [CrossRef]
  21. Chen, W.; Wang, Y.; Yang, S. Efficient influence maximization in social networks. In Proceedings of the 15th ACM SIGKDD International Conference on Knowledge Discovery and Data Mining, KDD ’09, Paris, France, 28 June–1 July 2009; pp. 199–208. [Google Scholar] [CrossRef]
  22. Xiong, X.; Li, Y.; Qiao, S.; Han, N.; Wu, Y.; Peng, J.; Li, B. An emotional contagion model for heterogeneous social media with multiple behaviors. Phys. A Stat. Mech. Its Appl. 2018, 490, 185–202. [Google Scholar] [CrossRef]
  23. Wu, F.; Huberman, B.A. Novelty and collective attention. Proc. Natl. Acad. Sci. USA 2007, 104, 17599–17601. [Google Scholar] [CrossRef]
  24. Li, H.; Xia, C.; Wang, T.; Wen, S.; Chen, C.; Xiang, Y. Capturing Dynamics of Information Diffusion in SNS: A Survey of Methodology and Techniques. ACM Comput. Surv. 2023, 55, 22:1–22:51. [Google Scholar] [CrossRef]
  25. Xiong, F.; Liu, Y.; Zhang, Z.J.; Zhu, J.; Zhang, Y. An information diffusion model based on retweeting mechanism for online social media. Phys. Lett. A 2012, 376, 2103–2108. [Google Scholar] [CrossRef]
  26. Zhang, H.; Guan, Z.H.; Li, T.; Zhang, X.H.; Zhang, D.X. A stochastic SIR epidemic on scale-free network with community structure. Phys. A Stat. Mech. Its Appl. 2013, 392, 974–981. [Google Scholar] [CrossRef]
  27. Kong, Q.; Rizoiu, M.A.; Xie, L. Modeling Information Cascades with Self-Exciting Processes via Generalized Epidemic Models. In Proceedings of the 13th International Conference on Web Search and Data Mining, WSDM ’20, Houston, TX, USA, 3–7 February 2020; pp. 286–294. [Google Scholar] [CrossRef]
  28. Weng, L.; Ratkiewicz, J.; Perra, N.; Gonçalves, B.; Castillo, C.; Bonchi, F.; Schifanella, R.; Menczer, F.; Flammini, A. The Role of Information Diffusion in the Evolution of Social Networks. In Proceedings of the 19th ACM SIGKDD International Conference on Knowledge Discovery and Data Mining, KDD ’13, Chicago, IL, USA, 11–14 August 2013; pp. 356–364. [Google Scholar] [CrossRef]
  29. Ohsaka, N.; Sonobe, T.; Fujita, S.; Kawarabayashi, K.i. Coarsening Massive Influence Networks for Scalable Diffusion Analysis. In Proceedings of the 2017 ACM International Conference on Management of Data, SIGMOD ’17, Singapore, 6–10 November 2017; pp. 635–650. [Google Scholar] [CrossRef]
  30. Saito, K.; Ohara, K.; Yamagishi, Y.; Kimura, M.; Motoda, H. Learning Diffusion Probability Based on Node Attributes in Social Networks. In Proceedings of the Foundations of Intelligent Systems, ISMIS 2011, Warsaw, Poland, 28–30 June 2011; Volume 6804, pp. 153–162. [Google Scholar] [CrossRef]
  31. Liu, S.; Shen, H.; Zheng, H.; Cheng, X.; Liao, X. CT LIS: Learning Influences and Susceptibilities through Temporal Behaviors. ACM Trans. Knowl. Discov. Data 2019, 13, 57:1–57:21. [Google Scholar] [CrossRef]
  32. Zhang, H.; Yao, Y.; Tang, W.; Zhu, J.; Zhang, Y. Opinion-aware information diffusion model based on multivariate marked Hawkes process. Knowl.-Based Syst. 2023, 279, 110883. [Google Scholar] [CrossRef]
  33. Pierri, F.; Piccardi, C.; Ceri, S. Topology comparison of Twitter diffusion networks effectively reveals misleading information. Sci. Rep. 2020, 10, 1372. [Google Scholar] [CrossRef]
  34. Bhowmick, A.K. Temporal Pattern of Retweet(s) Help to Maximize Information Diffusion in Twitter. In Proceedings of the 13th International Conference on Web Search and Data Mining, WSDM ’20, Houston, TX, USA, 3–7 February 2020; pp. 913–914. [Google Scholar] [CrossRef]
  35. Bourigault, S.; Lamprier, S.; Gallinari, P. Representation Learning for Information Diffusion through Social Networks: An Embedded Cascade Model. In Proceedings of the Ninth ACM International Conference on Web Search and Data Mining, San Francisco, CA, USA, 22–25 February 2016; pp. 573–582. [Google Scholar] [CrossRef]
  36. Li, C.; Ma, J.; Guo, X.; Mei, Q. DeepCas: An End-to-End Predictor of Information Cascades. In Proceedings of the 26th International Conference on World Wide Web, WWW ’17, Perth, Australia, 3–7 April 2017; pp. 577–586. [Google Scholar] [CrossRef]
  37. Cao, Q.; Shen, H.; Cen, K.; Ouyang, W.; Cheng, X. DeepHawkes: Bridging the Gap between Prediction and Understanding of Information Cascades. In Proceedings of the 2017 ACM on Conference on Information and Knowledge Management, CIKM ’17, Singapore, 6–10 November 2017; pp. 1149–1158. [Google Scholar] [CrossRef]
  38. Wang, Z.; Li, W. Hierarchical Diffusion Attention Network. In Proceedings of the Twenty-Eighth International Joint Conference on Artificial Intelligence, IJCAI 2019, Macao, China, 10–16 August 2019; pp. 3828–3834. [Google Scholar] [CrossRef]
  39. Yuan, C.; Li, J.; Zhou, W.; Lu, Y.; Zhang, X.; Hu, S. DyHGCN: A Dynamic Heterogeneous Graph Convolutional Network to Learn Users’ Dynamic Preferences for Information Diffusion Prediction. In Proceedings of the Machine Learning and Knowledge Discovery in Databases—European Conference, ECML PKDD 2020, Ghent, Belgium, 14–18 September 2020; Volume 12459, pp. 347–363. [Google Scholar] [CrossRef]
  40. Tang, X.; Liao, D.; Huang, W.; Xu, J.; Zhu, L.; Shen, M. Fully Exploiting Cascade Graphs for Real-time Forwarding Prediction. In Proceedings of the AAAI Conference on Artificial Intelligence, Virtually, 2–9 February 2021; Volume 35, pp. 582–590. [Google Scholar] [CrossRef]
  41. Jain, L.; Katarya, R.; Sachdeva, S. Opinion Leaders for Information Diffusion Using Graph Neural Network in Online Social Networks. ACM Trans. Web 2023, 17, 1–37. [Google Scholar] [CrossRef]
  42. Chen, W.; Lu, W.; Zhang, N. Time-Critical Influence Maximization in Social Networks with Time-Delayed Diffusion Process. In Proceedings of the Twenty-Sixth AAAI Conference on Artificial Intelligence, Toronto, ON, Canada, 22–26 July 2012; pp. 592–598. Available online: http://www.aaai.org/ocs/index.php/AAAI/AAAI12/paper/view/5024 (accessed on 5 November 2023).
  43. Zhang, Z.; Zhao, W.; Yang, J.; Paris, C.; Nepal, S. Learning Influence Probabilities and Modelling Influence Diffusion in Twitter. In Proceedings of the Companion of the 2019 World Wide Web Conference, WWW 2019, San Francisco, CA, USA, 13–17 May 2019; pp. 1087–1094. [Google Scholar] [CrossRef]
  44. Yan, Z.; Zhou, X.; Ren, J.; Zhang, Q.; Du, R. Identifying underlying influential factors in information diffusion process on social media platform: A hybrid approach of data mining and time series regression. Inf. Process. Manag. 2023, 60, 103438. [Google Scholar] [CrossRef]
  45. Liu, Y.; Gao, J.; Zhao, Z.; Li, J.; Yue, Z. Understanding information diffusion with psychological field dynamic. Inf. Process. Manag. 2022, 59, 102956. [Google Scholar] [CrossRef]
  46. Fatemi, B.; Molaei, S.; Pan, S.; Rahimi, S.A. GCNFusion: An efficient graph convolutional network based model for information diffusion. Expert Syst. Appl. 2022, 202, 117053. [Google Scholar] [CrossRef]
  47. Lee, D.; Chang, C.; Liu, Y. Consensus and Polarization of Binary Opinions in Structurally Balanced Networks. IEEE Trans. Comput. Soc. Syst. 2016, 3, 141–150. [Google Scholar] [CrossRef]
  48. Basu, R.; Sly, A. Evolving voter model on dense random graphs. Ann. Appl. Probab. 2017, 27, 1235–1288. [Google Scholar] [CrossRef]
  49. Yin, F.; Xia, X.; Pan, Y.; She, Y.; Feng, X.; Wu, J. Sentiment mutation and negative emotion contagion dynamics in social media: A case study on the Chinese Sina Microblog. Inf. Sci. 2022, 594, 118–135. [Google Scholar] [CrossRef]
  50. Dong, Y.; Ding, Z.; Martínez-López, L.; Herrera, F. Managing consensus based on leadership in opinion dynamics. Inf. Sci. 2017, 397, 187–205. [Google Scholar] [CrossRef]
  51. Gu, Y.; Sun, Y.; Gao, J. The Co-Evolution Model for Social Network Evolving and Opinion Migration. In Proceedings of the 23rd ACM SIGKDD International Conference on Knowledge Discovery and Data Mining, Association for Computing Machinery, Halifax, NS, Canada, 13–17 August 2017; pp. 175–184. [Google Scholar] [CrossRef]
  52. Du, Y.; Wang, Y.; Hu, J.; Li, X.; Chen, X. An emotion role mining approach based on multiview ensemble learning in social networks. Inf. Fusion 2022, 88, 100–114. [Google Scholar] [CrossRef]
  53. Liang, D.; Duan, W. Large-scale three-way group consensus decision considering individual competition behavior in social networks. Inf. Sci. 2023, 641, 119077. [Google Scholar] [CrossRef]
  54. Wang, X.; Jin, D.; Musial, K.; Dang, J. Topic Enhanced Sentiment Spreading Model in Social Networks Considering User Interest. In Proceedings of the AAAI Conference on Artificial Intelligence, New York, NY, USA, 7–12 February 2020; pp. 989–996. Available online: https://ojs.aaai.org/index.php/AAAI/article/view/5447 (accessed on 5 November 2023).
  55. Gomez-Rodriguez, M.; Balduzzi, D.; Schölkopf, B. Uncovering the Temporal Dynamics of Diffusion Networks. In Proceedings of the 28th International Conference on Machine Learning, ICML 2011, Bellevue, WA, USA, 28 June–2 July 2011; pp. 561–568. Available online: https://icml.cc/2011/papers/354_icmlpaper.pdf (accessed on 5 November 2023).
  56. Barabási, A.L.; Albert, R. Emergence of Scaling in Random Networks. Science 1999, 286, 509–512. [Google Scholar] [CrossRef]
  57. Leskovec, J.; Huttenlocher, D.P.; Kleinberg, J.M. Signed networks in social media. In Proceedings of the 28th International Conference on Human Factors in Computing Systems, Atlanta, GA, USA, 10–15 April 2010; pp. 1361–1370. [Google Scholar] [CrossRef]
  58. Leskovec, J.; Huttenlocher, D.P.; Kleinberg, J.M. Predicting positive and negative links in online social networks. In Proceedings of the 19th International Conference on World Wide Web, WWW 2010, Raleigh, NC, USA, 26–30 April 2010; pp. 641–650. [Google Scholar] [CrossRef]
  59. Kumar, S.; Spezzano, F.; Subrahmanian, V.S.; Faloutsos, C. Edge Weight Prediction in Weighted Signed Networks. In Proceedings of the IEEE 16th International Conference on Data Mining, ICDM 2016, Barcelona, Spain, 12–15 December 2016; pp. 221–230. [Google Scholar] [CrossRef]
  60. Kumar, S.; Hooi, B.; Makhija, D.; Kumar, M.; Faloutsos, C.; Subrahmanian, V.S. REV2: Fraudulent User Prediction in Rating Platforms. In Proceedings of the Eleventh ACM International Conference on Web Search and Data Mining, WSDM 2018, Marina Del Rey, CA, USA, 5–9 February 2018; pp. 333–341. [Google Scholar] [CrossRef]
  61. Matsubara, Y.; Sakurai, Y.; Prakash, B.A.; Li, L.; Faloutsos, C. Rise and fall patterns of information diffusion: Model and implications. In Proceedings of the 18th ACM SIGKDD International Conference on Knowledge Discovery and Data Mining, KDD ’12, Beijing, China, 12–16 August 2012; pp. 6–14. [Google Scholar] [CrossRef]
Figure 1. A motivating example of emotional propagation based on the IC model. A and B are the original active users with positive and negative emotions, respectively. It is possible that active user D is influenced by A, but there is also a potential scenario where B influences D through C over time. E is inactive as it disapproves of B.
Electronics 12 04937 g001
Figure 2. The process of emotional propagation over time.
Electronics 12 04937 g002
Figure 3. The degree distributions of different networks.
Electronics 12 04937 g003
Figure 4. How the activation intensity α affects the growth of the proportion of positive emotions with different parameters.
Electronics 12 04937 g004
Figure 5. How the time-decay functions affect the growth of the proportion of positive emotions with different parameters.
Electronics 12 04937 g005
Figure 6. The emotional propagation process of proposed model at each step.
Electronics 12 04937 g006
Figure 7. The process of emotional propagation of the proposed model in the Bitcoin-OTC dataset. Users with with positive, neutral, and negative emotions are represented by red, yellow, and blue color, respectively. The larger the node in the graph, the greater its out-degree, which means more powerful influence.
Electronics 12 04937 g007
Table 1. Summary of information diffusion.
Time-Series/Data-DrivenMethodContributionsReference
Time-seriesSIR-basedDistinguished the different states of individuals during information diffusion on a macroscopic scale [25,26,27]
Graph modelsObserved how individuals affect each other on a microscopic scale [28,29,30]
Stochastic processesModeled the time effect and exciting mechanism [11,12,31,32]
Data-drivenFeature learningCaptured the representative features to reveal important factors influencing information diffusion [33,34,35]
Deep learningImproved prediction accuracy with neural networks [36,37,38,39,40,41]
Table 2. Summary of emotional propagation.
Discrete/Continuous ModelsMethodContributionsReference
DiscreteBinary classificationEstablished fundamental emotional propagation rules between individuals [14,15,16,47,48]
Multi-classificationExpanded more categories to describe fine-grained emotions [17,49]
ContinuousNeighbor-basedImproved the case for either positive or negative in the discrete approach [18,19]
Network-basedExpanded the scale of emotional propagation abilities to portray complex social phenomena. [22,50,51,52,53]
Table 3. Statistics of datasets.
DatasetsNodesEdgesAvg_DegreePositiveEmotions NeutralNegative
BA Network200059915.991---
WIKI7194110,08730.60549261332936
Bitcoin-OTC588135,59212.1045159169553
Table 4. The settings of parameters.
ParametersWikiBitcoin-OTC
Activation Intensity α 0.150.3
Positive Emotion Intensity β p o s 0.20.35
Negative Emotion Intensity β n e g 0.10.25
Time Decay factor θ 0.0030.003
Maximum Propagation Step T8080
Table 5. Performance comparison between our proposed model and baselines on Wiki and Bitcoin-OTC. Results are evaluated by Precision, Recall, F1-score, and MAPE for different categories of models on the emotional propagation task. Note that the prediction performance improves with decreasing MAPE. For the other metrics, higher scores are better.
DatasetsWIKI Bitcoin-OTC
MetricsPrecisionRecallF1-scoreMAPEPrecisionRecallF1-scoreMAPE
ESIS0.8150.5760.6750.3600.9630.7470.8410.792
eIC0.7410.3360.4620.6750.9570.2720.4242.537
TSSM0.8130.6840.7430.1960.8740.9640.9170.367
DepIC0.7390.8210.7780.1370.8790.9660.9210.354
↓ means that the lower the value, the better.
Disclaimer/Publisher’s Note: The statements, opinions and data contained in all publications are solely those of the individual author(s) and contributor(s) and not of MDPI and/or the editor(s). MDPI and/or the editor(s) disclaim responsibility for any injury to people or property resulting from any ideas, methods, instructions or products referred to in the content.

