Article

Blind Super-Resolution Network with Dual-Channel Attention for Images Captured by Sub-Millimeter-Diameter Fiberscope

1
Science and Technology on Electronic Test and Measurement Laboratory, North University of China, Taiyuan 030051, China
2
School of Aerospace Engineering, North University of China, Taiyuan 030051, China
*
Authors to whom correspondence should be addressed.
Electronics 2023, 12(20), 4352; https://doi.org/10.3390/electronics12204352
Submission received: 18 September 2023 / Revised: 18 October 2023 / Accepted: 18 October 2023 / Published: 20 October 2023
(This article belongs to the Section Computer Science & Engineering)

Abstract

:
A blind super-resolution network with dual-channel attention is proposed for images captured by the 0.37 mm diameter sub-millimeter fiberscope. The fiberscope can used in scenarios where other image acquisition devices cannot be applied based on its flexible, soft, and minimally invasive characteristics. However, the images have black reticulated noise and only 3000 pixels. To improve image quality, the Butterworth band-stop filter is used to reduce the frequency of the reticulated noise. By optimizing the blind super-resolution model, high-quality images can be reconstructed that do not require a lot of synthetic paired fiberscope image data. Perceptual loss is utilized as a loss function, and channel and spatial attention mechanisms are introduced to the model to enhance the high-frequency detail information of the reconstructed image. In the comparative experiment with other methods, our method showed improvements of 2.25 in peak signal-to-noise ratio (PSNR) and 0.09 in structural similarity (SSIM) based on objective evaluation metrics. The learned perceptual image patch similarity (LPIPS) based on learning was reduced by 0.6. Furthermore, four different methods were used to enhance the resolution of the fiberscope images by a factor of four. The results of this paper improve the information entropy and Laplace clarity by 0.44 and 2.54, respectively, compared to the average of other methods. Validation results show that the approach in this paper is more applicable to sub-millimeter-diameter fiberscopes.

1. Introduction

The sub-millimeter-diameter fiberscope is a miniature endoscope that transmits images through fiber optics and consists of an eyepiece, a cold light source, a fiber-optic bundle, a CCD, and a probe, as shown in Figure 1a. The light is sent from the cold light source to the target region through the fiber-optic bundles. Then, the probe focuses the light and collects optical information. Following this, the fiber optic transports the light signal to the eyepiece, and the CCD converts the signal into an electrical signal. Finally, the imaging system transmits the electronic signals to an external imaging device where the images are processed by filtering, noise reduction, and magnification for the user to observe. Compared to the traditional endoscope, the sub-millimeter-diameter fiberscope is thinner, more flexible, softer, more portable, and less invasive, which makes it suitable for narrow spaces. Based on these features, the sub-millimeter-diameter fiberscope possesses a wide range of application scenarios in medical and industrial fields [1,2,3]. For example, it can be applied to the checking of the digestive tract system. Due to its thinner diameter and softer material, it can enter the body through small incisions or body cavities to assist in surgical treatment, reducing patient discomfort, trauma, and recovery time. It may become the next generation of minimally invasive surgical endoscopes [4,5]. It is possible to address medical problems by applying deep learning technology to medical image data with the advancement of artificial intelligence. By enabling automatic analysis, diagnosis, and prediction of conditions and improving the quality of medical images, it could ultimately help doctors with disease diagnosis and analysis [6]. However, the image captured by the sub-millimeter-diameter has black reticulated noise because each fiber-optic bundle transmits a signal point of light. The percentage of noise in the image increases as the diameter of the fiberscope decreases, affecting the image quality and user experience. There is also a close relationship between the diameter of the fiberscope and the resolution of the image. The fiber-optic bundle has a fixed diameter, so the thinner fiberscope, the less fiber is used to capture the image. Thus, the image captured by a sub-millimeter-diameter fiberscope with a diameter of 0.37 mm has only 3000 pixels. The above disadvantages result in less detailed information in the captured images.
Image noise reduction is an important part of improving image quality. Because spatial filtering works directly on the pixels in the image, it is less complex and is often used to deal with image noise, such as median filtering, mean filtering, and Gaussian filtering [7,8,9,10]. However, the resulting images may be blurred due to kernel effects. Frequency domain filtering is the process that transforms the image into the Fourier domain. Since the noise in endoscopic images is regular, the range of noise in the frequency domain can be reduced [11,12]. Image resolution can be improved at a lower cost than optimizing the fiber-optic bundles manufacturing process by using image post-processing methods. Interpolation-based methods, such as bilinear interpolation and bicubic interpolation [13,14], simplify the image super-resolution (SR) [15] problem and lead to blurring and distortion. With the development of neural networks, many excellent algorithms have made significant breakthroughs in the field of image SR, such as SRCNN, ESPCN, and SRGAN [16,17,18]. These network models achieve SR by finding the mapping relationship between lots of low-resolution (LR) images and high-resolution (HR) images. However, these deep learning methods are unsuitable for processing images captured by sub-millimeter-diameter fiberscopes with complex blur kernels. Moreover, the HR images in the training data were processed using the ground truth kernel, making the model inapplicable to the images acquired in real scenarios. To address the above problems in practical scenes, many blind super-resolution methods have been proposed [19,20,21]. These methods are trained for estimating blur kernels and recovering super-resolution images. The blur kernel was obtained using only a limited number of LR images, resulting in unsatisfactory results of the generated SR images. Recently, an excellent blind super-resolution network [22] has been proposed that uses alternative restorer and estimator modules to obtain more realistic blur kernels and improve the ability of the model to reconstruct the SR image. Although the performance of this network is good, it used mean absolute deviation as the loss function in the training process, which may lead to over-enhancement of the image, introduction of noise with inappropriate details, and ultimately, an unsmooth reconstructed image. Moreover, only the channel attention mechanism is used in the training process, ignoring the information of the spatial feature map.
This research sequentially employs a Butterworth band-stop filter and an optimized blind super-resolution network to address the reticulated noise and low-resolution issues discussed above. The captured fiberscope images were Fourier transformed, and the Butterworth band-stop filter reduced its reticulated noise. Then, the filtered spectrogram is inverted and input into the blind super-resolution model for processing. We use perceptual loss based on mean square error as the loss function to make the reconstructed image more detailed and natural. Spatial and channel attention mechanisms are incorporated into the network to make the model pay more attention to more significant areas and channels in the image while reducing redundancy and noise. The detailed perception of the model is improved for better recovery and enhancement of details and high-frequency information. By applying the above method to fiberscope images, the resolution can be improved while removing reticulated noise. Finally, this paper also compares objective evaluation metrics of different methods applied to public datasets and referenced and unreferenced evaluation metrics of practical image reconstruction results. In summary, the main contributions of our work are as follows:
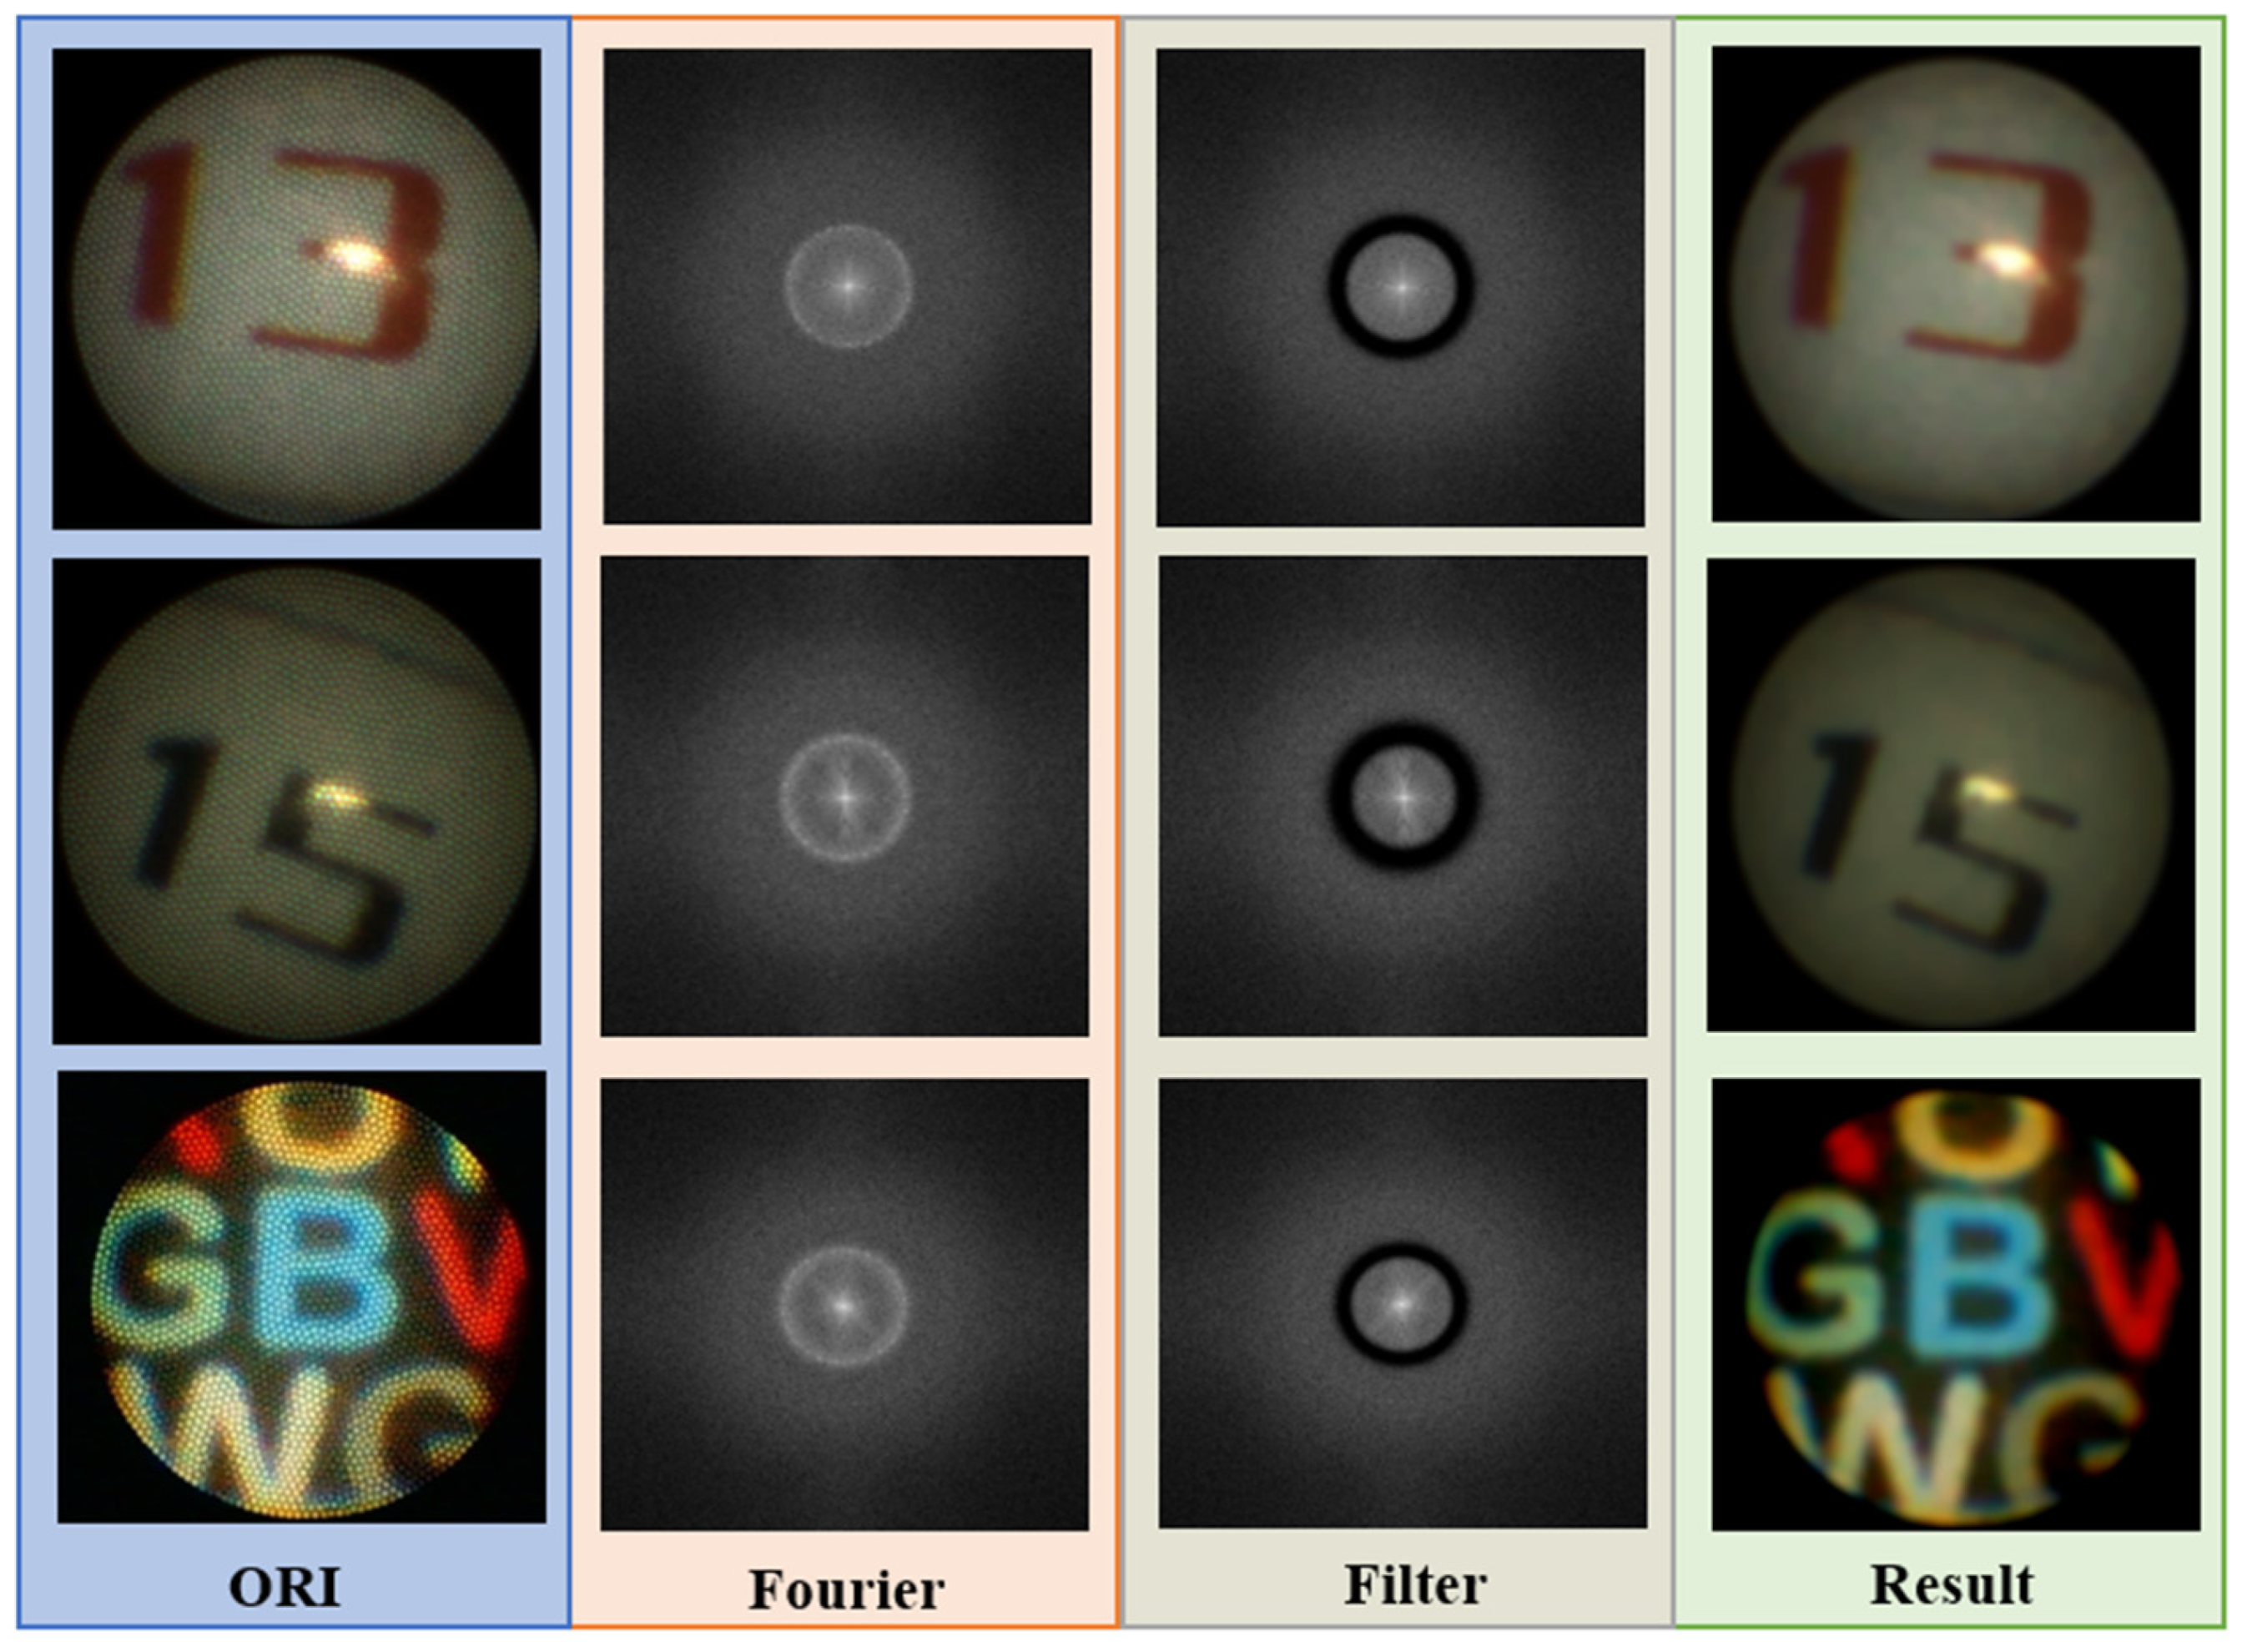
  • The acquired sub-millimeter-diameter fiberscope images were Fourier transformed, and the reticulated noise was reduced from the images by employing a Butterworth band-stop filter in the frequency domain.
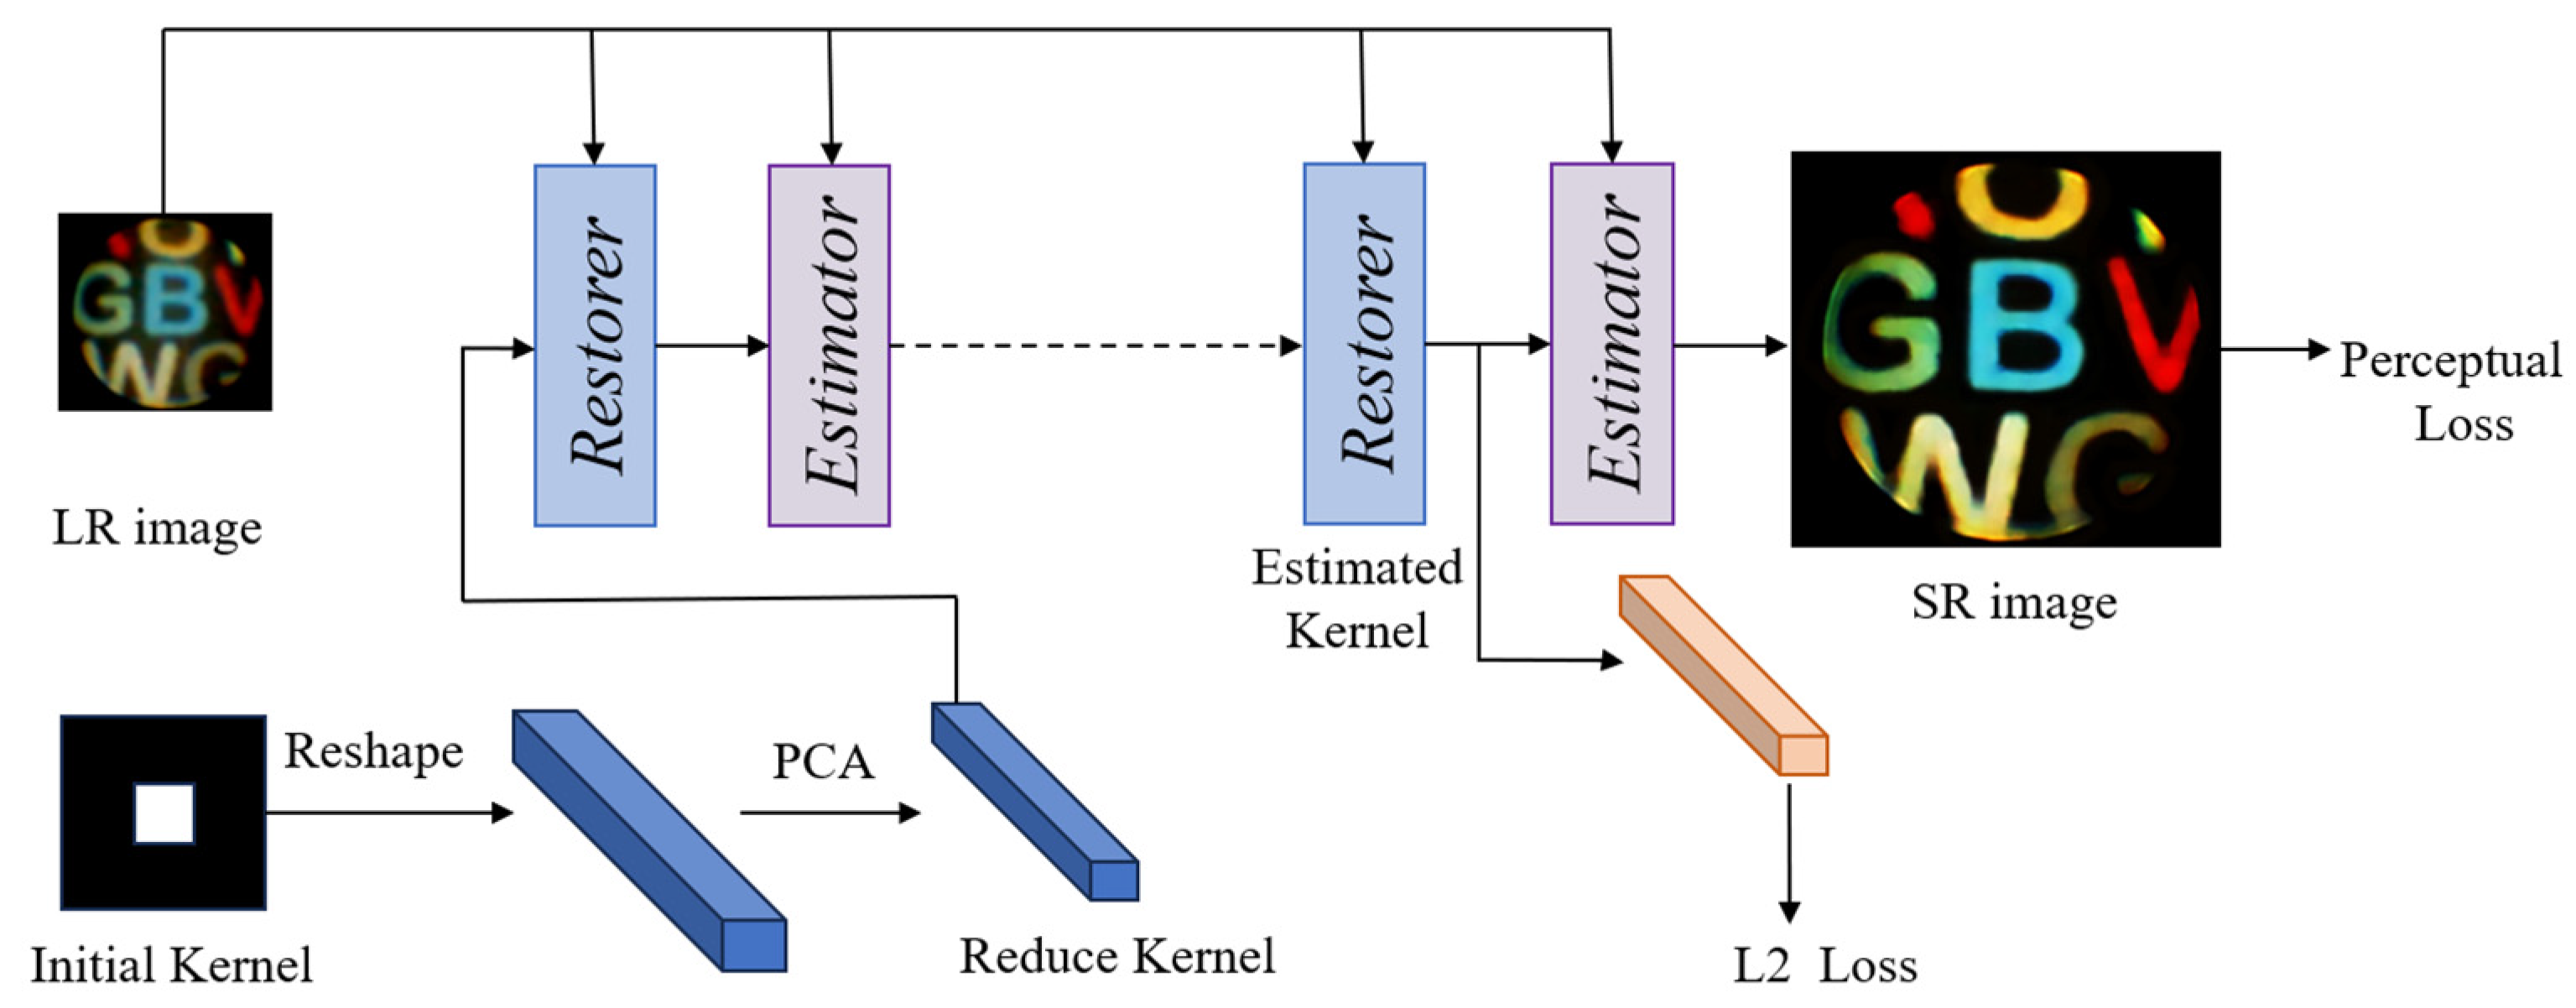
  • To prevent the resulting image from becoming smooth and to preserve more details, the perceptual loss based on image features is employed as a loss function throughout the model training phase. In addition, the generated image gets more realistic by concentrating on the perceived quality of the image.
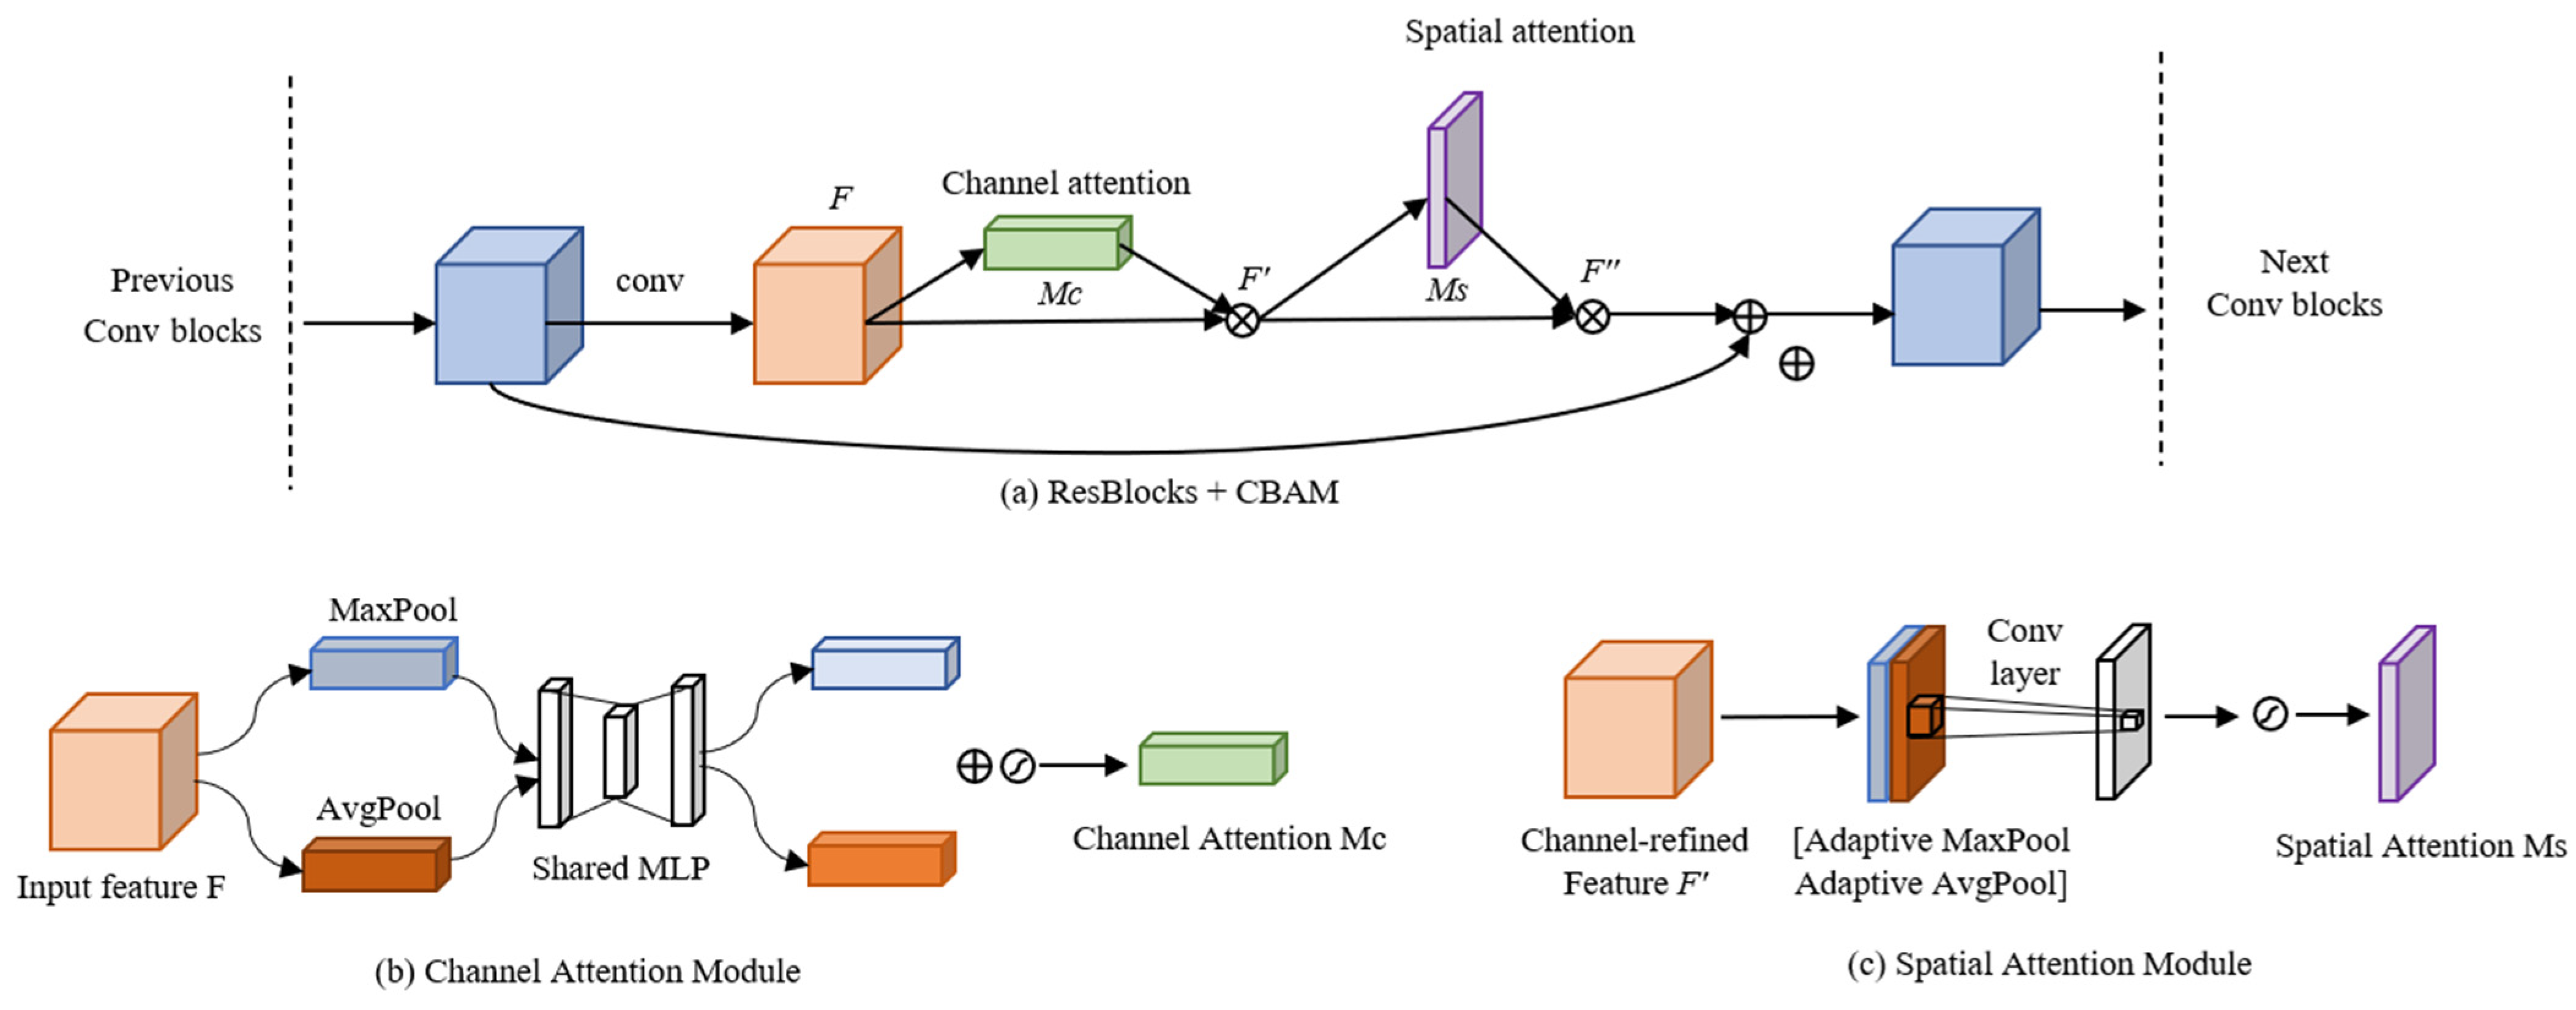
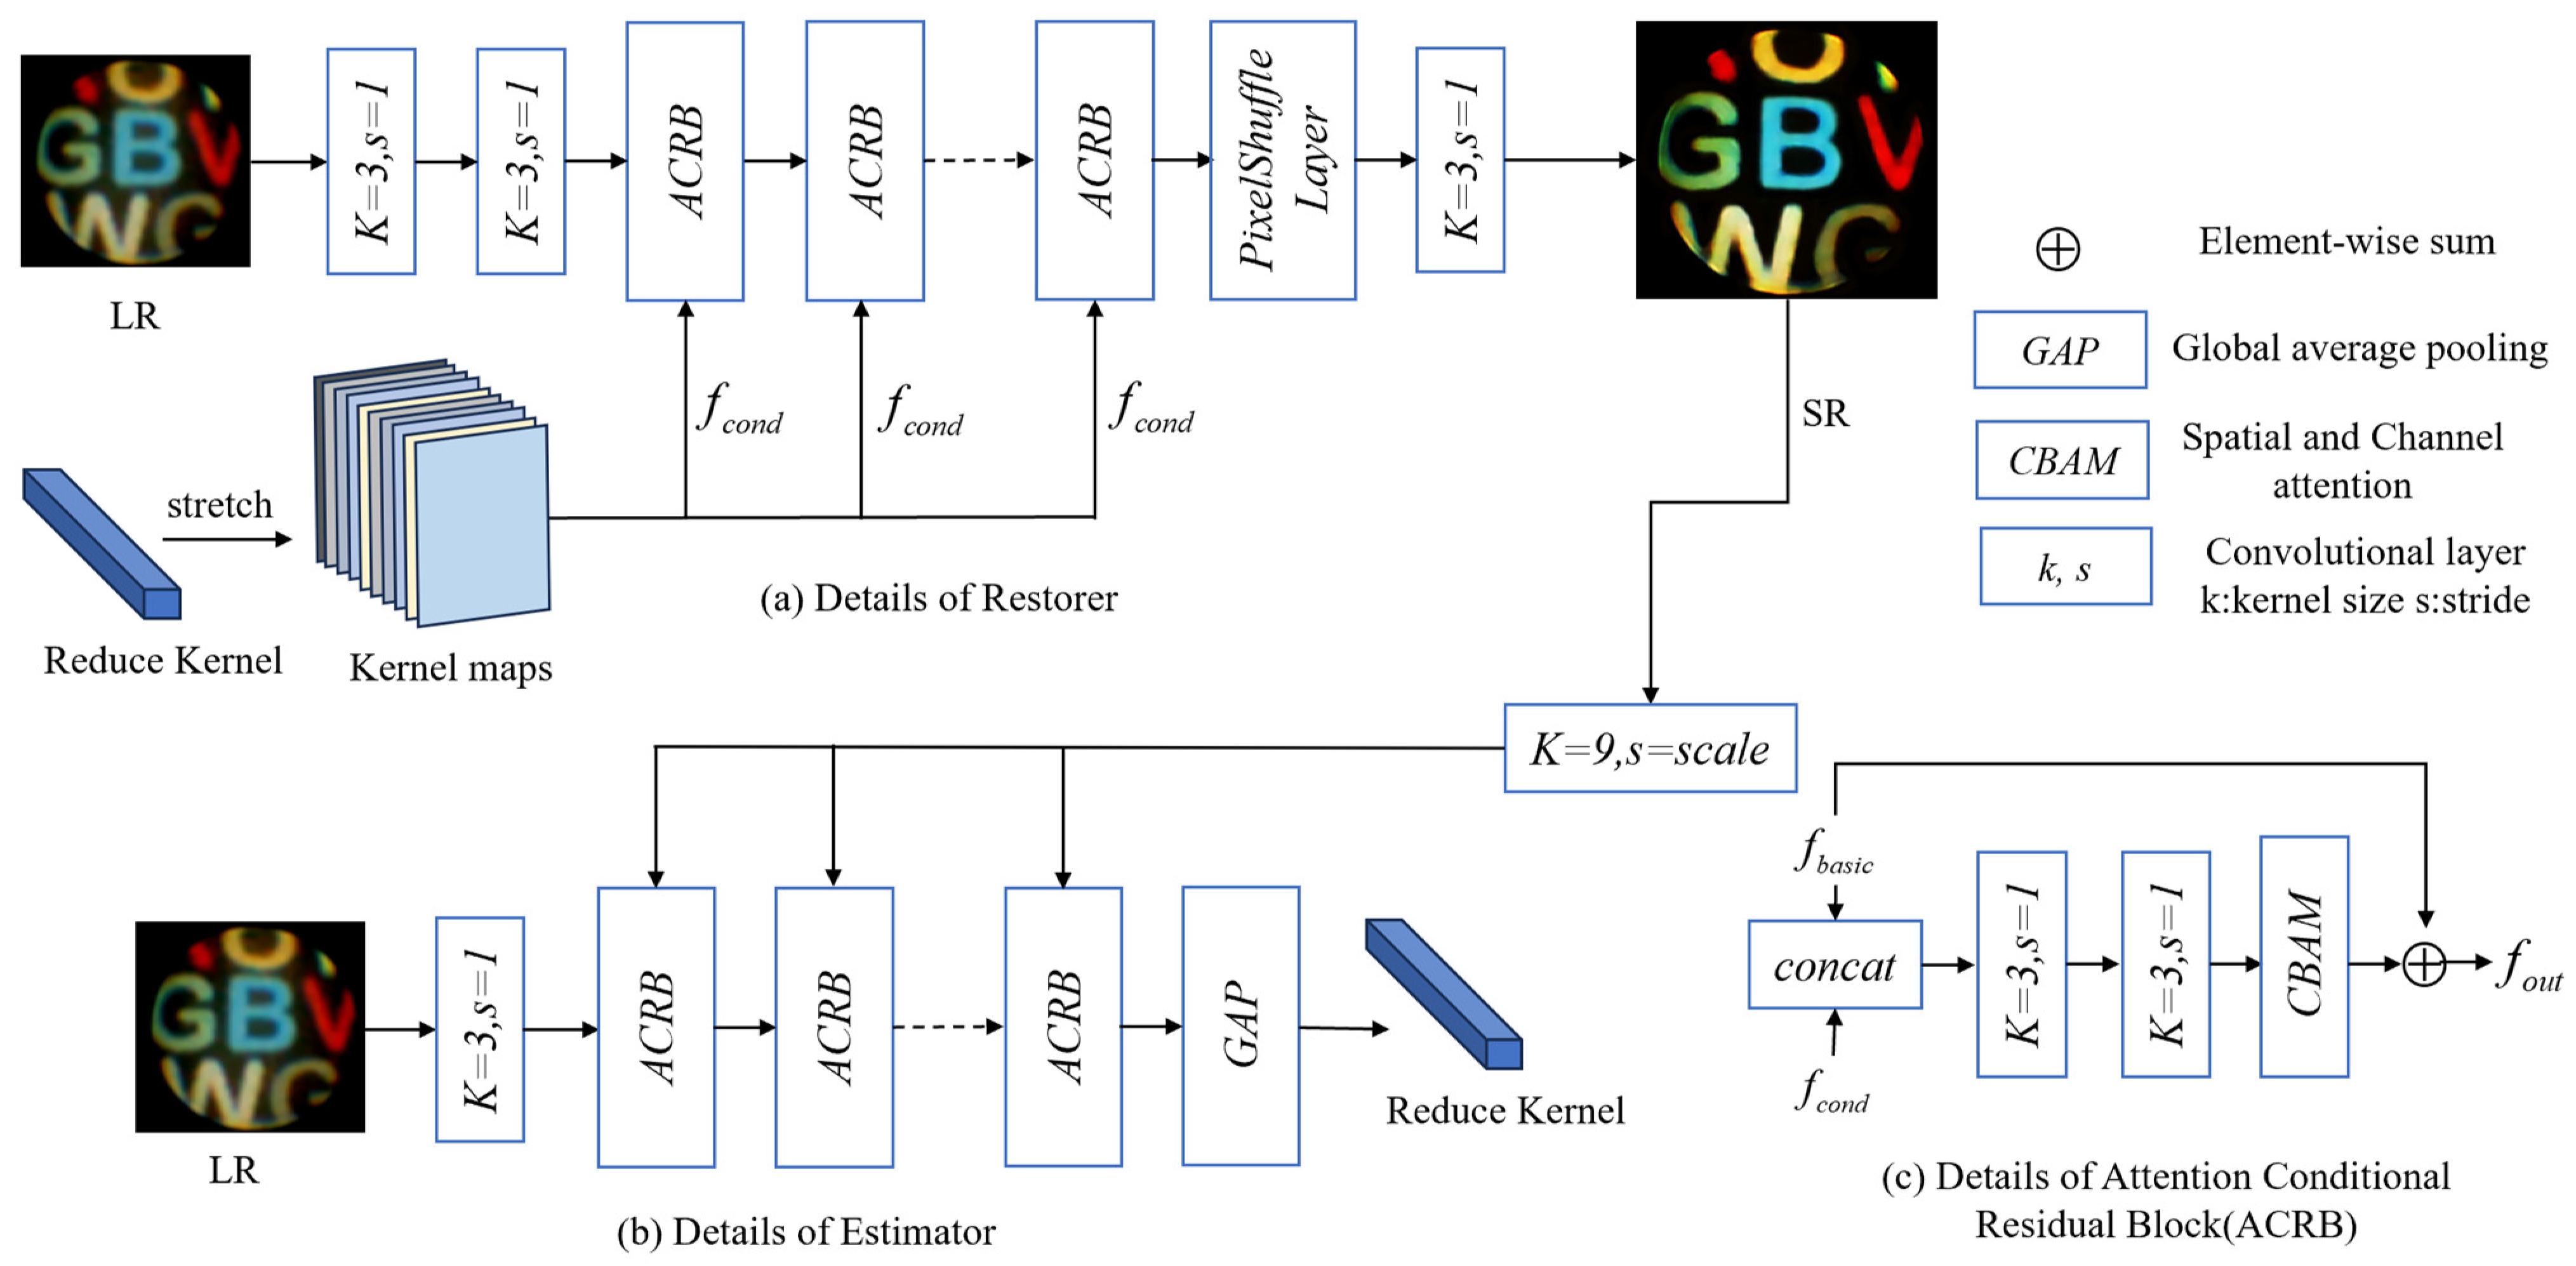
  • The generalization and robustness of the model are enhanced by adding spatial and channel attention mechanisms. In this way, the model’s attention is drawn more to the image’s more crucial regions and channel characteristics when reconstructing the image.

2. Experimental Principle and Method

2.1. Butterworth Band-Stop Filter

The sub-millimeter fiberscope with a diameter of 0.37 mm shown in Figure 1b. Due to the special fabrication process of the fiberscope, each fiber transmits light independently, and the information transmitted by all the fibers is combined to form a complete image. So, there is reticulated noise in the images captured by the sub-millimeter-diameter fiberscope.
The reticulated noise appears as a regular texture in the image and degrades the image quality, as shown in the Figure 2 original (ORI) images. Reticulated noise can be reduced by post-processing, such as applying spatial filters and frequency domain filters. Spatial filtering makes the image blurrier and loses high-frequency information due to the size of the kernel. Therefore, a more appropriate Butterworth band-stop filter [23] is used to reduce the noise at specific frequencies. The formula is as follows Equation (1):
H ( u , v ) = 1 1 + [ D ( u , v ) W D 2 ( u , v ) C 0 2 ]
The C 0 denotes the center of the frequency band, W is the bandwidth, and D ( u , v ) represents the distance from the mid-point ( u , v ) in the frequency to the center of the band-stop function.
Figure 2 shows three images captured by the fiberscope for the reticulated-noise reduction process. The original images were first Fourier transformed into the frequency domain. From the Fourier-transformed images in Figure 2, it can be observed that the frequency range of the reticulated noise is represented as a bright circle. Then, the Butterworth band-stop filter is used to process the spectrum images, as shown in Figure 2 (Filter). Finally, the filtered result is inverse transformed to the result images shown in Figure 2. From the result, it can be seen that there is no apparent reticulated noise in the image.

2.2. Blind Super-Resolution Network with Dual-Channel Attention

The sub-millimeter fiberscope with a diameter of 0.37 mm used in this paper captured images of only 3000 pixels. Since the diameter of the fiber-optic bundle is fixed, the number of fiber-optic bundles decreases as the diameter of the fiberscope becomes thinner, which reduces the image resolution. It is possible to enhance the resolution of the captured images by upgrading the production process of fiber-optic bundles, but the cost is expensive. Otherwise, increasing the number of fiber-optic bundles can also improve image resolution, which will cause the sub-millimeter-diameter fiberscope to lose its minimally invasive character. Image post-processing is less expensive than upgrading the fiberscope hardware. With the advancement of deep learning, it is now possible to recover more details from LR images using an image super-resolution method, boosting the visual impact and information. When signals are transmitted through optical fibers, part of the signal is lost due to the thin diameter of the fiber, resulting in a blurred image. The pixels of the image decrease as the number of fiber bundles is reduced, and there is also reticulated noise in the image. Therefore, the degradation process of a sub-millimeter-diameter fiberscope image can be expressed by the following equation [24]:
I L R = ( I H R k ) s + n
The HR image I H R is convolved with the blur kernel k to obtain the blurred image, the downsampling s is performed to reduce the image resolution, and the reticulated noise n is added to obtain the sub-millimeter-diameter fiberscope LR image I L R .
Blind super-resolution is based on LR images for estimation and reconstruction [20]. It can learn feature information from the LR image to reconstruct without the original HR image. According to Formula (2), it is known that the super-resolution training model is the process of solving the SR image I S R , k, and n. The noise n in the image can be reduced by the denoising algorithm [25]. This paper uses the Butterworth band-stop filter to reduce the reticulated noise. Thus, super-resolution needs to solve for I S R and k; its solution process can be optimized using the following formula:
arg min k , x | | I L R ( I S R k ) s | | 2 2 + ϕ ( x )
| | I L R ( I S R k ) s | | 2 2 is the loss between the SR and LR images, and ϕ ( x ) is the prior information for the image. Most blind super-resolution algorithms divide this process into two steps as follows:
{ k = M ( I L R ) I H R = arg min x | | I L R ( I S R k ) s | | 2 2 + ϕ ( x )
where M ( I L R ) denotes the function of the SR image to estimate k. The second formula is solved using a non-blind super-resolution method. This solution process has disadvantages: It requires the training of two or even more models. The blur kernel can only use the information of the LR image and cannot effectively use the information of the SR image, which makes it difficult to solve the correct k in the process’ actual application. Furthermore, the model training process uses the ground truth kernel, but the testing process can only use the predicted blur kernel. The difference between the two blur kernels results in unsatisfactory performance.
In this paper, the above problems are solved by a blind super-resolution network with dual-channel attention [22], as shown in Figure 3. The Restorer and Estimator modules are used to efficiently utilize the SR image and the blur kernel to obtain a better super-resolution model. The initial blur kernel is set with the center as one and all other positions as zero. Then, the dimensionality of the kernel is reshaped, and the feature information is extracted using principal component analysis (PCA). A pre-trained neural network is used to calculate the perceptual loss, which can better retain the structural details and deeper features of the picture.
The Estimator and Restorer modules have disparate inputs; their structures are shown in Figure 4a,b. During the training of the model, the Estimator and Restorer are fed LR images as a primary requirement. Borrowing the concept of residual networks [26], the inputs of each module should be correlated with its outputs. If the training process of a module focuses only on the LR image, the result will be constant in each iteration. Therefore, the Restorer takes the blur kernel output from the Estimator as input, while the Estimator module uses the SR image output from the Restorer as input. The input LR image is known and constant, but the other two inputs are variable. Thus, the model obtained through this alternative training will be more suited to achieving image super-resolution for the fiberscope with a sub-millimeter diameter. The structure of the conditional residual module is shown in Figure 4c, which consists of two 3 × 3 convolutions and a dual-channel attention layer. The residual module with an attention mechanism is given in Equation (5), where R ( . ) is the residual mapping function, C o n c a t ( . ) denotes the splicing of the input conditions, and f b a s i c and f c o n d represent the input LR image condition and another condition, respectively.
f o u t = R ( C o n c a t ( [ f b a s i c , f c o n d ] ) ) + f b a s i c
The Restorer extracts the LR image features with convolutional kernels of size 3 and stretches the blur kernel to match the spatial dimension of the extracted features. In the next step, the kernel maps and extracted LR image features are fed into the ACRB, and the image is upscaled to a defined magnification using Pixel Shuffle [27]. The Estimator module then takes the down sampled SR image and the LR image characteristics as input and processes them through the ACRB module with spatial and channel attention techniques. Finally, the features are squeezed through global average pooling to generate the blur kernel.
The use of the inverse Fourier transform in the image noise reduction process leads to the loss of high-frequency information in the image. Therefore, it is necessary for the blind super-resolution network to focus more on reconstructing the high-frequency details in the image. The attention mechanism emulates human visual perception by allocating finite resources to the relevant components while filtering out irrelevant data. The quality of SR images can be enhanced by the ACRB module’s addition of spatial and channel attention mechanisms. The spatial attention mechanism makes the model pay more attention to specific regions of the image and better reconstruct detailed information such as texture. The channel attention assigning weights to the channel improves the model’s understanding of the importance of different channels in the image, such as brightness and contrast. This paper uses the CBAM [28] dual-channel attention mechanism that combines channel and spatial information, as shown in Figure 5a.
Considering that more attention needs to be paid to high-frequency information in fiberscope images, the pooling in the spatial attention model is optimized for adaptive pooling. Instead of needing to predetermine the pooling size, adaptive pooling is flexible, enabling the size and shape of the pooling window to be selected dynamically in accordance with the volume of the input data. In order to improve the model’s ability to recognize local and global characteristics, it can also be weighted and averaged according to the significance of features at various places. The optimized spatial attention model enables the blind super-resolution model to better reconstruct the detailed information in the image and improve the robustness of the model.
The Channel Attention Module [29] can be divided into two parts, as shown in Figure 5b. The input feature F is first subjected to average pooling (AvgPool) and maximum pooling (MaxPool) to aggregate the spatial information of the feature mapping. The pooled results are processed through a multi-layer perceptron (MLP) with two layers of neural networks and then summed based on element-wise operations. Finally, a sigmoid function is applied to obtain the weight values of each channel (0–1). By adding weights to the different channels, it can selectively improve or suppress the features of various channels while keeping more valuable information and eliminating useless information. In this way, it is possible to recover a high-resolution image with improved quality while also reducing undesired effects like noise and artifacts in the SR image. The processing can be represented by Equation (7).
M ( F ) c = σ ( M L P ( A v g P o o l ( F ) ) + M L P ( M a x P o o l ( F ) ) )
The Spatial Attention Module [29] shown in Figure 5c improves the effectiveness of the model by adaptively learning weights to determine the importance of each location in the input image, allowing the network to focus on the most relevant and vital regions. Adaptive maximum pooling and adaptive average pooling are first performed on the channels of the input feature map F. The two results obtained are stacked based on the channels. A kernel f with size 7 × 7 is used for convolution to reduce the number of channels to 1. Finally, the sigmoid activation function is performed to obtain the weights of each feature point of the input feature layer. The equation is as follows:
M ( F ) s = σ ( f 7 x 7 ( [ A d a p t i v e A v g P o o l ( F ) ; A d a p t i v e M a x P o o l ( F ) ] ) )

3. Experimental Results and Discussion

3.1. Dataset and Parameter Settings

We use the public dataset DIV2K [30], which contains 2000 high-resolution images of buildings, natural landscapes, etc. This dataset is commonly used to train and evaluate super-resolution algorithms. There are also two datasets of human gastrointestinal conditions collected using endoscopes. One is a complete dataset of 600 endoscope images from CVC labs [31], and the other is the Kvasir-SEG dataset of gastrointestinal polyp images [32]. Both sets of data were manually annotated by expert gastroenterologists. To verify the validity of the methods in this paper, we tested the different methods using the above dataset. Additionally, we evaluated the experimental results of images captured with a 0.37 mm diameter sub-millimeter fiberscope utilizing several super-resolution methods. Finally, by comparing the experimental results with and without parametric assessment criteria, the approach adopted in this study is demonstrated to be efficient and visually superior.
During the training process, the batch size was set to 32, the number of epochs was 300, and iterations = 300; Adam with β 1 = 0.9 and β 2 = 0.99 was used as an optimizer, and the learning rate was set to 0.0001. The dataset with 80% of each category was labeled as training and 20% as testing. All models were trained on an NVIDIA 3060 GPU with 12 GB memory.

3.2. Public Dataset Experimental Results

The models proposed in this work, SRCNN, ESPCN, and SRGAN, are trained using the same dataset and test set. The peak signal-to-noise ratio (PSNR) [33] and structural similarity (SSIM) [34] metrics are calculated for the different methods applied to the public datasets to evaluate the algorithm. The PSNR is based on the SR and HR image mean squared error (MSE) and the maximum value of the pixel dynamic range (MAX). A greater number indicates better image quality and less image distortion. The SSIM calculates the degree of similarity between two images based on their brightness l(x, y), contrast c(x, y), and structure s(x, y). The value increases with the degree of similarity. The formulas of evaluation metrics are as follows:
{ P S N R = 10 log 10 ( M A X I 2 M S E ) = 20 log 10 ( M A X I M S E ) S S I M ( x , y ) = [ l ( x , y ) ] α [ c ( x , y ) ] β [ s ( x , y ) ] γ
Table 1 displays the results of comparing the PSNR and SSIM values of several super-resolution methods applied to various public datasets. According to the results, deep learning-based approaches are superior to Bicubic. Compared to the other approaches, the method proposed in this study performs better on various datasets.
In addition to the above two classical image evaluation metrics, the learned perceptual image patch similarity (LPIPS) [35] of each model is also compared. Using the VGG model [36] to extract the deep feature information of the images, the feature differences are computed to measure the degree of similarity between the images, simulating the perception of human vision. The specific calculation process is shown in Formula (9); the images are input to the network, and after extracting each layer of activation and normalization by the VGG network, we calculate the mean squared error between the feature vectors of each layer. Finally, the similarity d is gained by calculating the average of the errors of all the layers. The lower the similarity, the larger the LPIPS output. The results of comparing the effect of various networks on different datasets are shown in Table 2.
d ( x 0 , x 1 ) = l 1 H l W l h , w w l ( y ^ 0 h w l y ^ 1 h w l ) 2 2

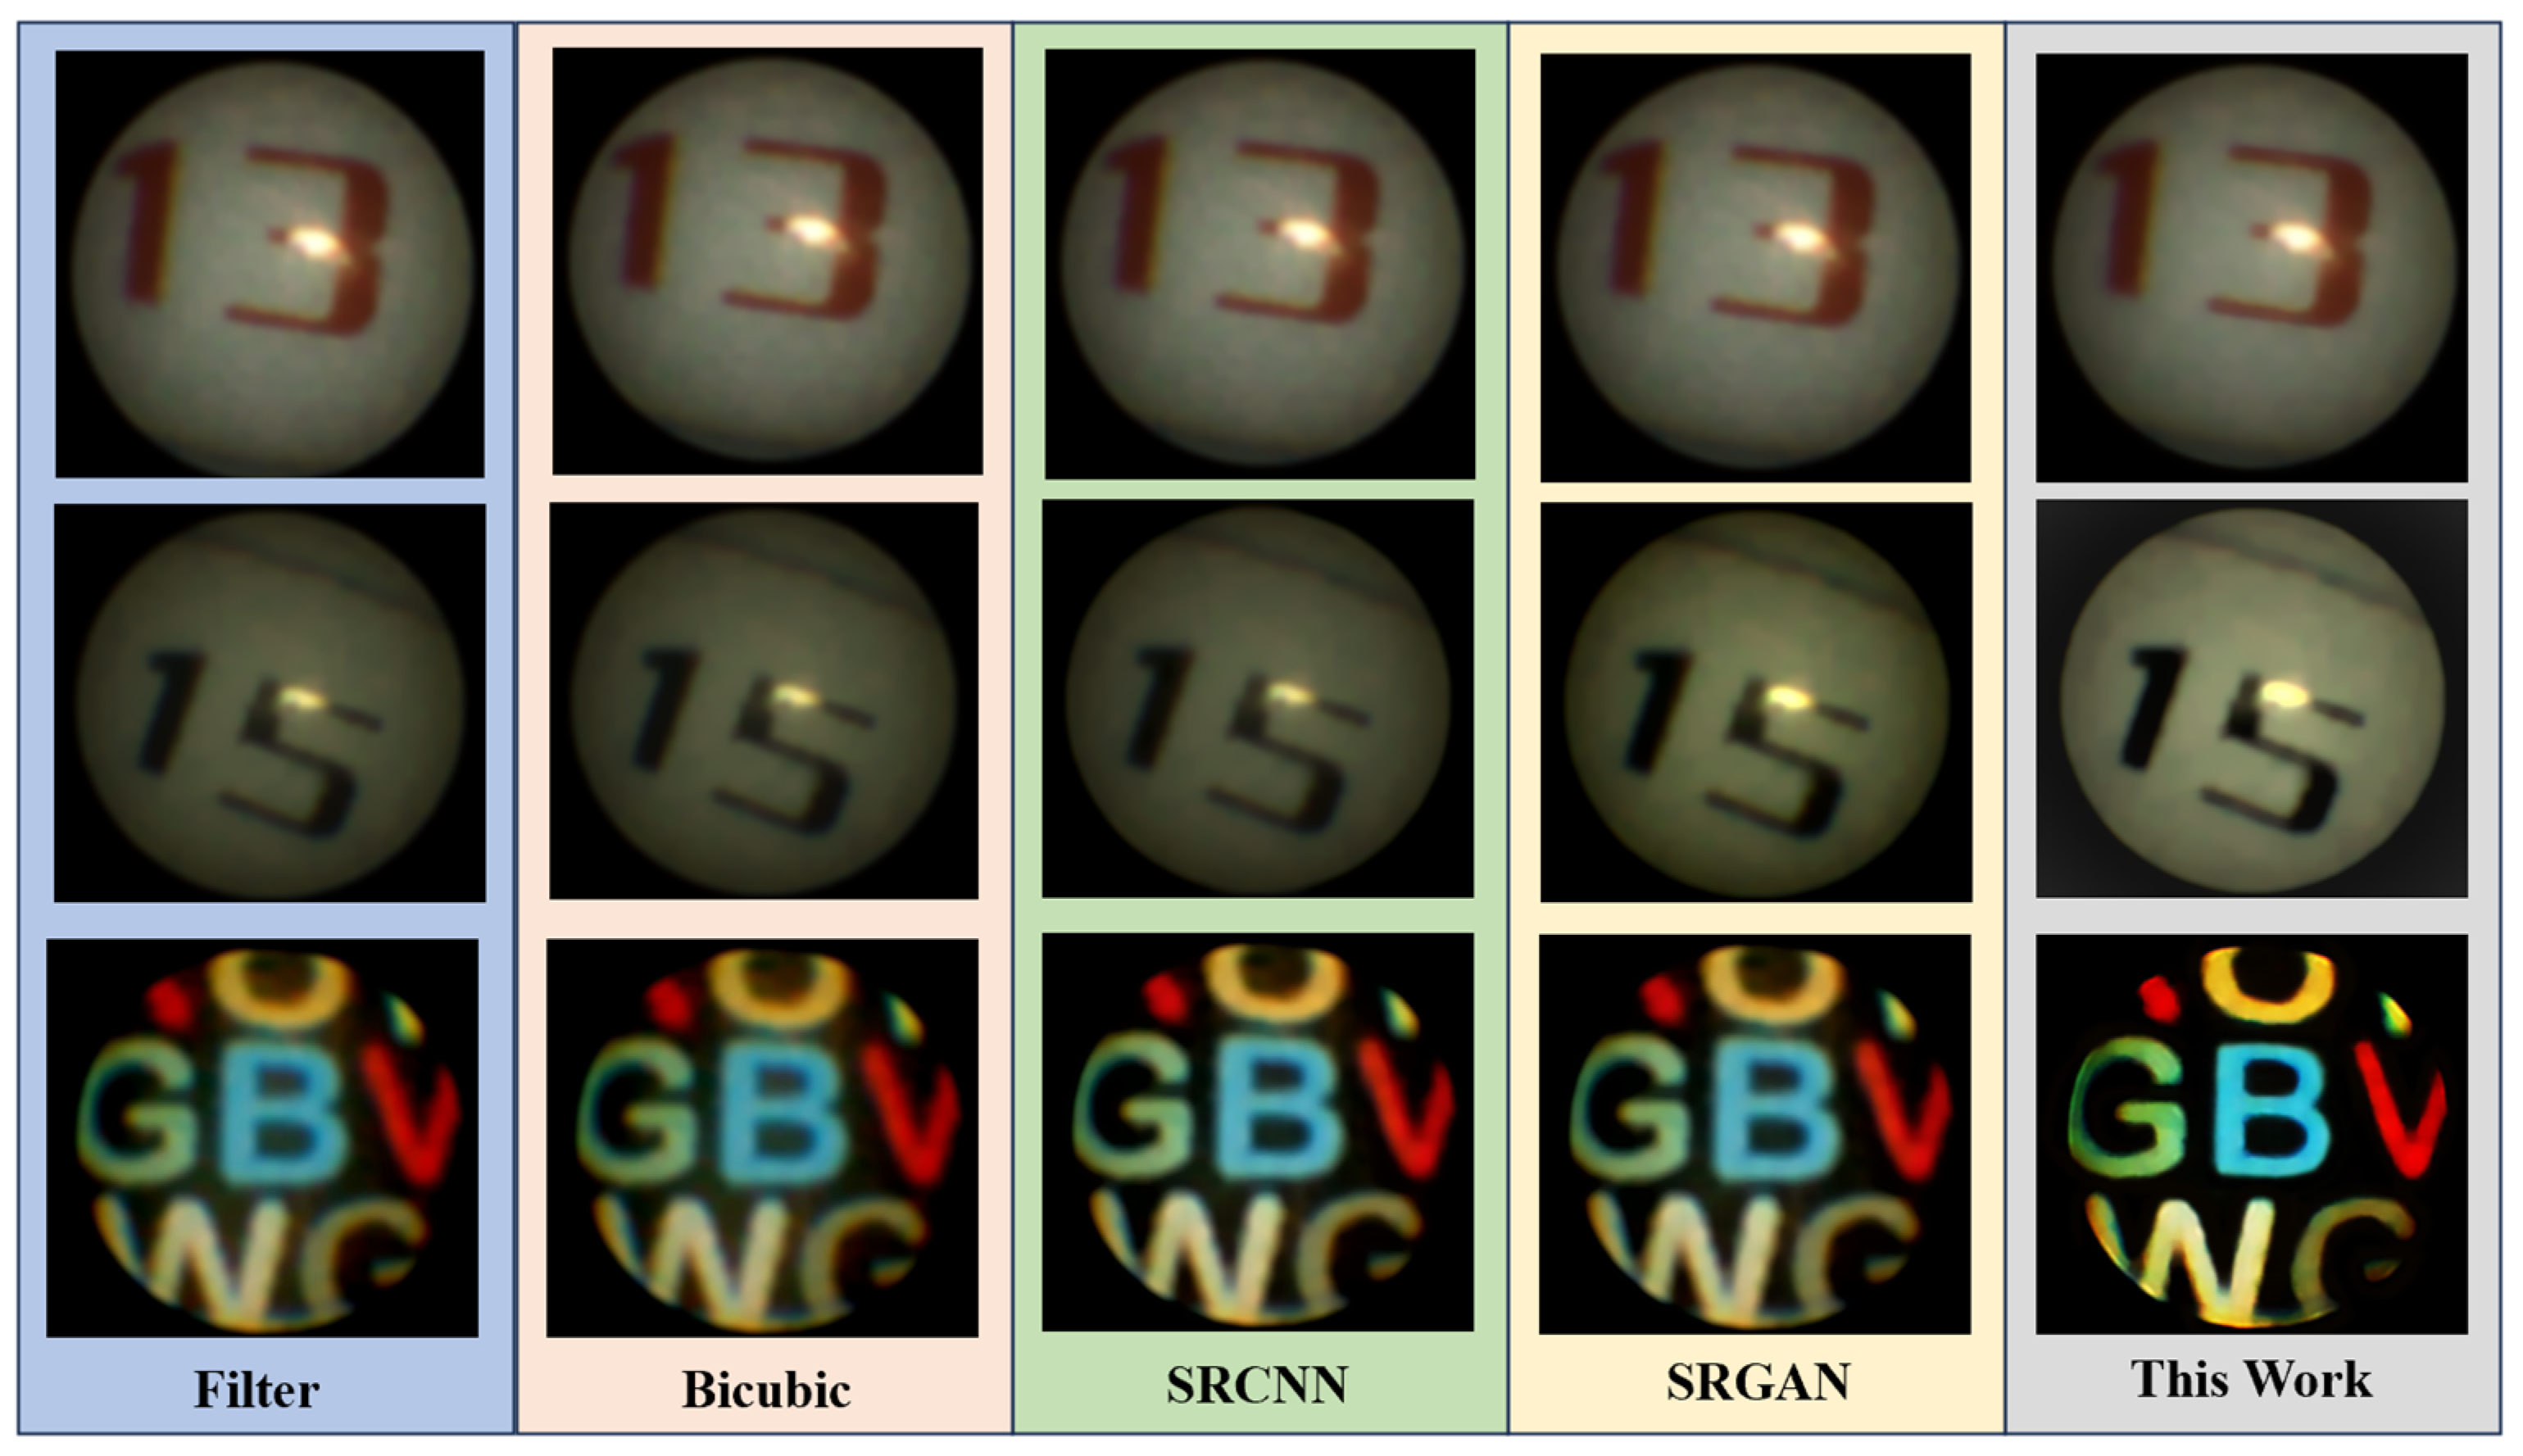
3.3. Real Image Experimental Results

Table 1 and Table 2 demonstrate the superiority of the method proposed in this paper by comparing the objective evaluation metrics of different super-resolution methods applied to public datasets. However, these objective evaluation metrics lack subjectivity and are different from the perception of the human eye. Therefore, we apply these methods to enhance the resolution of images by a factor of four; the results are given in Figure 6. Result comparisons based on the clarity of the Laplace operator [37] and the information entropy [38] are shown in Table 3. The process of calculating the image clarity based on the Laplace operator is shown in Equation (10), where L is the Laplace operator, and G ( i , j ) denotes the result of convolution of the pixel at the coordinates ( i , j ) in the image with L. The clarity f is obtained after calculation. The formula of image information entropy is shown in Equation (11); ( i , j ) denotes the pixel value of the image and the spatial feature quantity of the grayscale distribution, and N denotes the size of the image. By calculating the information entropy, it can reflect the grayscale information of the pixel position in the image and the comprehensive feature of the grayscale distribution in the pixel neighborhood.
{ L = 1 6 ( 0 1 0 1 4 1 0 1 0 ) f = i j [ G ( i , j ) ] 2
{ P i j = f ( i , j ) / N 2 H = i = 0 255 P i , j log ( P i , j )
Super-resolution reconstruction of the filtered image shows that Bicubic just changes the resolution of the image; it does not improve the clarity of the image, and the information entropy is lower. Although SRCNN and SRGAN’s Laplace-based values of clarity and information entropy do not improve much compared to Bicubic, the processed image remains blurry and lacks sufficient sharpening of edges. The Laplace clarity and information entropy of the comparison results are improved by 2.54 and 0.44, respectively, compared with the mean values of other methods, which proves that the reconstructed image by this paper’s method is clearer and more informative and the intuition of human eyes is better. The above reference-free image evaluation and direct observation demonstrate that the method proposed in this paper is more suitable for a sub-millimeter-diameter fiberscope with a diameter of 0.37 mm.

3.4. Speed of Real Image Inference

In order to comprehensively evaluate different methods, we tested the average speed of image reconstruction using different methods on the same platform. We used images captured by a sub-millimeter fiberscope as test data, and all methods were tested on a computer with an NVIDIA Quadro T2000 graphics card. The Bicubic requires an average of 1.25 s to reconstruct an image. Since the computational complexity of SRCNN is higher than Bicubic, its speed is 3.28 s per image. ESPCN is faster than SRCNN with 2.33 s due to its sub-pixel convolutional layer to achieve upsampling and simpler network design. SRGAN is the slowest, taking an average of 4.86 s per image. The speed of the method in this paper is 1.84 s per image; the speed is slower than Bicubic, but the quality of the generated image is better than other methods. Through the above experiments, it can be known that the method used in this work was not only better than other methods in reconstructing the quality of the image, but also the speed is only slower than Bicubic.

4. Discussion

In this paper, we investigated the effectiveness of the blind super-resolution network with dual-channel attention on images captured by a sub-millimeter-diameter fiberscope. The fiberscope used in this paper has a diameter of only 0.37 mm, which limits the resolution of the captured image to 3000 pixels. Additionally, the image is affected by reticulated noise due to the independent transmission of information through the fiber-optic bundles. To reduce the reticulated noise effectively, the Butterworth band-stop filter was used to reduce noise within a specific frequency band. To make the image more in accord with the human visual perception system, we optimized the perceptual loss function to measure the difference between HR and SR images. Meanwhile, channel and spatial attention mechanisms are introduced into the network, targeting to improve the ability to reconstruct local details of SR images and enable the network to learn richer feature information. Experimental results on public datasets indicate that the PSNR and SSIM of our method outperform others. The LPIPS value of our approach is 0.06 lower than other methods. To validate that the proposed method is more applicable to the images acquired by a sub-millimeter-diameter fiberscope, the resolution of the images is increased by four times using different methods. Compared to the average of other methods, our method shows improvements of 0.44 in information entropy and 2.54 in Laplace function clarity.

5. Conclusions

This work proposed an optimized blind super-resolution network to improve the resolution of images captured by a fiberscope with a diameter of 0.37 mm. Specifically, a Butterworth band-stop filter was used to remove the reticulated noise from the image. The loss function in the network was then optimized to make the reconstructed image clearer and improve the visual perception. A dual-channel attention mechanism was applied to the network to improve image detail and model generalization. It proved that the optimized blind super-resolution network proposed in this paper has the ability to reconstruct better quality images by comparing the parametric and non-parametric evaluation metrics for ESPCN, SRCNN, SRGAN, and Bicubic on endoscope and fiberscope images. In the future, we will simplify the complexity of the model to improve the speed of image generation and enable its use in real-time scenes while maintaining image quality. Additionally, the generalization ability of the model will be improved to be applied to a wide range of medical images.

Author Contributions

Conceptualization, W.C.; Methodology, W.C. and Y.L.; Software, W.C.; Validation, Y.L.; Investigation, W.C. and Y.Y.; Resources, J.Z., Z.D., L.Z. and W.H.; Writing—original draft, W.C.; Writing—review & editing, X.H., W.H., Y.Y., J.H. and X.C.; Supervision, J.Z.; Funding acquisition, J.H. and X.C. All authors have read and agreed to the published version of the manuscript.

Funding

This research was funded by the National Natural Science Foundation of China grant number (62171414, 52175554, 52205608, 62171415, 62001431), the Fundamental Research Program of Shanxi Province (20210302123059, 20210302124610), Program for the Innovative Talents of Higher Education Institutions of Shanxi, the Central Guidance on Local Science and Technology, Development Fund of Shanxi Province (YDZJSX2022B005), Foundation of Shanxi Province Key Laboratory of Quantum Sensing and Precision Measurement (201905D121001004), National Natural Science Foundation of China (62371426, 62001431, 62250073).

Data Availability Statement

Data available on request from the authors.

Conflicts of Interest

The authors declare no conflict of interest.

References

  1. Sun, J.; Wu, J.; Wu, S.; Goswami, R.; Girardo, S.; Cao, L.; Guck, J.; Koukourakis, N.; Czarske, J.W. Quantitative phase imaging through an ultra-thin lensless fiber endoscope. Light Sci. Appl. 2022, 11, 204. [Google Scholar] [CrossRef] [PubMed]
  2. Kuschmierz, R.; Scharf, E.; Ortegón-González, D.F.; Glosemeyer, T.; Czarske, J.W. Ultra-thin 3D lensless fiber endoscopy using diffractive optical elements and deep neural networks. Light Adv. Manuf. 2021, 2, 415–424. [Google Scholar] [CrossRef]
  3. Fröch, J.E.; Huang, L.; Tanguy, Q.A.; Colburn, S.; Zhan, A.; Ravagli, A.; Seibel, E.J.; Böhringer, K.F.; Majumdar, A. Real time full-color imaging in a meta-optical fiber endoscope. eLight 2023, 3, 13. [Google Scholar] [CrossRef]
  4. Ali, M.; Yaeger, K.; Ascanio, L.; Troiani, Z.; Mocco, J.; Kellner, C.P. Early minimally invasive endoscopic intracerebral hemorrhage evacuation. World Neurosurg. 2021, 148, 115. [Google Scholar] [CrossRef] [PubMed]
  5. McGoran, J.J.; McAlindon, M.E.; Iyer, P.G.; Seibel, E.J.; Haidry, R.; Lovat, L.B.; Sami, S.S. Miniature gastrointestinal endoscopy: Now and the future. World J. Gastroenterol. 2019, 25, 4051. [Google Scholar] [CrossRef] [PubMed]
  6. Sekuboyina, A.K.; Devarakonda, S.T.; Seelamantula, C.S. A convolutional neural network approach for abnormality detection in wireless capsule endoscopy. In Proceedings of the 2017 IEEE 14th International Symposium on Biomedical Imaging (ISBI 2017), Melbourne, VIC, Australia, 18–21 April 2017; pp. 1057–1060. [Google Scholar]
  7. Chen, J.; Kang, X.; Liu, Y.; Wang, Z.J. Median filtering forensics based on convolutional neural networks. IEEE Signal Process. Lett. 2015, 22, 1849–1853. [Google Scholar] [CrossRef]
  8. Thanh, D.N.; Engínoğlu, S. An iterative mean filter for image denoising. IEEE Access 2019, 7, 167847–167859. [Google Scholar]
  9. Zhang, P.; Li, F. A new adaptive weighted mean filter for removing salt-and-pepper noise. IEEE Signal Process. Lett. 2014, 21, 1280–1283. [Google Scholar] [CrossRef]
  10. Kumar, A.; Sodhi, S.S. Comparative analysis of gaussian filter, median filter and denoise autoenocoder. In Proceedings of the 2020 7th International Conference on Computing for Sustainable Global Development (INDIACom), New Delhi, India, 12–14 March 2020; pp. 45–51. [Google Scholar]
  11. Broughton, S.A.; Bryan, K. Discrete Fourier Analysis and Wavelets: Applications to Signal and Image Processing; John Wiley & Sons: New York, NY, USA, 2018. [Google Scholar]
  12. Liu, M.; Wei, Y. Image denoising using graph-based frequency domain low-pass filtering. In Proceedings of the 2019 IEEE 4th International Conference on Image, Vision and Computing (ICIVC), Xiamen, China, 5–7 July 2019; pp. 118–122. [Google Scholar]
  13. Sa, Y. Improved bilinear interpolation method for image fast processing. In Proceedings of the 2014 7th International Conference on Intelligent Computation Technology and Automation, Changsha, China, 25–26 October 2014; pp. 308–311. [Google Scholar]
  14. Fadnavis, S. Image interpolation techniques in digital image processing: An overview. Int. J. Eng. Res. Appl. 2014, 4, 70–73. [Google Scholar]
  15. Glasner, D.; Bagon, S.; Irani, M. Super-resolution from a single image. In Proceedings of the 2009 IEEE 12th International Conference on Computer Vision, Kyoto, Japan, 29 September–2 October 2009; pp. 349–356. [Google Scholar]
  16. Dong, C.; Loy, C.C.; Tang, X. Accelerating the super-resolution convolutional neural network. In Proceedings of the Computer Vision–ECCV 2016: 14th European Conference, Amsterdam, The Netherlands, 11–14 October 2016; Proceedings, Part II 14. Springer International Publishing: Cham, Switzerland, 2016; pp. 391–407. [Google Scholar]
  17. Ledig, C.; Theis, L.; Huszár, F.; Caballero, J.; Cunningham, A.; Acosta, A.; Aitken, A.; Tejan, A.; Totz, J.; Wang, Z.; et al. Photo-realistic single image super-resolution using a generative adversarial network. In Proceedings of the IEEE Conference on Computer Vision and Pattern Recognition, Honolulu, HI, USA, 21–26 July 2017; pp. 4681–4690. [Google Scholar]
  18. Dong, C.; Loy, C.C.; He, K.; Tang, X. Image super resolution using deep convolutional networks. IEEE Trans. Pattern Anal. Mach. Intell. 2016, 38, 295–307. [Google Scholar] [CrossRef] [PubMed]
  19. Zhang, K.; Zuo, W.; Zhang, L. Learning a single convolutional super-resolution network for multiple degradations. In Proceedings of the IEEE Conference on Computer Vision and Pattern Recognition, Salt Lake City, UT, USA, 18–23 June 2018; pp. 3262–3271. [Google Scholar]
  20. Gu, J.; Lu, H.; Zuo, W.; Dong, C. Blind super-resolution with iterative kernel correction. In Proceedings of the IEEE/CVF Conference on Computer Vision and Pattern Recognition, Long Beach, CA, USA, 15–20 June 2019; pp. 1604–1613. [Google Scholar]
  21. Zhang, K.; Liang, J.; Van Gool, L.; Timofte, R. Designing a practical degradation model for deep blind image super-resolution. In Proceedings of the IEEE/CVF International Conference on Computer Vision, Montreal, QC, Canada, 10–17 October 2021; pp. 4791–4800. [Google Scholar]
  22. Huang, Y.; Li, S.; Wang, L.; Tan, T. Unfolding the alternating optimization for blind super resolution. Adv. Neural Inf. Process. Syst. 2020, 33, 5632–5643. [Google Scholar]
  23. Roonizi, A.K.; Jutten, C. Band-stop smoothing filter design. IEEE Trans. Signal Process. 2021, 69, 1797–1810. [Google Scholar] [CrossRef]
  24. Yamawaki, K.; Sun, Y.; Han, X.H. Blind image super resolution using deep unsupervised learning. Electronics 2021, 10, 2591. [Google Scholar] [CrossRef]
  25. Fan, L.; Zhang, F.; Fan, H.; Zhang, C. Brief review of image denoising techniques. Vis. Comput. Ind. Biomed. Art 2019, 2, 1–12. [Google Scholar] [CrossRef] [PubMed]
  26. He, K.; Zhang, X.; Ren, S.; Sun, J. Deep residual learning for image recognition. In Proceedings of the IEEE conference on computer vision and pattern recognition, Las Vegas, NV, USA, 27–30 June 2016; pp. 770–778. [Google Scholar]
  27. Shi, W.; Caballero, J.; Huszár, F.; Totz, J.; Aitken, A.P.; Bishop, R.; Rueckert, D.; Wang, Z. Real-time single image and video super-resolution using an efficient sub-pixel convolutional neural network. In Proceedings of the IEEE Conference on Computer Vision and Pattern Recognition, Las Vegas, NV, USA, 27–30 June 2016; pp. 1874–1883. [Google Scholar]
  28. Woo, S.; Park, J.; Lee, J.Y.; Kweon, I.S. Cbam: Convolutional block attention module. In Proceedings of the European Conference on Computer Vision (ECCV), Munich, Germany, 8–14 September 2018; pp. 3–19. [Google Scholar]
  29. Lu, E.; Hu, X. Image super-resolution via channel attention and spatial attention. Appl. Intell. 2022, 52, 2260–2268. [Google Scholar] [CrossRef]
  30. Agustsson, E.; Timofte, R. Ntire 2017 challenge on single image super-resolution: Dataset and study. In Proceedings of the IEEE Conference on Computer Vision and Pattern Recognition Workshops, Honolulu, HI, USA, 21–26 July 2017; pp. 126–135. [Google Scholar]
  31. Bernal, J.; Sánchez, F.J.; Fernández-Esparrach, G.; Gil, D.; Rodríguez, C.; Vilariño, F. WM-DOVA maps for accurate polyp highlighting in colonoscopy: Validation vs. saliency maps from physicians. Comput. Med. Imaging Graph. 2015, 43, 99–111. [Google Scholar] [CrossRef] [PubMed]
  32. Pogorelov, K.; Randel, K.R.; Griwodz, C.; Eskeland, S.L.; de Lange, T.; Johansen, D.; Spampinato, C.; Dang-Nguyen, D.-T.; Lux, M.; Schmidt, P.T.; et al. Kvasir: A multi-class image dataset for computer aided gastrointestinal disease detection. In Proceedings of the 8th ACM on Multimedia Systems Conference, New York, NY, USA, 20–30 June 2017; pp. 164–169. [Google Scholar]
  33. Erfurt, J.; Helmrich, C.R.; Bosse, S.; Schwarz, H.; Marpe, D.; Wiegand, T. A study of the perceptually weighted peak signal-to-noise ratio (WPSNR) for image compression. In Proceedings of the 2019 IEEE International Conference on Image Processing (ICIP), Taipei, Taiwan, 22–25 September 2019; pp. 2339–2343. [Google Scholar]
  34. Mudeng, V.; Kim, M.; Choe, S. Prospects of structural similarity index for medical image analysis. Appl. Sci. 2022, 12, 3754. [Google Scholar] [CrossRef]
  35. Zhang, R.; Isola, P.; Efros, A.A.; Shechtman, E.; Wang, O. The unreasonable effectiveness of deep features as a perceptual metric. In Proceedings of the IEEE Conference on Computer Vision and Pattern Recognition, Salt Lake City, UT, USA, 18–23 June 2018; pp. 586–595. [Google Scholar]
  36. Simonyan, K.; Zisserman, A. Very deep convolutional networks for large-scale image recognition. arXiv 2014, arXiv:1409.1556. [Google Scholar]
  37. Xue, W.; Mou, X.; Zhang, L.; Bovik, A.C.; Feng, X. Blind image quality assessment using joint statistics of gradient magnitude and Laplacian features. IEEE Trans. Image Process. 2014, 23, 4850–4862. [Google Scholar] [CrossRef]
  38. Tsai, D.Y.; Lee, Y.; Matsuyama, E. Information entropy measure for evaluation of image quality. J. Digit. Imaging 2008, 21, 338–347. [Google Scholar] [CrossRef] [PubMed]
Figure 1. Sub-millimeter-diameter fiberscope structure. (a) The structure diagram of the sub-millimeter-diameter fiberscope. (b) Sub-millimeter-diameter fiberscope with a diameter of 0.37 mm.
Electronics 12 04352 g001
Figure 2. Noise reduction in images captured by sub-millimeter-diameter fiberscope. ORI: images captured by sub-millimeter-diameter fiberscope. Fourier: images after Fourier transform. Filter: Butterworth band-stop filter. Result: the result of image filtering.
Electronics 12 04352 g002
Figure 3. The structure of the blind super-resolution network with dual-channel attention.
Electronics 12 04352 g003
Figure 4. The details of Restorer, Estimator, and ACRB. (a) Details of Restorer. (b) Details of Estimator. (c) Details of Attention Conditional Residual Block (ACRB).
Electronics 12 04352 g004
Figure 5. Details of Dual-Attention Module (a) Details of CBAM Module. (b) Details of Channel Attention Module. (c) Details of Spatial Attention Module.
Electronics 12 04352 g005
Figure 6. Comparison of the clarity/entropy of the proposed method with other super-resolution methods applied to real sub-millimeter-diameter fiberscope images.
Electronics 12 04352 g006
Table 1. PSNR/SSIM comparison of different super-resolution methods applied to public datasets.
Method/DatasetsSet5Set14BSD100Kvasir-Sessile
Bicubic26.75/0.8524.76/0.7824.69/0.7723.78/0.74
SRCNN27.95/0.8926.13/0.6225.38/0.6124.61/0.59
ESPCN28.67/0.7727.92/0.7426.87/0.7426.13/0.65
SRGAN30.15/0.8128.14/0.7226.98/0.7626.34/0.72
This paper31.92/0.9328.47/0.7727.53/0.8127.36/0.79
Table 2. LPIPS comparison between the proposed method and others.
Method/DatasetsSet5Set14BSD100Kvasir-Sessile
Bicubic0.270.300.320.35
SRCNN0.250.310.290.31
ESPCN0.240.260.300.32
SRGAN0.230.250.280.30
This paper0.190.220.230.25
Table 3. Laplace clarity/information entropy comparison between the proposed method and others.
Method/ImageImage1Image2Image3
Bicubic2.75/4.192.32/3.837.32/3.58
SRCNN2.68/4.172.46/3.847.36/3.95
SRGAN2.69/4.203.22/3.907.39/3.95
This paper3.06/4.233.96/3.9013.34/4.23
Disclaimer/Publisher’s Note: The statements, opinions and data contained in all publications are solely those of the individual author(s) and contributor(s) and not of MDPI and/or the editor(s). MDPI and/or the editor(s) disclaim responsibility for any injury to people or property resulting from any ideas, methods, instructions or products referred to in the content.

