Article

Research on an Intelligent Piezoelectric Needle Selector System with Closed-Loop Fault Detection Capability

1
Key Laboratory of Modern Textile Machinery & Technology of Zhejiang Province, Zhejiang Sci-Tech University, Hangzhou 310018, China
2
School of Automation, Zhejiang Institute of Mechanical & Electrical Engineering, Hangzhou 310053, China
*
Authors to whom correspondence should be addressed.
Electronics 2023, 12(20), 4331; https://doi.org/10.3390/electronics12204331
Submission received: 9 September 2023 / Revised: 6 October 2023 / Accepted: 18 October 2023 / Published: 19 October 2023

Abstract

:
The piezoelectric needle selector is a crucial component of computerized dobby weft knitting machines. With the continuous development of weft knitting machine technology, enhancing the accuracy of piezoelectric needle selector control is essential. Accurate determination of whether the blades are in the correct position would significantly improve the precision of piezoelectric needle selector control. In this study, piezoelectric ceramic sensors were used to collect impact vibration signals when the blades struck the damper baffle. Key hardware circuits were designed for this purpose. A self-learning algorithm was employed to capture the highest point and the time it takes to reach the highest point in the impact vibration signal. A fault detection algorithm was used to implement closed-loop fault detection for piezoelectric needle selectors. Experimental results and practical applications have demonstrated that this research effectively addresses the accurate determination of whether the piezoelectric needle selector blades are in the correct position. It has reduced the defect rate of fabric production in weft knitting, thereby improving the overall efficiency and profitability of businesses.

1. Introduction

The circular weft knitting machine is a knitting mechanical device that utilizes a selector to control knitting needles housed within a needle cylinder, transforming the fed yarn into circular fabric and ultimately producing tubular fabric [1,2]. The selector within the circular weft knitting machine is a crucial operational component responsible for creating fabric patterns, and its performance directly impacts the production efficiency of the circular weft machine and the diversity of fabric patterns it can produce. With the continuous development of electronic technology and circular knitting computerized jacquard technology [3,4], various electronic technologies have begun to be applied to the drive and detection of selectors in circular weft knitting machines [5]. Currently, electronic selectors commonly found in the market fall into two major categories: piezoelectric ceramic selectors and electromagnetic selectors [6]. Their driving and control methods mostly rely on electronic open-loop control [7]. However, this control method cannot provide real-time monitoring of the motion status of individual blades within the selector, making it unable to promptly locate faulty blades within the selector. This limitation can lead to issues such as distorted fabric patterns and a high defect rate in the knitted fabric [8]. Consequently, these issues mean that the control method no longer meets the requirements for high-quality production in computerized jacquard circular weft knitting machines. Therefore, the use of electronic technology to achieve precise control of the blade movements within the selector and enable timely self-diagnosis of faults has become an essential necessity.
In recent years, research on needle selector fault detection techniques has been continuously advancing, considering the operational characteristics of various needle selectors [9]. Zhang et al. [10] employed a laser detector to collect reflected laser signals from each individual blade on the needle selector. They compared the peak distances of adjacent laser signals to achieve needle selector fault detection. However, variations in the surface roughness of the swinging blades on the needle selector can lead to susceptibility to environmental interference, thereby affecting the accuracy of the detection process. Peng et al. [11], on the other hand, proposed a needle selector fault detection method based on the co-positioning characteristics of a piezoelectric sensor and a driver by studying the dynamic properties of the piezoelectric ceramic driver under the counteraction of the blade limit baffle. Their research revealed that the characteristic frequency of the piezoelectric driver under normal working conditions is 228 Hz. Li et al. [12] applied the principle of frequency flashing to rapidly identify the fault status of the needle selector. However, this method requires visual observation and cannot detect faults within the needle selector itself, potentially leading to fabric defects when the needle selector malfunctions. Xiang and Yuan [13,14] proposed methods for measuring the swinging driving torque of electromagnetic needle selector blades and implementing blade displacement detection using laser displacement sensors, respectively. These approaches provided theoretical and experimental foundations for needle selector fault detection but have remained limited to laboratory testing phases. Wang et al. [15] detected faults by monitoring changes in the current within the drive circuit of the electromagnetic needle selector during operation. However, this method still cannot pinpoint faults in specific needle selector blades.
The methods mentioned above, which analyze the dynamic characteristics of the selector and utilize corresponding detection techniques, have achieved closed-loop feedback and detection of the selector’s operational status. However, they did not take into consideration practical factors such as differences in selector blade materials and installation positions. As a result, the detection system was unable to capture the actual dynamic characteristics of different selector blades, leading to inaccurate results and other issues. To address this problem, Zuo and his team [16] designed a hybrid magnetic levitation non-contact needle selector driving method. They compared the given driving voltage to the needle selector with the feedback voltage from magnetic needle displacement using a closed-loop PID system to detect the needle selector’s working status. Jonathan and colleagues [17] utilized an FPGA platform and a stray flux sensor to statistically analyze the characteristics of the motor during its actual operation. They calibrated the operational characteristics of the motor and achieved online detection of outer ring faults in the motor. Ma et al. [18] measured the degree of displacement of the needle selector’s blades using the piezoelectric effect of a piezoelectric bimorph. They utilized a high-performance embedded controller to drive the needle selector’s motion while simultaneously monitoring the needle selector’s working status in real time. However, their testing platform remained at the experimental stage and has not been validated in actual production scenarios. Gu et al. [19] analyzed the amplitude characteristics of the needle selector’s damper baffle when subjected to impacts from the blades, providing a theoretical basis for closed-loop fault detection in needle selectors from a vibrational perspective.
Based on the foundational information provided, this paper focuses on commonly encountered piezoelectric needle selectors in the market and introduces a piezoelectric needle selector system with closed-loop fault detection capability, utilizing piezoelectric sensors (PZT) [20,21]. This needle selector can analyze the collected vibration signals to identify and diagnose various types of needle selector faults caused by components such as control circuits, blades, and needle damper baffles. While the study primarily investigates piezoelectric needle selectors, the fault detection methodology is equally applicable to electromagnetic needle selectors, enabling comprehensive fault detection. Apart from the introduction, the subsequent sections of this paper are organized as follows: In the second section, we present an overview of the system’s overall structural framework. The third section provides detailed explanations of the crucial hardware circuitry designs within the system. In the fourth section, we elucidate the steps involved in constructing the algorithm for closed-loop fault detection within the system. The fifth section is dedicated to the validation and analysis of the system’s fault detection results using experimental data. Finally, in the sixth section, we summarize the paper’s content and engage in a comprehensive discussion of our findings. The main contributions of this research are as follows:
(1)
Designing key hardware circuits for the closed-loop fault detection system of piezoelectric needle selectors, including the piezoelectric ceramic driver circuit and the fault detection module circuit. These circuit designs enable the system to stably control needle selector blades and accurately capture their vibration signals, thus enhancing system performance and stability;
(2)
Developing a self-learning algorithm to collect actual vibration characteristic signals from needle selector blades. This algorithm addresses deviations between the actual vibration characteristic signals of different needle selector blades and theoretical values due to differences in materials and installation positions. It adaptively adjusts the deviation in the vibration characteristic signals of needle selector blades in real production scenarios, providing a more reliable reference baseline for system fault detection;
(3)
Creating a closed-loop fault detection algorithm for needle selector fault detection. By comparing real-time vibration characteristic signals from each needle selector blade with the self-learned system baseline values, this algorithm enables rapid and accurate localization of needle selector fault positions and types.

2. System Framework

2.1. Design Objectives

The overall structure of the piezoelectric needle selector is illustrated in Figure 1a, consisting primarily of the control circuit board, mechanical casing, piezoelectric ceramics, and blades. The control circuit board and piezoelectric ceramics are housed within the mechanical casing. The control circuit board utilizes the reverse piezoelectric effect of the piezoelectric ceramics to induce bending, thereby driving the up-and-down oscillation of the blades.
Figure 1b depicts a schematic diagram of the piezoelectric ceramic driver, with the piezoelectric ceramic fixing component serving to connect the piezoelectric ceramics, mechanical casing, and control circuit board. Electrode lead-out pins 1 and 2 are connected to the positive and negative poles of the power source, while the control signal to change the bending direction of the piezoelectric ceramic under the inverse piezoelectric effect is applied to electrode lead-out pin 3 [22]. The blade fixing component secures the blade and includes an internal pivot shaft. When the piezoelectric ceramic bends in the opposite direction, the blade swings in the opposite direction as well and stops when it collides with the upper and lower limit stoppers on the needle selector. Figure 1c illustrates a schematic diagram of the piezoelectric needle selector baffles, where the upper and lower limit baffles are fixed to the mechanical casing using positioning holes (1~4). When the needle selector collides with the upper or lower limit, the piezoelectric sensors adhered to the stoppers convert the impact signals into electrical signals [23,24], which are then input into the control circuit board.

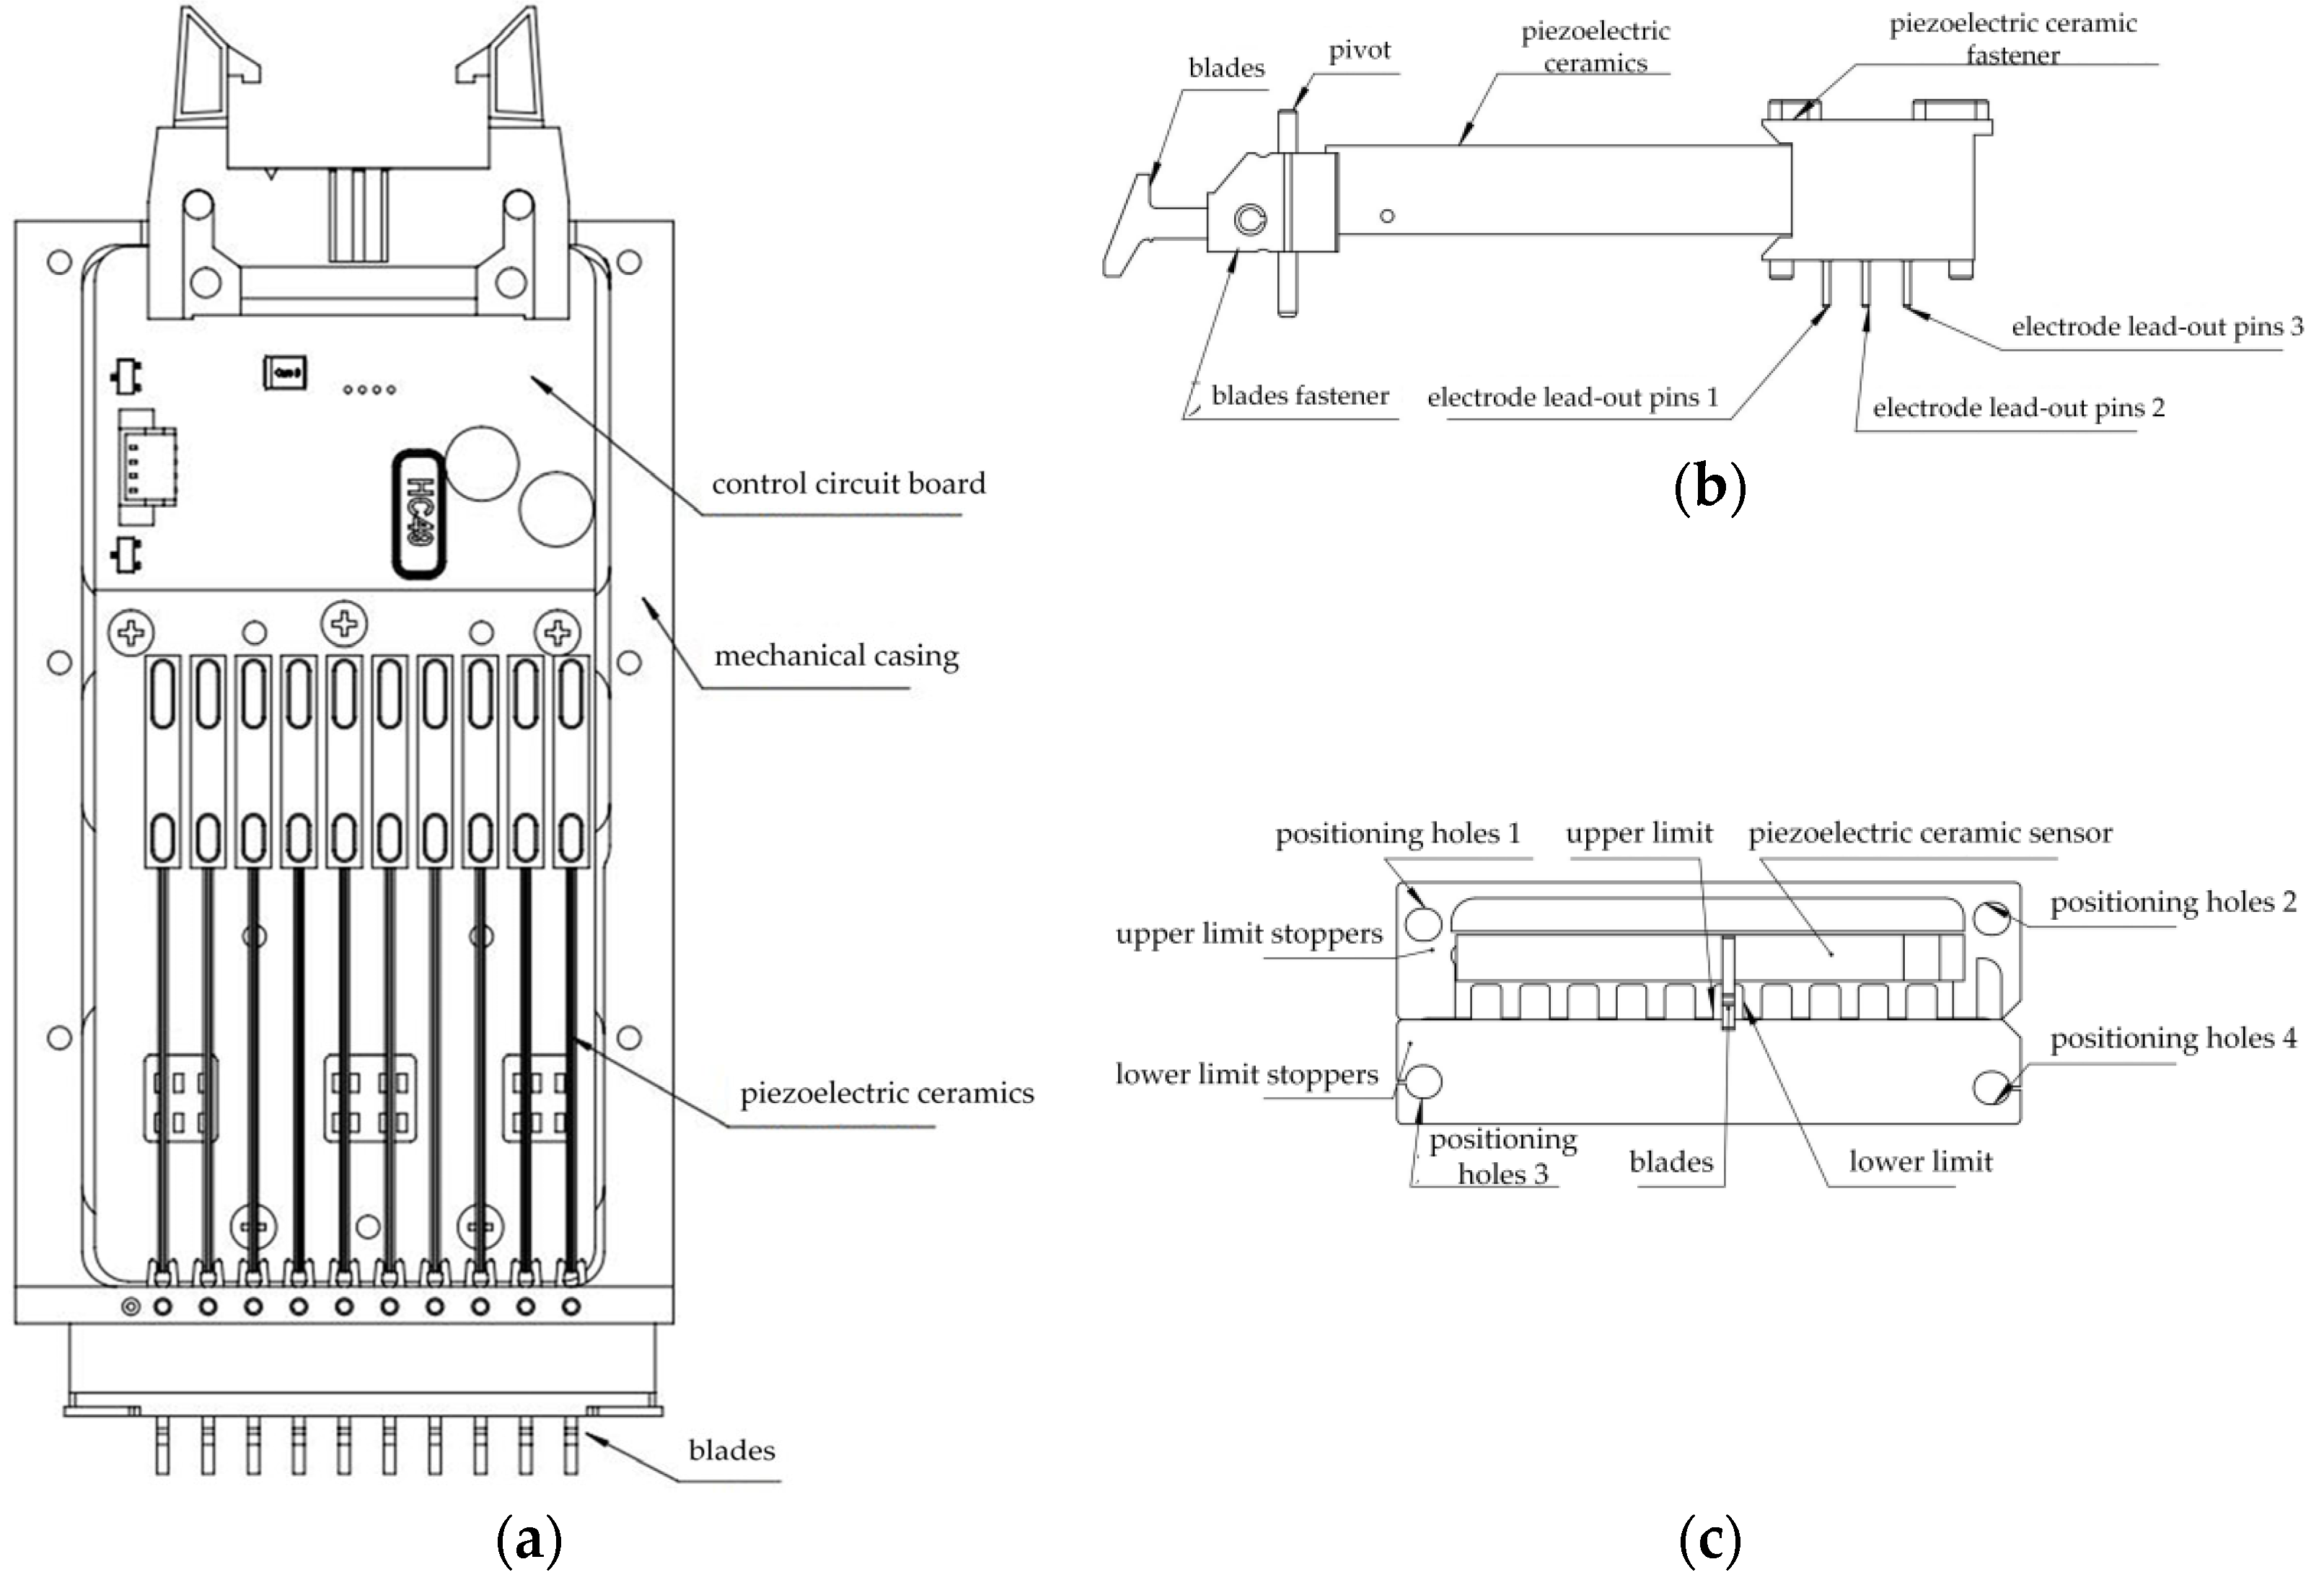
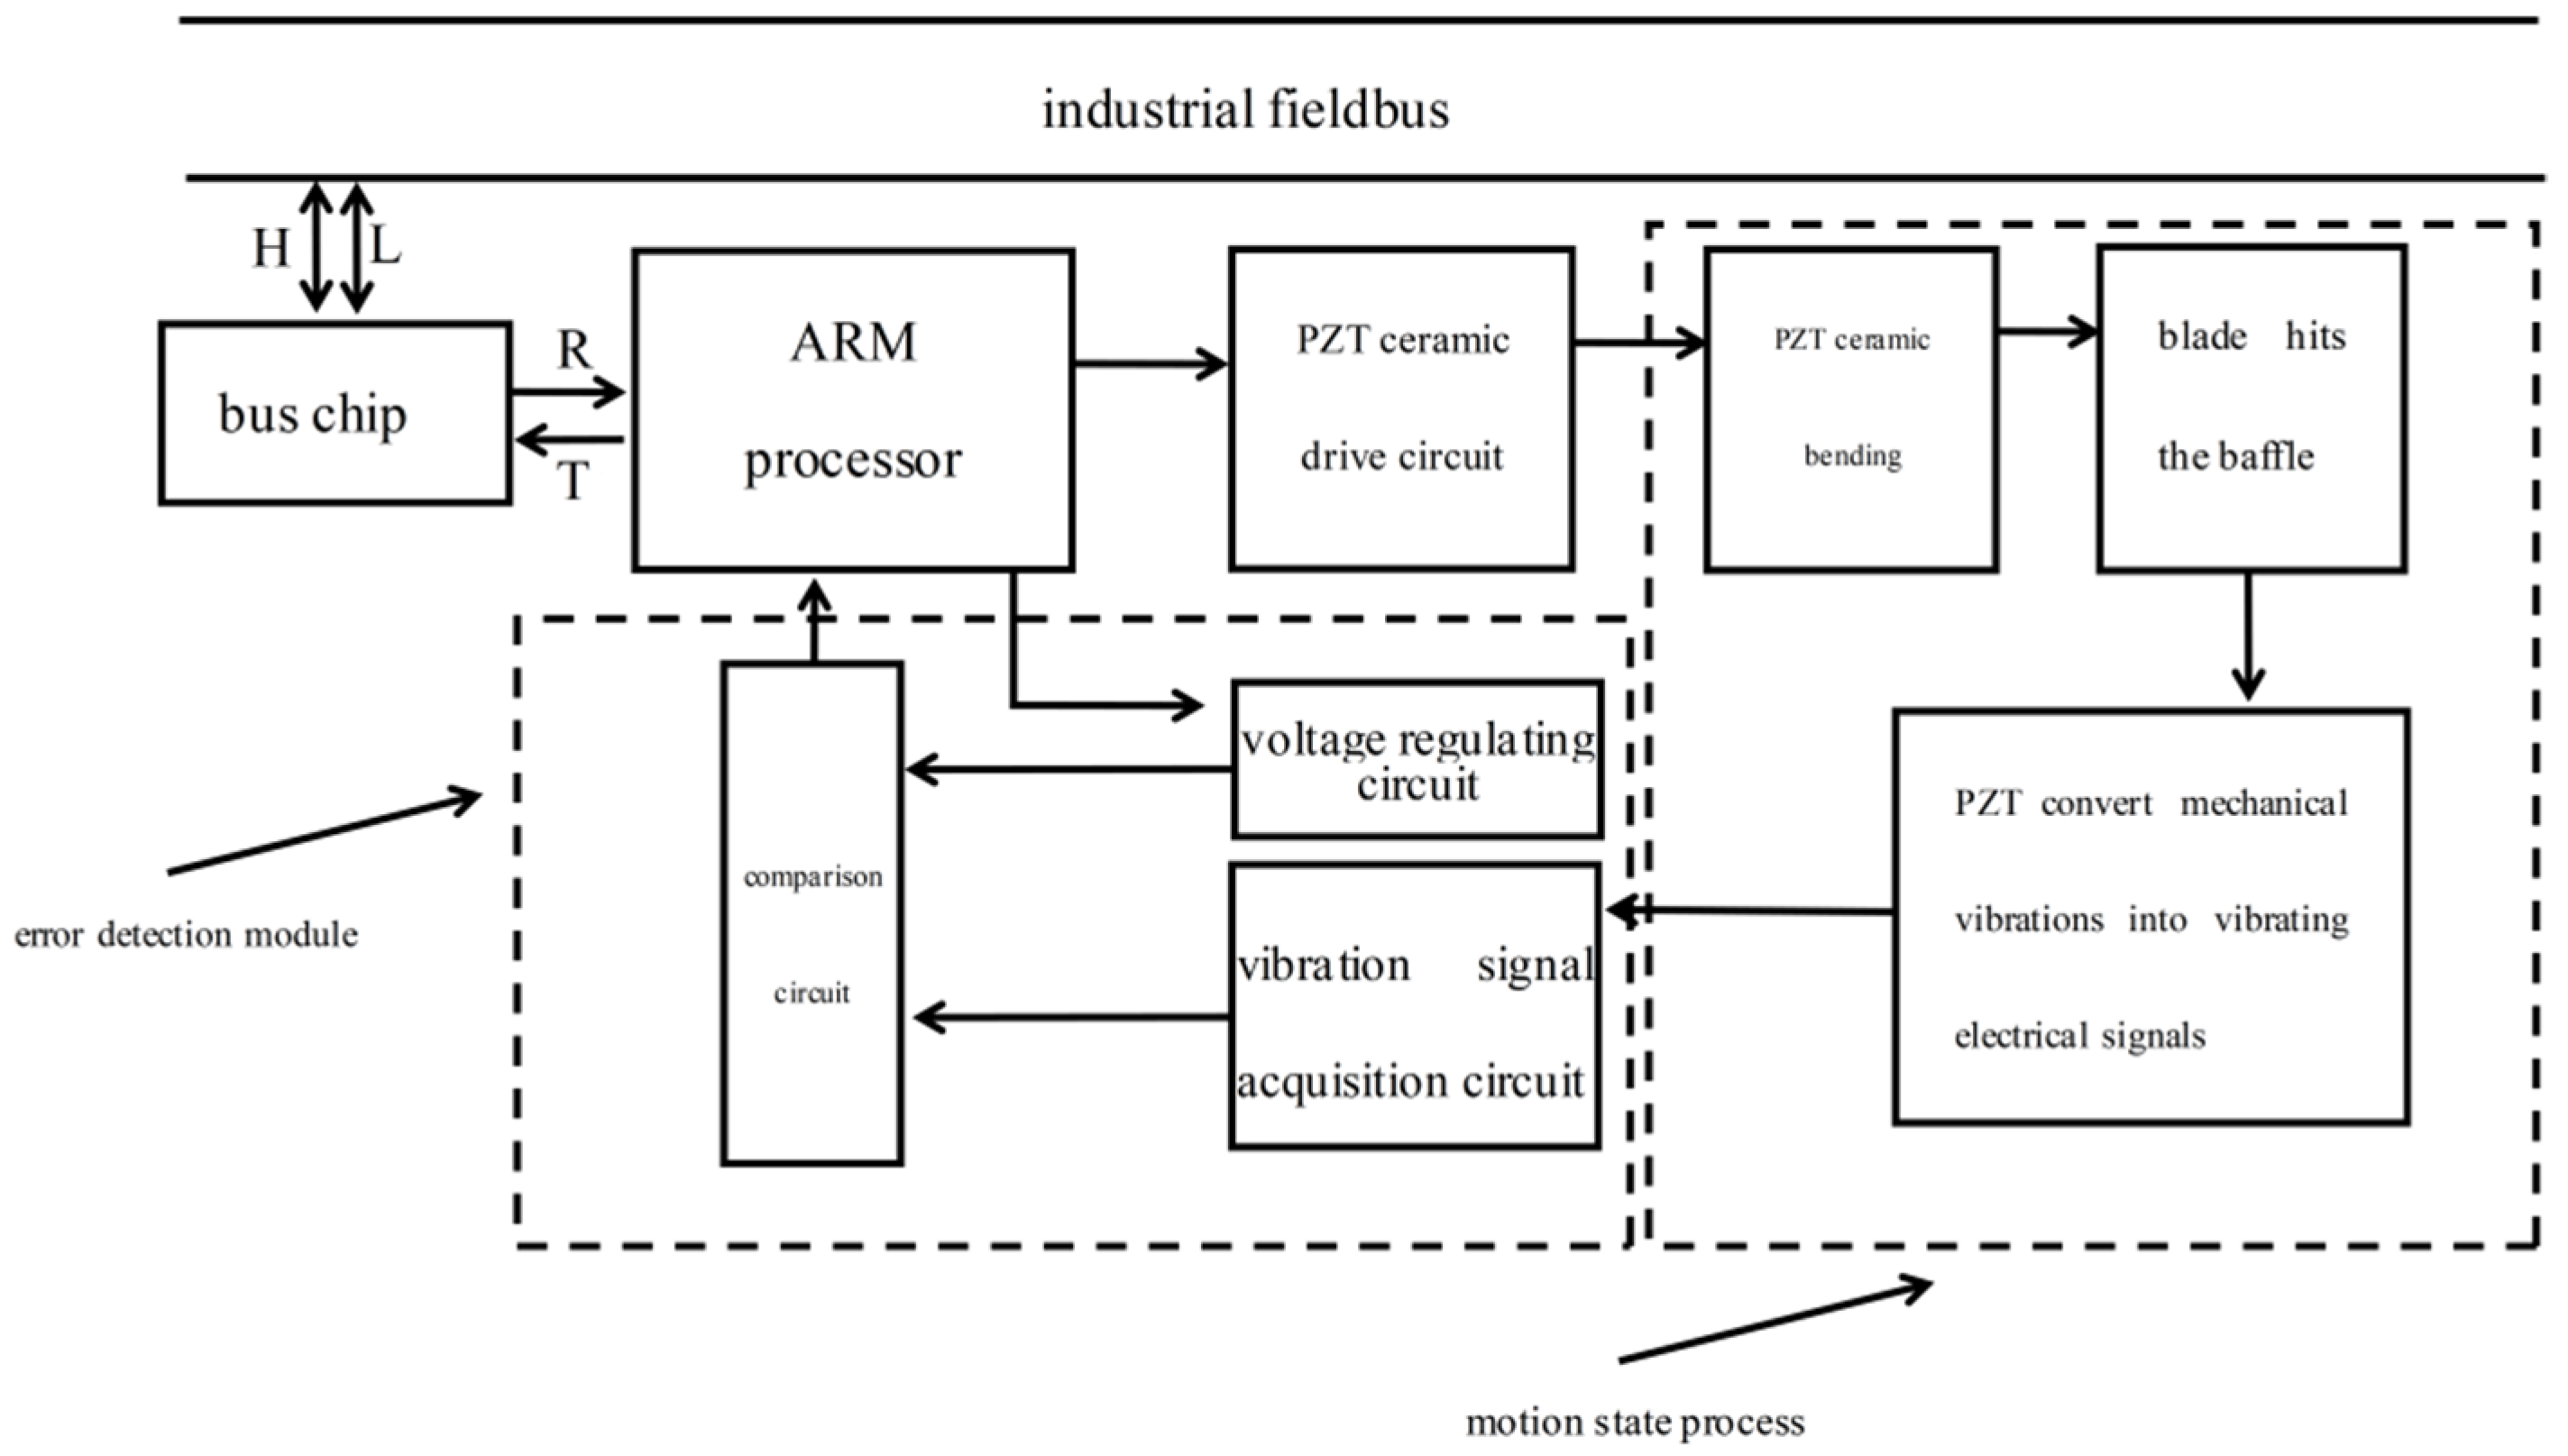
2.2. The Overall System Structure

The piezoelectric needle selector is connected to an industrial fieldbus [25] when in operation. It is controlled to position the blades appropriately by parsing the communication protocol in the industrial fieldbus. The schematic diagram illustrating the overall control system is shown in Figure 2.
As depicted in Figure 2, ‘H’ and ‘L’, respectively, represent the differential signals in the industrial fieldbus. The bus chip converts these differential signals into a single-ended signal, denoted as ‘R’, which is received by the ARM processor. The ARM processor controls the bending direction of the piezoelectric ceramics through the piezoelectric ceramic driver circuit, thus driving the rotation of the needle selector blade. When the needle selector blade collides with the upper and lower limit stoppers, the piezoelectric ceramic sensor converts the mechanical vibration signal on the stopper into a vibration electrical signal. A voltage comparator compares the vibration electrical signal from the vibration signal acquisition circuit with the output voltage of the voltage regulation circuit and feeds the comparison result into the ARM processor. The voltage at the output of the voltage regulation circuit is determined by its input signal.
When the needle selector operates abnormally, the output voltage of the comparator circuit differs from the output voltage during normal needle selector operation. The ARM processor can diagnose faults by comparing the output status of the comparator circuit. When a fault is diagnosed, the ARM processor sends a single-ended fault signal, denoted as ‘T’, to the bus chip. The bus chip converts this fault signal into a differential signal and transmits it to the industrial fieldbus.

3. Key Hardware Circuit Design

The key hardware circuits of the piezoelectric needle selector system for closed-loop fault detection based on the PZT sensor include the piezoelectric ceramic drive circuit and the fault detection module circuit. Given that there has been considerable research in the field of bus driver chips and ARM processors [26], and the selected driver chip is similar in functionality to an ARM processor, this paper focuses on the design of the key hardware circuits.

3.1. The Piezoelectric Ceramic Drive Circuit

The motion control of the needle selector blade between the upper and lower limit positions is actually the process of the piezoelectric ceramic sheet undergoing bending deformation under the reverse piezoelectric effect, resulting in the fixed-axis rotation of the blade under the constraint of the pivot hinge [27,28]. Through a systematic analysis of the internal structure of the 49U-416NL-GR piezoelectric needle selector (16 blades, drive voltage 200 V) from Taiwan’s Yi-Da Corporation, a piezoelectric ceramic sheet drive circuit has been designed.
Figure 3a shows the piezoelectric ceramic sheet consisting of piezoelectric ceramic layer 1, a steel baffle, and piezoelectric ceramic layer 2 bonded together. Electrode lead-out pin 1 and electrode lead-out pin 2 are electrically connected to piezoelectric ceramic layer 1 and piezoelectric ceramic layer 2, respectively. When switching the applied drive voltage between the surfaces of piezoelectric ceramic layer 1 or piezoelectric ceramic layer 2, under the effect of the inverse piezoelectric effect, the piezoelectric ceramic sheet bends and deforms, thereby converting it into the fixed-axis rotation of the needle selector blades.
Based on the analysis of the bending principle of the piezoelectric ceramic sheet mentioned above, the piezoelectric ceramic driving circuit can be implemented in two ways. The first way involves using two output ports of the ARM processor to independently control the voltage states at the ends of piezoelectric ceramic layer 1 and piezoelectric ceramic layer 2. The second way involves using only one output port to synchronously control the voltage states at both ends of the two piezoelectric ceramic layers. In both methods, it is crucial to ensure that only one end of the piezoelectric ceramic layer has a stable drive voltage during operation. Considering the various interrupts and program scheduling modes that the ARM processor may encounter during program execution, using the first method may lead to differences in the timing of level control between the two IO ports, resulting in instability in the motion of the needle selector. Therefore, the design of the driving circuit should adopt the second method.
To ensure that the piezoelectric ceramic layers have a sufficient voltage applied to produce normal bending deflection in the piezoelectric ceramic sheet and, thus, control the fixed-axis rotation of the needle selector, it is necessary to convert the low-voltage signals from the ARM chip’s IO ports to high-voltage levels. Typically, high-voltage logic level converter chips can be used for this purpose, but traditional high-voltage logic level converters have limited electrical isolation capabilities. Optocoupler chips can not only achieve low to high-voltage conversion but also ensure electrical isolation between the input and output sides. Taking the LTV-352T high-voltage, high-sensitivity optocoupler from the Taiwan JIH3EAN Electronic Technology Co., Ltd. as an example, the optocoupler’s output side can withstand up to 300 V and can handle a maximum working current of 150 mA; this not only enables voltage conversion but also provides high driving capability. Considering these factors, an optocoupler chip is selected as the signal conversion component for the low-voltage to high-voltage conversion in the piezoelectric ceramic driving circuit.
Based on Figure 3a, it can be observed that electrode lead-out pin 1 and electrode lead-out pin 2 on the piezoelectric ceramic sheet are connected to the power supply and ground, respectively. Electrode lead-out pin 3 serves as the common electrode. When the common electrode is connected to the ground, piezoelectric ceramic layer 1 undergoes bending deformation, causing the steel piece and piezoelectric ceramic layer 2 to deform accordingly. Conversely, when the common electrode is connected to the power supply, piezoelectric ceramic layer 2 undergoes bending deformation, causing the steel piece and piezoelectric ceramic layer 1 to deform under the applied voltage.
According to the control requirements mentioned above, the design diagram of the drive circuit is illustrated in Figure 3b. In the diagram, ‘S’ represents the output signal from the ARM processor’s IO port, and ‘VCC’ and ‘GND’ represent the power supply and ground for the control circuit, respectively. ‘P1’ and ‘P2’ represent the optocoupler chips, ‘R1’ and ‘R2’ are current-limiting resistors, ‘200 V’ and ‘200VGND’ are the power supply and ground for the drive circuit, and ‘R3’, ‘R4’, and ‘R5’ are current-limiting resistors. ‘O1’ represents the connector, and its labels ‘V’, ‘G’, and ‘X’ correspond to the electrical connections for electrode lead-out pin 1, electrode lead-out pin 2, and electrode lead-out pin 3. When ‘S’ is at a logic-high level, the piezoelectric ceramic sheet bends, controlling the movement of the blade in one direction. Conversely, when ‘S’ is at a logic-low level, the piezoelectric ceramic sheet bends in the opposite direction, controlling the blade’s movement accordingly.

3.2. The Fault Detection Module Circuit

The fault detection module circuit is a crucial hardware circuit module for detecting faults in the needle selector. It is composed of a PWM voltage regulation circuit [29], a vibration signal acquisition circuit, and a comparator circuit. The PWM voltage regulation circuit generates voltage with corresponding amplitudes by using PWM waveforms of different duty cycles at a specific frequency generated by the ARM processor. The vibration signal detection circuit is required to fulfill the functions of collecting weak vibration signals and processing them [30,31]; this involves processing the vibration signals output by the piezoelectric ceramic sensor and converting them into appropriate signal outputs. The comparator circuit compares the voltage output from the PWM voltage regulation circuit with the waveform output from the vibration signal acquisition circuit. The result of this comparison is used to determine whether the needle selector’s operation is abnormal. The schematic diagram of the fault detection module circuit is depicted in Figure 4.
Figure 4a depicts the PWM voltage regulation circuit, which serves the purpose of converting the PWM waveform output by the ARM processor into a controllable analog voltage. The first stage consists of ‘R6’ and ‘C1’, forming the first-level RC filtering circuit, while ‘R7’ and ‘C2’ constitute the second-level RC filtering circuit. ‘U1A’ functions as a voltage follower circuit. After passing through a transistor for enhanced driving capability and subsequently traversing two RC filtering circuits as well as a voltage follower circuit, the circuit generates an analog voltage denoted as ‘FP’. The quality of this analog voltage is closely associated with the values of resistors and capacitors in the RC circuits, necessitating a theoretical analysis for their selection. The characteristics of the PWM waveform can be described using the functional expression provided by Equation (1).
f ( t ) = { V l V h n + k T t ( k + 1 ) T k T t n + k T
In Equation (1), ‘T’ stands for the period of the PWM waveform, ‘K’ is a counting variable with a non-negative integer value, ‘n’ represents the time occupied by the high-level voltage within one period, and ‘Vh’ and ‘Vl’, respectively, denote the high-level and low-level voltages within the PWM waveform. Performing a Fourier expansion on Equation (1) yields Equation (2).
f ( t ) = [ n T ( V H V L ) + V L ] + 2 V H V L π sin ( n T π ) cos ( 2 π T t n π T k ) + k = 2 2 V H V L π | sin ( n π T k ) | cos ( 2 π T k t n π T k )
From Equation (2), we can observe that the first term corresponds to the constant component. As ‘n’ increases, indicating an increase in the PWM duty cycle, it results in a larger output of analog DC voltage, as illustrated in Figure 5. The second term represents the first harmonic component, while the third term represents the higher-order harmonic components. To effectively filter out the higher-order harmonics, it is only necessary to design a low-pass filter that can eliminate the first harmonic component. By using RC filters with resistor values of 1 kΩ and capacitors of 0.01 uF, one can obtain an efficient analog DC voltage filtering, as mentioned earlier.
Figure 5a,b represent, respectively, the PWM waveforms with a fixed frequency of 200 kHz and different duty cycles at the ARM processor’s IO port, as well as the corresponding analog voltage values after passing through the RC low-pass filter circuit. In these figures, the vertical axis represents voltage in volts (V), and the horizontal axis represents time in microseconds (us). From Figure 5a,b, it can be observed that the low-pass filter at this impedance effectively removes harmonic components from the PWM waveform, resulting in a stable and jitter-free analog voltage, meeting the control requirements of this system.
Figure 4b illustrates the vibration signal detection circuit. ‘K’ represents the vibration signal generated when the blade edge strikes the baffle of the piezoelectric ceramic sensor. ‘R10’ and ‘C3’ together form a low-pass filter designed to eliminate high-frequency noise interference. ‘C4’ acts as a DC-blocking capacitor, removing the DC component while preserving the vibration signal. The amplification circuit consists of precision resistors ‘R8’, ‘R9’, ‘R11’, and operational amplifier ‘UIB’. It amplifies and adjusts the vibration signal to produce the ‘FK’ vibration signal. ‘R12’ serves as a pull-down resistor, ensuring that the initial voltage of ‘FK’ is clamped at 0 V. After conducting repeated tests on the vibration signal and the fault detection module, ‘R8’ and ‘R9’ were selected as 33 kΩ and 100 kΩ, respectively, resulting in a quadruple amplification of the vibration signal. Considering the symmetrical elongated structure of the piezoelectric ceramic sensor and its symmetrical attachment to the baffle, waveforms at positions ‘K’ and ‘FK’ were tested when the blade edge struck the baffle at positions corresponding to the 1st, 7th, 8th, and 16th blades.
Figure 6a–d, presented from top to bottom, respectively, show the signals at the ‘FK’ and ‘K’ locations in the vibration signal detection circuit after the impact of the 1st, 7th, 8th, and 16th needle selector blades with the baffle. The horizontal axis represents voltage in volts (V), while the vertical axis represents time in microseconds (μs). From Figure 6, it can be observed that this circuit effectively filters out the high-frequency interference and negative pressure components from the initial vibration signal waveform. Furthermore, it accurately and undistortedly amplifies the primary vibration pattern. The actual amplification factor closely aligns with the theoretically calculated value, meeting the control requirements of this system.
Figure 4c illustrates the comparator circuit. ‘R13’ functions as a pull-up resistor, ‘C5’ acts as a filtering capacitor, and together with ‘U2A’, they form the comparator operational circuit. ‘A’ represents the digital signal resulting from the comparison between ‘FP’ and ‘FK’. Initially, ‘A’ is set to a logic high level. When the processed vibration signal ‘FK’ exceeds the analog voltage ‘FP’ after passing through the RC filter, ‘A’ transitions from a logic high level to a logic low level, generating a falling edge, which is captured by the ARM processor’s external interrupt.

4. Closed-Loop Fault Detection Control Scheme

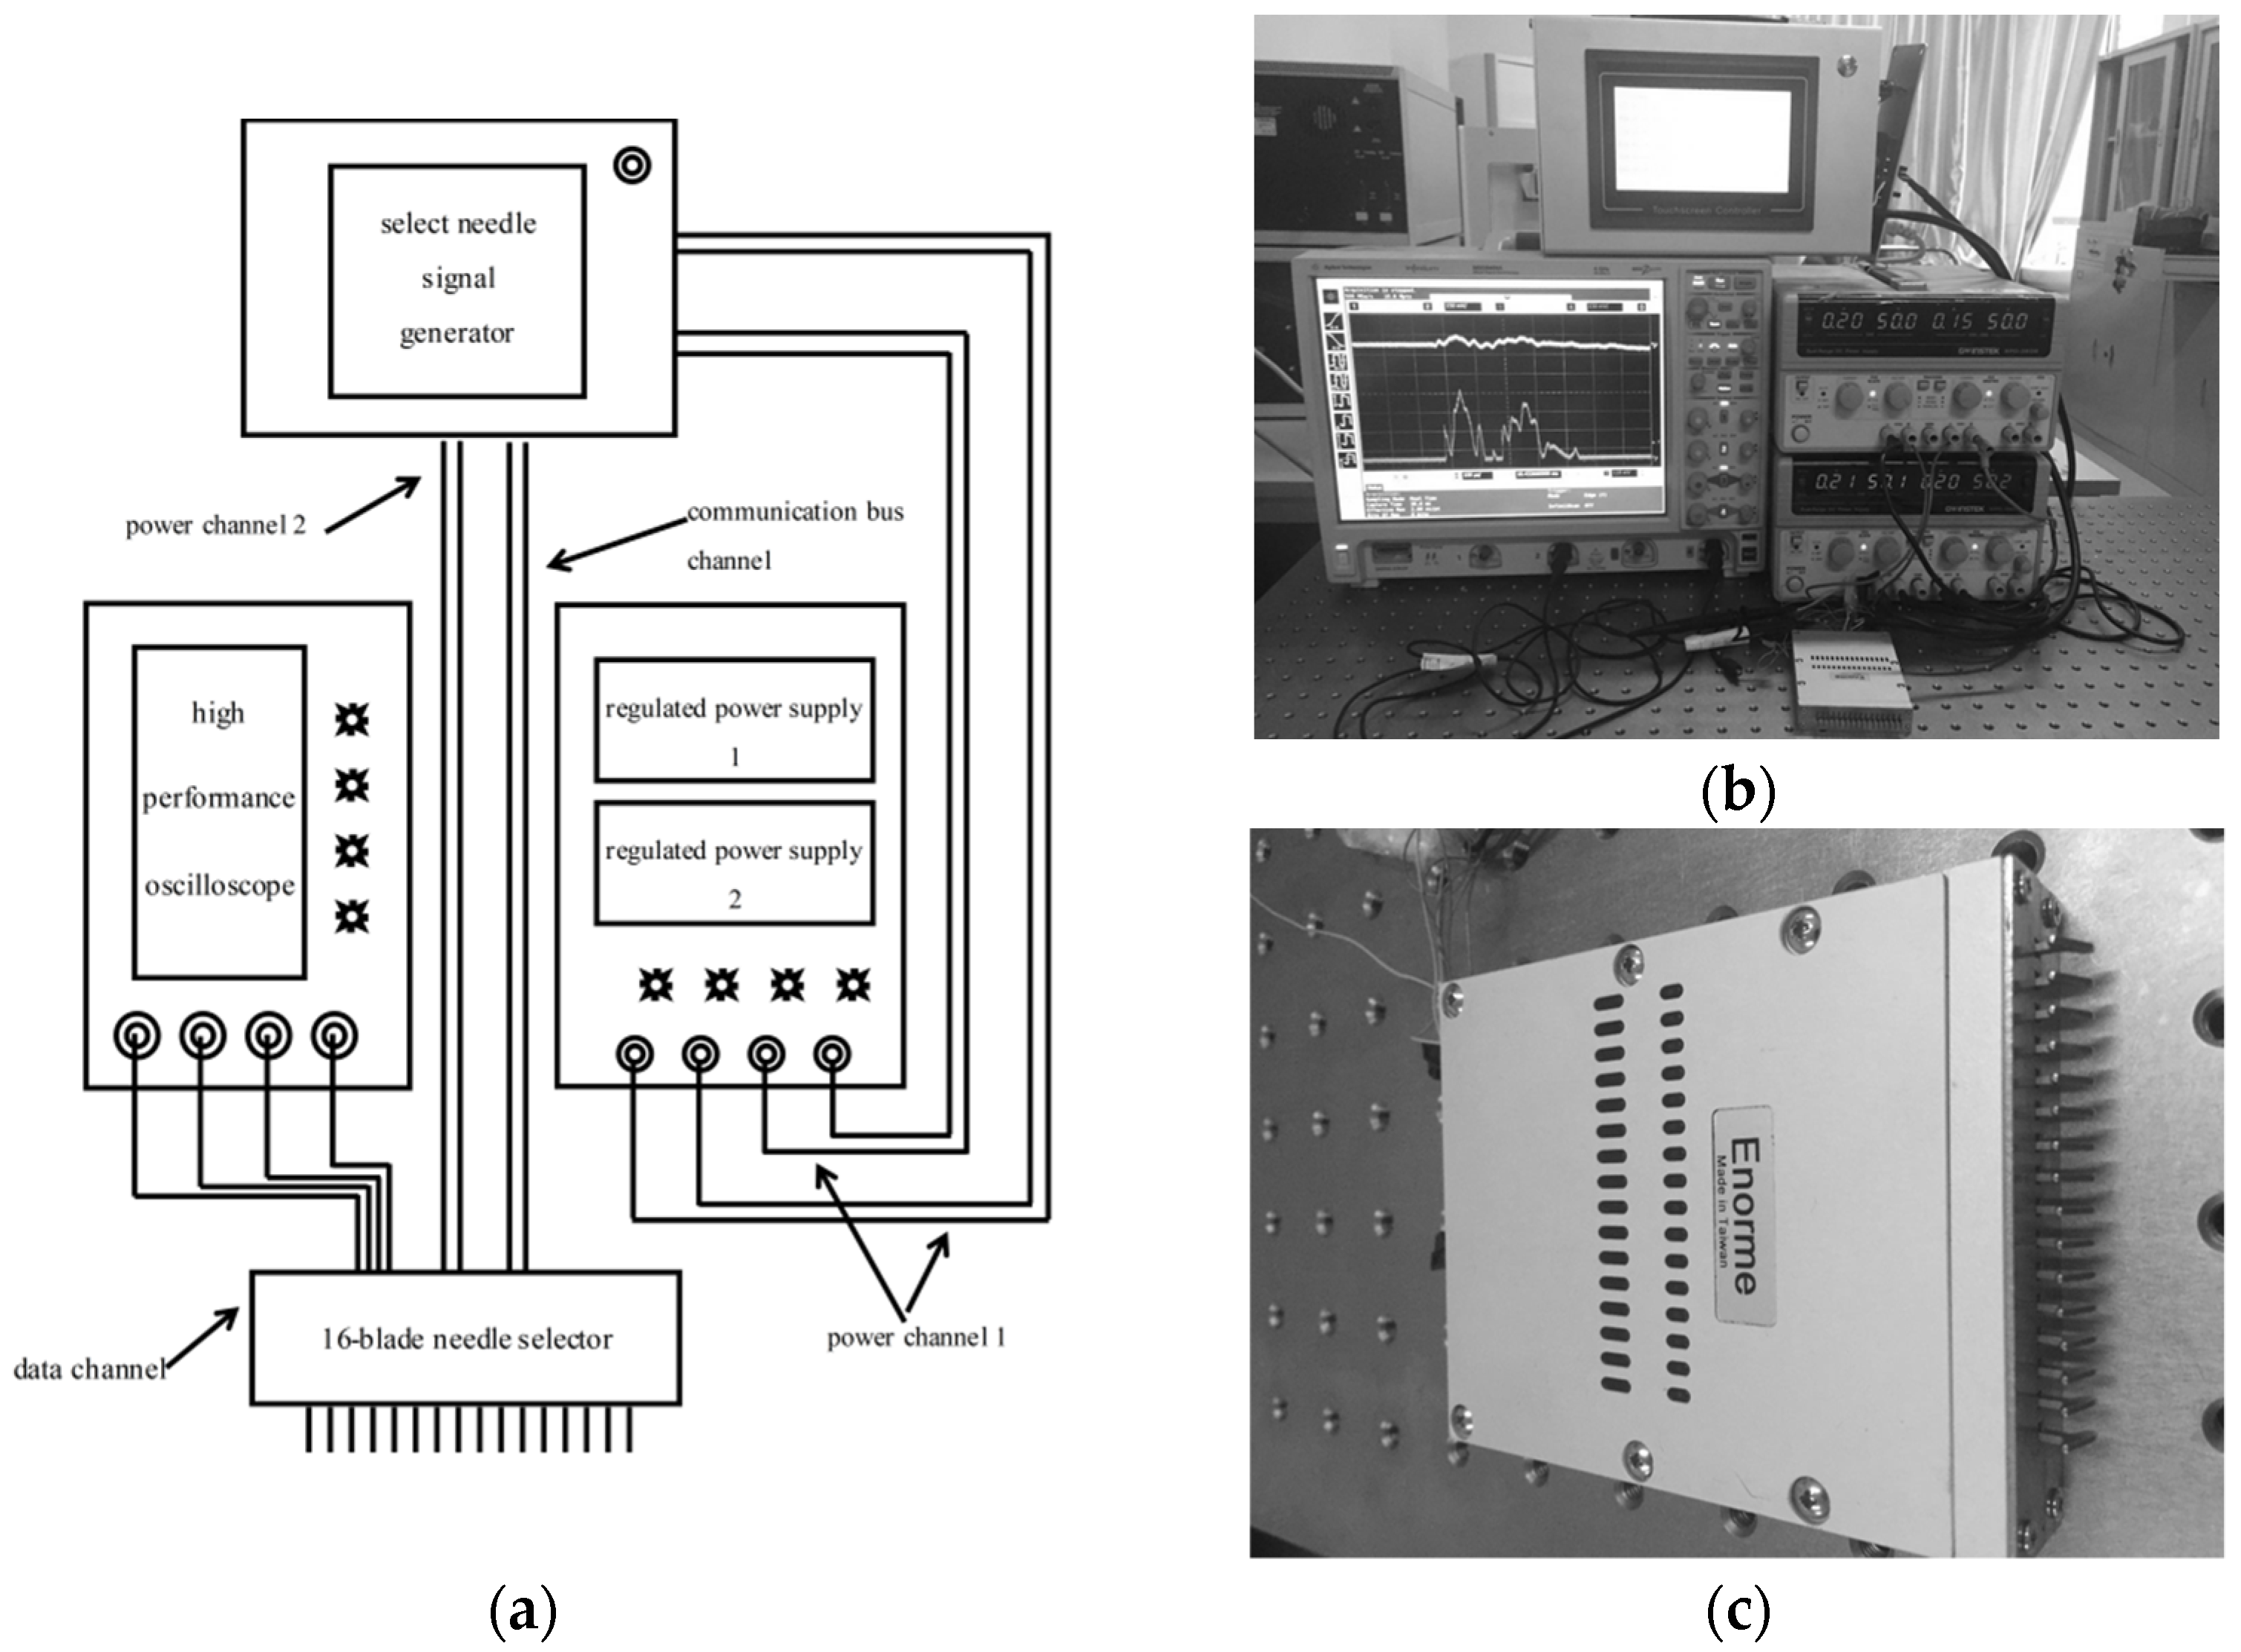
4.1. Overview of the Testing Platform

The testing platform is shown in Figure 7, where Figure 7a–c, respectively, illustrate the schematic diagram of the testing platform’s structure, the actual image of the testing platform, and the image of the 16-blade selector. The research focuses on the 16-blade, two-position piezoelectric needle selector from Taiwan’s Yi-Da, with elongated piezoelectric ceramic sensors affixed to the inside of the selector’s baffle. Two voltage regulators, labeled as ‘Stable Power Supply 1’ and ‘Stable Power Supply 2’, form the power supply unit, providing driving and control power to the needle selector’s signal generation device. The signal generation device supplies power voltage and generates analog instructions for the movement of blades, which are then transmitted to the 16-needle selector through a communication bus. The selector controls the up-and-down oscillation of specific blades in accordance with the instructions. An Agilent high-performance oscilloscope model MSO9404A is used for data acquisition, capturing waveforms at various points in the needle selector control circuit.

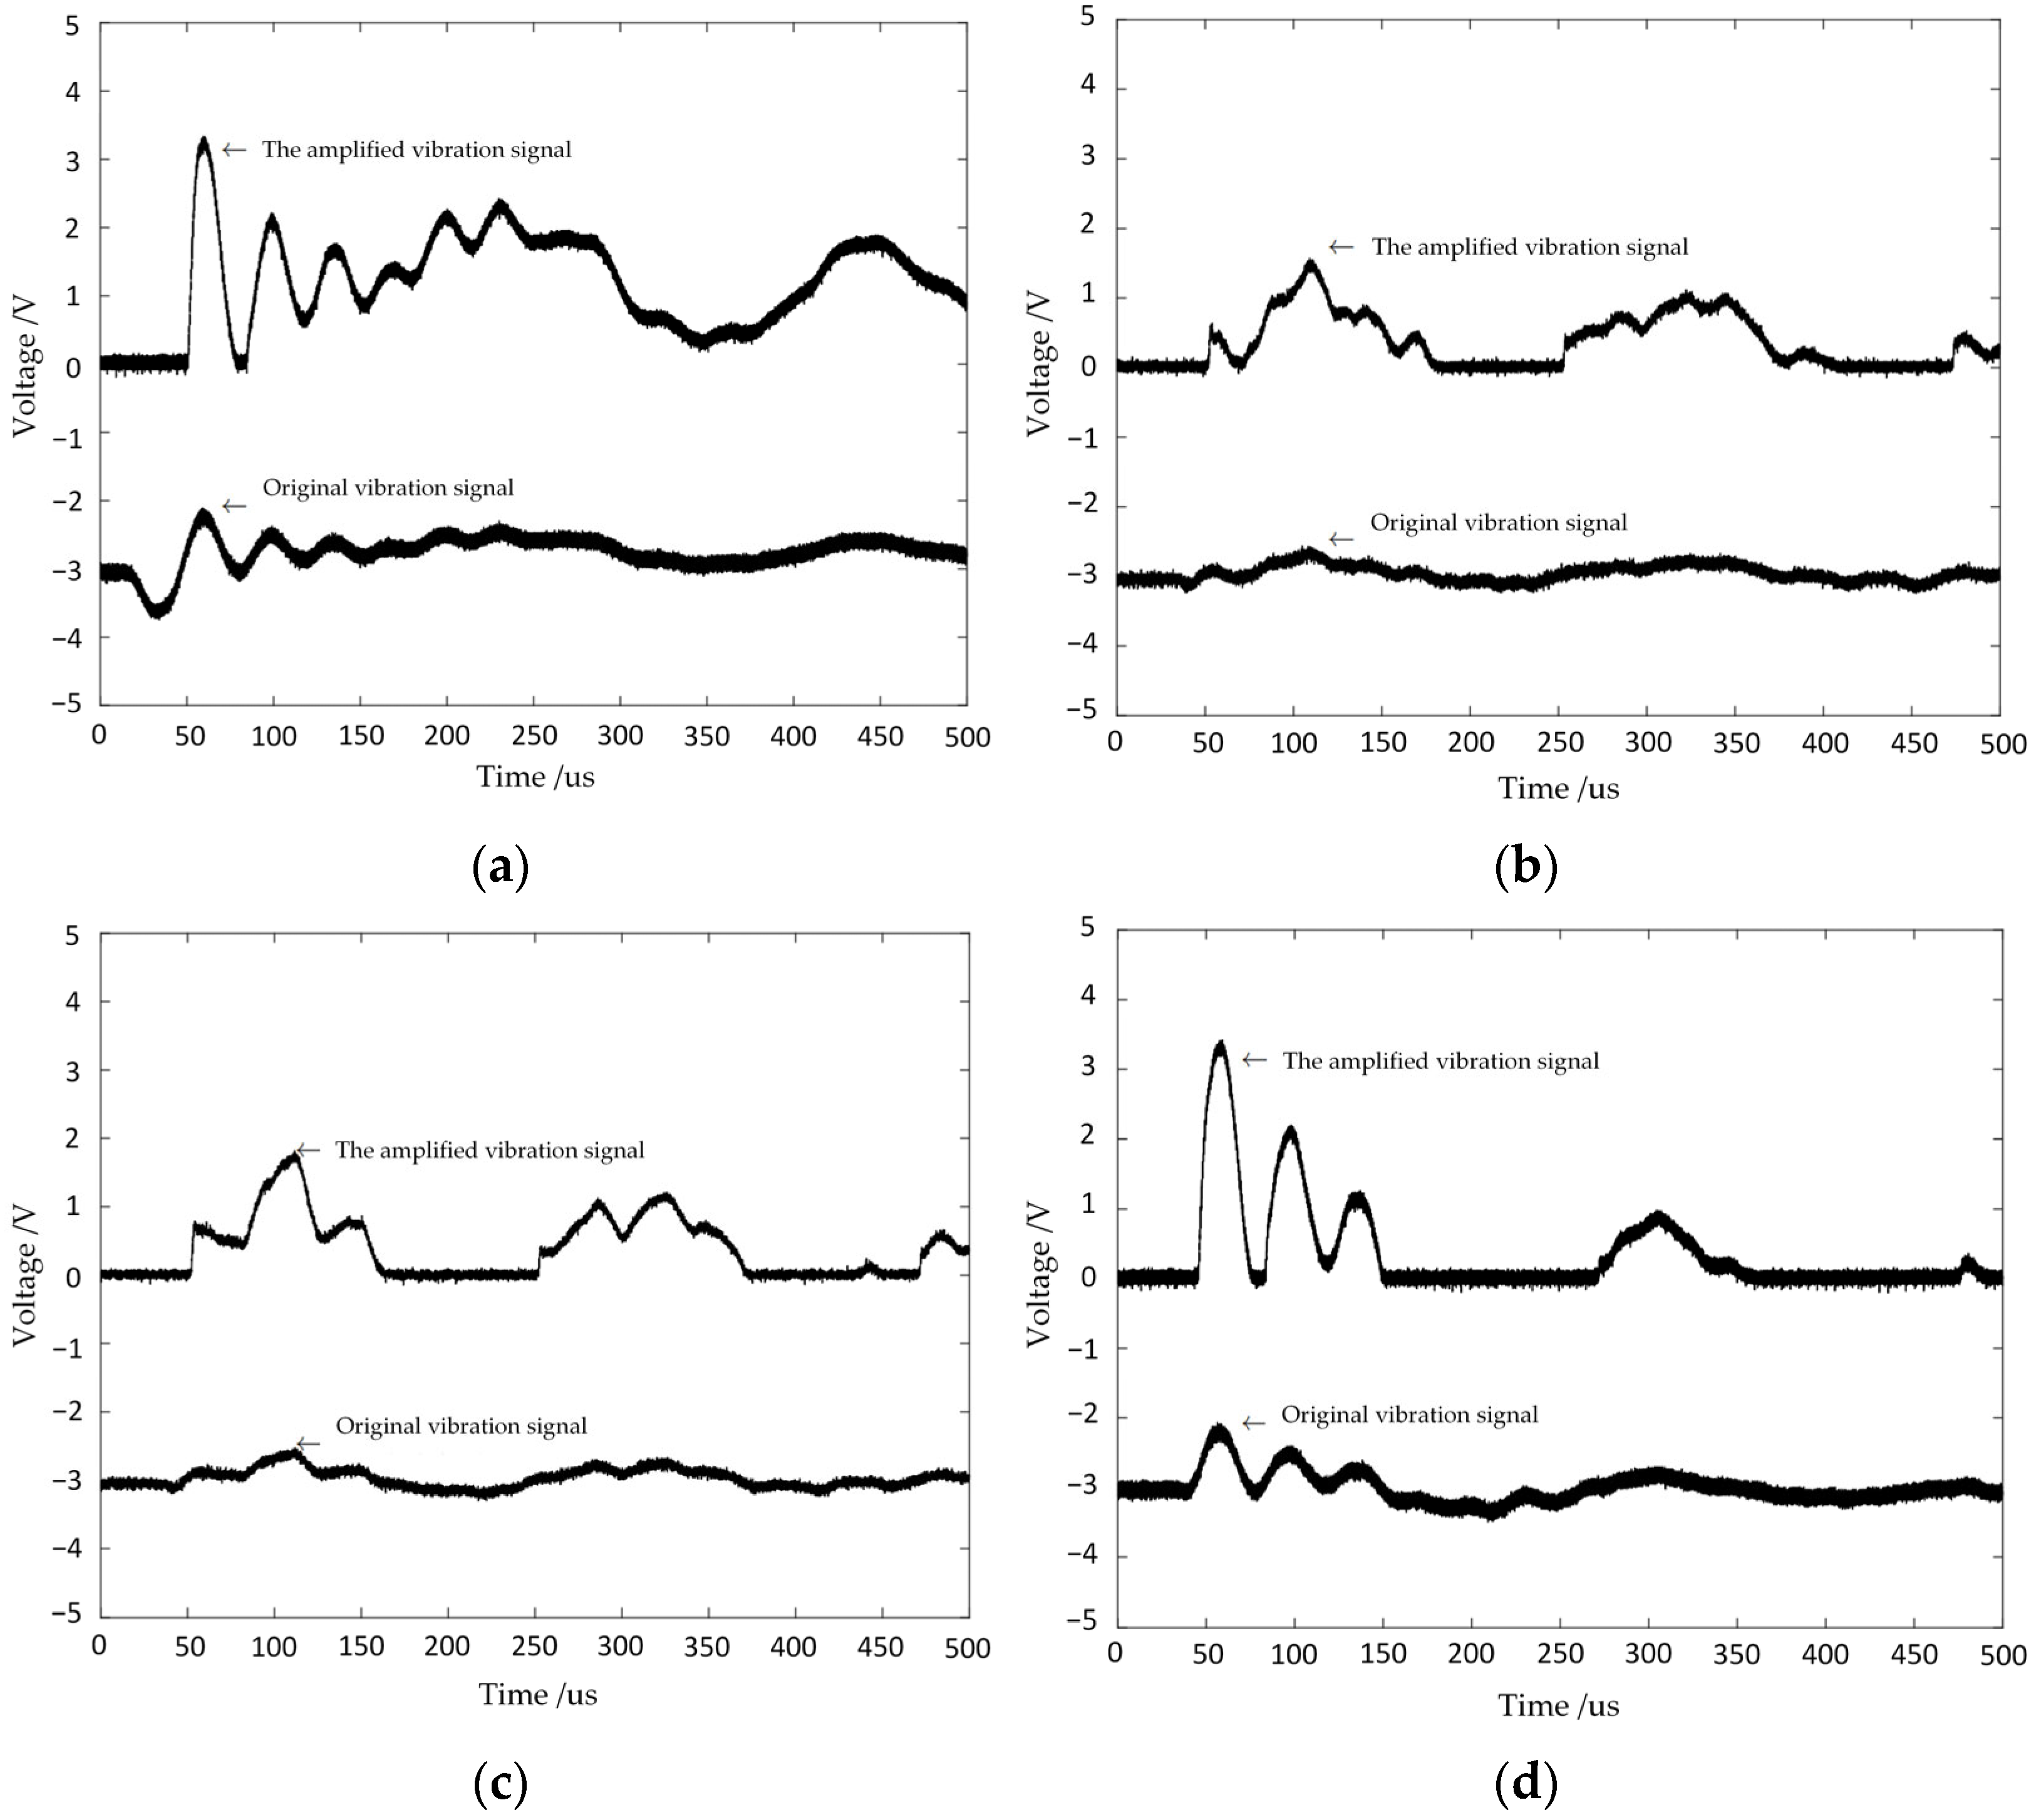
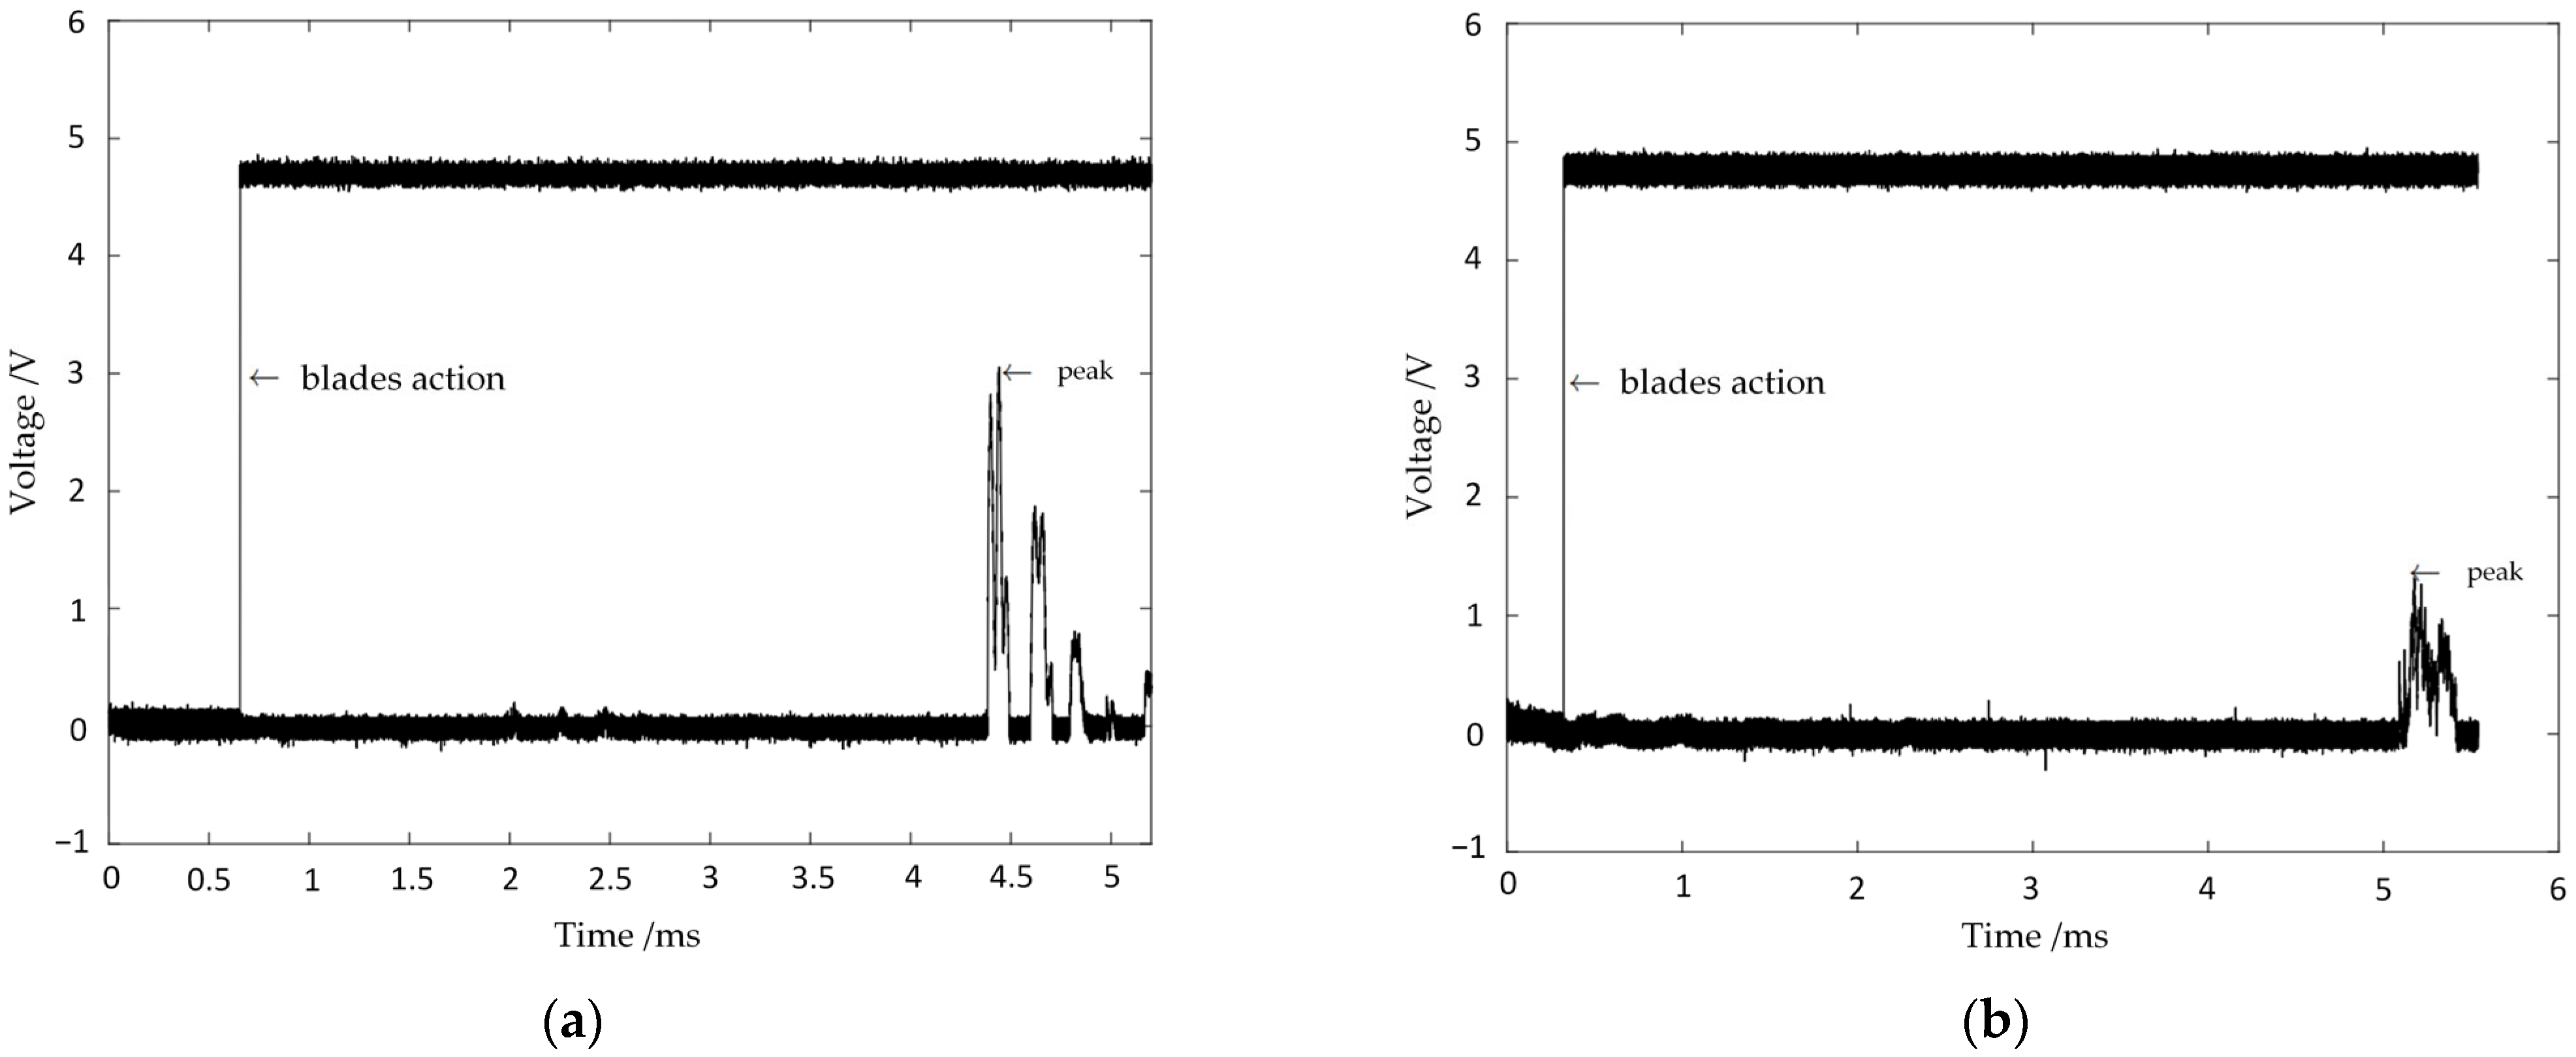
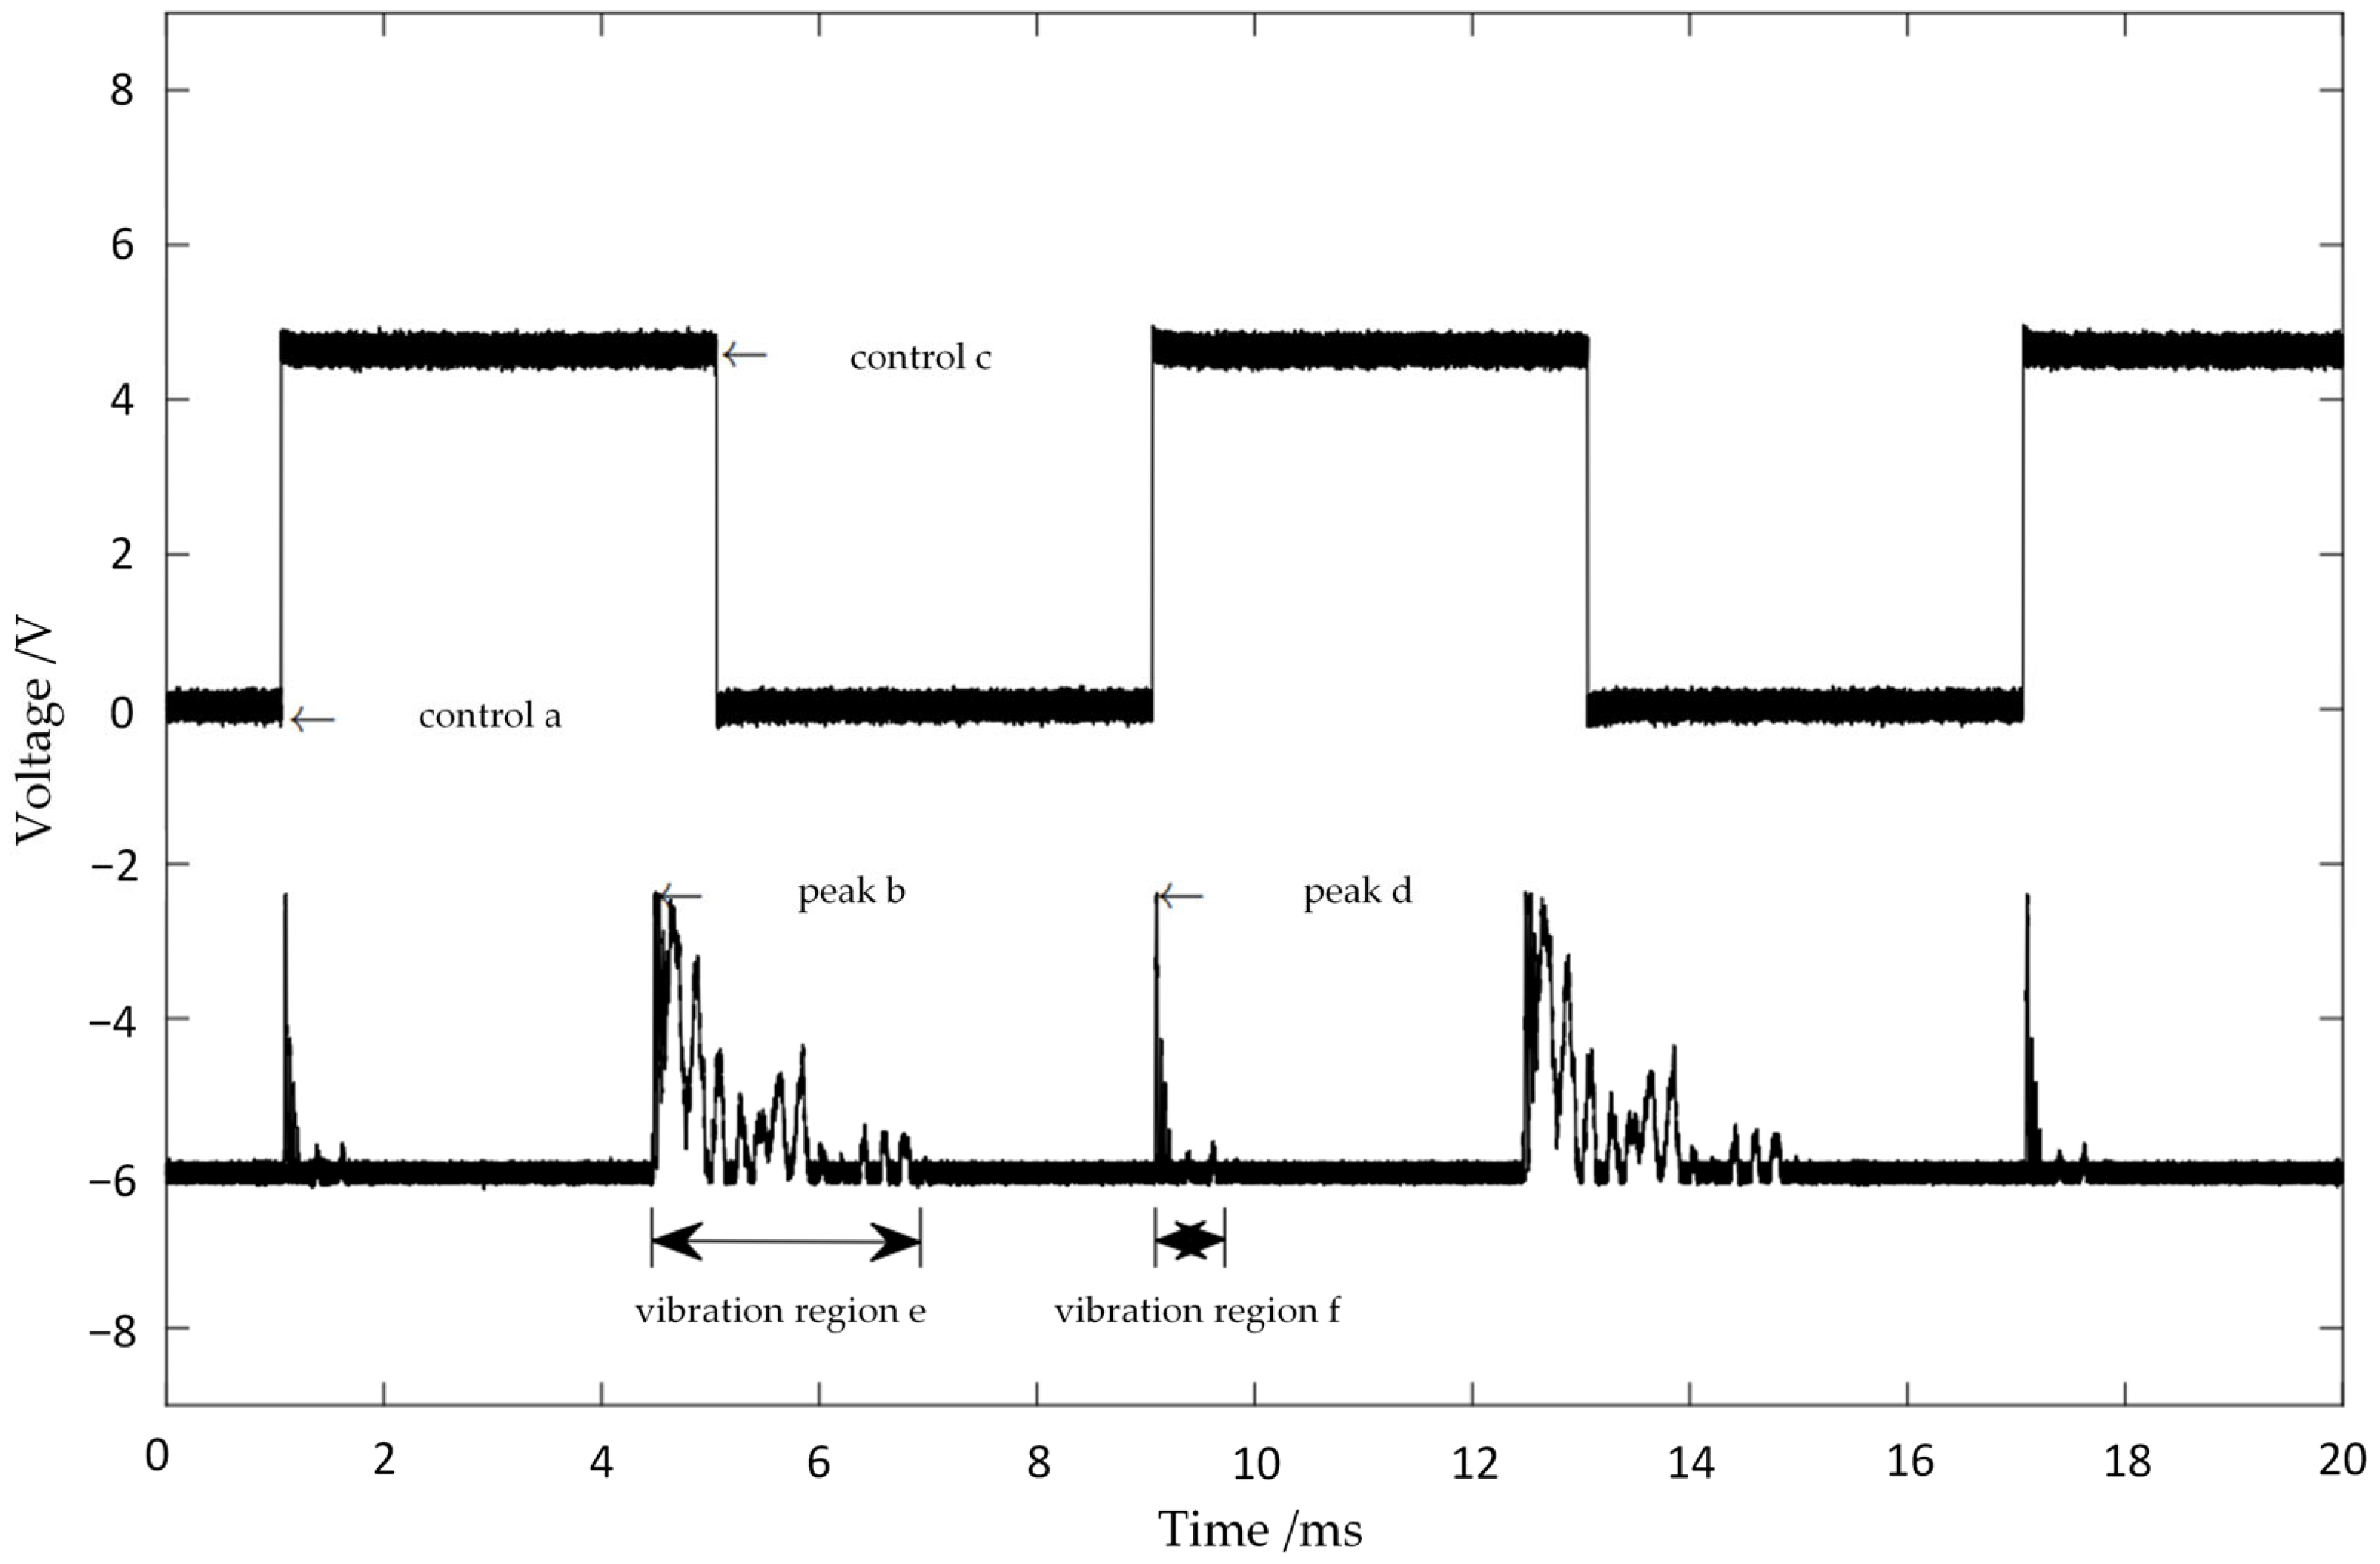
4.2. Testing and Analysis of Vibration Signals during Blade Movement
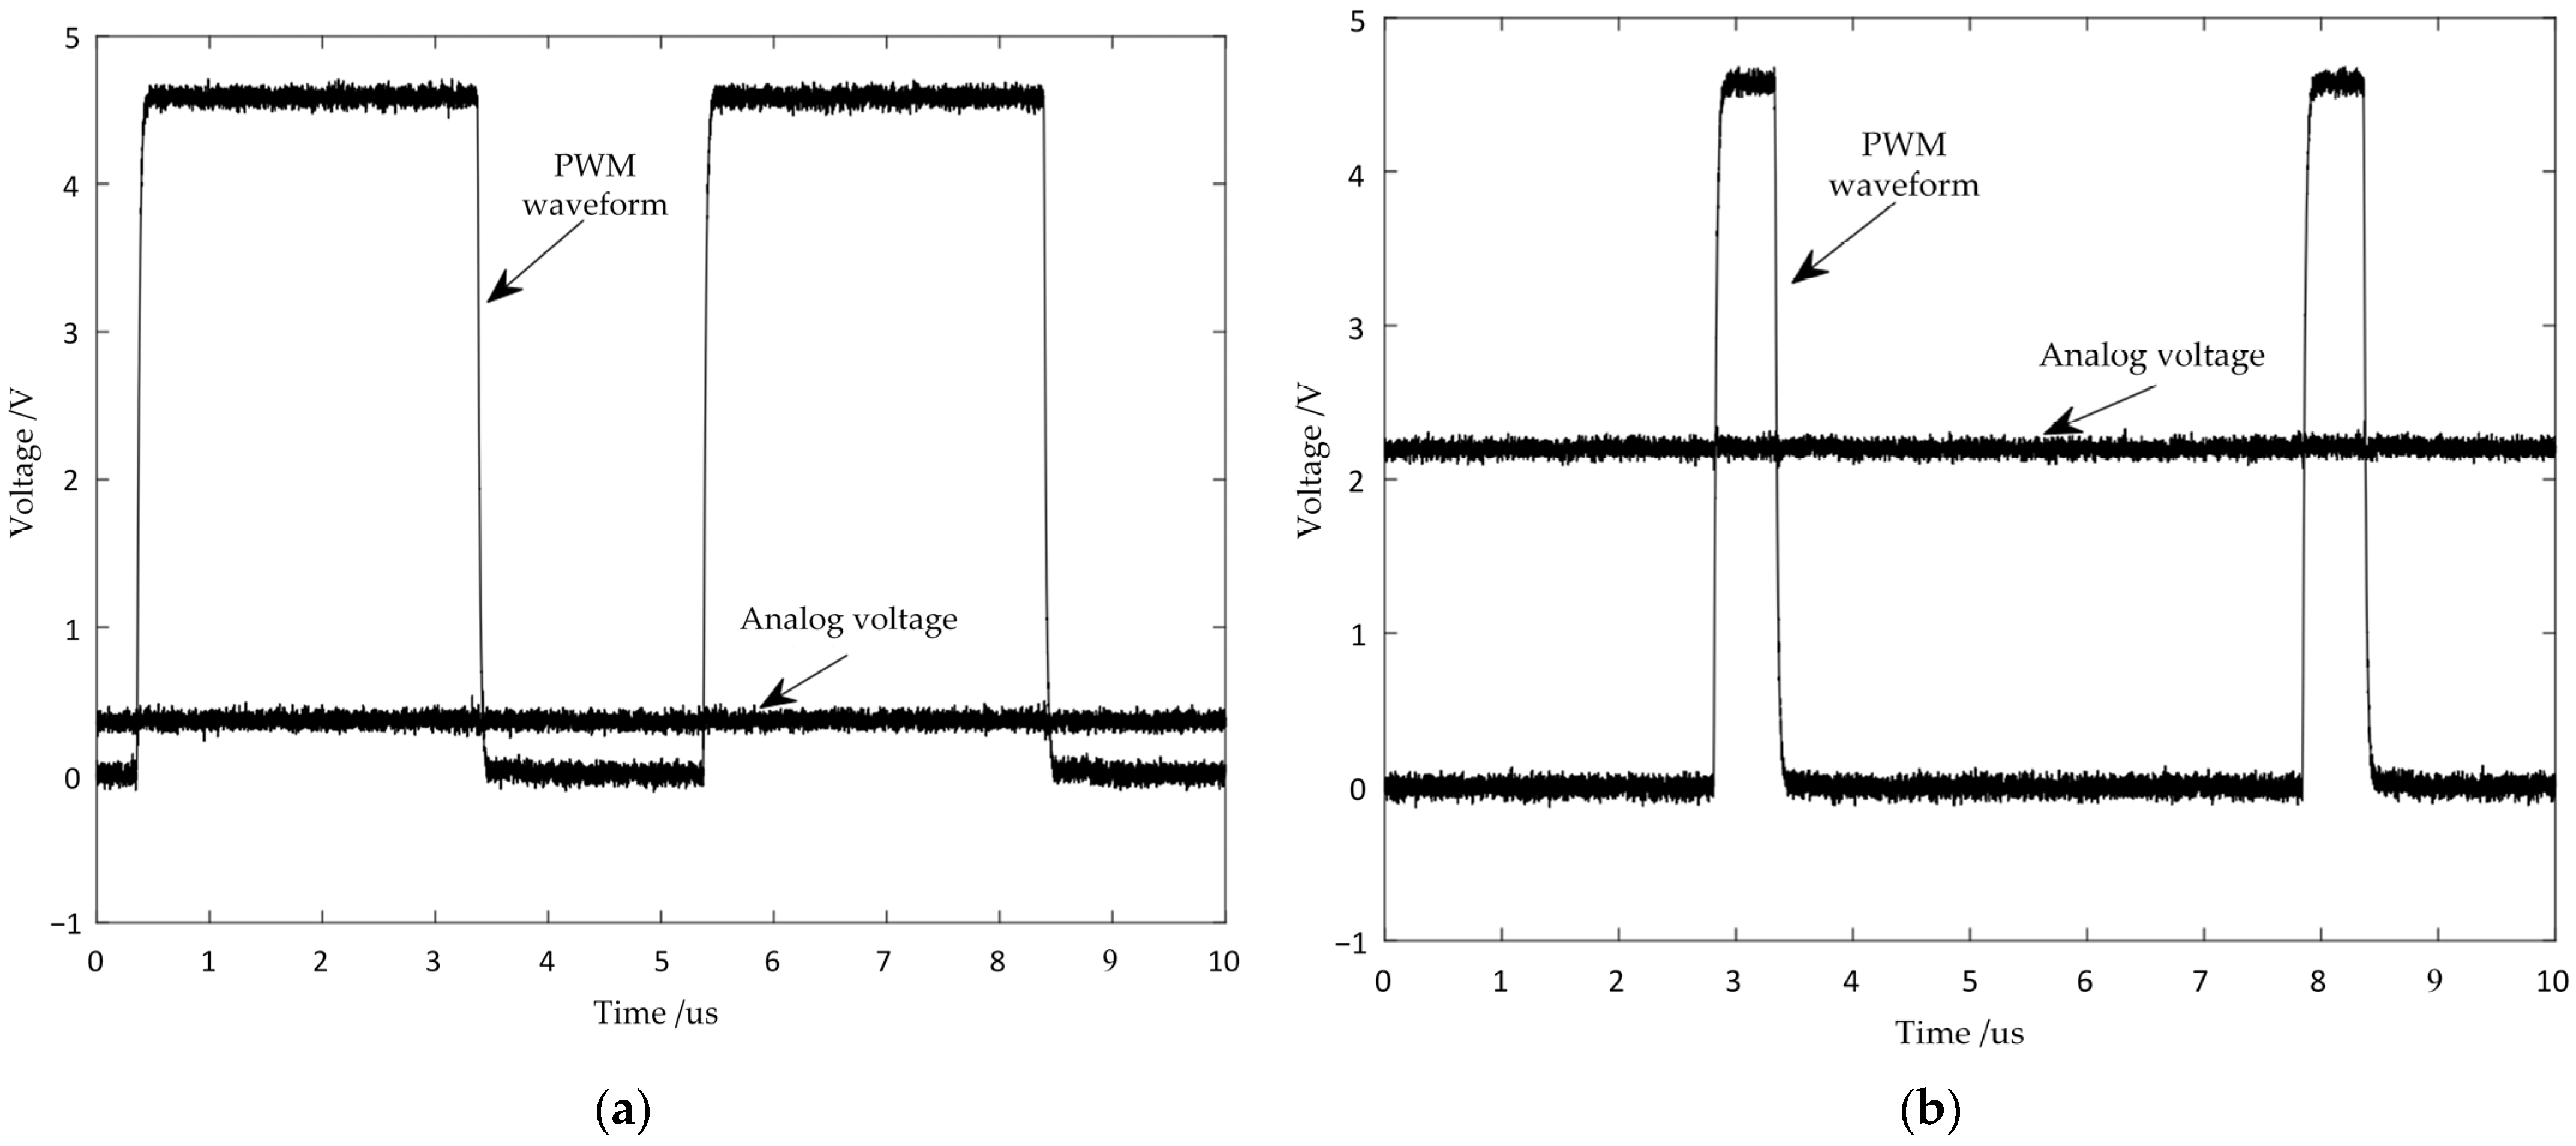
According to the principle of needle selection in electronic needle selectors [32], each needle selector controls the movement of a specific blade according to the needle position. In each specific needle position, each needle selector is responsible for controlling the oscillation of a single blade, ensuring that the action of each needle position is accurate during the knitting process. Under normal conditions, the time ‘t(i)(j)’ and the maximum value of the blade’s vibration signal ‘v(i)(j)’ on the baffle from the generation of the control signal for blade movement by the ARM processor are theoretically fixed values. Here, ‘i’ represents the order of the blade in the selector, ranging from 1 to 16, and ‘j’ represents different time values when the blade strikes the baffle.
The values of ‘t(i)(j)’ and ‘v(i)(j)’ are related to the material parameters and structural dimensions of the piezoelectric driving ceramics, the needle selector blade assembly, the needle selector baffle, and the piezoelectric ceramic sensor. They are independent of ‘j’. When ‘i’ is the same and ‘j’ varies, both ‘t(i)(j)’ and ‘v(i)(j)’ theoretically have fixed values. However, in practice, their values may exhibit slight variations within a small range for different ‘j’ values. When ‘i’ varies due to slight differences in the material parameters and structural dimensions of each blade and its corresponding piezoelectric ceramic piece, as well as differences in the impact point of each blade on the piezoelectric ceramic sensor, ‘t(i)(j)’ and ‘v(i)(j)’ will have variations in their values. These specific values can be obtained through a self-learning program algorithm, which primarily consists of the following steps.
(1)
Calibration of analog voltage values corresponding to different duty cycles of PWM.
The calibration of different duty cycles of PWM signals to analog voltage values is achieved through the use of the timer output compare function in the ARM processor. In this paper, the automatic loading value ‘C’ is set to 100, and the range of variation for the compare value ‘c’ is between 16 and 100. The timer counting time base is 0.05 microseconds, and the PWM frequency is 200 kHz. The initial output of the IO port mapped by the timer output compare function is high. When the timer count value ‘Cnt’ reaches the compare value ‘c’, the IO port outputs a low level. When the timer count value ‘Cnt’ reaches the automatic loading value ‘C’, the IO port returns to its initial high level, and the count value ‘Cnt’ is reset to zero for counting again. Therefore, different compare values correspond to different duty cycles of PWM waves, which in turn correspond to different analog voltages. The relationship between different compare values, ‘c’, and their corresponding analog voltage values, ‘FP’, was tested and organized using an oscilloscope, and the corresponding relationship is shown in Table 1 below.
(2)
The highest voltage point ‘v(i)(j)’ on the waveform at ‘FK’ and the corresponding time ‘t(i)(j)’ to reach that point.
In this study, extensive experiments were conducted under different blade oscillation frequencies. When ‘i’ is held constant, the experimental data values for ‘v(i)(j)’ and ‘t(i)(j)’ remained relatively consistent. Similar needle selectors of the same model were used, and for ‘i’ values within the range of 1 to 16, the ‘v(i)(j)’ values did not exceed 3 V. Due to material and installation differences, variations in ‘v(i)(j)’ and ‘t(i)(j)’ exist when different needle selector blade orders strike the baffle. The specific values of both ‘v(i)(j)’ and ‘t(i)(j)’ need to be learned and detected in such cases.

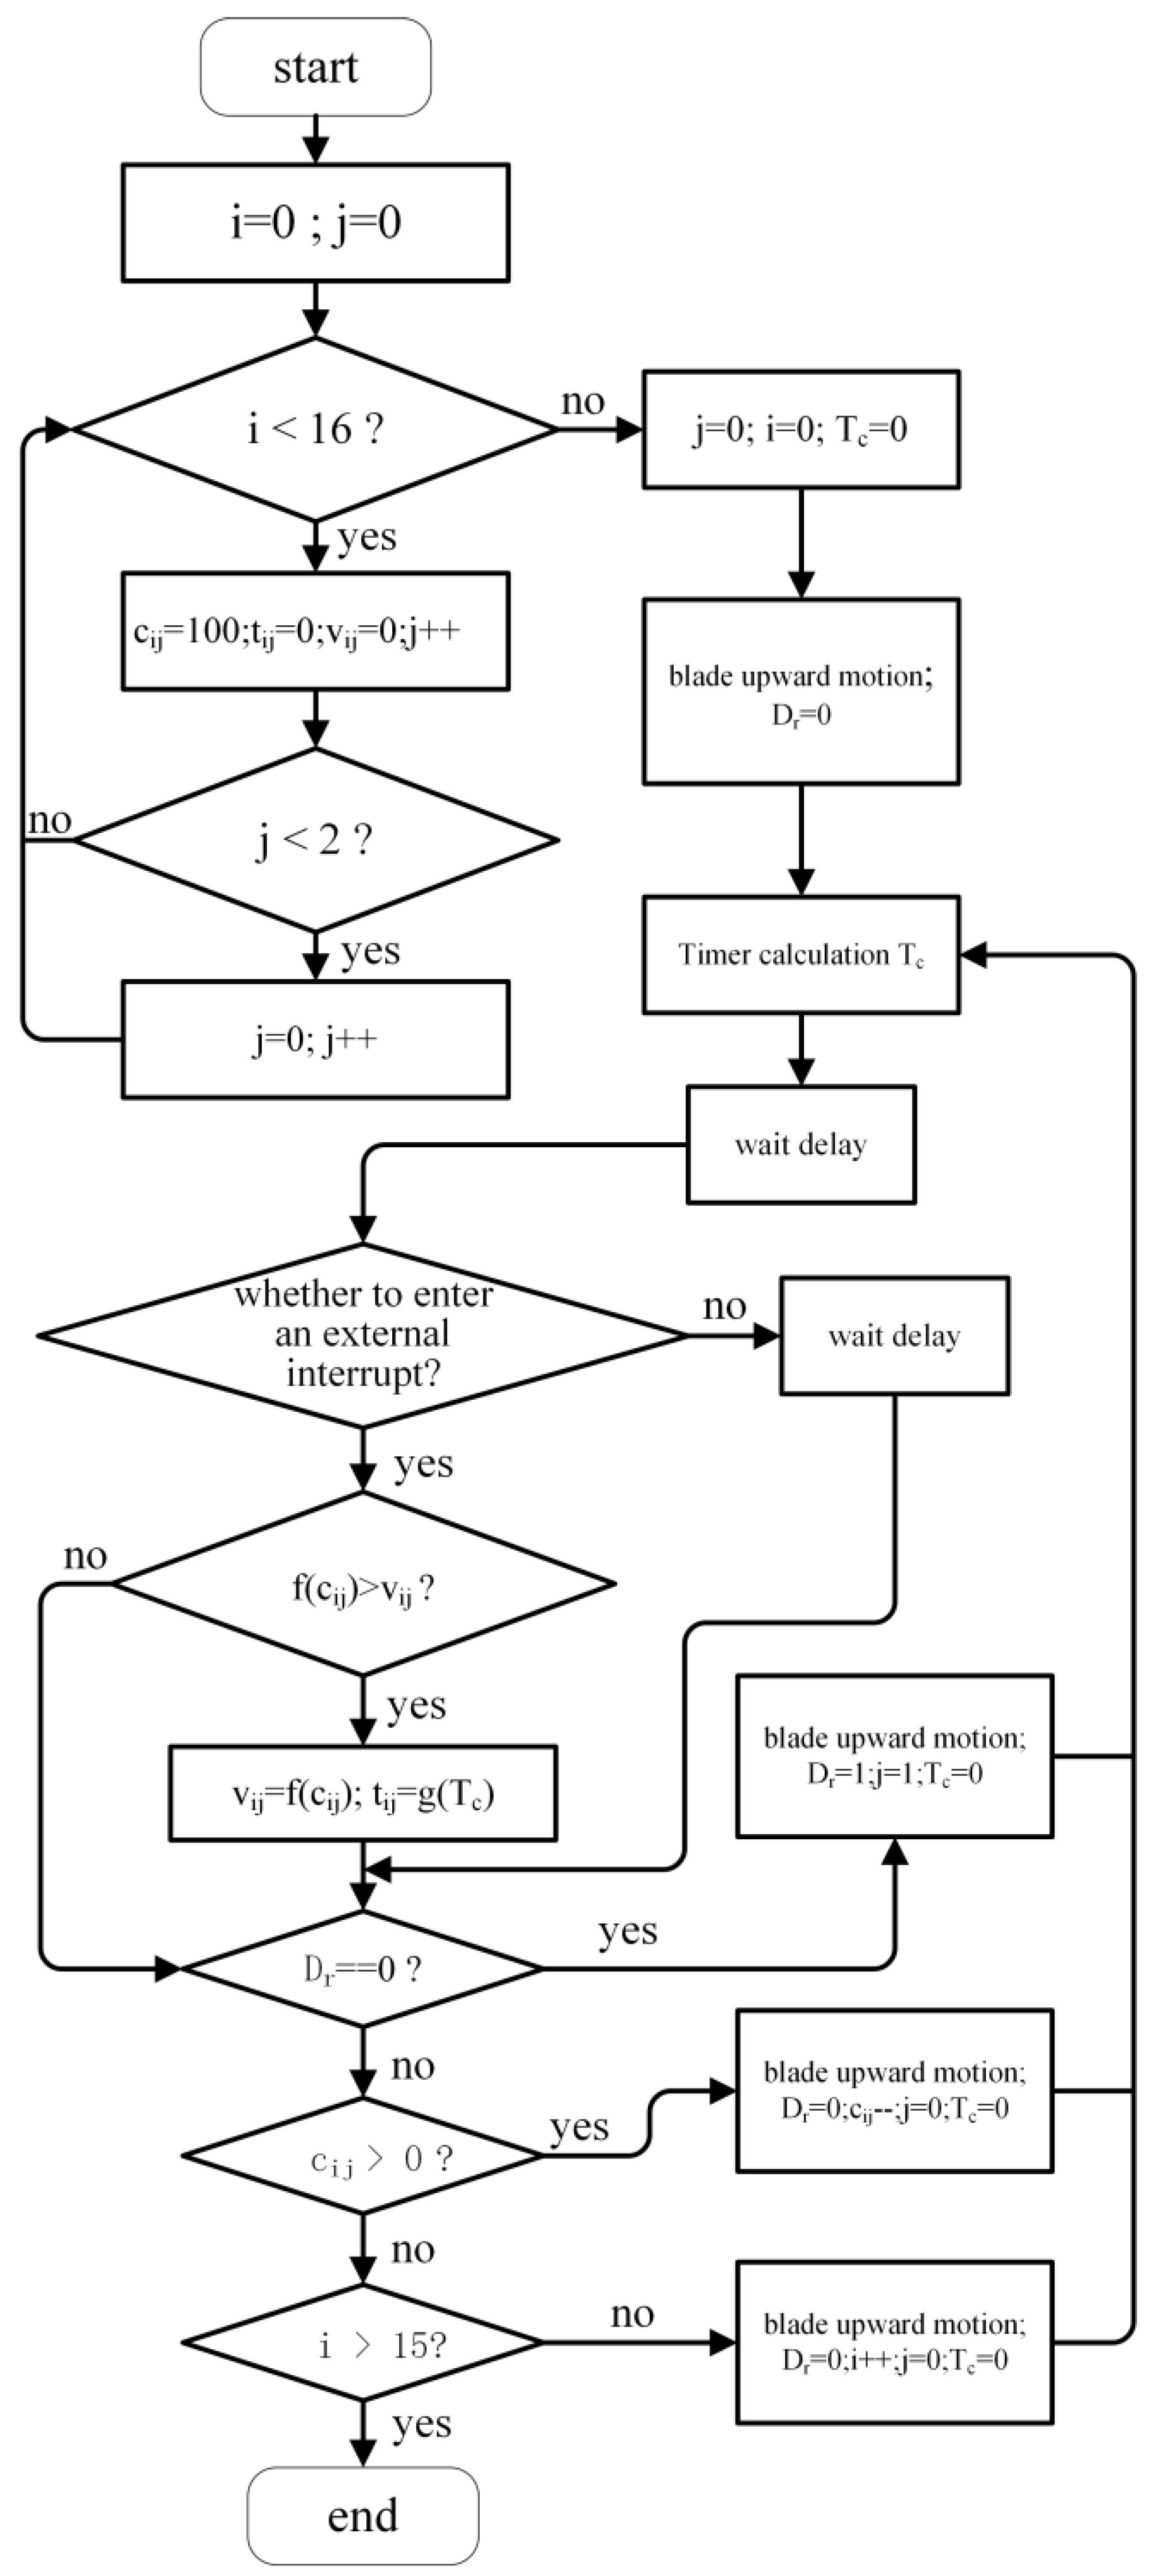
4.3. Self-Learning Program Algorithm

Based on Table 1, it is evident that when the compare value, ‘c’, varies in the range of 16 to 100, the corresponding output, ‘FP’, ranges from 0.11 to 3.87 V, and the values of ‘v(i)(j)’ remain relatively constant. Therefore, real-time adjustments are made within the interval of ‘c’ from 16 to 100. The self-learning program algorithm ensures that before the fault-detection needle selector operates normally, it controls each blade’s movement, detects the values of ‘v(i)(j)’ and ‘t(i)(j)’, and stores them in the internal memory of the ARM processor for reference. The self-learning program algorithm is depicted in Figure 8.
Figure 8 illustrates the flowchart of the self-learning program algorithm. Subscripts ‘i’ and ‘j’ represent blade order and blade movement direction, respectively. ‘cij’ represents the compare value, initially set to 100. ‘tij’ and ‘vij’ represent the time required to reach the highest voltage point at ‘FK’ and the voltage value, respectively. ‘Tc’ is the timer count value, with the timer counting every 100 microseconds, and ‘Dr’ is the blade movement direction flag, with values 0 and 1 indicating upward and downward blade movements, respectively. ‘f(cij)’ represents the ‘vij’ value corresponding to the compare value ‘cij’, as determined in Table 1. ‘g(Tc)’ represents the ‘tij’ value corresponding to the count value ‘Tc’, with a counting time base of 100 microseconds, so ‘g(Tc)’ is equal to 0.1Tc in milliseconds. The steps for obtaining vibration characteristic parameters for each blade of the selector using the self-learning algorithm are as follows:
(1)
Initialize the system’s recording values for the vibration characteristic parameters of each blade in the selector. The parameters to be initialized include the blade number ‘i’, the position representing the blade’s direction ‘j’, the direction flag for blade movement ‘Dr’, the initialized comparison value for vibration electrical signals ‘cij’, and the counting value ‘Tc’.
(2)
The system controls the movement of the selector’s blade, sequentially acquiring the maximum vibration electrical signal values ‘vij’ for both upward and downward movements of the blades, along with the corresponding time required to reach the maximum values ‘tij’.
(3)
After the learning process is complete, store the values of ‘vij’ and ‘tij’ in the ARM processor’s internal memory; this ensures that the data is retained even in the event of a power outage or system restart, allowing the self-learning algorithm to be executed only once before weaving and enabling long-term usage. The entire process is automated and requires no manual intervention.

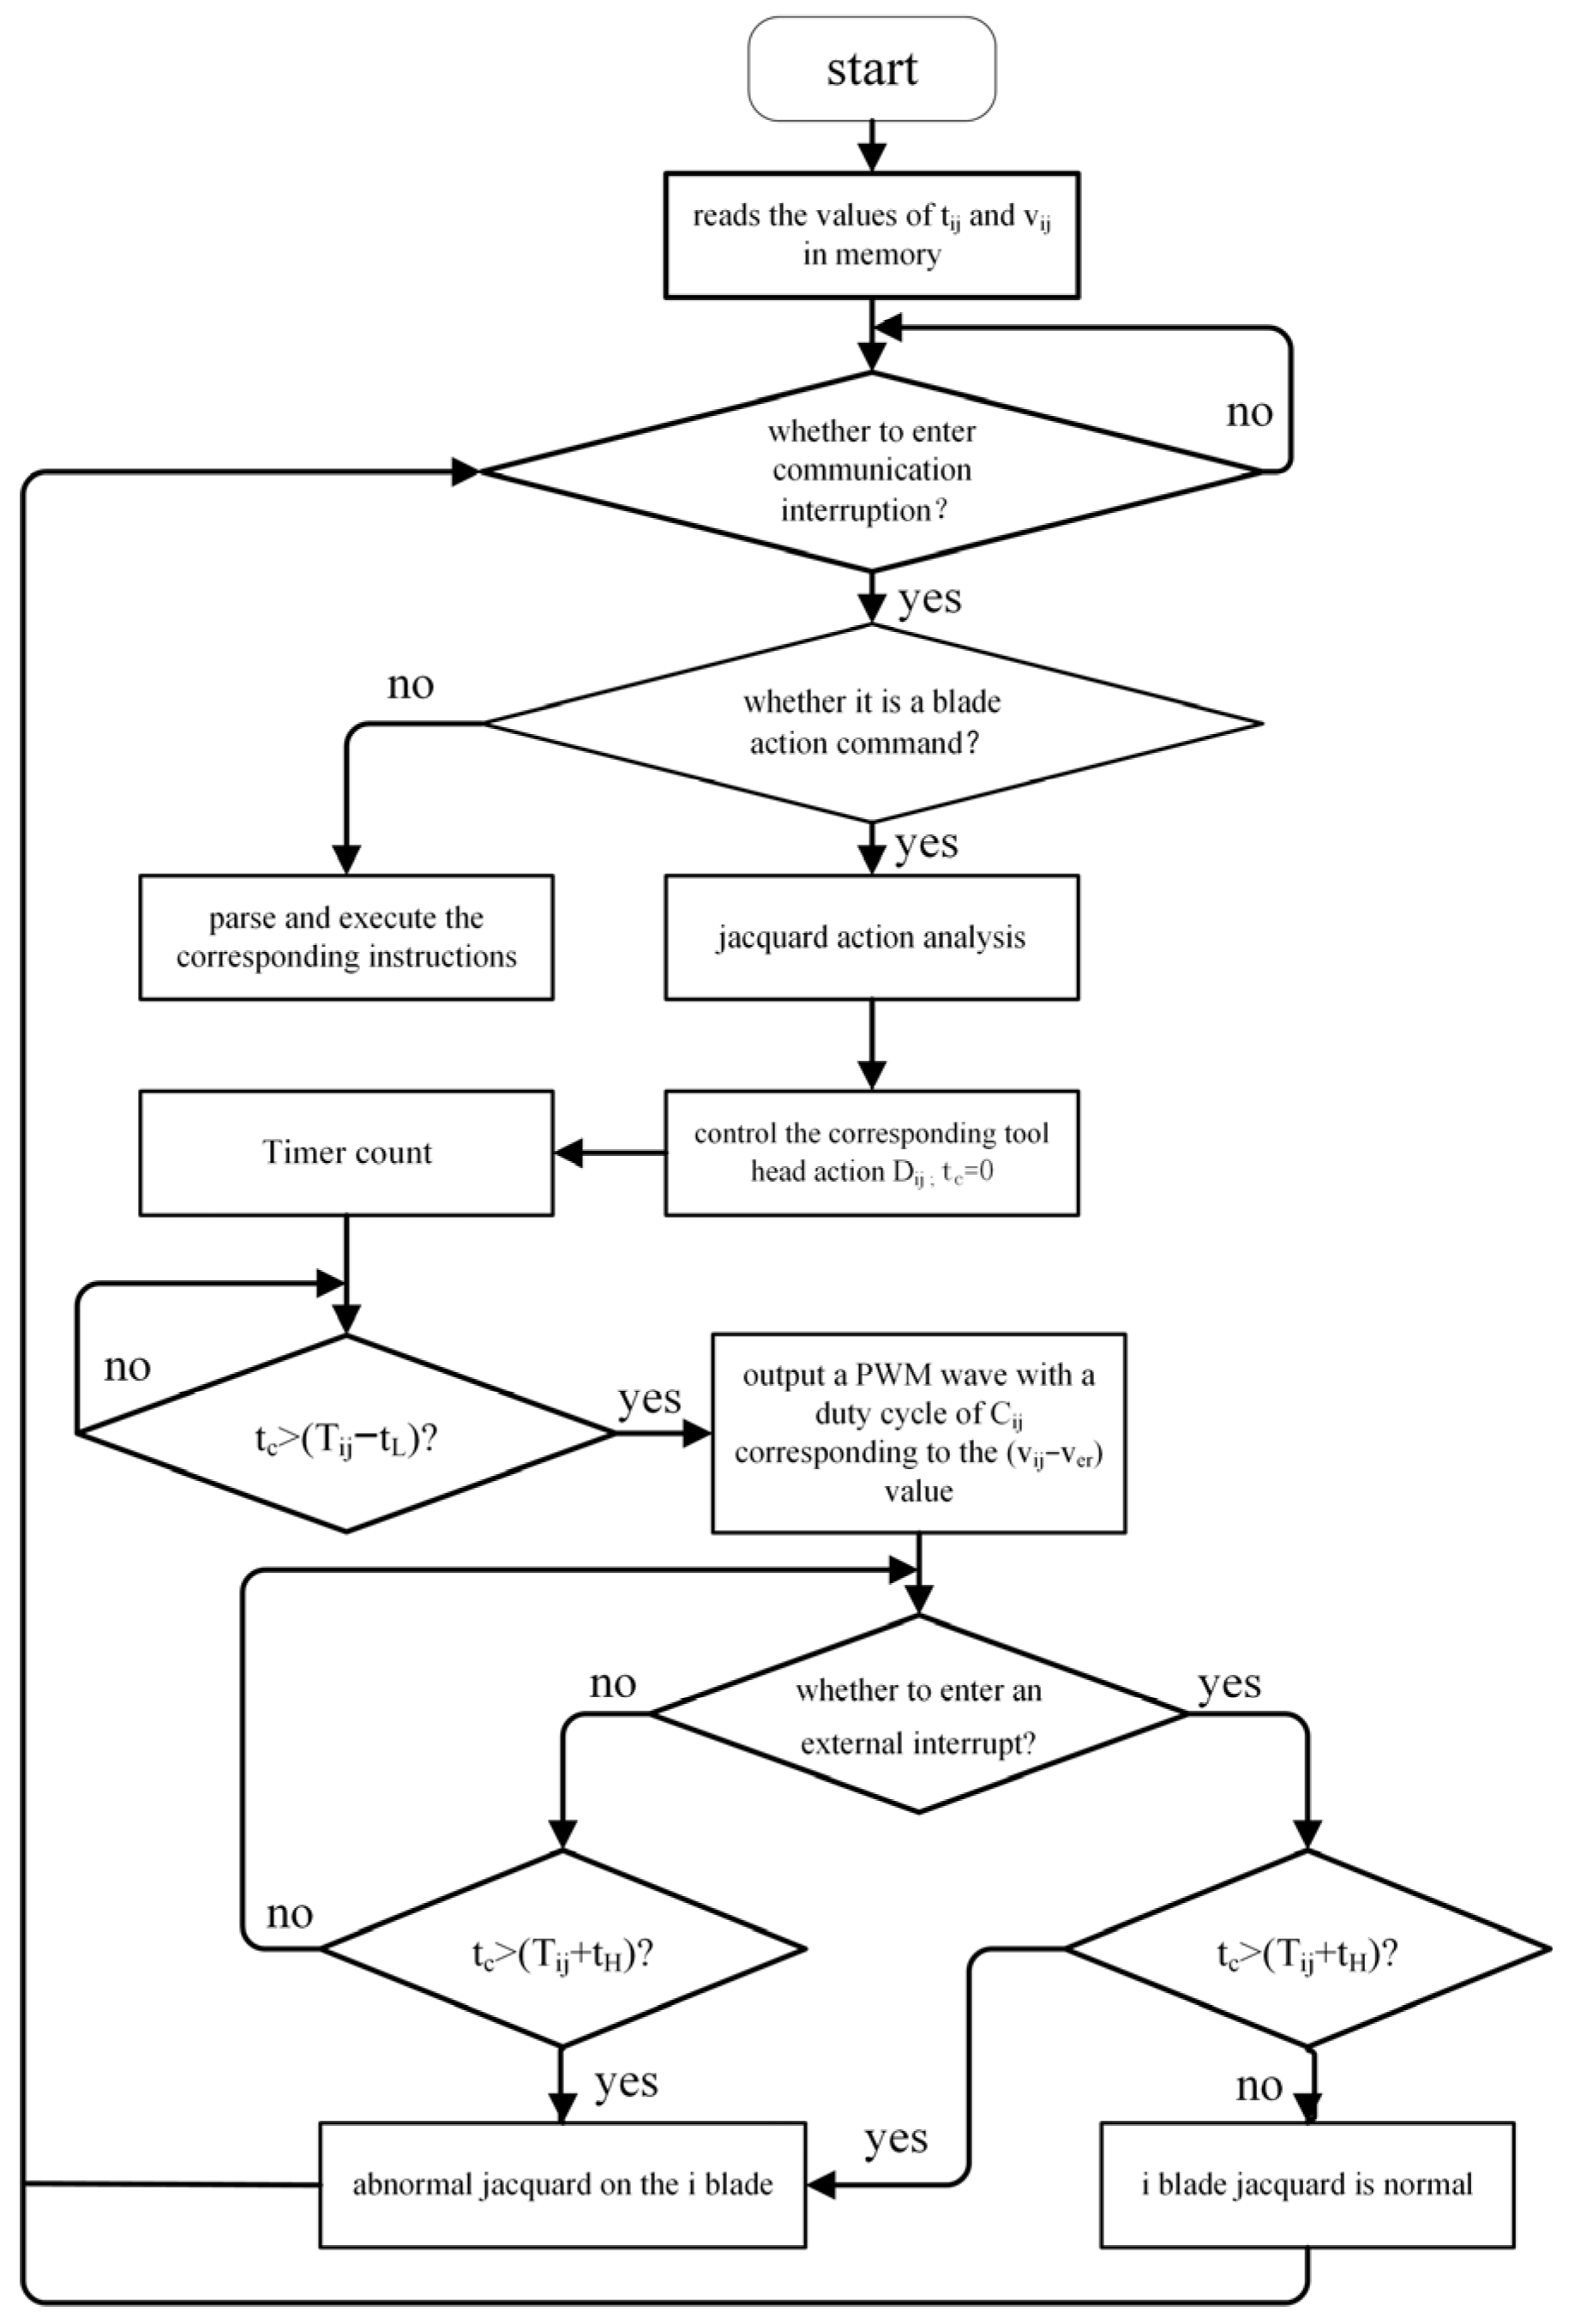
4.4. Fault Detection Program Algorithm

The core of the Fault Detection Needle Selector Program Algorithm lies in adjusting the real-time voltage based on the tij values obtained from self-learning to control the corresponding duty cycle associated with vij values in the blade’s motion direction. When the ARM processor enters an external interrupt within a specified time interval, it indicates that the blade is functioning normally in that direction; otherwise, it signifies a fault in the needle selector. The fault detection program algorithm is depicted in Figure 9.
Figure 9 illustrates the flowchart of the Fault detection program algorithm. In this diagram, ‘Dij’ represents the blade order and action direction of the needle selector, where ‘i’ denotes the blade number, and ‘j’ denotes the action direction, as described in Figure 8. ‘tc’ is the timer count value, with the timer counting every 100 microseconds, incrementing the count value. ‘Tij’ represents the count value corresponding to the ‘tij’ value mentioned in Figure 8. ‘tij’, ‘tL’, ‘tH’, and ‘ver’ are sensitivity adjustment coefficients, all of which have positive values. The conditions (Tij−tL) and (vij−ver) must also be non-zero. After experimentation, it was found that setting ‘tL’, ‘tH’, and ‘ver’ to 4, 11, and 1, respectively, resulted in higher sensitivity and no false alarms. The primary steps of the program algorithm are as follows:
(1)
Read the values of tij and vij for each blade of the selector from the system’s storage and wait for communication commands sent by the needle selection signal generation device;
(2)
Respond to and parse the communication commands, controlling the respective blade’s movement. Start the system timer to count tc and wait for the blade to vibrate to its maximum signal value;
(3)
Determine whether an external interruption has occurred and compare the system timer count value tc for the respective blade with the baseline tij value obtained from self-learning. This step is crucial for assessing the normality of the blade’s movement and preventing fabric wastage due to needle selector head malfunctions.

5. Functional Testing and Result Analysis

5.1. Self-Learning Program Algorithm Testing and Result Analysis

The ARM processor controls the upward and downward motion of the corresponding blade by altering the high and low voltage levels at the ‘S’ terminal in Figure 3b. The piezoelectric ceramic sensor collects the vibration signal when the blade strikes the limiting baffles, and this signal is then amplified and processed by the vibration signal detection circuit. In this experiment, the objective is to measure the time, ‘tij’, it takes for the vibration signal to reach its maximum value from the initiation of the blade’s motion to the limit baffles, as well as the corresponding maximum value, ‘vij’, after amplification by the vibration signal detection circuit. These measured values are then compared with the benchmark values obtained from the self-learning algorithm. The experiment focuses on blade orders 1 and 7 of the Taiwanese Yi-Da needle selector model 49U-416NL-GR. The blade control signal and vibration signal are illustrated in Figure 10.
Figure 10a,b illustrates the control signals and vibration signals when the first and seventh needle selector blades strike the limiting baffles. In this context, ‘vij’ represents the peak voltage of the vibration signal, while ‘tij’ denotes the time interval between the blade’s motion and the vibration signal reaching its peak. An upward transition in the blade control signal indicates an upward swing of the blade, whereas a downward transition signifies a downward swing. Considering the analogous dynamic characteristics of these two motion processes, Figure 10a,b depicts the blade control signal and vibration signal during an upward swing of the blade. A self-learning algorithm was employed to conduct fault detection on the 16-blade needle selector, and the results are presented in Table 2.
Table 2 presents the parameter values obtained from the self-learning algorithm for the Taiwan Yi-Da needle selector. Due to factors such as gravity and material variations in the piezoelectric needle selector, there are differences in ‘vij’ and ‘tij’ values between the downward and upward movements of the same blade. From the data in the table, a general pattern can be observed: the ‘vij’ value for the downward movement of the same blade is larger than the ‘vij’ value for the upward movement, and the ‘vij’ value is larger when the blade’s position is farther from the center of mass of the piezoelectric sensor. However, due to variations in the material and manufacturing process of the piezoelectric ceramics, there may be deviations in ‘vij’ values for specific needle selector blade movements compared to the general pattern.
From the oscilloscope test results shown in Figure 10a,b, it can be observed that the ‘vij’ values for the upward impacts of the first and seventh needle selector blades are 3.03 V and 1.23 V, respectively. Comparing these values with the self-learned parameters in Table 2 and the mapping table in Table 1, it is evident that the ‘vij’ values obtained using the self-learning algorithm are 3.01 V and 1.23 V for the first and seventh needle selector blades, respectively. This result demonstrates that the self-learning algorithm is capable of accurately acquiring the ‘vij’ values when the needle selector blades impact the baffle.
Similarly, from the oscilloscope test results shown in Figure 10a,b, it can be observed that the ‘tij’ values for the upward impacts of the first and seventh needle selector blades are 3.78 ms and 4.85 ms, respectively. Comparing these values with the self-learned parameters in Table 2, it is evident that the ‘tij’ values obtained using the self-learning algorithm are 3.8 ms and 4.9 ms for the first and seventh needle selector blades, respectively. This result demonstrates that the self-learning algorithm is capable of accurately acquiring the ‘tij’ values when the needle selector blades impact the baffle.

5.2. Algorithm Testing and Result Analysis of Fault Detection Algorithm

The fault detection needle selector operates based on needle selection commands transmitted by the needle selection signal generator. Simultaneously, it undergoes diagnostic fault detection for the blades’ motion using the fault detection program algorithm. Vibration signals are collected by the piezoelectric ceramic sensor. Extensive testing revealed that due to the inherent material characteristics of the piezoelectric ceramic sensor, the time interval between blade motions should be no less than 4 ms. The control signals for blade motion and the corresponding vibration waveform are illustrated in Figure 11.
Figure 11, from top to bottom, sequentially displays the control waveforms for the operating blades and their corresponding vibration waveforms. Point ‘a’ represents the moment when the control signal commands the blade to move upward, impacting the blocking baffle. This action generates a vibration signal in the piezoelectric ceramic sensor. Region ‘e’ below control point ‘a’ represents the vibration area. Similarly, point ‘c’ represents the moment when the control signal commands the blade to move downward, and region ‘f’ below control point ‘c’ represents the corresponding vibration area. As the frequency of blade motion increases, vibration regions ‘e’ and ‘f’ may overlap, potentially causing interference with normal fault detection. Therefore, to enhance the accuracy of the fault detection program algorithm, the laboratory adopted a 4 ms time interval between blade motions. The testing procedure is as follows: The needle selection signal generator sends blade motion commands every 4 ms. The fault detection needle selector controls the blade’s motion. When the fault detection program algorithm detects a blade fault, the fault detection needle selector sends an alarm feedback command to the needle selection signal generator, which displays the alarm information. In this experiment, a piece of iron was placed at the position of blade 1 in needle selector 1 to simulate a fault condition. The communication bus signal is depicted in Figure 12.
Figure 12 shows the waveform of the communication bus signal. The test results from the above figures indicate that, with a time interval of 4 ms or more between needle selection actions, this fault detection program algorithm can rapidly detect faulty needles, meeting the control requirements of the fault detection needle selector.

6. Conclusions

The accuracy of the piezoelectric needle selector’s operation is crucial, as it serves as a key actuator in computerized circular weft knitting machines for pattern weaving. Currently, the control of piezoelectric needle selectors in the market primarily relies on open-loop control, which means there is no effective means to determine whether the needle selector’s blades have moved into their correct positions. In recent years, there has been progress in researching closed-loop control techniques for needle selectors, taking into account their operational characteristics. However, much of this research remains in the theoretical and laboratory testing phases. As a result, previous studies have been unable to meet the control requirements of computerized circular weft knitting machines for piezoelectric needle selectors.
In order to overcome the limitations of previous research and apply closed-loop fault detection of piezoelectric needle selectors in practical applications, this study utilized piezoelectric ceramic sensors to collect impact vibration signals when the needle blades hit the blade’s baffle. Key hardware circuits were designed for this purpose. During the research, it was discovered that by utilizing the peak voltage and the time to reach this peak in the impact vibration signal, closed-loop fault detection for piezoelectric needle selectors could be implemented. This research also developed a self-learning program algorithm and fault detection program algorithm. Experiments and practical use have shown that the piezoelectric needle selector system designed in this study, based on PZT sensors for closed-loop fault detection, is applicable in real-world scenarios. Therefore, the use of this system can enhance the accuracy of piezoelectric needle selector movements, reduce fabric defects, and improve overall business performance.
In practical applications, there are various types of needle selectors based on their driving principles, and they are not limited to just piezoelectric needle selectors. The scope of applicability of this research extends beyond piezoelectric needle selectors. It provides valuable insights for needle selector devices with a structure consisting of needle blades and a limit baffle.

Author Contributions

Conceptualization, N.D. and X.H.; methodology, N.D. and K.X.; software, K.X.; validation, N.D. and K.X.; formal analysis, N.D. and K.X.; investigation, K.X.; resources, X.H. and Y.Y.; data curation, N.D. and K.X.; writing—original draft preparation, N.D. and K.X.; writing—review and editing, N.D., X.H. and J.T.; visualization, N.D. and K.X.; supervision, N.D. and K.X.; project administration, N.D. and K.X.; funding acquisition, N.D. and X.H. All authors have read and agreed to the published version of the manuscript.

Funding

This research was funded by The Science and Technology Program of Zhejiang Province, China (No. 2022C01202, No.2022C01065), and the Zhejiang Sci-Tech University Research Start-up Fund, China (No. 23242083-Y).

Data Availability Statement

Data will be made available on request.

Conflicts of Interest

The authors declare no conflict of interest.

References

  1. Zheng, P.; Jiang, G.; Cong, H. Design method of circular weft-knitted jacquard fabric based on jacquard module. Autex Res. J. 2022, 22, 217–224. [Google Scholar] [CrossRef]
  2. Cong, H.L.; Lei, H.; Zhang, Y.C.; Zhang, A.J.; Ma, P.B. Weft-knitted lace fabric simulation based on the spring-mass model. Int. J. Cloth. Sci. Technol. 2017, 29, 60–68. [Google Scholar] [CrossRef]
  3. Zheng, P.X.; Jiang, G.M. Modeling and realization for visual simulation of circular knitting transfer-jacquard fabric. Text. Res. J. 2021, 91, 2225–2239. [Google Scholar] [CrossRef]
  4. Peiner, C.; Locken, H.; Reinsch, L.; Reinsch, L.; Gries, T. 3D Knitted Preforms Using Large Circular Weft Knitting Machines. Appl. Compos. Mater. 2021, 29, 273–288. [Google Scholar] [CrossRef]
  5. Krauledaite, J.; Ancutiene, K.; Krauledas, S.; Urbelis, V.; Saceviciene, V. Research of 3D weft-knitted fabrics designed to protect against mechanical risks and suitable for contact with skin. J. Ind. Text. 2022, 51, 7674S–7693S. [Google Scholar] [CrossRef]
  6. Jie, X.; Zhi, T.; Ting, Z.; Zheng, T.; Wu, J.G.; Xiao, D.Q.; Zhu, J.G. Research progress of high piezoelectric activity of potassium sodium niobate based lead-free ceramics. Acta Phys. Sin. 2020, 69, 127707-1. [Google Scholar]
  7. Liu, F.J.; Yuan, Y.H. Design of an innovative piezoelectric jacquard selection mechanism. Appl. Mech. Mater. 2014, 459, 402–406. [Google Scholar] [CrossRef]
  8. Guan, S. Fabric defect delaminating detection based on visual saliency in HSV color space. J. Text. Inst. 2018, 109, 1560–1573. [Google Scholar] [CrossRef]
  9. Zhang, Z.; Bai, S.; Xu, G. Research on the knitting needle detection system of a hosiery machine based on machine vision. Text. Res. J. 2020, 90, 1730–1740. [Google Scholar] [CrossRef]
  10. Zhang, Z.Q.; Bai, S.H.; Xu, G.S.; Liu, X.J.; Jia, J.T.; Feng, Z.; Wang, F.L. Knitting needle fault detection system for hosiery machine based on laser detection and machine vision. Text. Res. J. 2021, 91, 143–151. [Google Scholar] [CrossRef]
  11. Peng, L.H.; Qi, Y.B.; Zhong, Y.S.; Sun, Y.; Ru, X. Needle selector failure detection based on piezoelectric sensor and driver co-location characteristics. Text. Res. J. 2023, 93, 1371–1388. [Google Scholar] [CrossRef]
  12. Li, J.; Zhu, F.M.; Zhou, J.; Yu, Q.F. Design of needle selector frequency detection system based on stroboscopic principle. J. Text. Res. 2017, 38, 138–142. [Google Scholar]
  13. Xiang, H.N.; Yuan, Y.H.; Xiang, Z. Measurement of the swing driving torque of the electro-magnetic selector. J. Text. Res. 2018, 39, 189–194. [Google Scholar]
  14. Yuan, Y.H.; Zeng, H.M.; Mao, M.Q. Needle selector detection system based on image processing. J. Text. Res. 2022, 43, 176–182. [Google Scholar]
  15. Wang, L.J.; Peng, L.H.; Shi, W.M. Research on Dynamic Characteristics of Reciprocating Pendulum Stroke of Knitting Needle Selector. Light Ind. Mach. 2019, 37, 16–22+27. [Google Scholar]
  16. Zuo, X.Y.; Zhang, C.J.; Xiong, T.; Yin, W.S.; Li, M.; Zhang, C.; Wu, X.G.; Zhu, L. Maglev weft knitting needle driving modeling and PID controller design. J. Text. Inst. 2022, 113, 1715–1722. [Google Scholar] [CrossRef]
  17. Jonathan, C.O.; Israel, Z.R.; Luis, M.V.; Arturo, Y.J.C.; Roque, A.O.R. FPGA-Flux Proprietary System for Online Detection of Outer Race Faults in Bearings. Electronics 2023, 12, 1924. [Google Scholar]
  18. Ma, J.; Zha, X.F.; Tao, H.B.; Ni, J.F. Testing system of needle selectors for jacquard knitting machines. Appl. Mech. Mater. 2013, 397, 1174–1177. [Google Scholar] [CrossRef]
  19. Gu, H.; Pan, Q.Y.; Hua, Q.; Lu, Y. Design of Needle Selector Control System for Computerized Flat Knitting Machine Based on ARM and FPGA. Knitt. Ind. 2021, 2, 8–12. [Google Scholar]
  20. He, Y.X.; Yang, Q.; Luo, M.D.; Liu, R.Y. Effect of the physical parameters of longitudinally polarized PZT tubes on PZT sensors. J. Phys. D-Appl. Phys. 2020, 53, 275501. [Google Scholar] [CrossRef]
  21. Chen, W.; Qin, H.C.; Yin, Z.P. A Survey on Experimental Characterization of Hysteresis in Piezoceramic Actuators. Adv. Mater. Res. 2013, 694, 1558–1564. [Google Scholar] [CrossRef]
  22. Zhang, Z.M.; Xu, Q.; Mei, S.Q.; Yu, L.Q. Research on the Needle Selecting Machine of Computerized Jacquard Circle Knitting Machine Based on Piezoelectric Ceramics. In Proceedings of the 2009 IITA International Conference on Services Science, Management and Engineering, Zhangjiajie, China, 11–12 July 2009; pp. 104–106. [Google Scholar]
  23. Wu, Z.H.; Peng, L.H.; Hu, X.D. Drive Control Mode Based on Magnetic Holding Needle Selector. Group Technol. Prod. Mod. 2018, 35, 27–32. [Google Scholar]
  24. Cheng, Y.H. Research and Design of Embedded CNC System Based on CAN Bus Technology. Appl. Mech. Mater. 2014, 494, 1373–1376. [Google Scholar] [CrossRef]
  25. Smit, W.A.; Preez, J.A.; Vandenbosch, G.A.E. Mobile processor energy usage in the scientific environment. Comput. Sci. Eng. 2021, 23, 65–72. [Google Scholar] [CrossRef]
  26. Levine, S.N. Inverse piezoelectric effect in polymers. J. Appl. Polym. Sci. 2010, 9, 3351–3357. [Google Scholar] [CrossRef]
  27. Liu, Y.; Chen, W.; Feng, P.; Liu, J. A linear piezoelectric actuator using the first-order bending modes. Ceram. Int. 2013, 39, S681–S684. [Google Scholar] [CrossRef]
  28. Sun, Y.; Shi, J.; Wang, Z.; Wang, H.; Zhang, S. Thylakoid membrane-inspired capsules with fortified cofactor shuttling for enzyme-photocoupled catalysis. J. Am. Chem. Soc. 2022, 144, 4168–4177. [Google Scholar] [CrossRef]
  29. Yang, S.P.; Lin, J.L.; Tang, S.F. Dynamical analysis of a novel zero-voltage-switching-PWM DC-DC half-bridge converter. J. Chin. Inst. Eng. 2009, 32, 543–554. [Google Scholar] [CrossRef]
  30. Bo, L.; Bo, W.Y.; Fan, J.Y. Weak signal acquisition and processing system for piezoelectric ceramic transducer actuator. In Proceedings of the 2014 9th International Forum on Strategic Technology (IFOST), Cox’s Bazar, Bangladesh, 21–23 October 2014; pp. 209–215. [Google Scholar]
  31. Huang, G.; Fan, Y. Design and realization of vibration signal acquisition & analysis system based on STM32. In Proceedings of the 2016 Chinese Control and Decision Conference (CCDC), Yinchuan, China, 28–30 May 2016; pp. 2924–2928. [Google Scholar]
  32. Chen, B.; Zeng, Y.; Gao, M.Y. Design of the Needle selection system for the computerized flat knitting machines. Int. Conf. Syst. Sci. 2011, 2, 237–240. [Google Scholar]
Figure 1. Schematic diagram of piezoelectric needle selector structure: (a) overall structure diagram of piezoelectric needle selector; (b) piezoelectric ceramic drive diagram; and (c) upper and lower limit baffle diagram.
Electronics 12 04331 g001
Figure 2. Schematic diagram of the overall control system.
Electronics 12 04331 g002
Figure 3. Schematic diagram of the piezoelectric ceramic sheet drive circuit design: (a) simplified diagram of the piezoelectric ceramic sheet structure; (b) drive circuit design diagram.
Electronics 12 04331 g003
Figure 4. The fault detection module circuit: (a) the PWM voltage regulation circuit, (b) the vibration signal detection circuit, and (c) the comparator circuit.
Electronics 12 04331 g004
Figure 5. Waveforms before and after RC filtering: (a) waveform with 60% duty cycle; (b) waveform with 15% duty cycle.
Electronics 12 04331 g005
Figure 6. Waveform diagram of vibration signal before and after processing: (a) vibration signal waveform of the 1st blade; (b) vibration signal waveform of the 7th blade; (c) vibration signal waveform of the 8th blade; (d) vibration signal waveform of the 16th blade.
Electronics 12 04331 g006
Figure 7. Needle selector test platform: (a) test platform structure diagram, (b) test platform real drawing, and (c) 16-blade needle selector.
Electronics 12 04331 g007
Figure 8. Flow chart of the self-learning program algorithm.
Electronics 12 04331 g008
Figure 9. Flowchart of the fault detection algorithm.
Electronics 12 04331 g009
Figure 10. Blade control signal and vibration signal diagram: (a) control signal and vibration signal waveform of the 1st blade; (b) control signal and vibration signal waveform of the 7th blade.
Electronics 12 04331 g010
Figure 11. Blade control and vibration waveform diagram.
Electronics 12 04331 g011
Figure 12. Communication bus signal.
Electronics 12 04331 g012
Table 1. Comparison value c and analog voltage value FP mapping table.
cFPcFPcFPcFPcFP
160.11330.28500.57671.09841.89
170.12340.30510.59681.12851.93
180.13350.31520.61691.17861.99
190.14360.32530.64701.19872.12
200.15370.34540.66711.23882.19
210.16380.36550.68721.27892.31
220.17390.37560.70731.31902.41
230.18400.39570.73741.36912.47
240.19410.40580.76751.38922.56
250.20420.42590.78761.49932.71
260.21430.44600.80771.51942.82
270.22440.46610.82781.54953.01
280.23450.48620.87791.61963.13
290.24460.50630.88801.63973.33
300.25470.51640.91811.69983.61
310.26480.53650.94821.78993.86
320.27490.55660.96831.831003.87
Table 2. Self-learning parameter result table.
Blade Number123456789101112141516
Blade upward motionvij959191938580718079838390909496
tij3.83.43.53.44.94.24.93.74.53.93.23.83.93.84.2
Blade downward motionvij978994948886828686868788929097
tij4.35.14.74.74.14.74.25.15.14.84.94.84.53.94.8
Disclaimer/Publisher’s Note: The statements, opinions and data contained in all publications are solely those of the individual author(s) and contributor(s) and not of MDPI and/or the editor(s). MDPI and/or the editor(s) disclaim responsibility for any injury to people or property resulting from any ideas, methods, instructions or products referred to in the content.

