
Substation Personnel Fall Detection Based on Improved YOLOX

Abstract
:1. Introduction
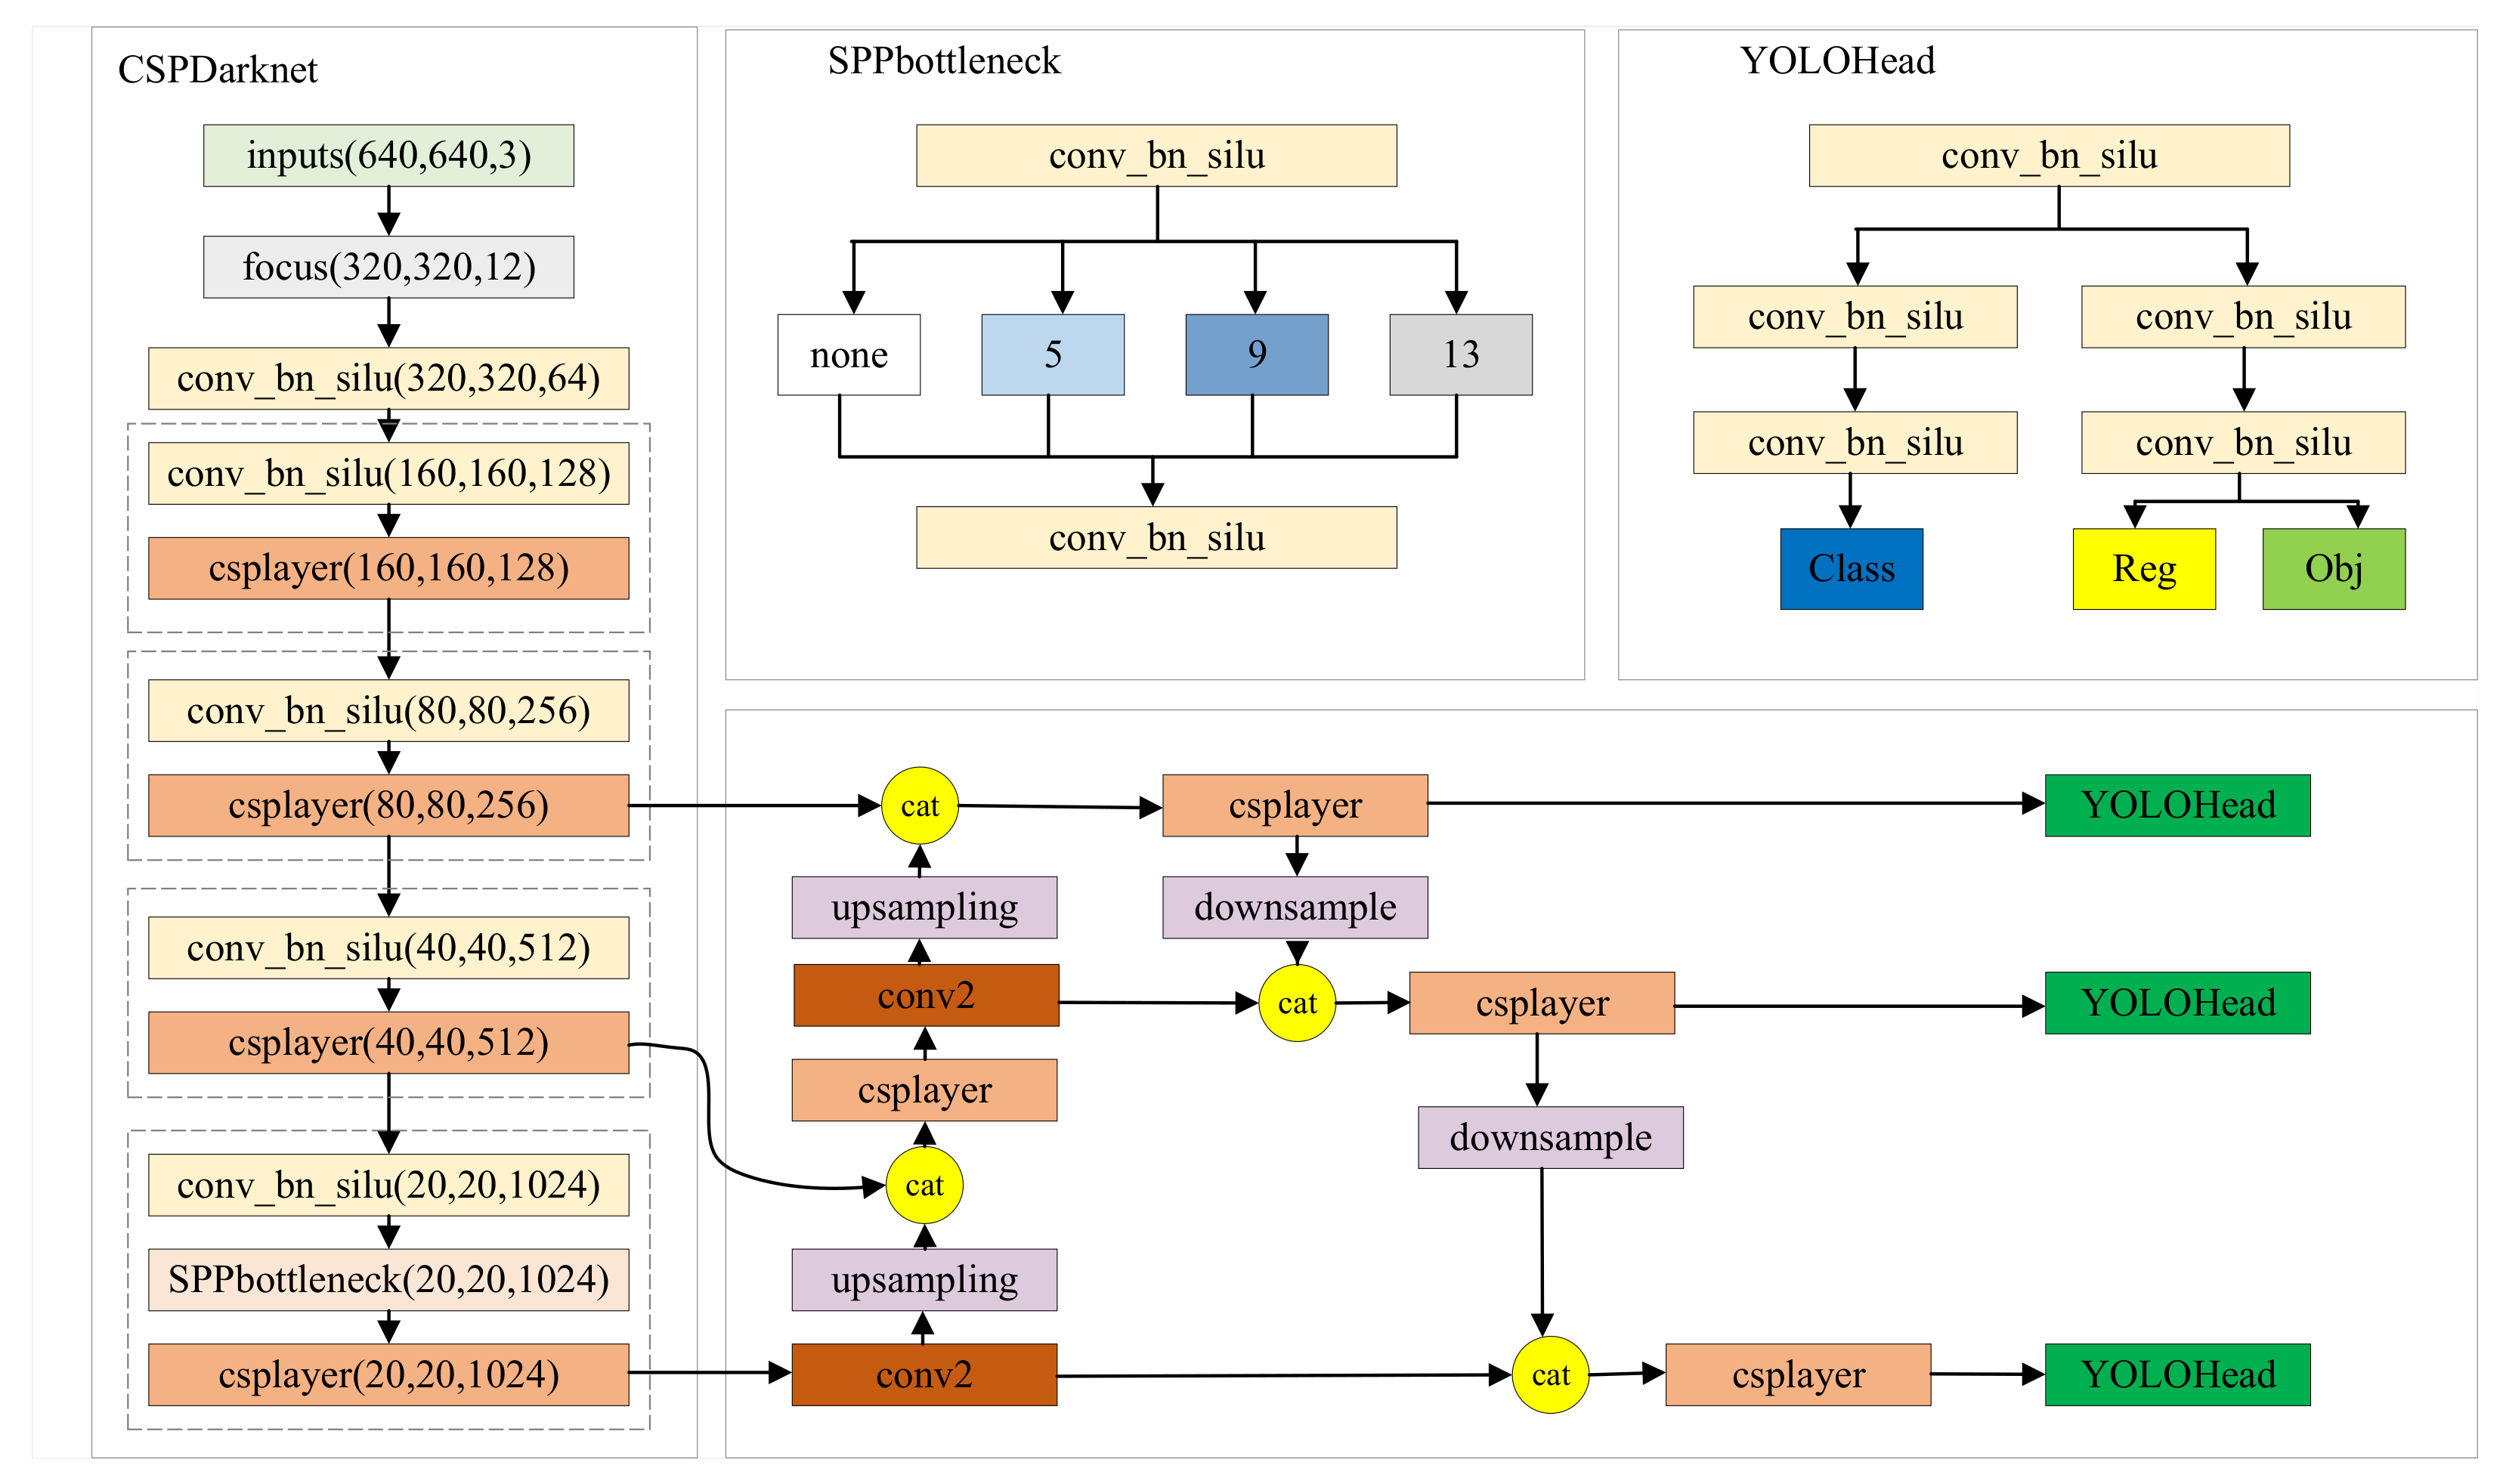
2. YOLOX
2.1. The Backbone Network
2.2. The Feature Fusion Network
2.3. The Prediction Head
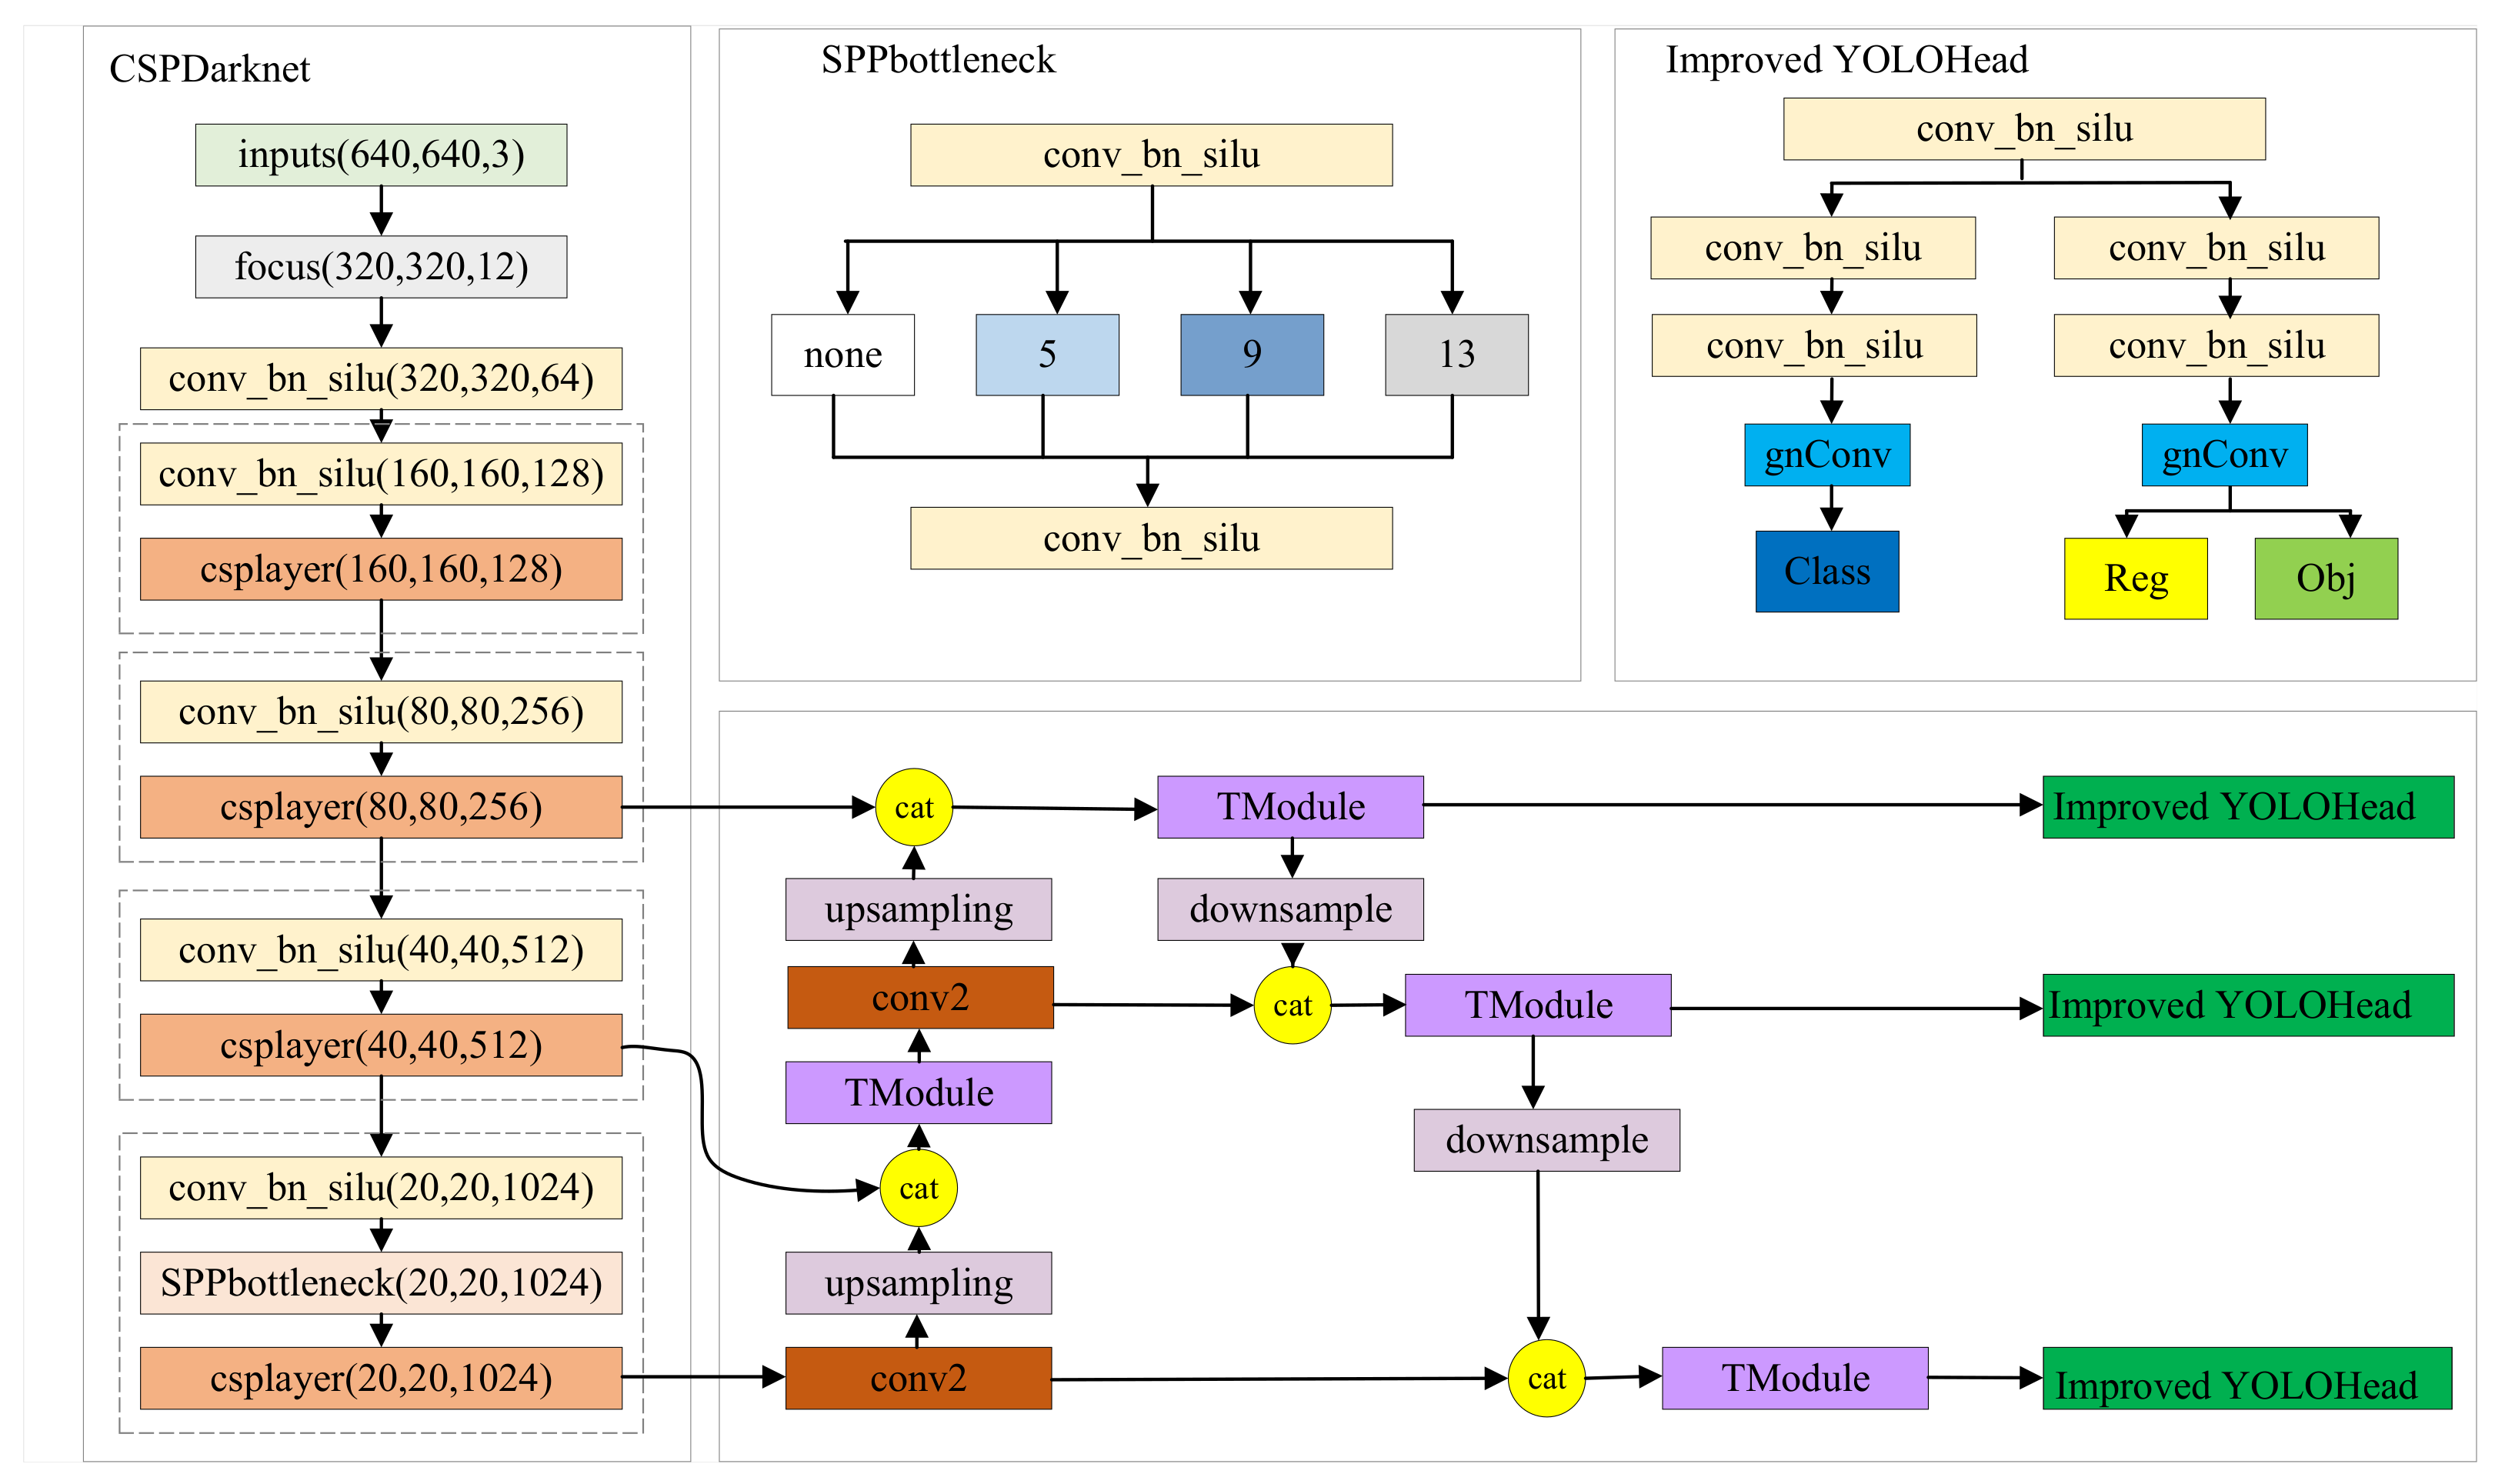
3. Improved YOLOX
- 1.
- In order to extract rich multiscale features, a feature extraction module is designed in the feature fusion part of YOLOX. This module enhances the neck’s feature extraction capability while reducing computational complexity and parameter count. It extracts semantic information that includes diverse characteristics of substation personnel.
- 2.
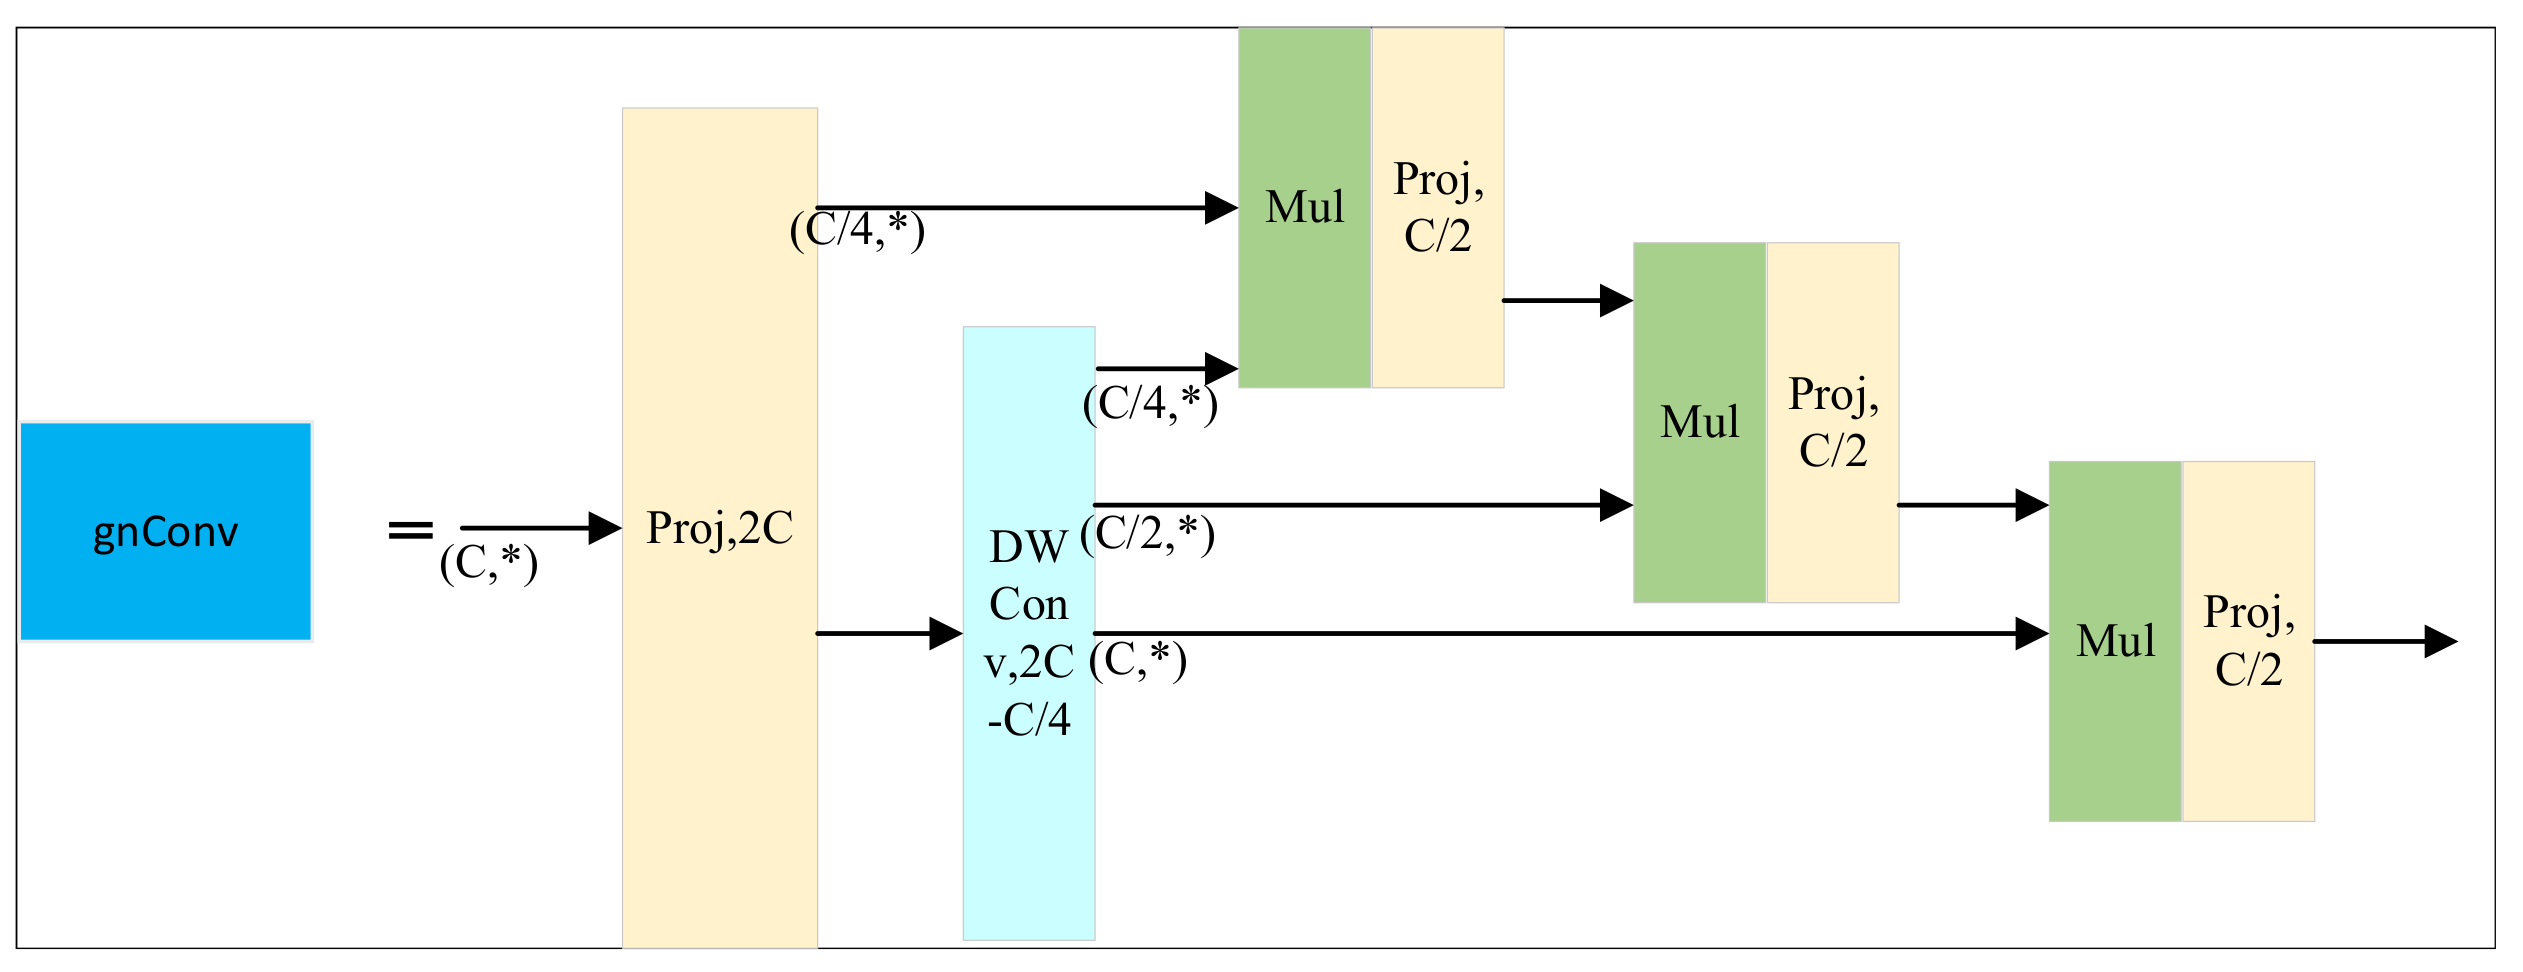
- In the YOLOX head, after the feature map undergoes convolutional normalization and activation functions, gnConv (gated non-local convolution) is introduced. This recursive convolution captures key information from the feature layers, improving the accuracy and speed of the model detection without introducing additional parameters.
- 3.
- The smoothed IoU (SIoU) loss function is used to address the problem of the IoU (intersection over union) loss function not considering the angle information of the bounding boxes. By fully considering the influence of angle on model training, the SIoU loss function allows the model to adapt better to targets with different angles and shapes. It provides more accurate position information for bounding boxes and improves the model’s regression capability.
3.1. Tmodule
3.2. Gated Non-Local Convolution
3.3. Improvement of Loss Function
- 1.
- IoU Loss: This component is used to measure the overlap between the predicted box and the ground truth box. It uses the standard IoU (intersection over union) calculation formula to compute the intersection-over-union ratio of the predicted box and the ground truth box and combines it with the target classification loss required in the object detection task.
- 2.
- Smooth L1 Loss: This component is used to smooth the process of bounding box regression. It applies the smooth L1 loss function to the difference between the coordinates of the predicted box’s bounding box and the ground truth box to mitigate noise and instability during the regression process.
4. Dataset and Experimental Platform
5. Experimental Results and Analysis
5.1. Evaluation Metrics
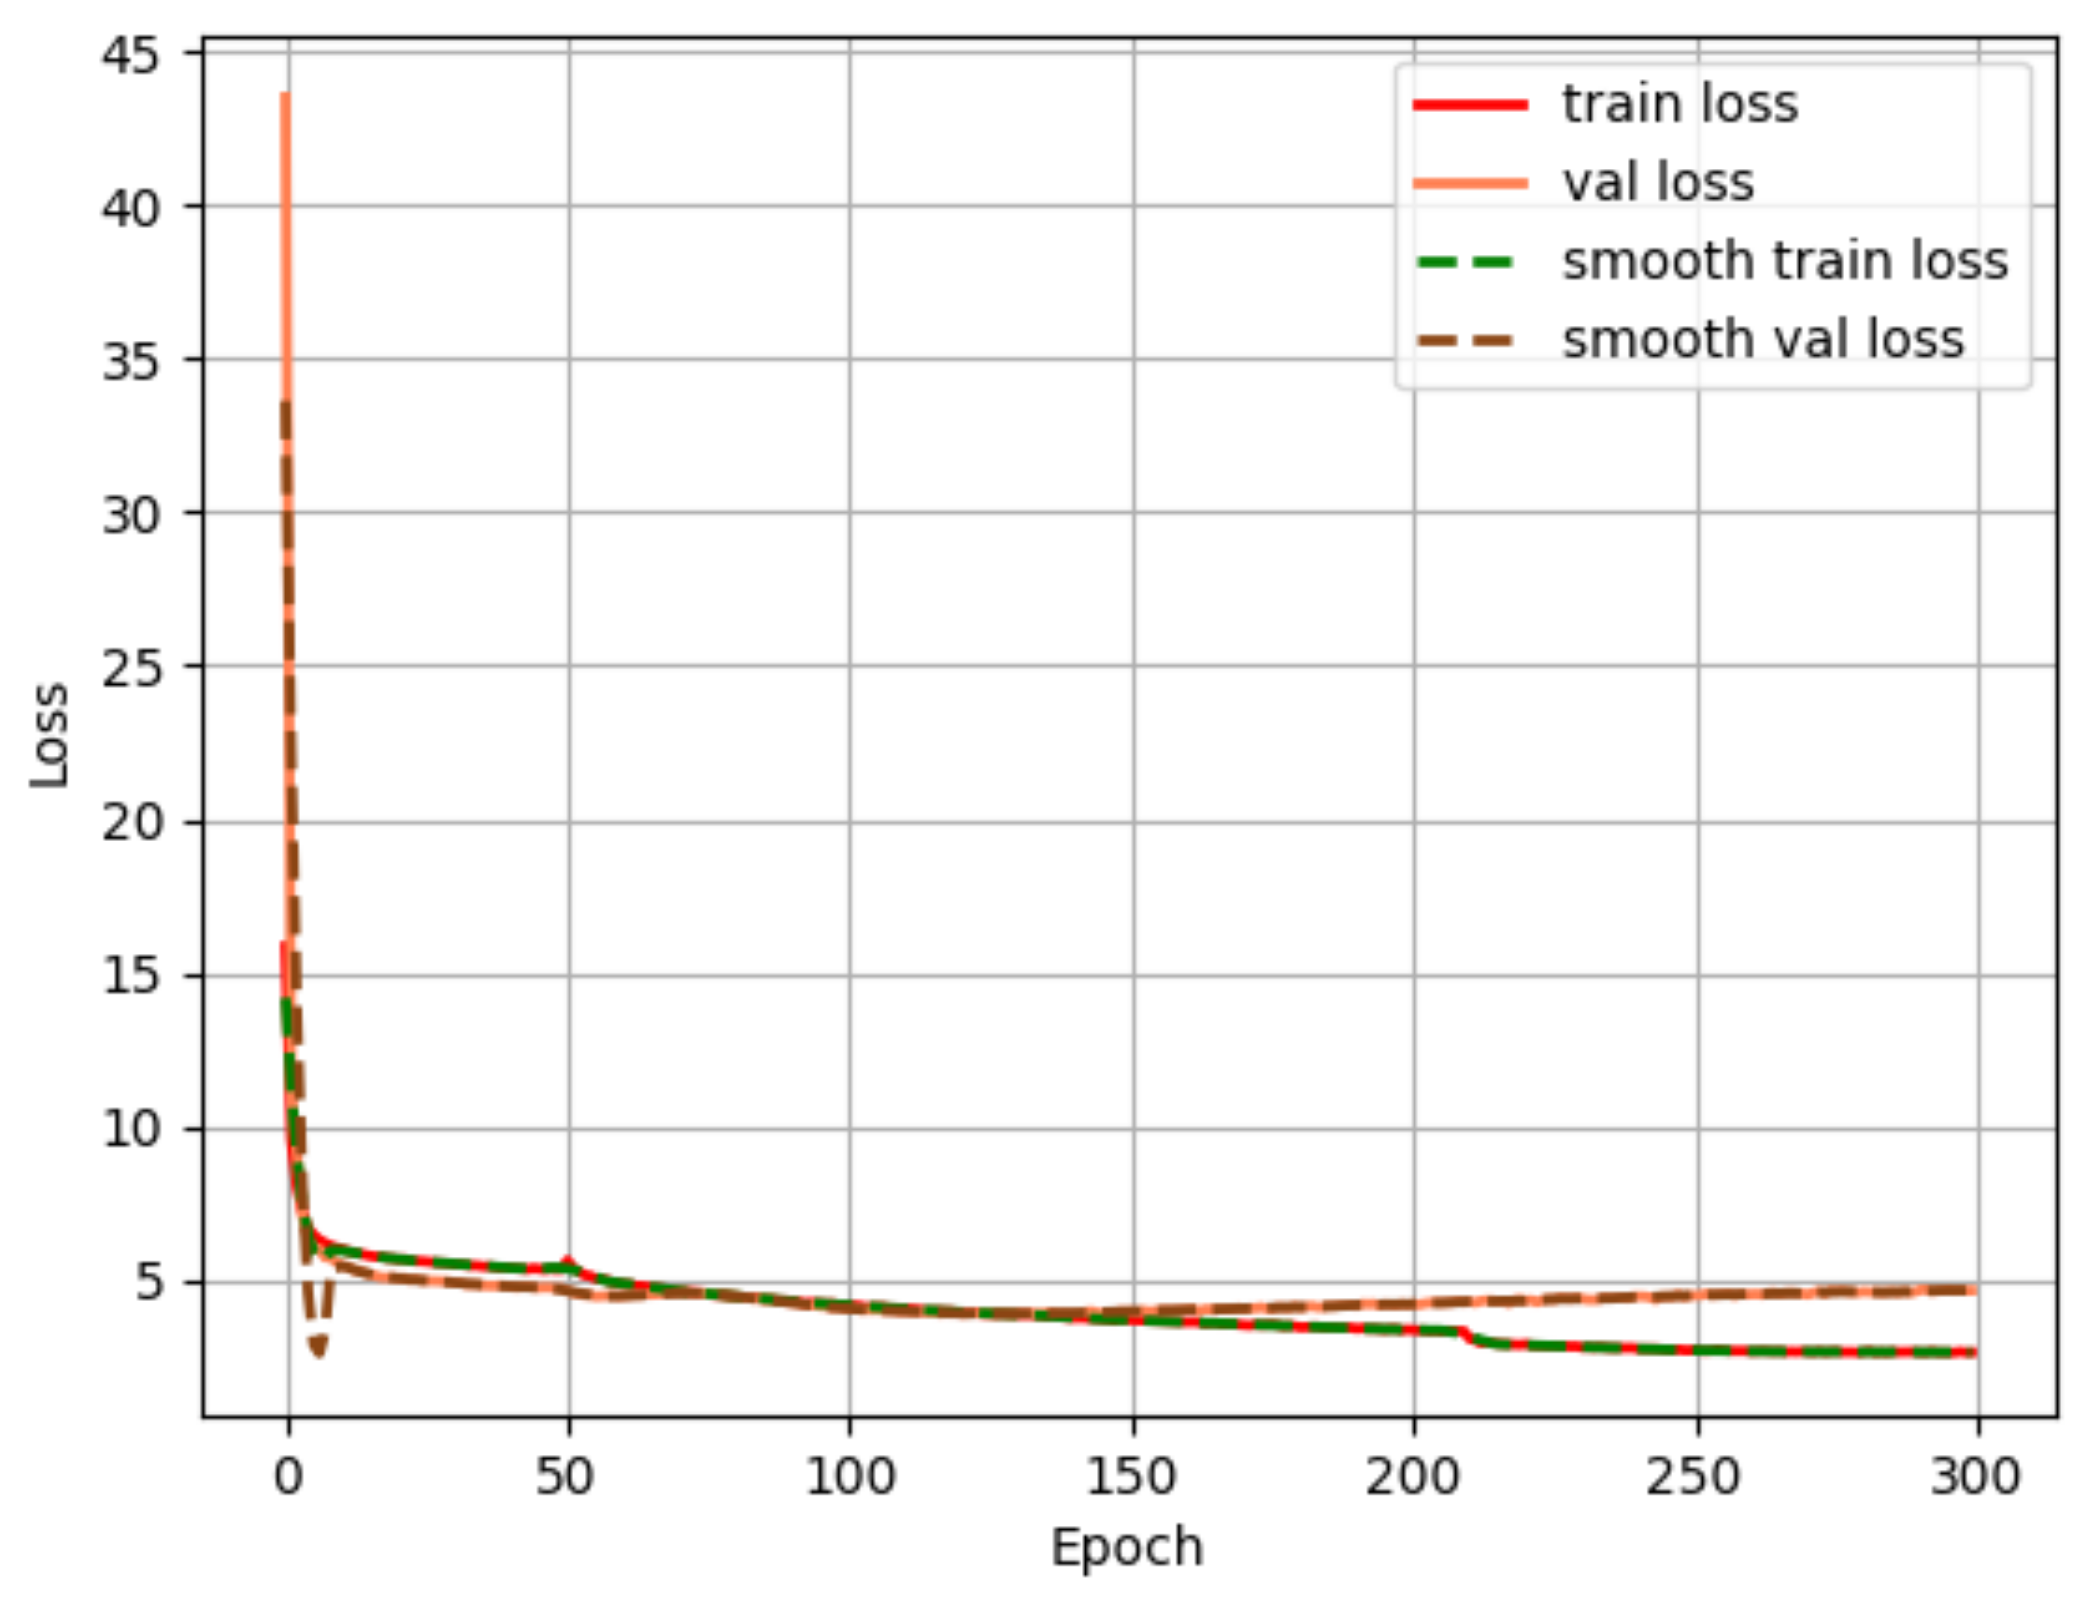
5.2. Model Training
5.3. Test Results
5.4. Ablation Experiments
5.5. Visualization of Detection Results
6. Conclusions
Author Contributions
Funding
Institutional Review Board Statement
Informed Consent Statement
Data Availability Statement
Conflicts of Interest
References
- Chang, Y.C.; Tsai, H.W.; Huang, C.Y.; Wu, Z.R. Based-on Computer Vision Applications for Bus Stop Passenger Detection System. In Proceedings of the 2023 IEEE 3rd International Conference on Electronic Communications, Internet of Things and Big Data (ICEIB), Taichung, Taiwan, 15–17 April 2023; pp. 152–154. [Google Scholar]
- Wang, X.; Wu, J.; Zhao, J.; Niu, Q. Express Carton Detection Based On Improved YOLOX. In Proceedings of the 2022 IEEE 5th Advanced Information Management, Communicates, Electronic and Automation Control Conference (IMCEC), Chongqing, China, 16–18 December 2022; Volume 5, pp. 1267–1272. [Google Scholar]
- Cai, X.; Ding, X. A comparative study of machine vision-based rail foreign object intrusion detection models. In Proceedings of the 2023 IEEE 3rd International Conference on Power, Electronics and Computer Applications (ICPECA), Shenyang, China, 29–31 January 2023; pp. 1304–1308. [Google Scholar]
- Tang, W.; Chen, H. Research on intelligent substation monitoring by image recognition method. Int. J. Emerg. Electr. Power Syst. 2020, 22, 1–7. [Google Scholar] [CrossRef]
- Wang, S. Substation Personnel Safety Detection Network Based on YOLOv4. In Proceedings of the 2021 IEEE 2nd International Conference on Big Data, Artificial Intelligence and Internet of Things Engineering (ICBAIE), Nanchang, China, 26–28 May 2021; pp. 877–881. [Google Scholar]
- Chen, H. Design of Intelligent Positioning Shoes for Elderly Fall Monitoring Based on GPS and MPU-6000 Acceleration Sensor. In Proceedings of the 2022 International Conference on Wearables, Sports and Lifestyle Management (WSLM), Kunming, China, 17–19 January 2022; pp. 43–46. [Google Scholar]
- De Quadros, T.; Lazzaretti, A.E.; Schneider, F.K. A movement decomposition and machine learning-based fall detection system using wrist wearable device. IEEE Sensors J. 2018, 18, 5082–5089. [Google Scholar] [CrossRef]
- Rachakonda, L.; Marchand, D.T. Fall-Sense: An Enhanced Sensor System to Predict and Detect Elderly Falls using IoMT. In Proceedings of the 2022 IEEE Computer Society Annual Symposium on VLSI (ISVLSI), Nicosia, Cyprus, 4–6 July 2022; pp. 448–449. [Google Scholar]
- Feng, Y.; Wei, Y.; Li, K.; Feng, Y.; Gan, Z. Improved Pedestrian Fall Detection Model Based on YOLOv5. In Proceedings of the 2022 IEEE 6th Advanced Information Technology, Electronic and Automation Control Conference (IAEAC), Beijing China, 3–5 October 2022; pp. 410–413. [Google Scholar]
- Chutimawattanakul, P.; Samanpiboon, P. Fall detection for the elderly using yolov4 and lstm. In Proceedings of the 2022 19th International Conference on Electrical Engineering/Electronics, Computer, Telecommunications and Information Technology (ECTI-CON), Huahin, Thailand, 22–27 May 2022; pp. 1–5. [Google Scholar]
- Dey, A.; Rajan, S.; Xiao, G.; Lu, J. Fall event detection using vision transformer. In Proceedings of the 2022 IEEE Sensors, Dallas, TX, USA, 30 October–2 November 2022; pp. 1–4. [Google Scholar]
- Zhou, L.; Li, W.; Ogunbona, P.; Zhang, Z. Jointly learning visual poses and pose lexicon for semantic action recognition. IEEE Trans. Circuits Syst. Video Technol. 2019, 30, 457–467. [Google Scholar] [CrossRef]
- Chen, Y.; Li, W.; Wang, L.; Hu, J.; Ye, M. Vision-based fall event detection in complex background using attention guided bi-directional LSTM. IEEE Access 2020, 8, 161337–161348. [Google Scholar] [CrossRef]
- Cai, X.; Li, S.; Liu, X.; Han, G. Vision-based fall detection with multi-task hourglass convolutional auto-encoder. IEEE Access 2020, 8, 44493–44502. [Google Scholar] [CrossRef]
- García, E.; Villar, M.; Fáñez, M.; Villar, J.R.; de la Cal, E.; Cho, S.B. Towards effective detection of elderly falls with CNN-LSTM neural networks. Neurocomputing 2022, 500, 231–240. [Google Scholar] [CrossRef]
- Ge, Z.; Liu, S.; Wang, F.; Li, Z.; Sun, J. Yolox: Exceeding yolo series in 2021. arXiv 2021, arXiv:2107.08430. [Google Scholar]
- Redmon, J.; Farhadi, A. Yolov3: An incremental improvement. arXiv 2018, arXiv:1804.02767. [Google Scholar]
- Bochkovskiy, A.; Wang, C.Y.; Liao, H.Y.M. Yolov4: Optimal speed and accuracy of object detection. arXiv 2020, arXiv:2004.10934. [Google Scholar]
- Wang, C.Y.; Bochkovskiy, A.; Liao, H.Y.M. YOLOv7: Trainable Bag-of-Freebies Sets New State-of-the-Art for Real-Time Object Detectors. In Proceedings of the IEEE/CVF Conference on Computer Vision and Pattern Recognition (CVPR), Vancouver, BC, Canada, 18–22 June 2023; pp. 7464–7475. [Google Scholar]
- Zhou, L.; Zhong, H.; Chen, G. Improved YOLOX Pedestrian Fall Detection Method Based on Attention Mechanism. Chin. J. Electron Devices 2023, 46, 404–413. [Google Scholar]
- Lin, T.Y.; Dollár, P.; Girshick, R.; He, K.; Hariharan, B.; Belongie, S. Feature pyramid networks for object detection. In Proceedings of the IEEE Conference on Computer Vision and Pattern Recognition, Honolulu, HI, USA, 21–26 July 2017; pp. 2117–2125. [Google Scholar]
- Liu, S.; Qi, L.; Qin, H.; Shi, J.; Jia, J. Path aggregation network for instance segmentation. In Proceedings of the IEEE Conference on Computer Vision and Pattern Recognition, Salt Lake City, UT, USA, 18–23 June 2018; pp. 8759–8768. [Google Scholar]
- Lu, S.; Zhang, Y.; Su, J. Mobile robot for power substation inspection: A survey. IEEE/CAA J. Autom. Sin. 2017, 4, 830–847. [Google Scholar] [CrossRef]
- Rao, Y.; Zhao, W.; Tang, Y.; Zhou, J.; Lim, S.; Lu, J. Hornet: Efficient high-order spatial interactions with recursive gated convolutions. arXiv 2022, arXiv:2207.14284. [Google Scholar]
- Chen, Y.; Zhang, B.; Li, Z.; Qiao, Y. Ship Detection with Optical Image Based on Attention and Loss Improved YOLO. In Proceedings of the 2022 3rd International Conference on Pattern Recognition and Machine Learning (PRML), Chengdu, China, 22–24 July 2022; pp. 1–5. [Google Scholar]
- Du, S.; Zhang, B.; Zhang, P. Scale-Sensitive IOU Loss: An Improved Regression Loss Function in Remote Sensing Object Detection. IEEE Access 2021, 9, 141258–141272. [Google Scholar] [CrossRef]
- Zhang, C.; Xiong, A.; Luo, X.; Zhou, C.; Liang, J. Electric Bicycle Detection Based on Improved YOLOv5. In Proceedings of the 2022 4th International Conference on Advances in Computer Technology, Information Science and Communications (CTISC), Suzhou, China, 22–24 April 2022; pp. 1–5. [Google Scholar]
- Rezatofighi, H.; Tsoi, N.; Gwak, J.; Sadeghian, A.; Reid, I.; Savarese, S. Generalized intersection over union: A metric and a loss for bounding box regression. In Proceedings of the IEEE/CVF Conference on Computer Vision and Pattern Recognition, Long Beach, CA, USA, 15–20 June 2019; pp. 658–666. [Google Scholar]
- Gevorgyan, Z. SIoU loss: More powerful learning for bounding box regression. arXiv 2022, arXiv:2205.12740. [Google Scholar]
- Shi, W.; Han, X.; Wang, X.; Li, J. Optimization Scheduling Strategy with Multi-Agent Training Data Rolling Enhancement for Regional Power Grid Considering Operation Risk and Reserve Availability. In Proceedings of the 2023 8th Asia Conference on Power and Electrical Engineering (ACPEE), Tianjin, China, 14–16 April 2023; pp. 1774–1781. [Google Scholar]
- Xu, Y.; Goodacre, R. On splitting training and validation set: A comparative study of cross-validation, bootstrap and systematic sampling for estimating the generalization performance of supervised learning. J. Anal. Test. 2018, 2, 249–262. [Google Scholar] [CrossRef] [PubMed]
- Girshick, R. Fast r-cnn. In Proceedings of the IEEE International Conference on Computer Vision, Santiago, Chile, 7–13 December 2015; pp. 1440–1448. [Google Scholar]


| Operating System | Ubuntu 20.04 |
|---|---|
| CPU | i9-12900K CPU |
| GPU | NVIDIA RTX 3090 |
| Random Access Memory | 64.00 GB |
| Deep Learning Framework | Pytorch |
| Integrated Development Environment | VSCode |
| Programming Language | Python3.7 |
| Model | mAP/% | Params (M) |
|---|---|---|
| Faster-RCNN | 69.13 | 28.296 |
| YOlOv5 | 74.47 | 7.06 |
| YOLOX | 77.14 | 8.938 |
| YOlOv7 | 78.18 | 40.329 |
| Ours | 78.45 | 9.045 |
| Model | SIoU | TModule | gnConv | mAP (%) |
|---|---|---|---|---|
| Base Model | 77.14 | |||
| A | 🗸 | 77.30 | ||
| B | 🗸 | 🗸 | 78.26 | |
| C | 🗸 | 🗸 | 77.43 | |
| Ours | 🗸 | 🗸 | 🗸 | 78.45 |
Disclaimer/Publisher’s Note: The statements, opinions and data contained in all publications are solely those of the individual author(s) and contributor(s) and not of MDPI and/or the editor(s). MDPI and/or the editor(s) disclaim responsibility for any injury to people or property resulting from any ideas, methods, instructions or products referred to in the content. |
© 2023 by the authors. Licensee MDPI, Basel, Switzerland. This article is an open access article distributed under the terms and conditions of the Creative Commons Attribution (CC BY) license (https://creativecommons.org/licenses/by/4.0/).
Share and Cite
Fan, X.; Gong, Q.; Fan, R.; Qian, J.; Zhu, J.; Xin, Y.; Shi, P. Substation Personnel Fall Detection Based on Improved YOLOX. Electronics 2023, 12, 4328. https://doi.org/10.3390/electronics12204328
Fan X, Gong Q, Fan R, Qian J, Zhu J, Xin Y, Shi P. Substation Personnel Fall Detection Based on Improved YOLOX. Electronics. 2023; 12(20):4328. https://doi.org/10.3390/electronics12204328
Chicago/Turabian StyleFan, Xinnan, Qian Gong, Rong Fan, Jin Qian, Jie Zhu, Yuanxue Xin, and Pengfei Shi. 2023. "Substation Personnel Fall Detection Based on Improved YOLOX" Electronics 12, no. 20: 4328. https://doi.org/10.3390/electronics12204328
APA StyleFan, X., Gong, Q., Fan, R., Qian, J., Zhu, J., Xin, Y., & Shi, P. (2023). Substation Personnel Fall Detection Based on Improved YOLOX. Electronics, 12(20), 4328. https://doi.org/10.3390/electronics12204328