Article

Contamination Detection Using a Deep Convolutional Neural Network with Safe Machine—Environment Interaction

by
Syed Ali Hassan
1,2,*,
Muhammad Adnan Khalil
1,2,
Fabrizia Auletta
1,2,
Mariangela Filosa
1,2,3,
Domenico Camboni
1,2,
Arianna Menciassi
1,2,3 and
Calogero Maria Oddo
1,2,3,*
1
The BioRobotics Institute, Scuola Superiore Sant’Anna, 56025 Pisa, Italy
2
Department of Excellence in Robotics & AI Scuola Superiore Sant’Anna, 56127 Pisa, Italy
3
Interdisciplinary Research Center Health Science, Scuola Superiore Sant’Anna, 56127 Pisa, Italy
*
Authors to whom correspondence should be addressed.
Electronics 2023, 12(20), 4260; https://doi.org/10.3390/electronics12204260
Submission received: 31 July 2023 / Revised: 25 September 2023 / Accepted: 4 October 2023 / Published: 15 October 2023
(This article belongs to the Special Issue Artificial Intelligence Technologies and Applications)

Abstract

:
In the food and medical packaging industries, clean packaging is crucial to both customer satisfaction and hygiene. An operational Quality Assurance Department (QAD) is necessary for detecting contaminated packages. Manual examination becomes tedious and may lead to instances of contamination being missed along the production line. To address this issue, a system for contamination detection is proposed using an enhanced deep convolutional neural network (CNN) in a human–robot collaboration framework. The proposed system utilizes a CNN to identify and classify the presence of contaminants on product surfaces. A dataset is generated, and augmentation methods are applied to the dataset for nine classes such as coffee, spot, chocolate, tomato paste, jam, cream, conditioner, shaving cream, and toothpaste contaminants. The experiment was conducted using a mechatronic platform with a camera for contamination detection and a time-of-flight sensor for safe machine–environment interaction. The results of the experiment indicate that the reported system can accurately identify contamination with 99.74% mean average precision (mAP).

1. Introduction

Both food and medical products require precise packaging with special emphasis on hygiene. Supervision to ensure that packaging is clean and neat is therefore deemed essential in both industries. In the past, methods for evaluating and verifying the quality of products heavily depended on human visual assessment. Current industrial output facilities require high operating speeds and very small tolerances, in contrast to traditional contamination detection techniques, which are slow and prone to errors [1]. These features are now considered to be limiting issues in product inspection systems. Recently, similar problems have been addressed via the development of inspection systems based on deep learning, with a variety of industries adopting such technologies [2,3]. Deep learning refers to the field of artificial intelligence that uses neural networks to automatically learn and extract complex patterns from data. Recently, deep learning has allowed developers to create more all-encompassing computer vision solutions. The field of image recognition and detection has achieved significant advancements due to the introduction of convolutional neural networks (CNNs) [4,5]. A CNN processes images without combining different feature extraction techniques and can automatically train a model to identify image features [6,7]. Results in recognition tasks undertaken using CNNS seem to be getting close to human levels of accuracy [8,9]. Since image processing methods have better levels of precision and speed, they are frequently used in studies and approaches in the packaging sector to detect faults in products [10,11]. A thorough description of CNNs and their uses in tasks such as image recognition can be found in [12], which includes a discussion of popular CNN architectures. CNN is also discussed, and several models are applied in [13] to measure the engagement of students in E-Learning assignments. The work of Zhou et al. [14] introduces the application of deep learning to food science and covers the construction of some prominent deep neural network architectures, as well as methodologies for training an algorithm in the food science domain. The authors reviewed dozens of studies that employed machine learning as a data analysis method to handle food-related problems and challenges, such as food identification; calorie calculation; detecting the freshness of fruit, meat, vegetables, and aquatic goods; and detection of food contamination. A significant part of the manufacturing process is quality assurance of the finished product, as shown by the extensive studies that have been undertaken on inspection techniques [7,8]. Similarly, Vaadi et al. developed a hyperspectral image classification technique to detect objects using CNN, which is capable of classifying objects of three different datasets [15]. Ng at al. leveraged CNNs to examine soil samples and identify different levels of contamination depending on their concentration [16]. They investigated the CNN model itself to understand its inherent use of spectral data and applied transfer learning techniques to improve the performance of their model [9,10].
More recently, the introduction of transfer learning techniques has made it possible to adapt pre-trained neural network models to new problems and use cases [6]. Such a technique eases the necessity of a sufficiently large pool of labeled data, and has been proved beneficial in [12,13,14,15,16,17,18,19], creating accurate damage detectors [20,21,22]. Liu et al. applied a transfer learning approach in [23] to build an object detection technique for crop pest detection. Their solution is based on a multilayer network model, and Inception-ResNet-v2 and VGG16 feature extractors guarantee the accuracy of the detection model.
Popular object detectors are built with region-based CNN models and single shot detectors (SSDs). Region-based CNN models, such as Mask R-CNN [24], require huge amounts of GPU memory for processing. Conversely, SSDs [21] proved to need less memory and can be implemented using less powerful hardware (e.g., mobile phones, embedded computing boards). Sharma et al. surveyed the accuracy, memory and parameter count of popular state-of-the-art micro-architectures. These served as a baseline for the progressive CNN Slim Module they proposed, which features low memory expansion, high computational efficiency, and a high feature count [25].
In this study, we tested the standard SSD-based you-only-look-once (YOLO) tiny CNN architecture as our baseline (labeled “default CNN model” hereafter) for detecting food packaging contamination and classifying the corresponding contaminants. For the contamination detection task, this model resulted in insufficient mean average precision (mAP). We then proposed a modified architecture, referred to as the “Enhanced CNN model”. Through the addition of six convolutional layers to the standard convolutional network and the implementation of the Mish activation function [26] in the initial five layers, we improved the detection performance. In a real-world scenario, detection of a contamination event also involves the action of removing the contaminated object from the production line and, in an Industry 4.0 scenario, in which automated machines increasingly interact with humans, it is necessary to pair sophisticated and accurate contamination detection techniques with safe machine–environment interaction [27,28,29]. To achieve this, our enhanced CNN-based detection method pairs proximity sensors with model optimization to achieve instantaneous recognition of coffee, spot, chocolate, tomato paste, jam, cream, conditioner, shaving cream, and toothpaste.
This paper is divided into the following sections. In Section 2, we define our paradigmatic use case, introduce the proposed solution, and describe the experimental setup. In Section 3, we describe the experimental analysis along with dataset creation, results, performance metrics, and loss function. Finally, in Section 4, we conclude our study and discuss future lines of research.

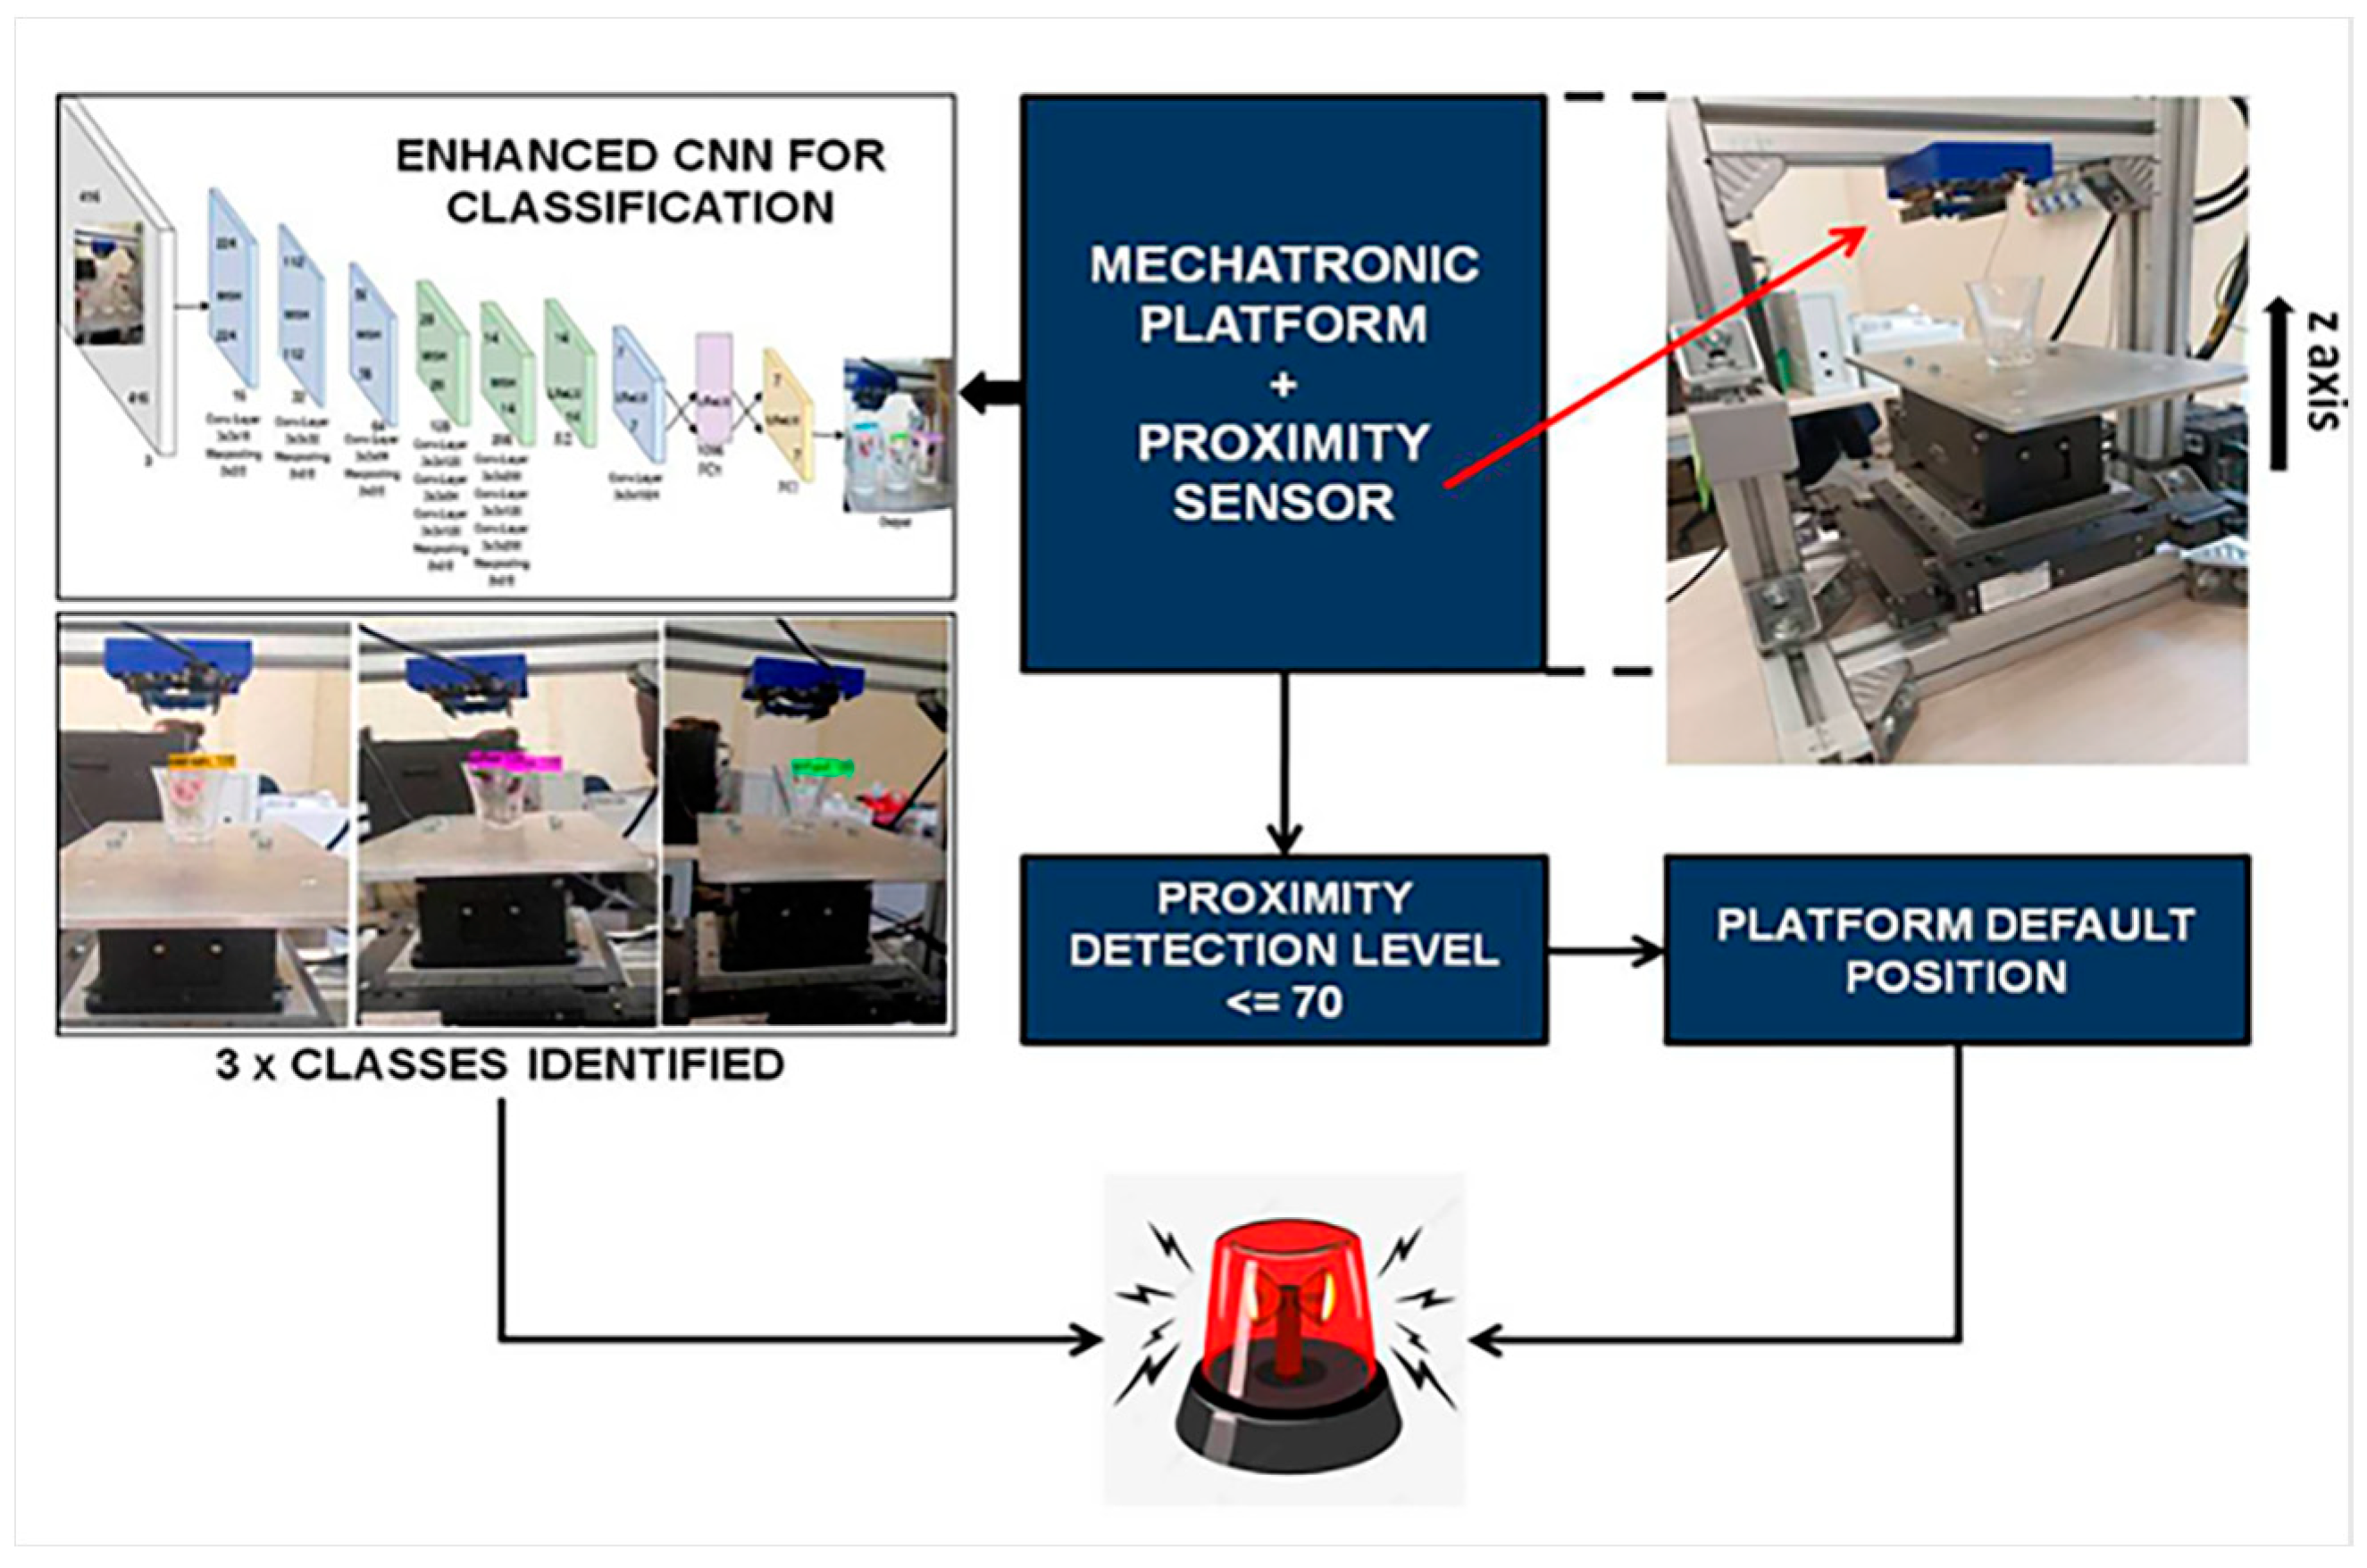
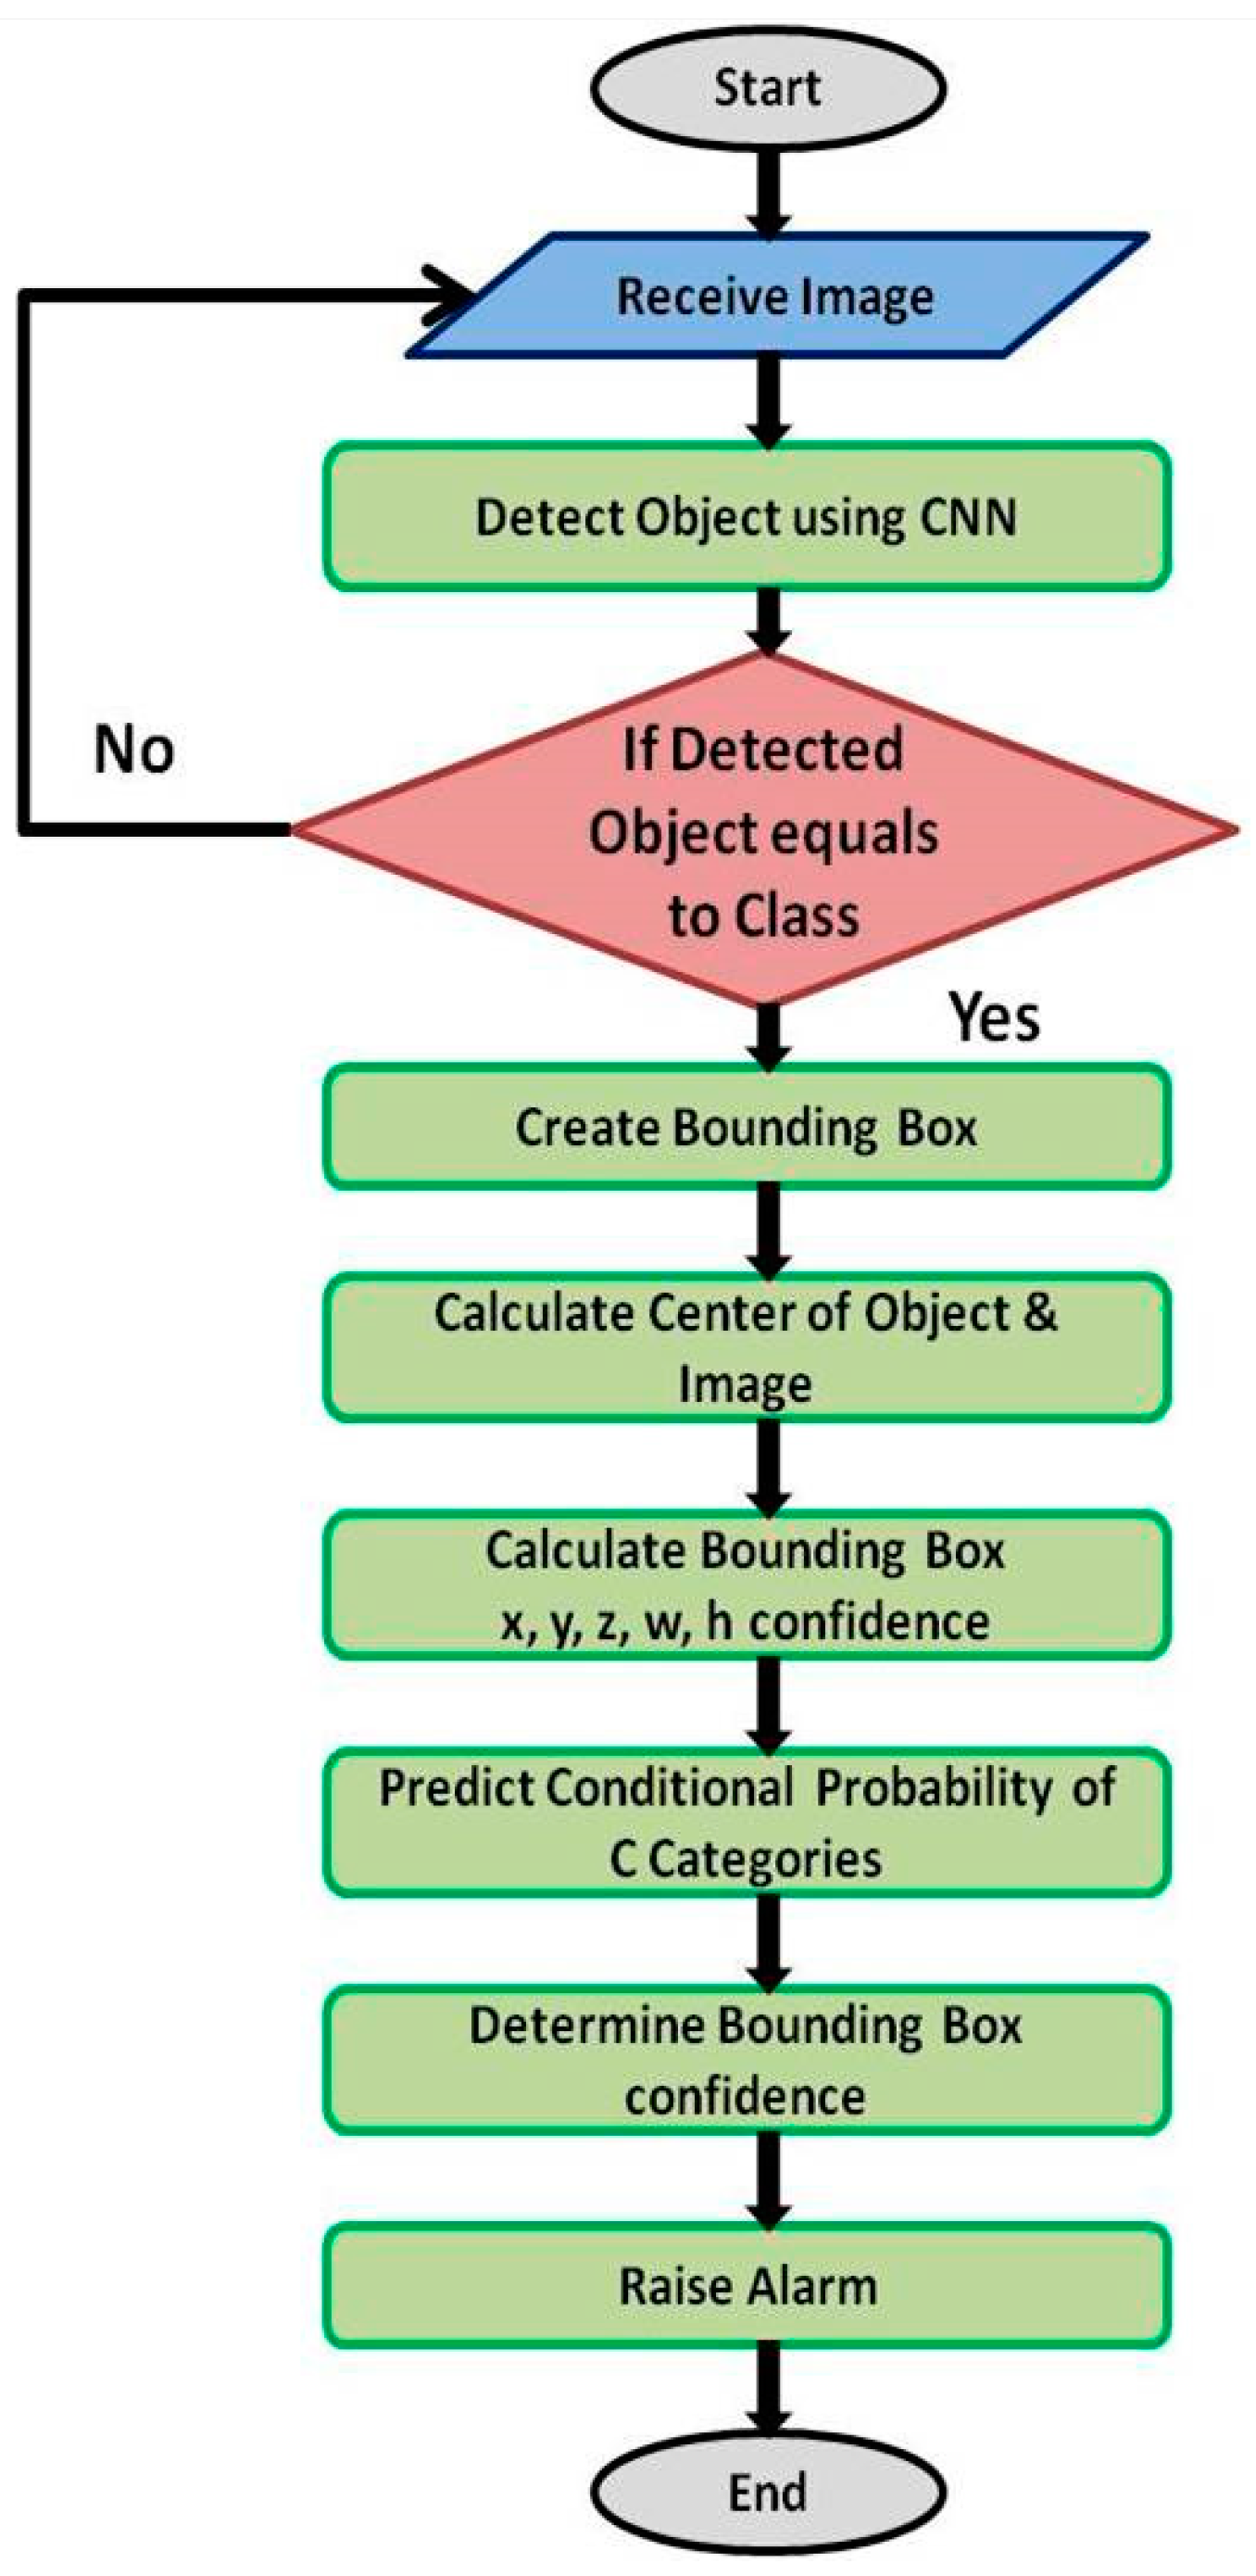
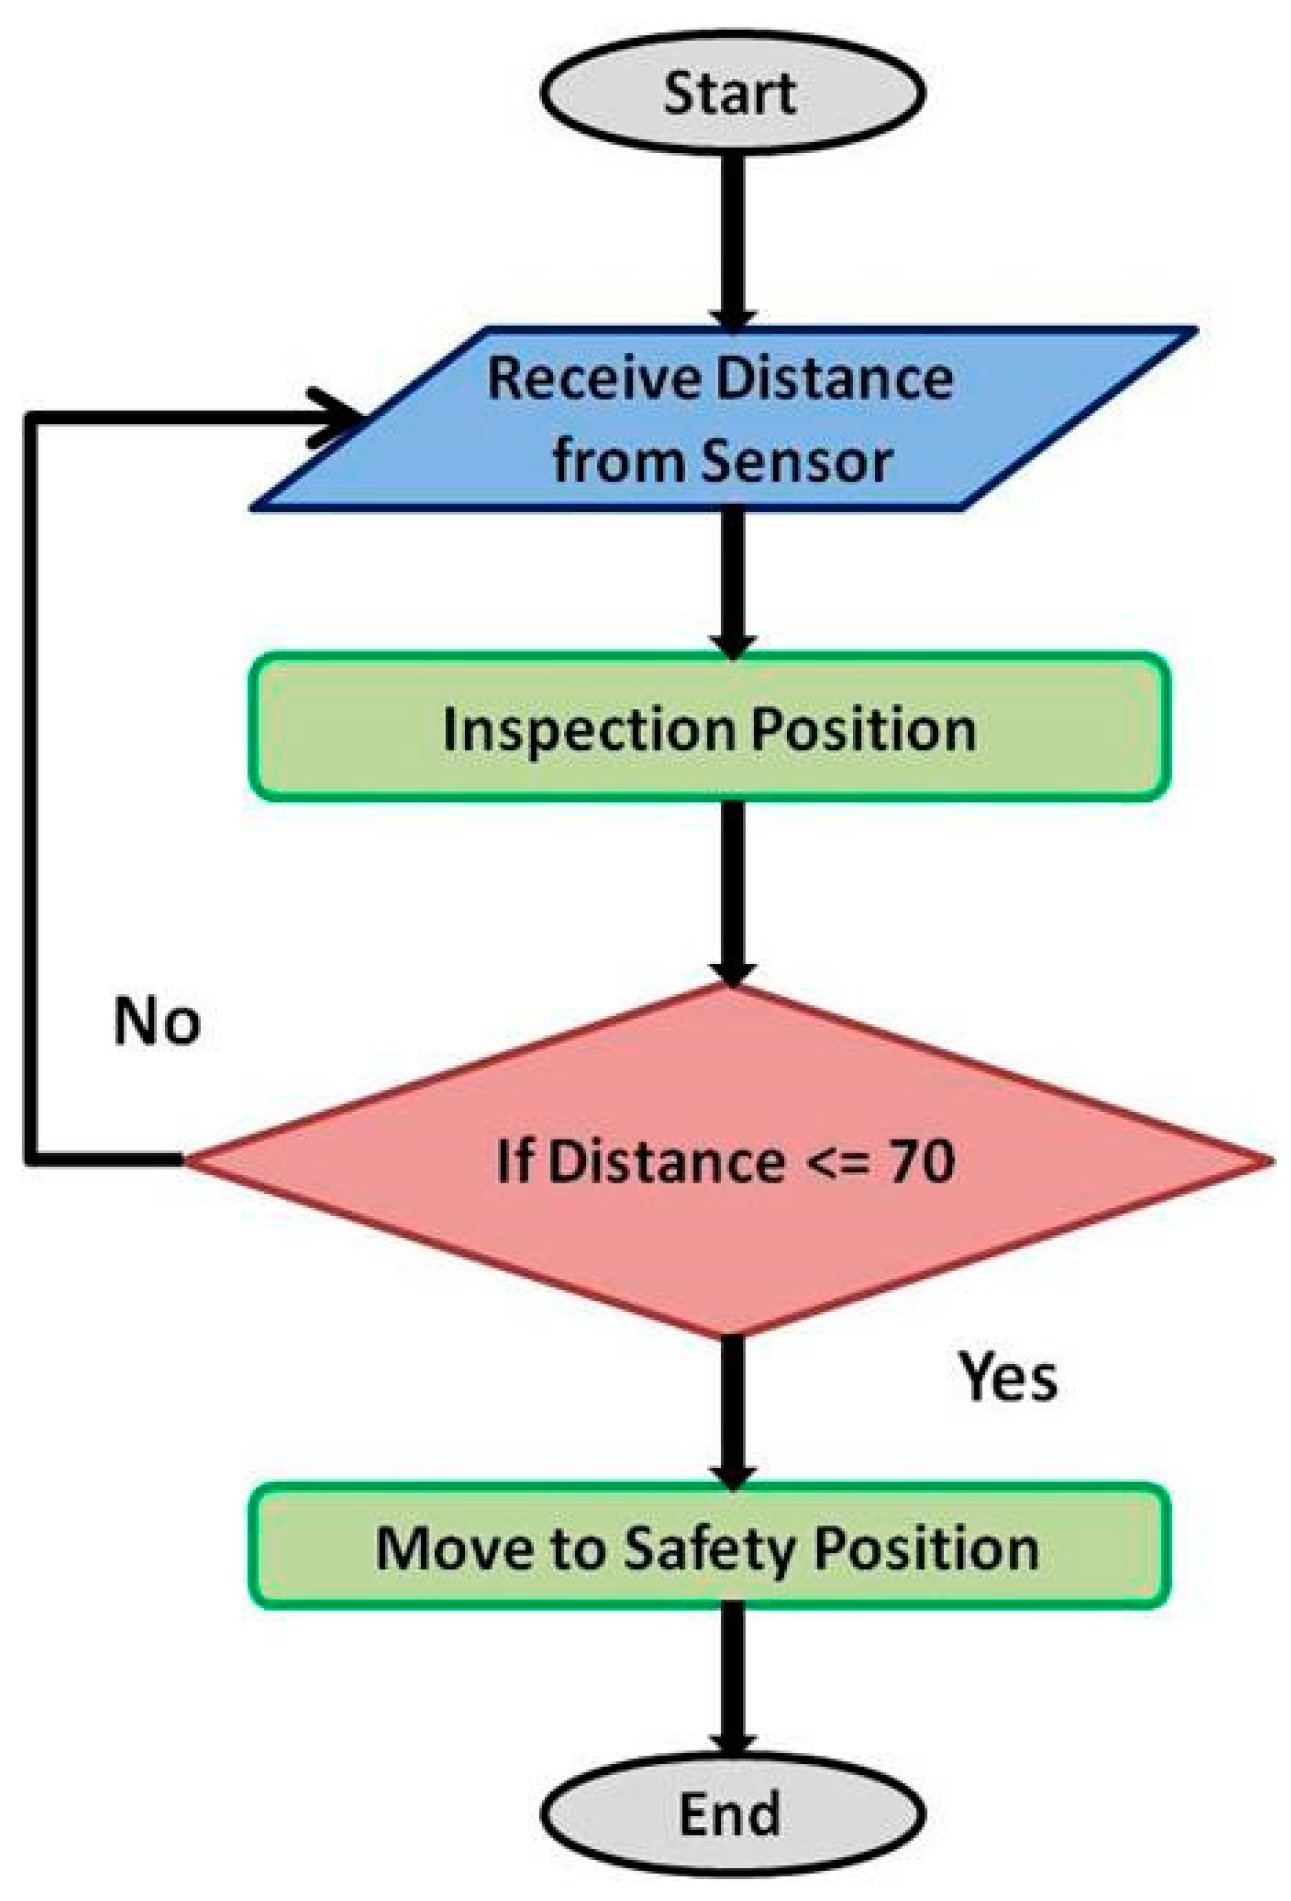
2. Use Case and Proposed Solution

Food contamination such as coffee, chocolate, and other stains must be quickly identified at the packaging stage. The frequency with which packaged food arrives on the Quality Assurance floor is too high for manual detection, and therefore it requires a smart solution for detecting contamination related to outer surfaces of the product. When a product is not clean, the buyer will avoid purchasing it, creating a poor impression in the customer’s mind about that product. Before goods are permitted to hit the market, they must undergo thorough and accurate inspection. The proposed algorithm is set up to raise the alarm when contamination is detected, at which point the Quality Assurance Department (QAD) personnel must remove the contaminated object from the conveyor belt for detailed cleaning. To ensure safe machine–environment interaction, it is proposed that a proximity sensor be used to detect unwanted human intervention and raise the alarm if it occurs. The experimental setup and the proposed algorithm are discussed in the following paragraphs.

2.1. Experimental Setup

The mechatronic platform used in this study utilized motorized translation which allowed the sample to move along the z-axis. The motorized platform (8MVT-120-25-4247, STANDA, Vilnius, Lithuania) was utilized to move the sample along the z-axis with a travel range of 2.5 cm and 5 µm resolution. A proximity sensor (VL53L5CX, ST Microelectronics, Geneva, Switzerland) used with a development board (STM32F401 Nucleo board, ST Microelectronics) was attached in an inverted position on top of the mechatronic platform for intervention detection. This sensor incorporates an array which allows it to achieve the best performance in a variety of ambient lighting situations with a variety of cover glass materials. It is the quickest, multizone, compact ToF sensor on the market; offers an accurate range of up to 400 cm; and operates at high speeds (60 Hz) with a large 65° diagonal field of view (FOV) that can be decreased. Multizone distance calculations are achievable up to 8 × 8 zones. The sensor is a multizone proximity sensor with either 8 × 8 or 4 × 4 zones, and, for this research, the 8 × 8 zone was utilized. The sensor uses diffractive optical elements (DOE) on both the receiver and transmitter. The purpose of using the proximity sensor was to ensure safe human–machine interaction because the proximity sensor is able to detect and calculate distance in real-time. The proximity sensor was programmed to detect distance and integrated with the mechatronics platform program. The mechatronics platform code was responsible for the movement of the platform and the proximity sensor code was responsible for receiving real-time sensor values. The code was written such that the mechatronics platform moved back to its default position (0 mm, z-axis) when the sensor value decreased to less than 70 mm.
The platform position for sample inspection was set at 12.5 mm on the z-axis. The height of the sample was 66 mm and the value of the proximity sensor at this height was 120 mm. In the event of a person body moving between the sample and the proximity sensor, the value of the sensor readings would decrease. If this value was below 70 mm then the platform would move back to its default position (0 mm, z-axis). The code and interface were developed using graphical programming (LabVIEW, National Instruments, Austin, TX, USA). Furthermore, any instance of movement between the sample and proximity sensor would trigger an alarm to avoid any accidents. This alarm would also be triggered in the event of contamination being detected using the reported CNN algorithm. A laptop equipped with an Nvidia RTX 3060 GPU linked to a camera was used to perform the CNN-based object detection and training. A high-resolution phone camera (Samsung S10 plus) was used to create a dataset. The block scheme of the experiment is shown in Figure 1. The flowchart of the detection model is shown in Figure 2. The flowchart of the safety algorithm is illustrated in Figure 3.
Moreover, the CNN model was enhanced by increasing the number of convolutional layers and using a combination of the Mish and leaky rectified linear unit (ReLU) activation functions for deep propagation and to improve the mAP.

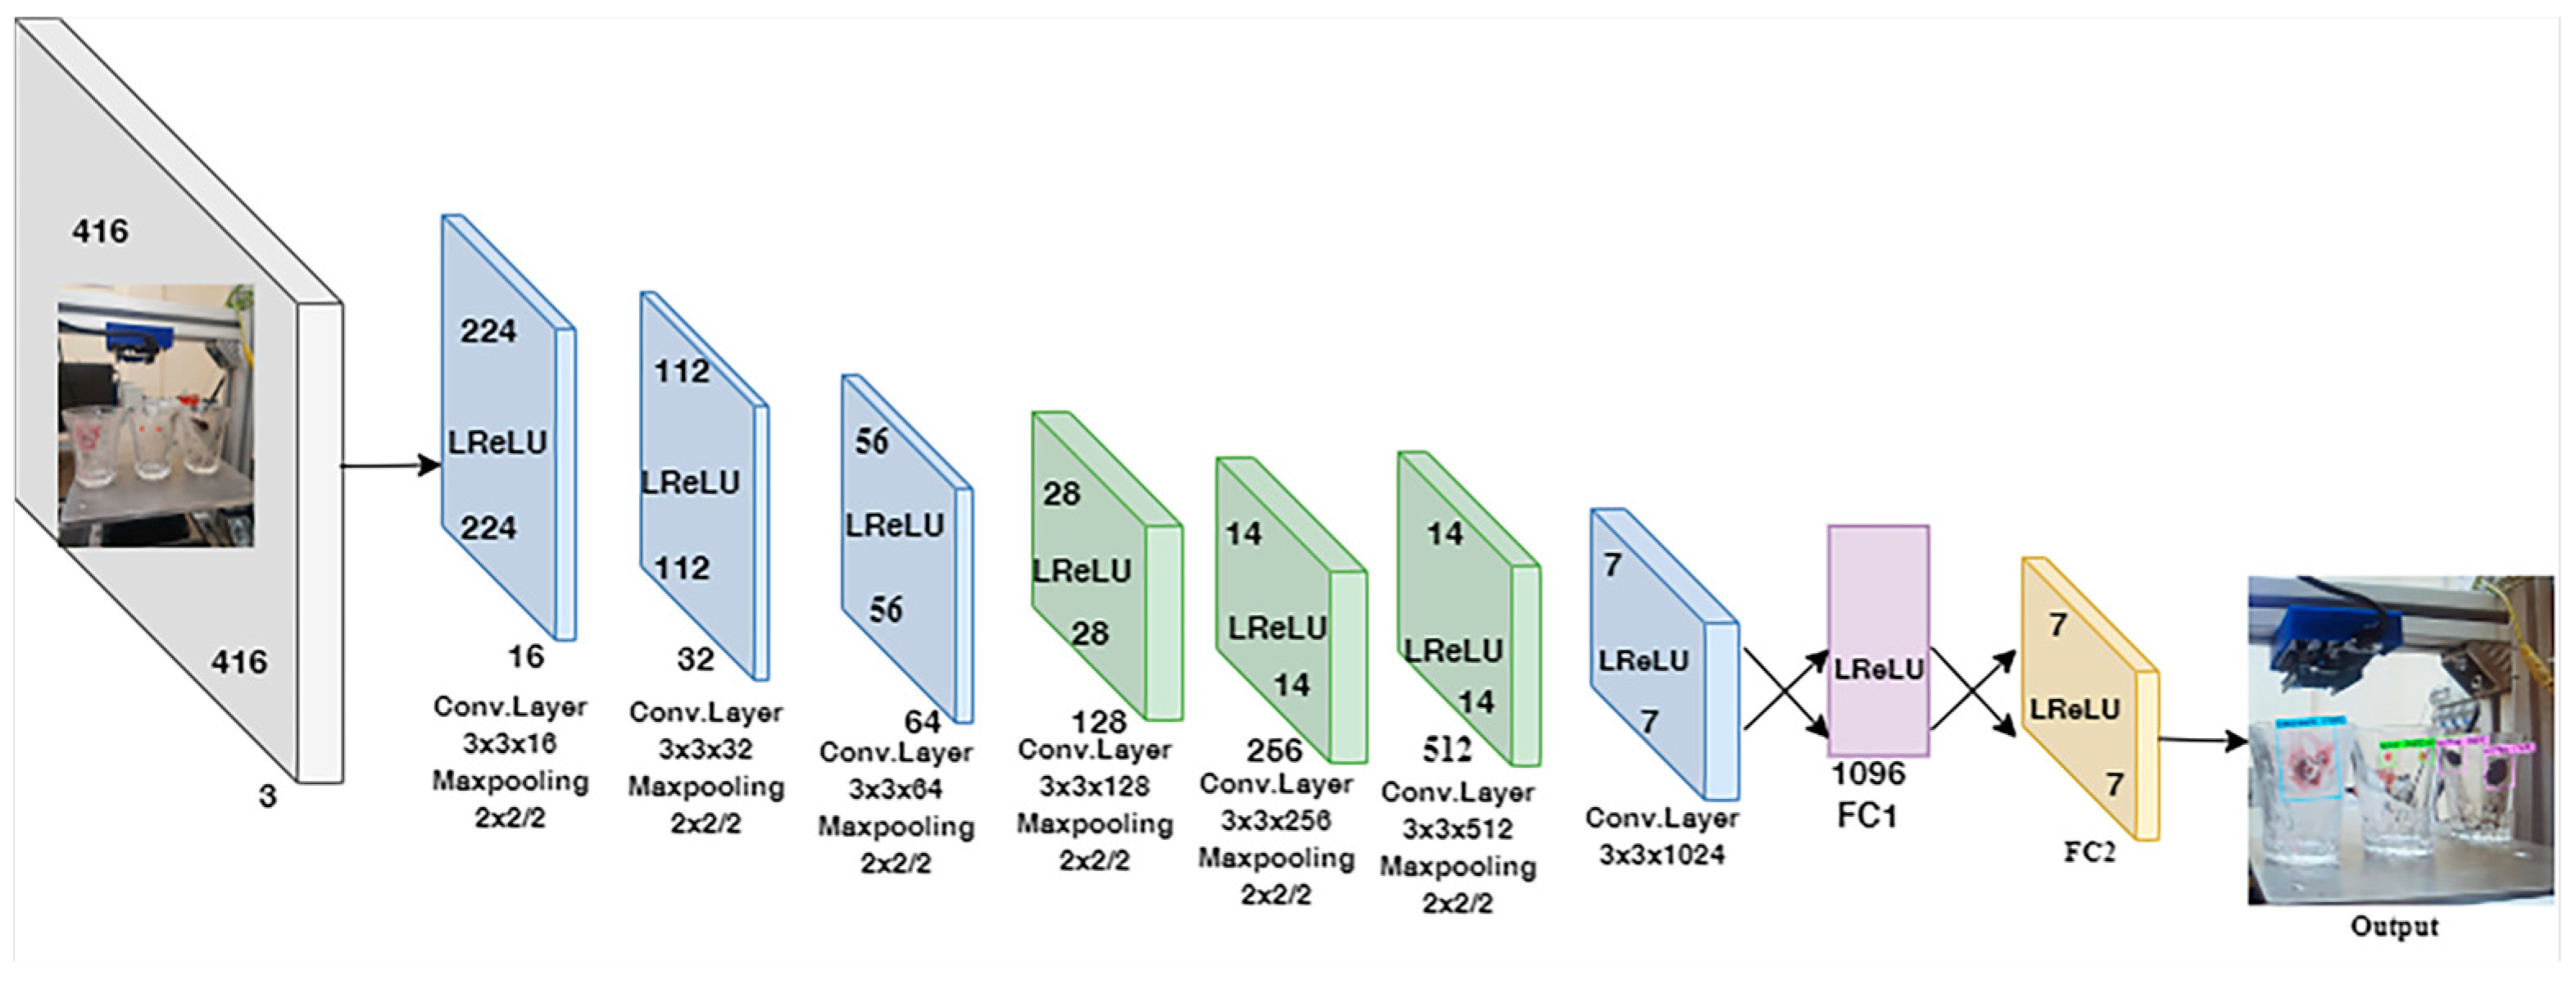
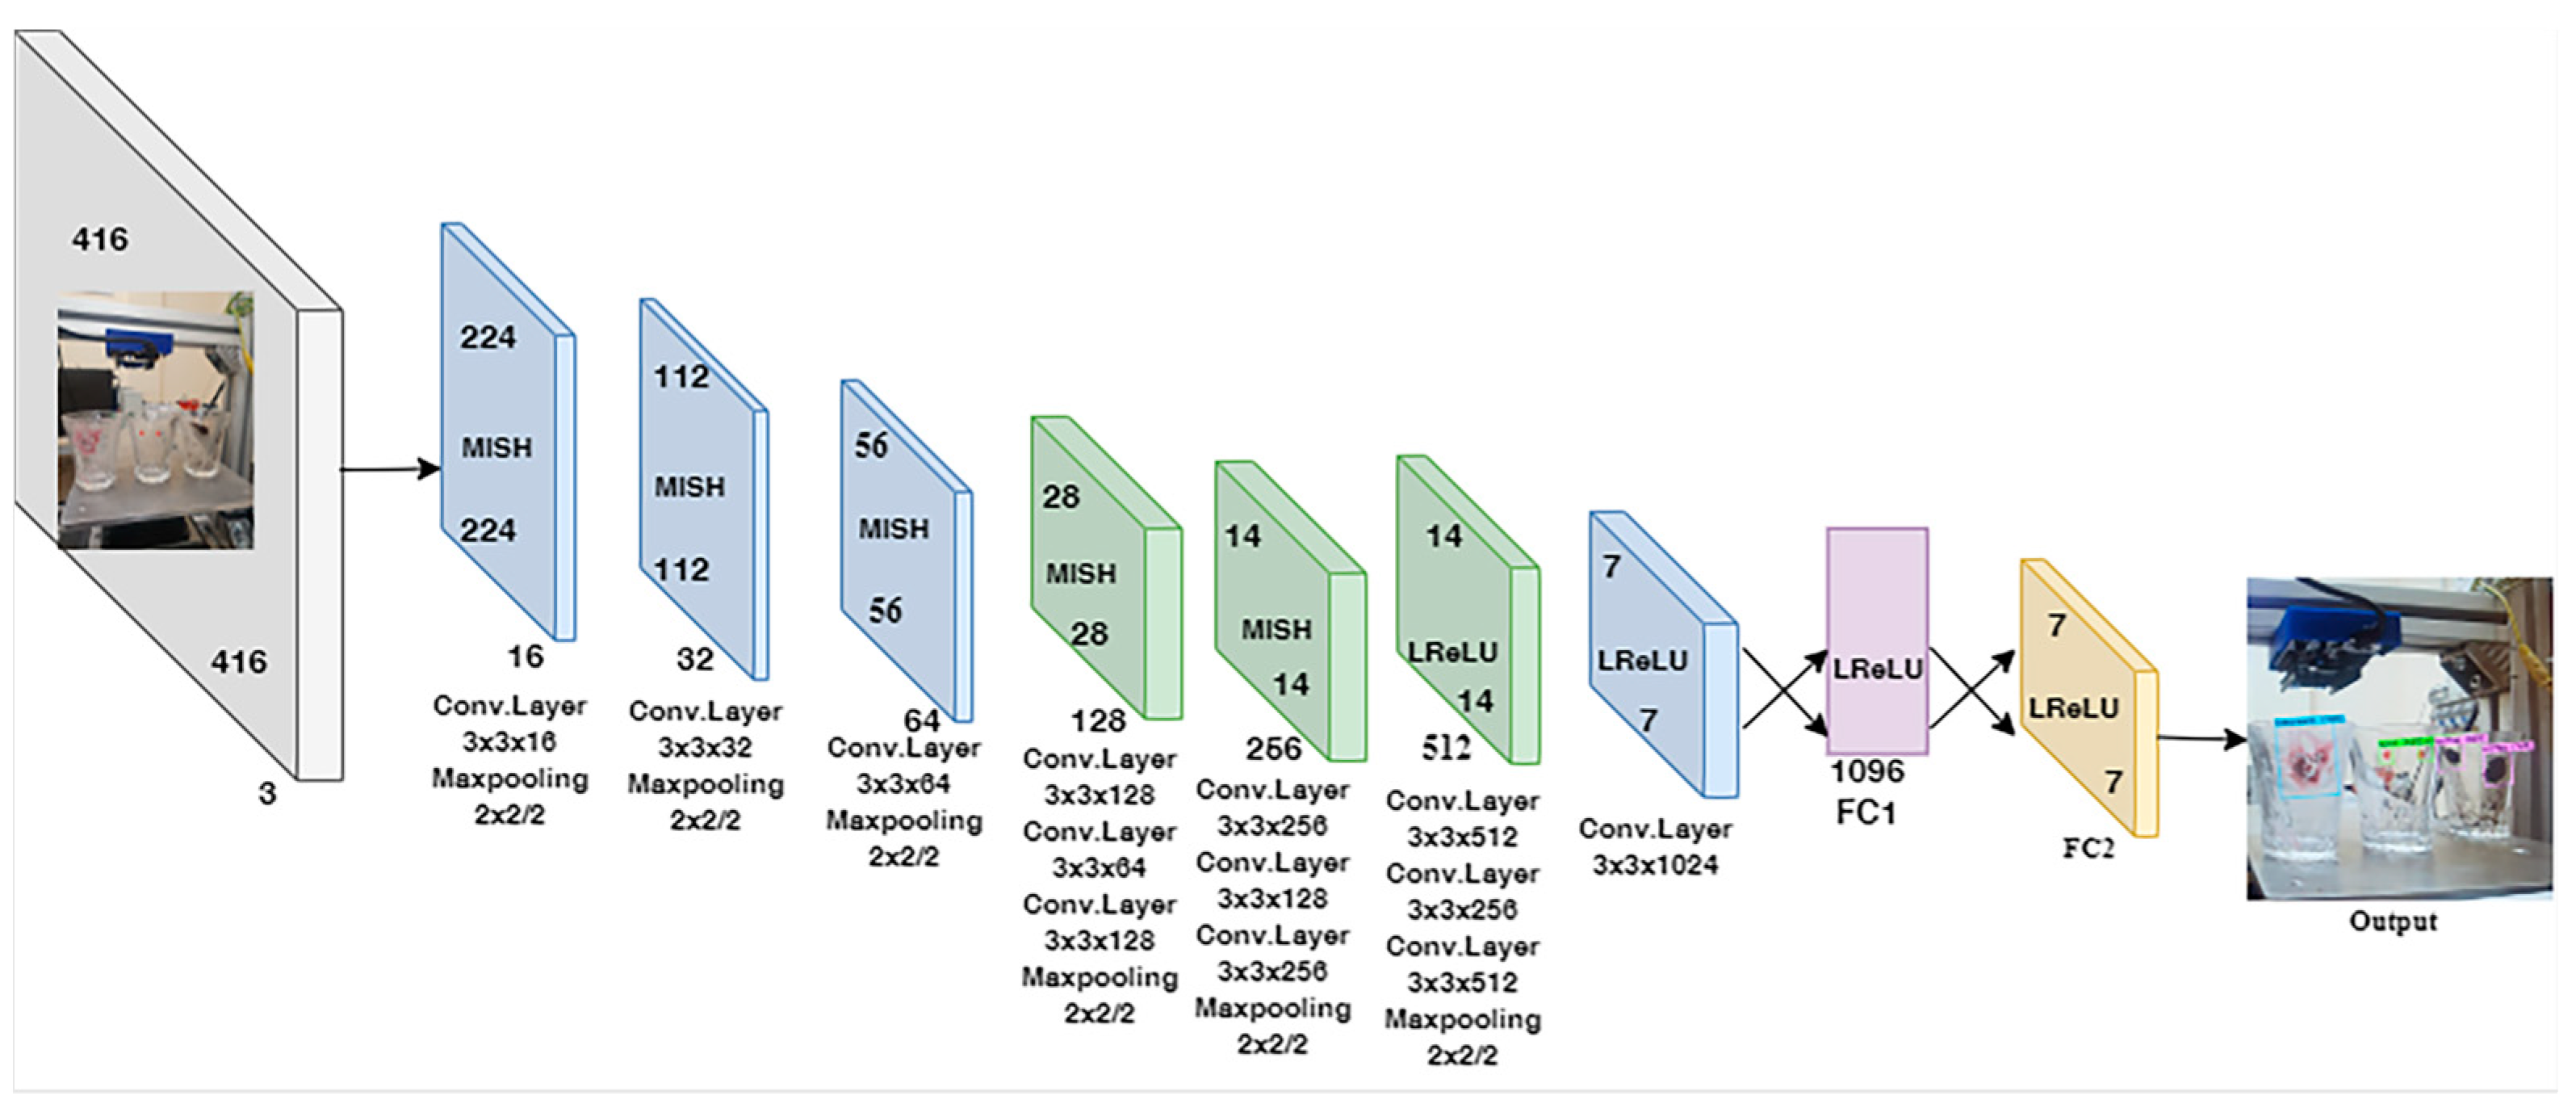
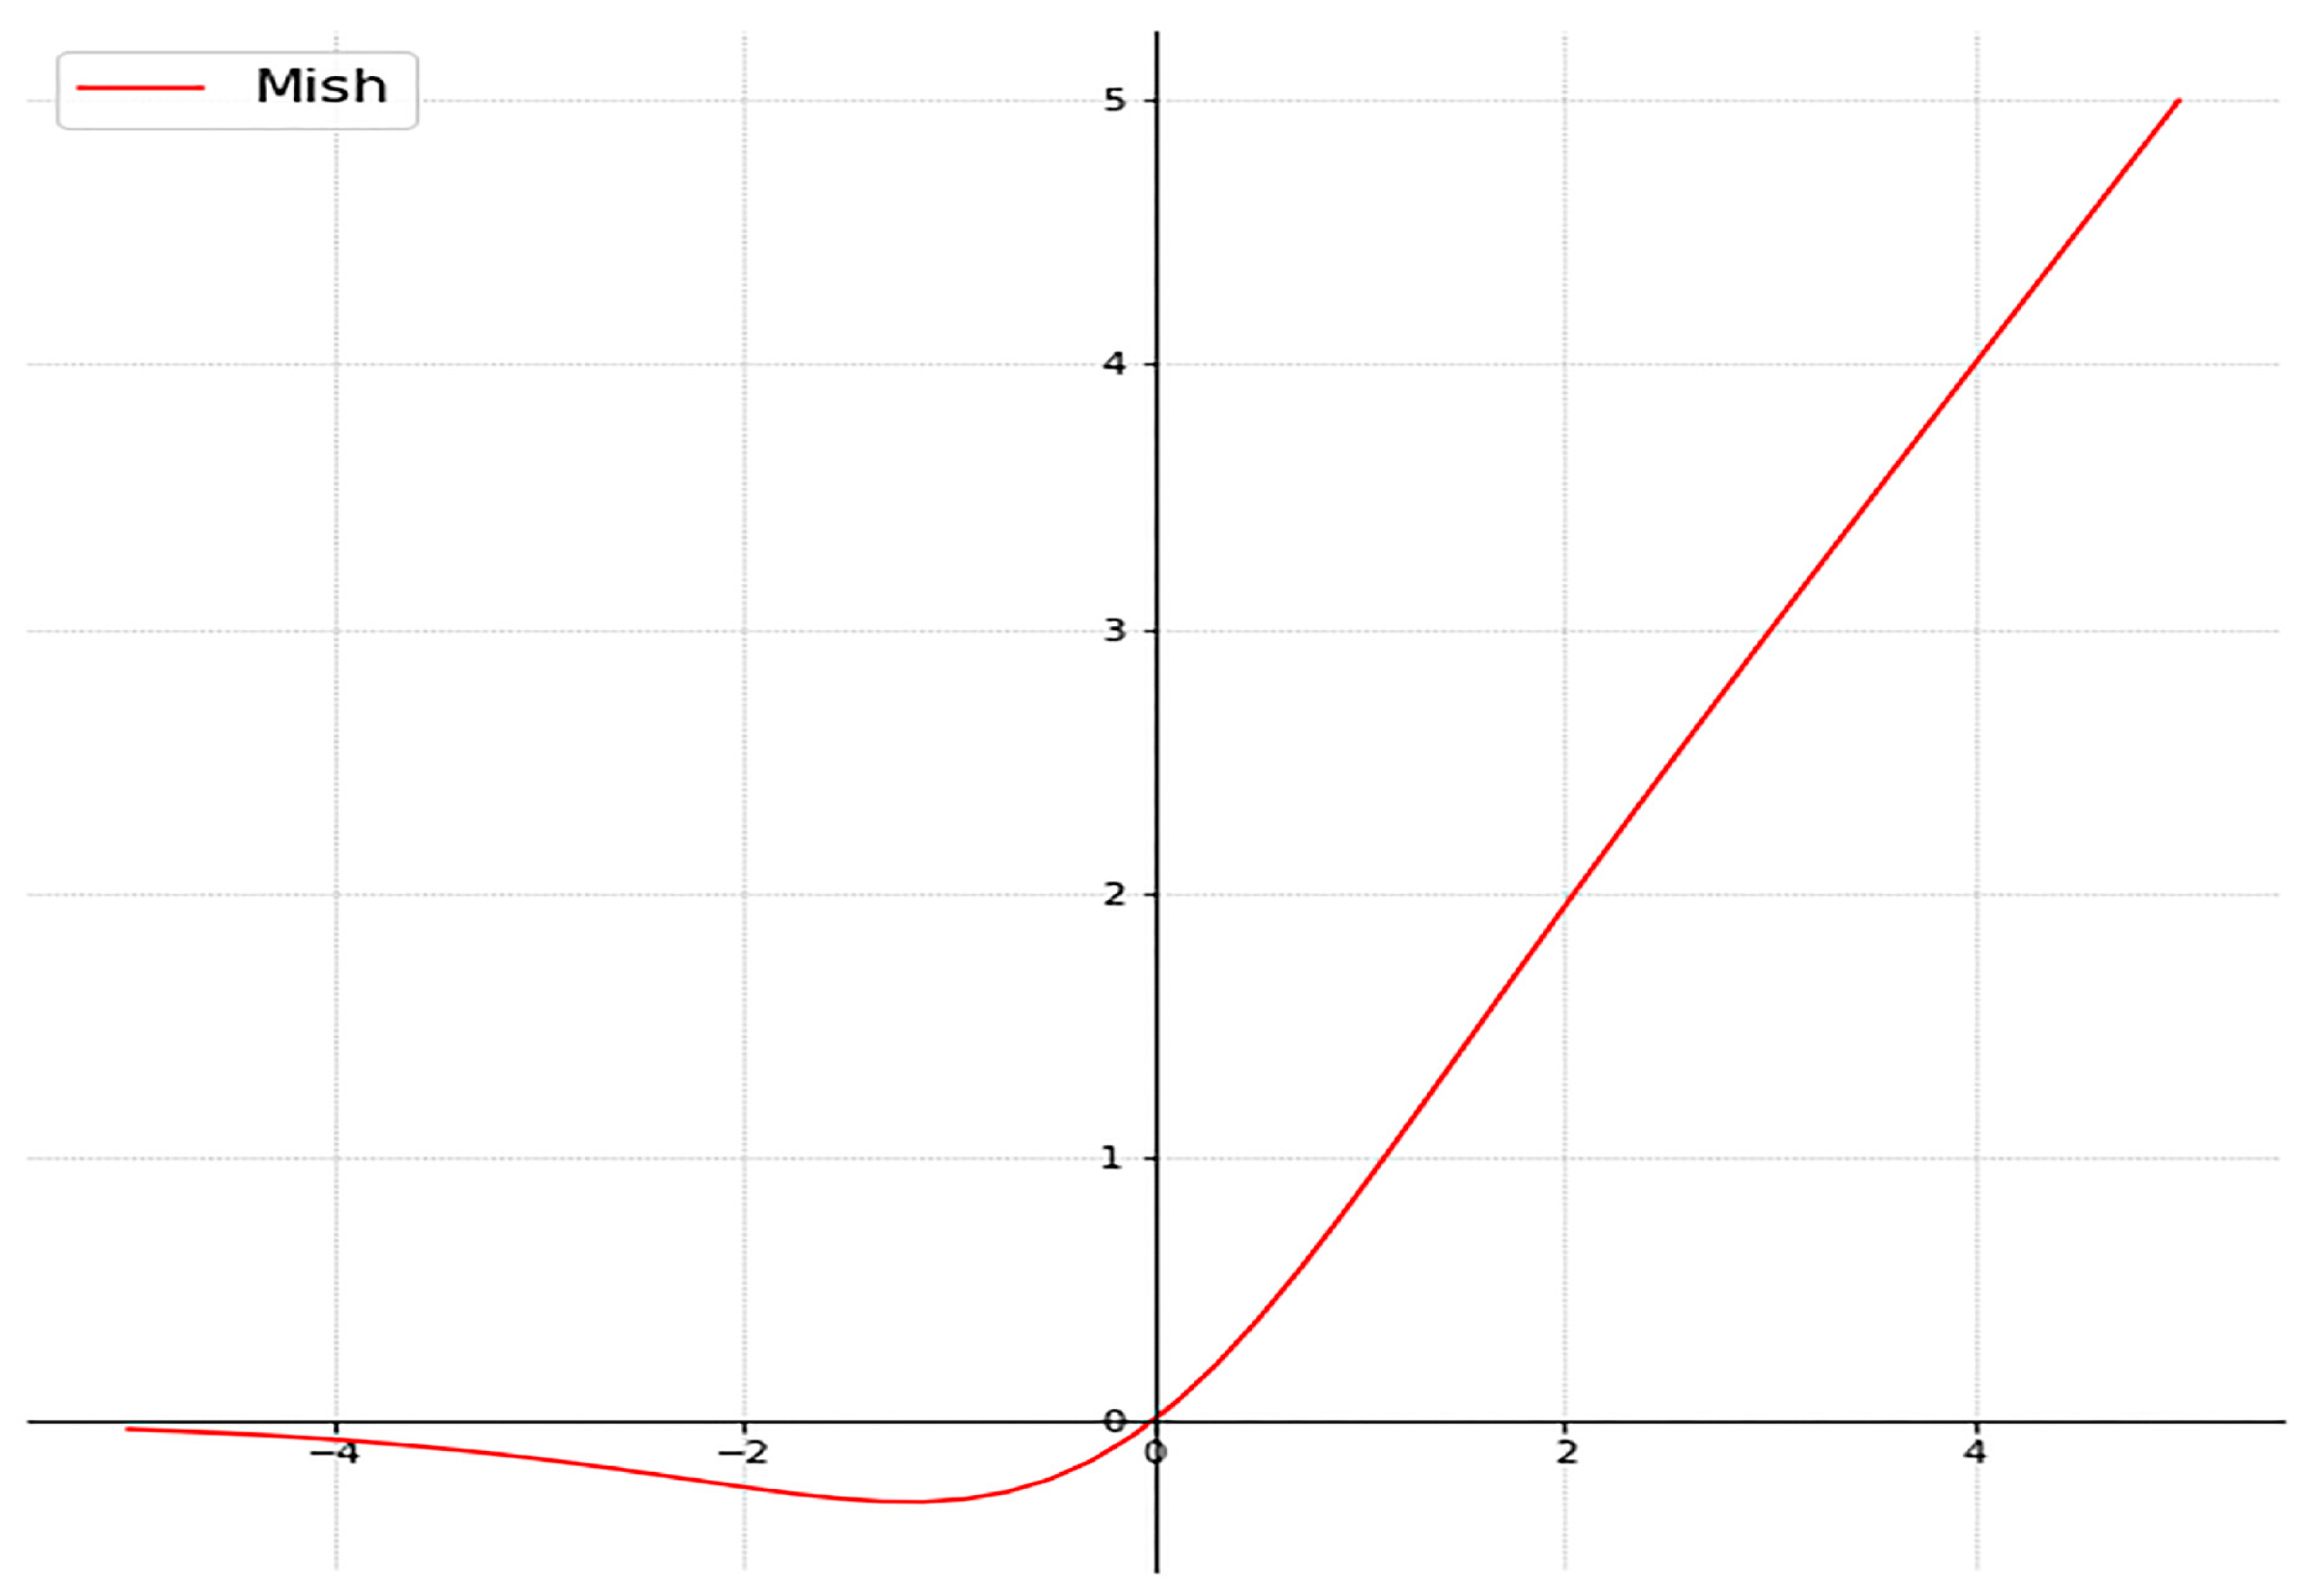
2.2. Enhancements in the CNN Model

To evaluate alternative solutions for effectively extracting the features, default and enhanced versions of CNN are compared in the present study. The default CNN model architecture can be seen in Figure 4. This architecture consists of seven convolutional layers interspersed with leaky ReLU activation layers. The architecture mimics that introduced in [30]. The leaky ReLU activation function is a modified version of the classical ReLU activation that allows for small negative outputs for negative inputs:
f x = m a x ( a x , x )
where x is the input and a a small coefficient, typically 0.01.
Our enhanced CNN model architecture is shown in Figure 5. Both the simple and enhanced models of YOLO’s CNN model are trained on the same dataset. The difference between these architectures is the addition of the Mish activation function to the leaky ReLU activation function. The Mish function has the form:
f x = x t a n h ( s o f t p l u s x )
where s o f t p l u s x = x   t a n h ( l n 1 + e x ) . Similar to the Swish activation function [31], Mish is unbounded above and bounded below within a certain range of [≈−0.31, ∞) and possesses the self-gating property, which involves multiplying the non-modulated input by the outcome of a non-linear function of the input. Mish purposely eliminates the requirements for the dying ReLU phenomenon by preserving a tiny quantity of negative information. This characteristic contributes to improved information flow and expressivity. The default model cannot produce the desired mAP since it only uses the leaky ReLU activation function. The experiment was effective at increasing the mAP via the addition of extra layers and the Mish activation function, which produced higher mAP. In [32], the Mish activation function is utilized for performance improvement and effective intrusion detection and significant performance improvement is demonstrated. Similarly, the Mish activation function is used in [33] to enhance license plate detection performance and the model is tested with several datasets and also with a self-created dataset, providing better results when compared to the published results in the literature. The purpose of enhancing the CNN is to enable more accurate and faster object detection. This is an option for devices with lower processing power, because of its lower convolutional layer count. However, this may decrease the mAP at the cost of speed. In deep learning, a variety of activation functions have been created and employed depending on the type of problem statement. There are studies in the literature which report that the Mish activation function outperforms ReLU in specific cases [34,35]. Mish is preferable when the goal is to improve mAP, while leaky ReLU is better when the target is to enhance speed; indeed, the default model, which solely uses the leaky ReLU activation function, is fast but has a lower mAP. We increased the number of layers and employed both activation functions to enhance the overall performance of the model. The fact that mAP increased during the training of the enhanced model supports the claim that employing both activation functions and increasing the number of layers results in better deep propagation and enhanced mAP.
In order to increase the model’s mAP, six convolutional layers were added. The first five of these layers rely on the Mish activation function. The output layer presents a softmax function. The Mish activation function replaced ReLU in the first five layers to achieve deep propagation, as proposed in [26] and illustrated in Figure 6. The Mish activation function was added to produce deeper propagation of object information, self-regularization, and enhanced capping avoidance. Although adding extra layers can improve the mAP, it adds more model parameters, which utilizes more memory and causes the network to perform more calculations. Resnet [36] suggests adding a 1 × 1 CNN layer to lessen computation in order to decrease superfluous processing. We used this method to suggest a 1 × 1 convolution kernel. By maintaining memory, this method not only shortens the computation time but also improves the extraction of features.

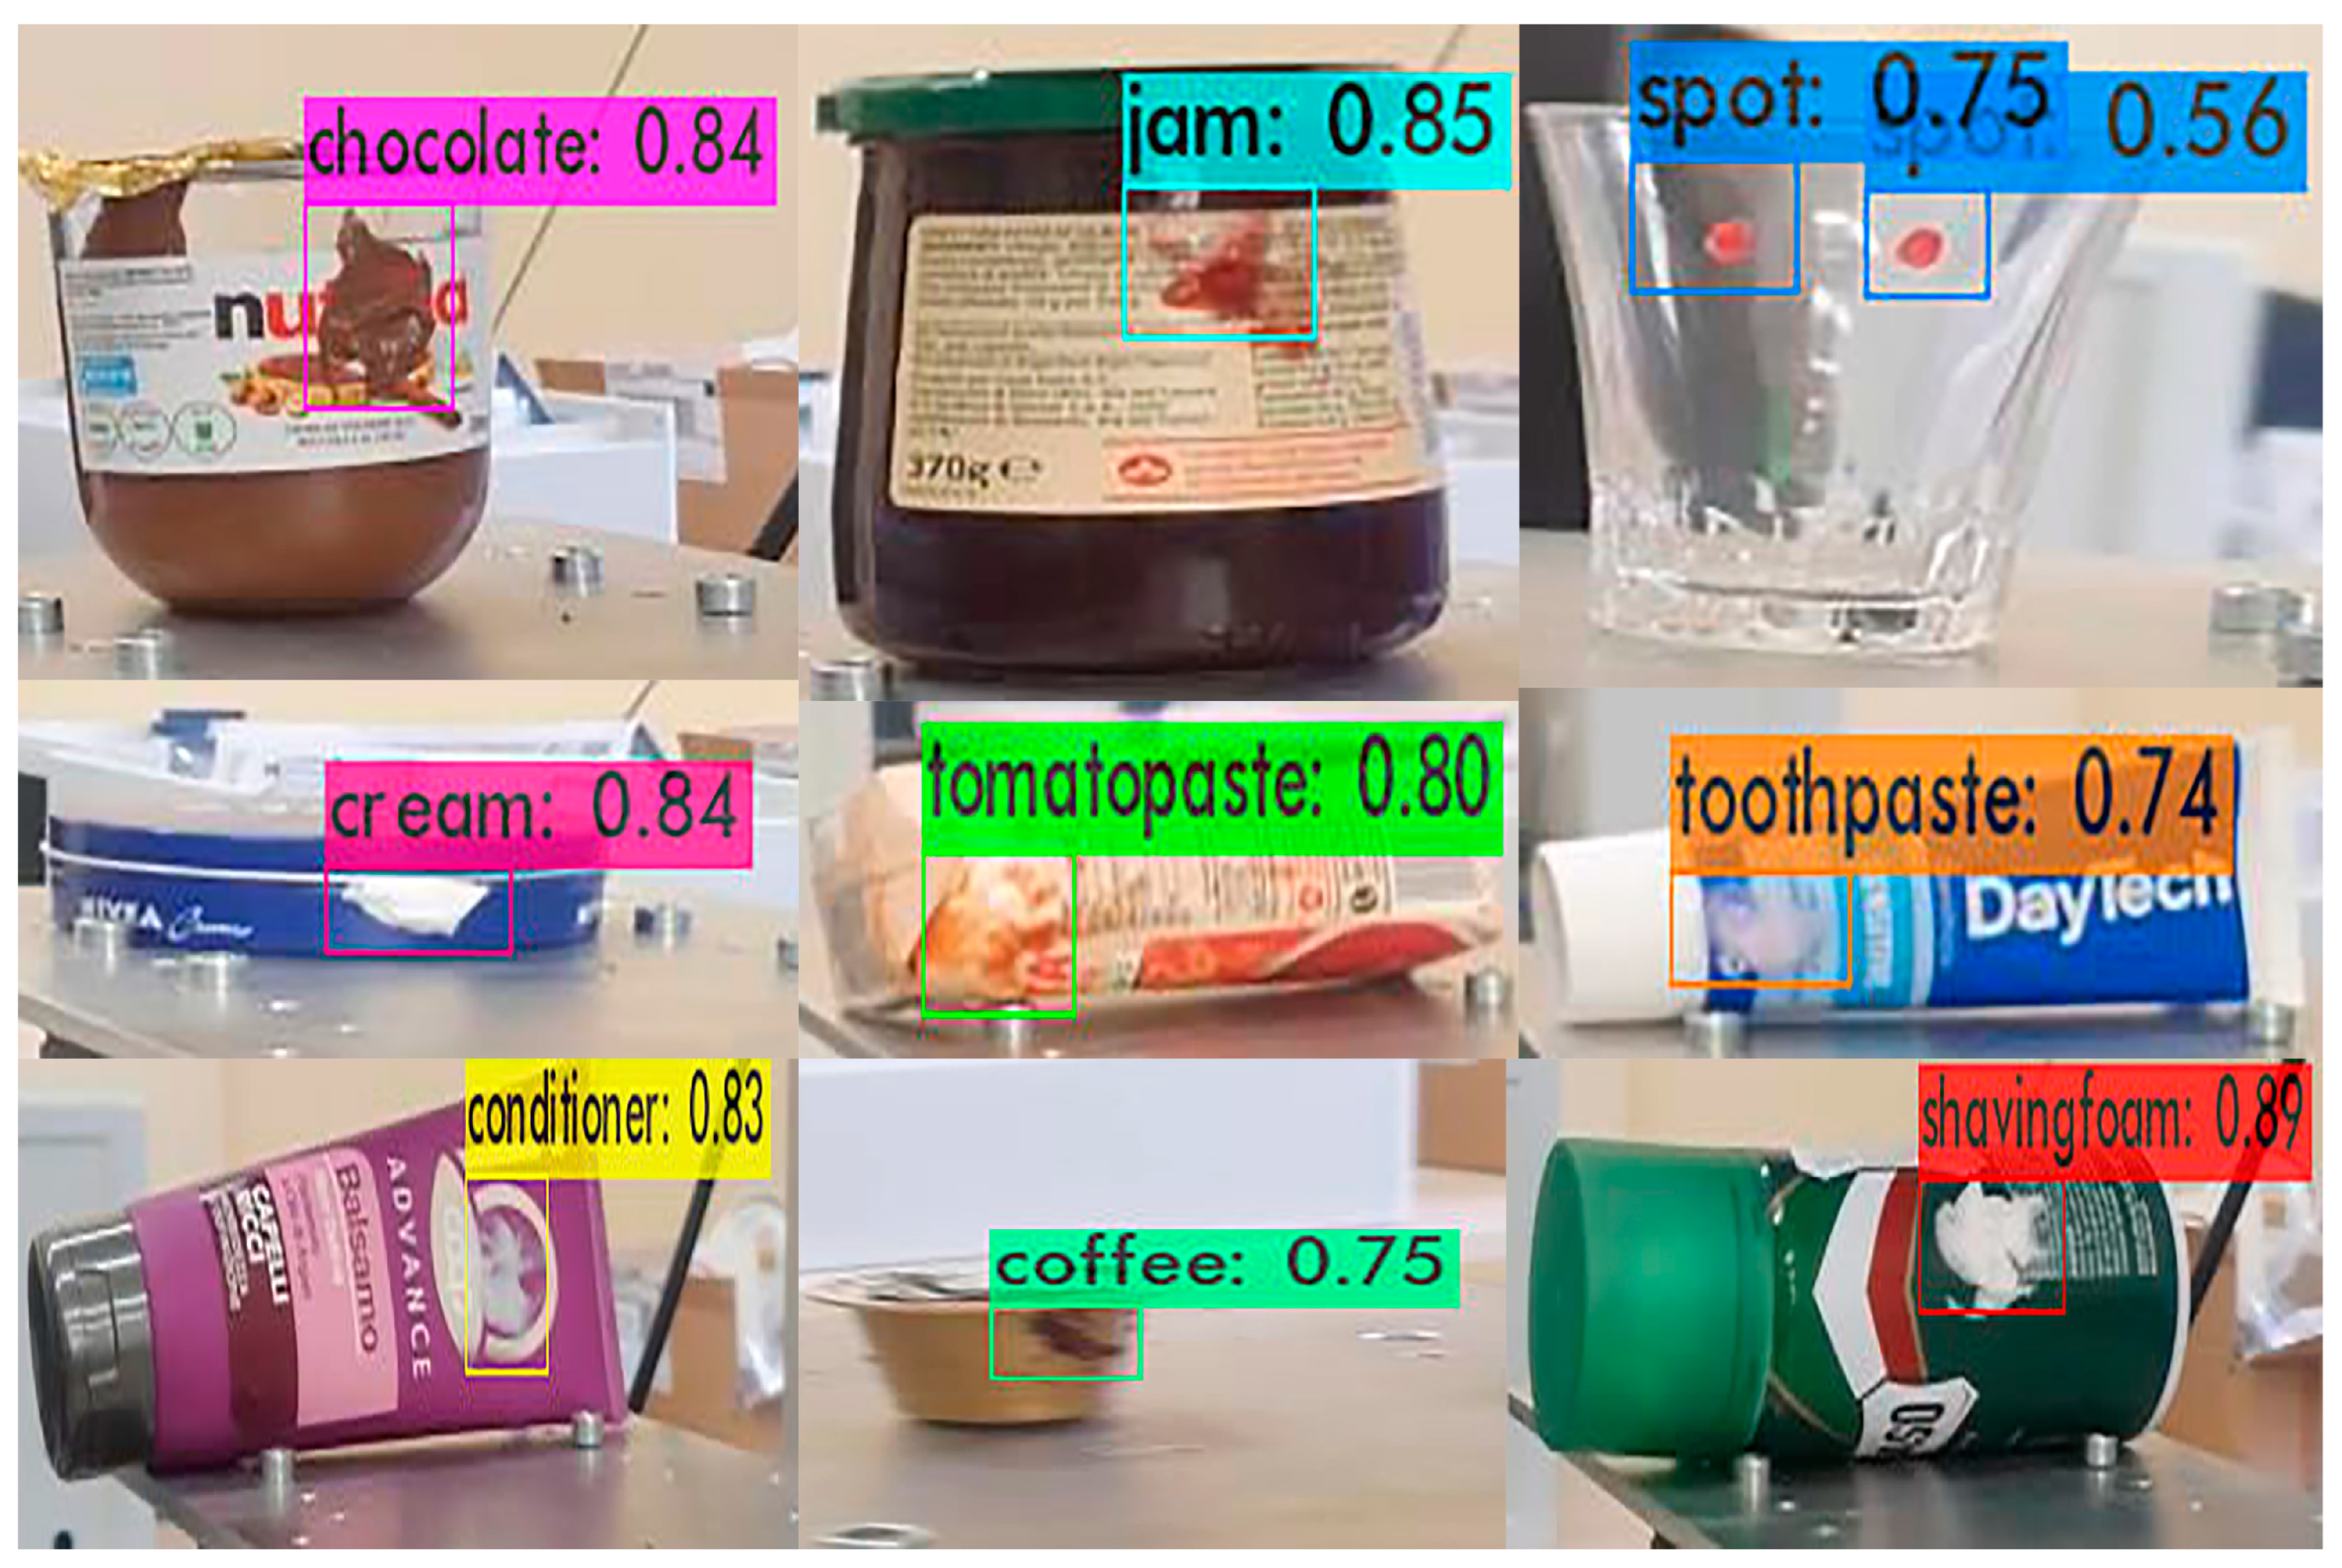
3. Experimental Analysis

This section discusses the details regarding dataset creation/augmentation, along with the results achieved using the enhanced model, and compares them with the default model.

3.1. Dataset Specification and Augmentation

For the self-created dataset, several products such as coffee, spot, chocolate, tomato-paste, jam, cream, conditioner, shaving cream, and toothpaste) were chosen as contaminants and then applied to several different packages to contaminate and/or stain them. The nine classes of contaminants represent a selection of the most common packaging contaminants among everyday objects and were chosen as a proof of concept for our proposed approach to successfully detecting contaminants which vary in size, shape, texture, and color. For example, chocolate and spot stains differ in size and color, while cream and conditioner vary in texture even if they share the same color. The dataset generated was initially produced as a video, and then a frame was taken from the video using a Python script for labeling. The labeling was performed manually and different augmentation techniques were applied, such as rotation (−15 to +15 degrees), flip (vertical, horizontal), saturation (25%), brightness level (−25% to 25%), noise, and blur (2%). Overall, 2700 RGB (red, green, blue) images were generated for the nine classes, 70% of the images were utilized for training, 20% of the images were utilized for validation, and 10% were utilized for testing. The dataset creation process was challenging and time-consuming because we meticulously prepared the dataset and re-checked it multiple times to avoid bad results during the training phase. Furthermore, sufficient attention was necessary to label thousands of images because labeling the class name incorrectly would have reduced the model’s mAP. After finishing all of the class labeling, we inspected all of the labeled images before training to ensure that our model learned appropriately.

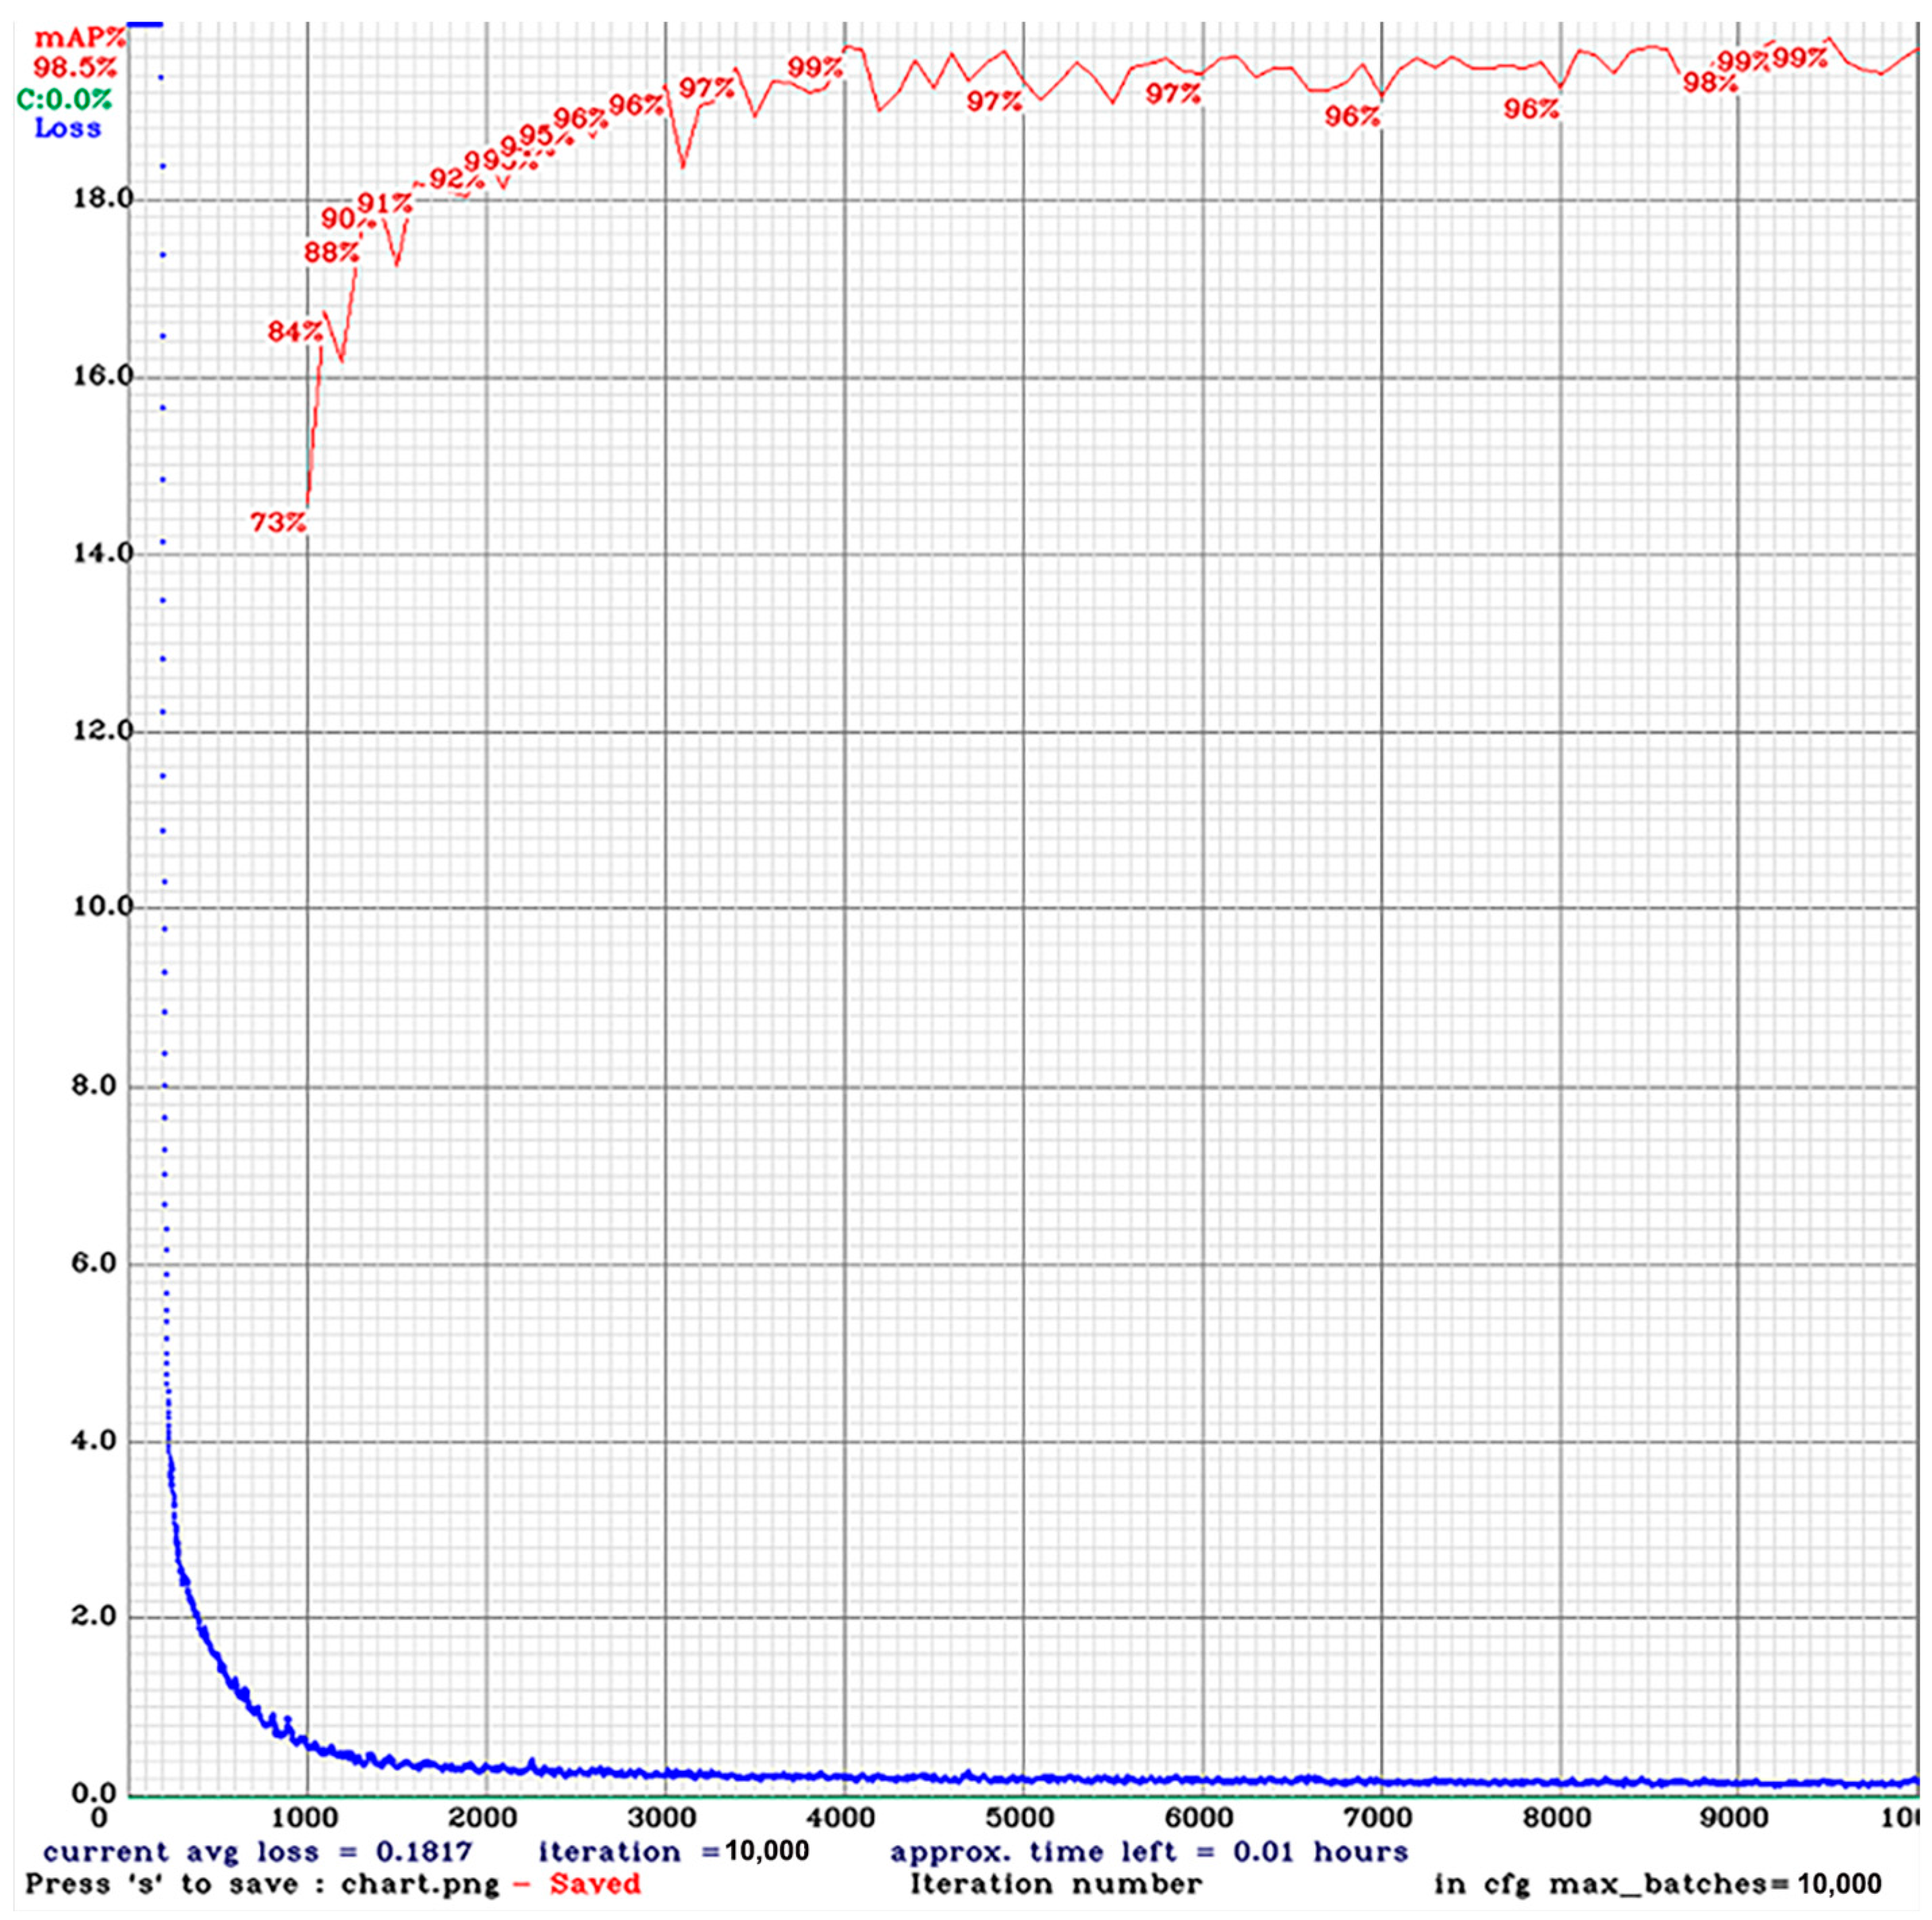
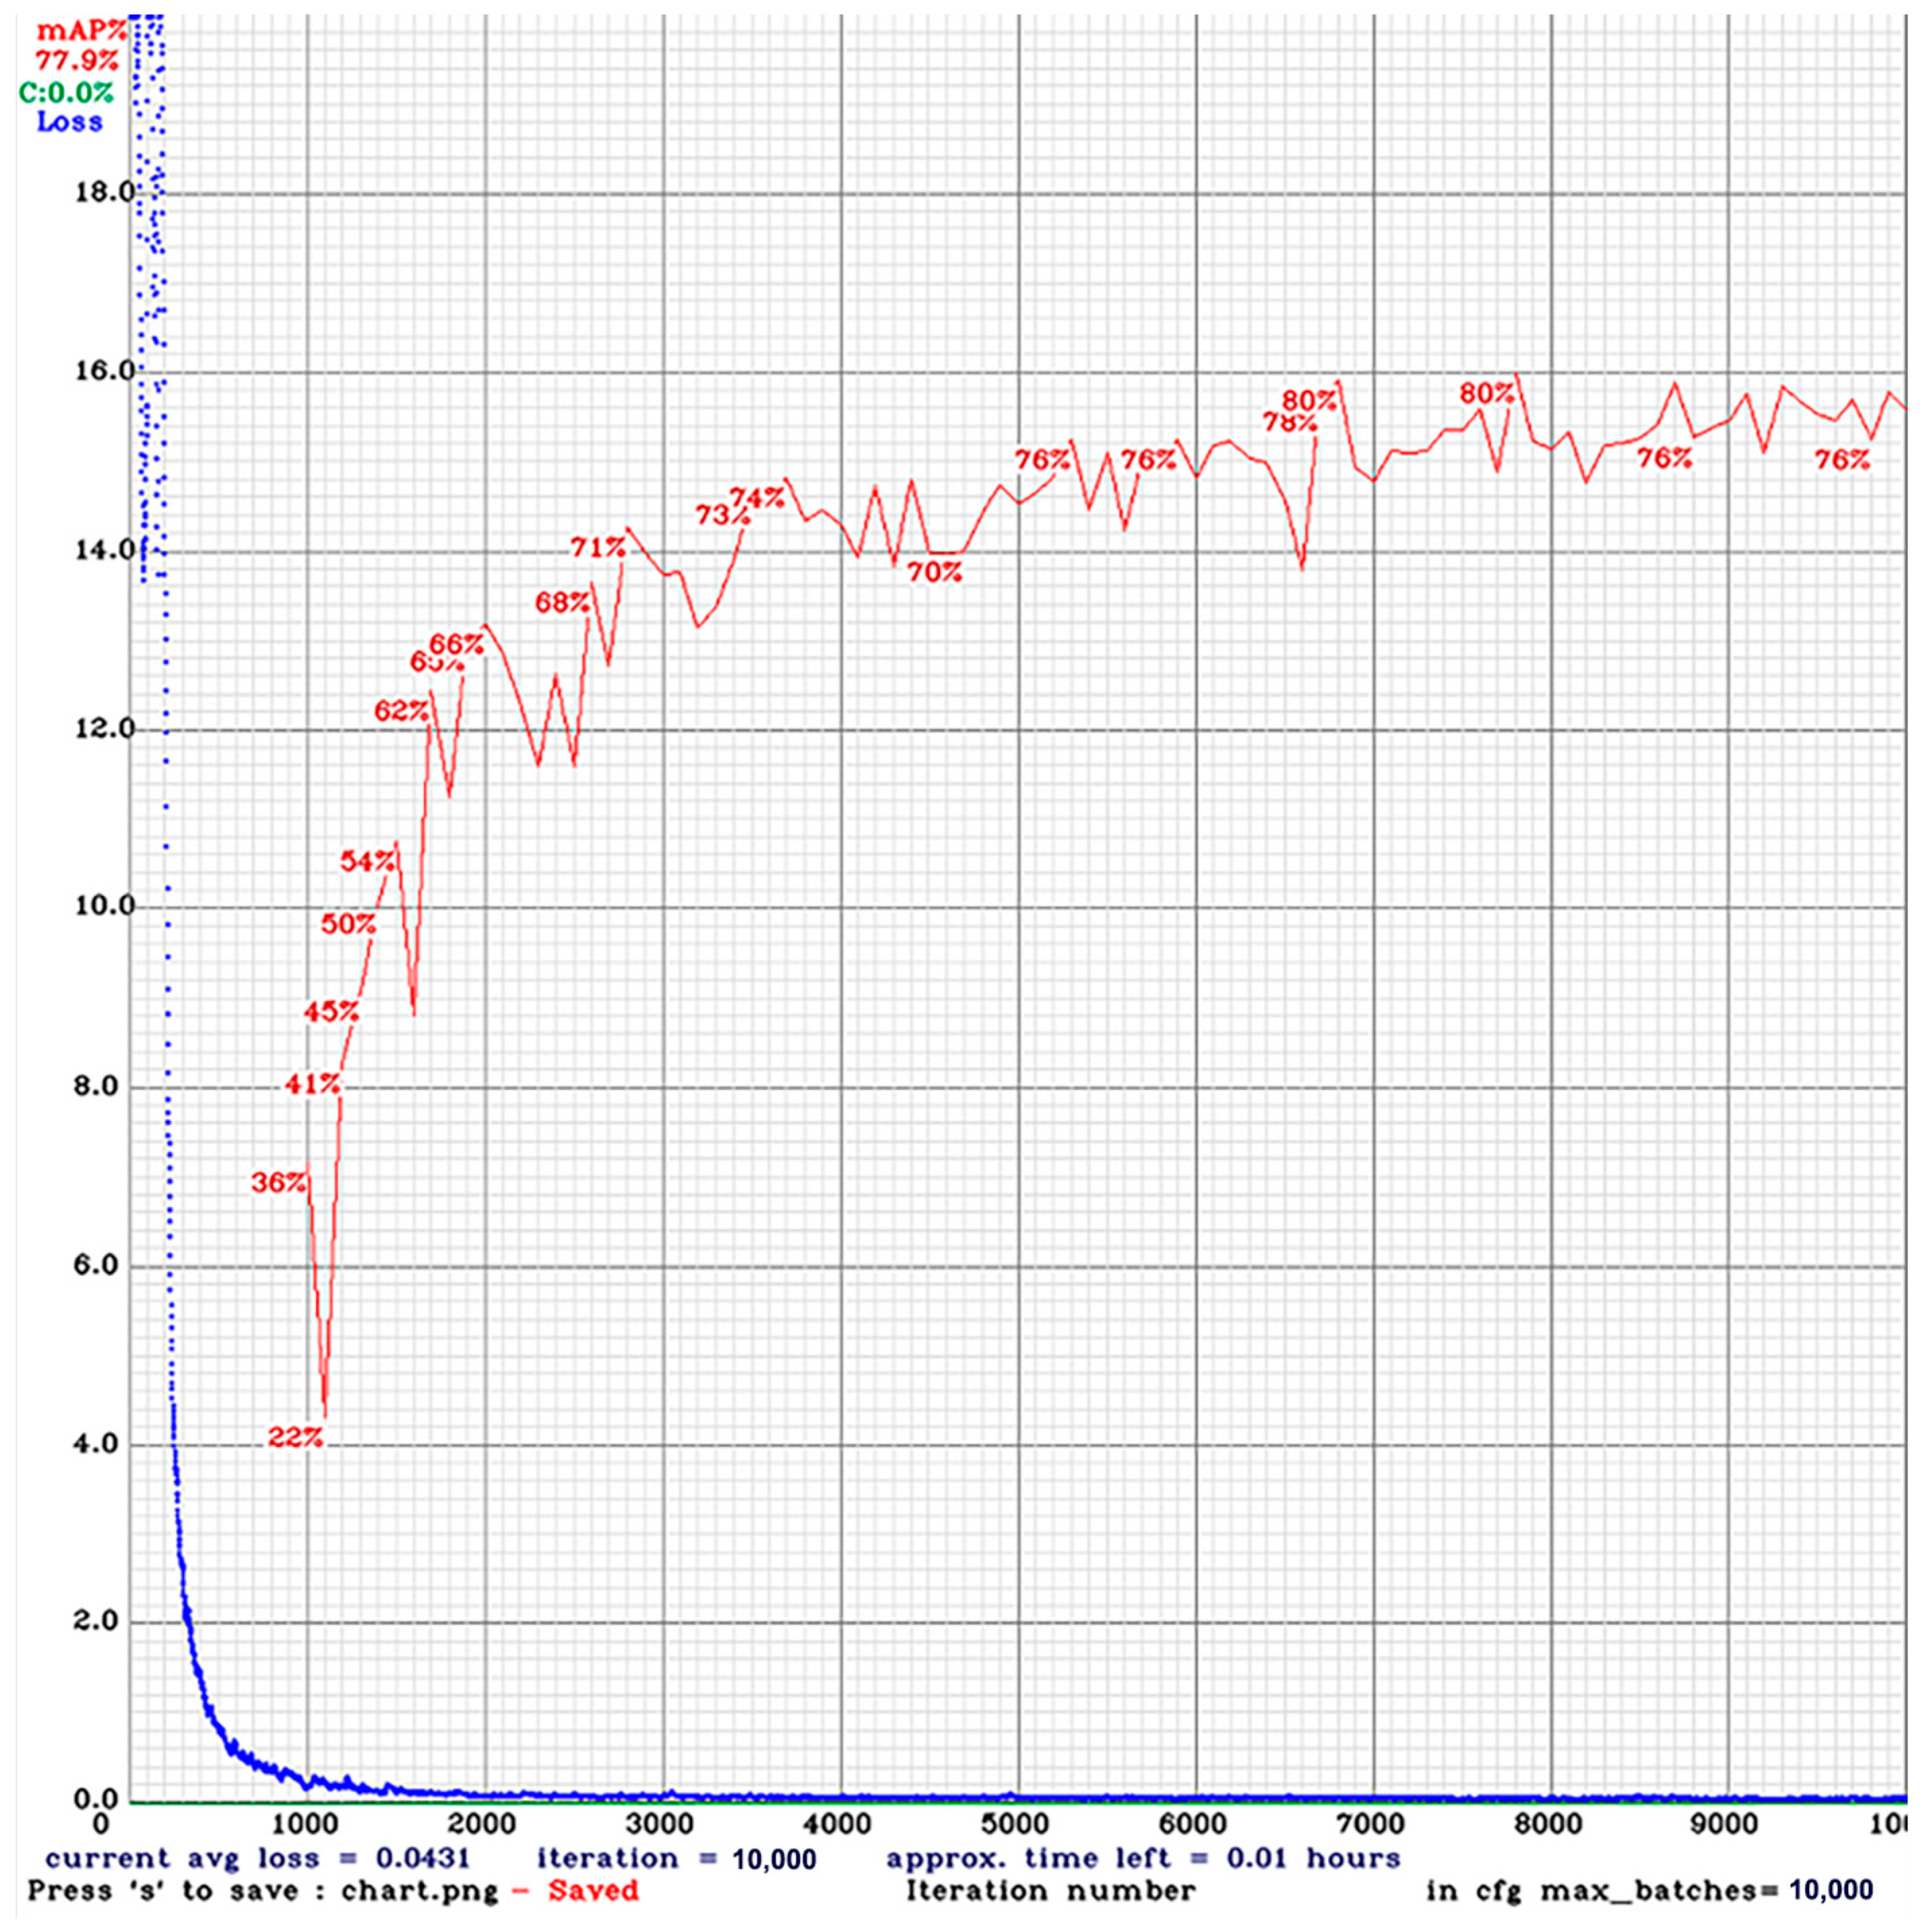
3.2. Training and Results

In the training phase, the algorithm was programmed to produce weights after every 1000 iterations. The model was trained for 10,000 iterations and also programmed to output the best weight at the end of a training period. All nine classes (coffee, spot, chocolate, tomato paste, jam, cream, conditioner, shaving cream, and toothpaste) were trained using transfer learning techniques [37,38].
The backbone model was selected from among the YOLO [30,39,40] tiny networks. The reason for using the tiny backbone was to achieve the desired speed and mAP. Both models were trained by means of a stochastic gradient descent (SGD) approach with a momentum of 0.9 and a weight decay of 0.0005. The learning rate was set to 0.001 and the batch size was 32. Other parameters are mentioned in Table 1. Both models were trained until 10,000 iterations had been completed and took the same training time; the best output weights were used for testing. The training phase was automatically terminated after 10,000 iterations, and both models were then tested using test images that had not been used during training. The achieved mAP was 99.74% using the enhanced model. The default model was able to achieve only 93.21% mAP. The real-time training stage for the enhanced model is shown in Figure 7, while Figure 8 shows the default model training stage. After experimentation with higher and lower thresholds, the threshold was set at 0.7 in the model configuration. The model was able to detect contaminants every time—even incorrect detections—when the threshold was set to less than 0.5; however, it also produced numerous bounding boxes and was unable to precisely localize the object’s correct position. To resolve this problem, we changed the threshold to 0.7. After that, the model was able to precisely recognize and localize each object with a single bounding box. The objective of this project was to accurately detect contaminants and alert the operator. In keeping with this, the model ignored the object every time when the threshold was set higher than 0.7. Therefore, we empirically assessed that 0.7 was an appropriate threshold value for the proposed application and experimental protocol.
The inference time of both models was also calculated and is shown in Figure 9. The enhanced model detected the object in 41.40 ms and the default model detected it in 37.29 ms. These results confirmed that, when enhancing a model more deeply, not just increase mAP but also increase the inference time. The difference between both models’ inference time was only 4.17 ms, which is acceptable because the enhanced model achieved much higher mAP. A laptop equipped with an Nvidia RTX 3060 GPU linked to a camera was used to perform the CNN-based object detection and training. Both models were trained until 10,000 iterations were complete. The training took 1 h and 44 min on a personal gaming laptop (Asus TUF F15), and the best output weights were used for testing. The results achieved after testing are shown in Figure 10. The default version of CNN was unable to effectively extract the features since the layers were inadequate and the model was not deep. However, the enhanced CNN showed marked improvements in object detection. A model with a greater number of layers can enhance the mAP and extract more features from images while only marginally increasing the inference time. Higher mAP is what this research aims to achieve, which is why layer increments and the combination of two activation functions were taken into consideration. The model can accurately recognize objects when the mAP is higher. A comparison of the performance of both models is shown in Table 2 and mAP is shown in Table 3.

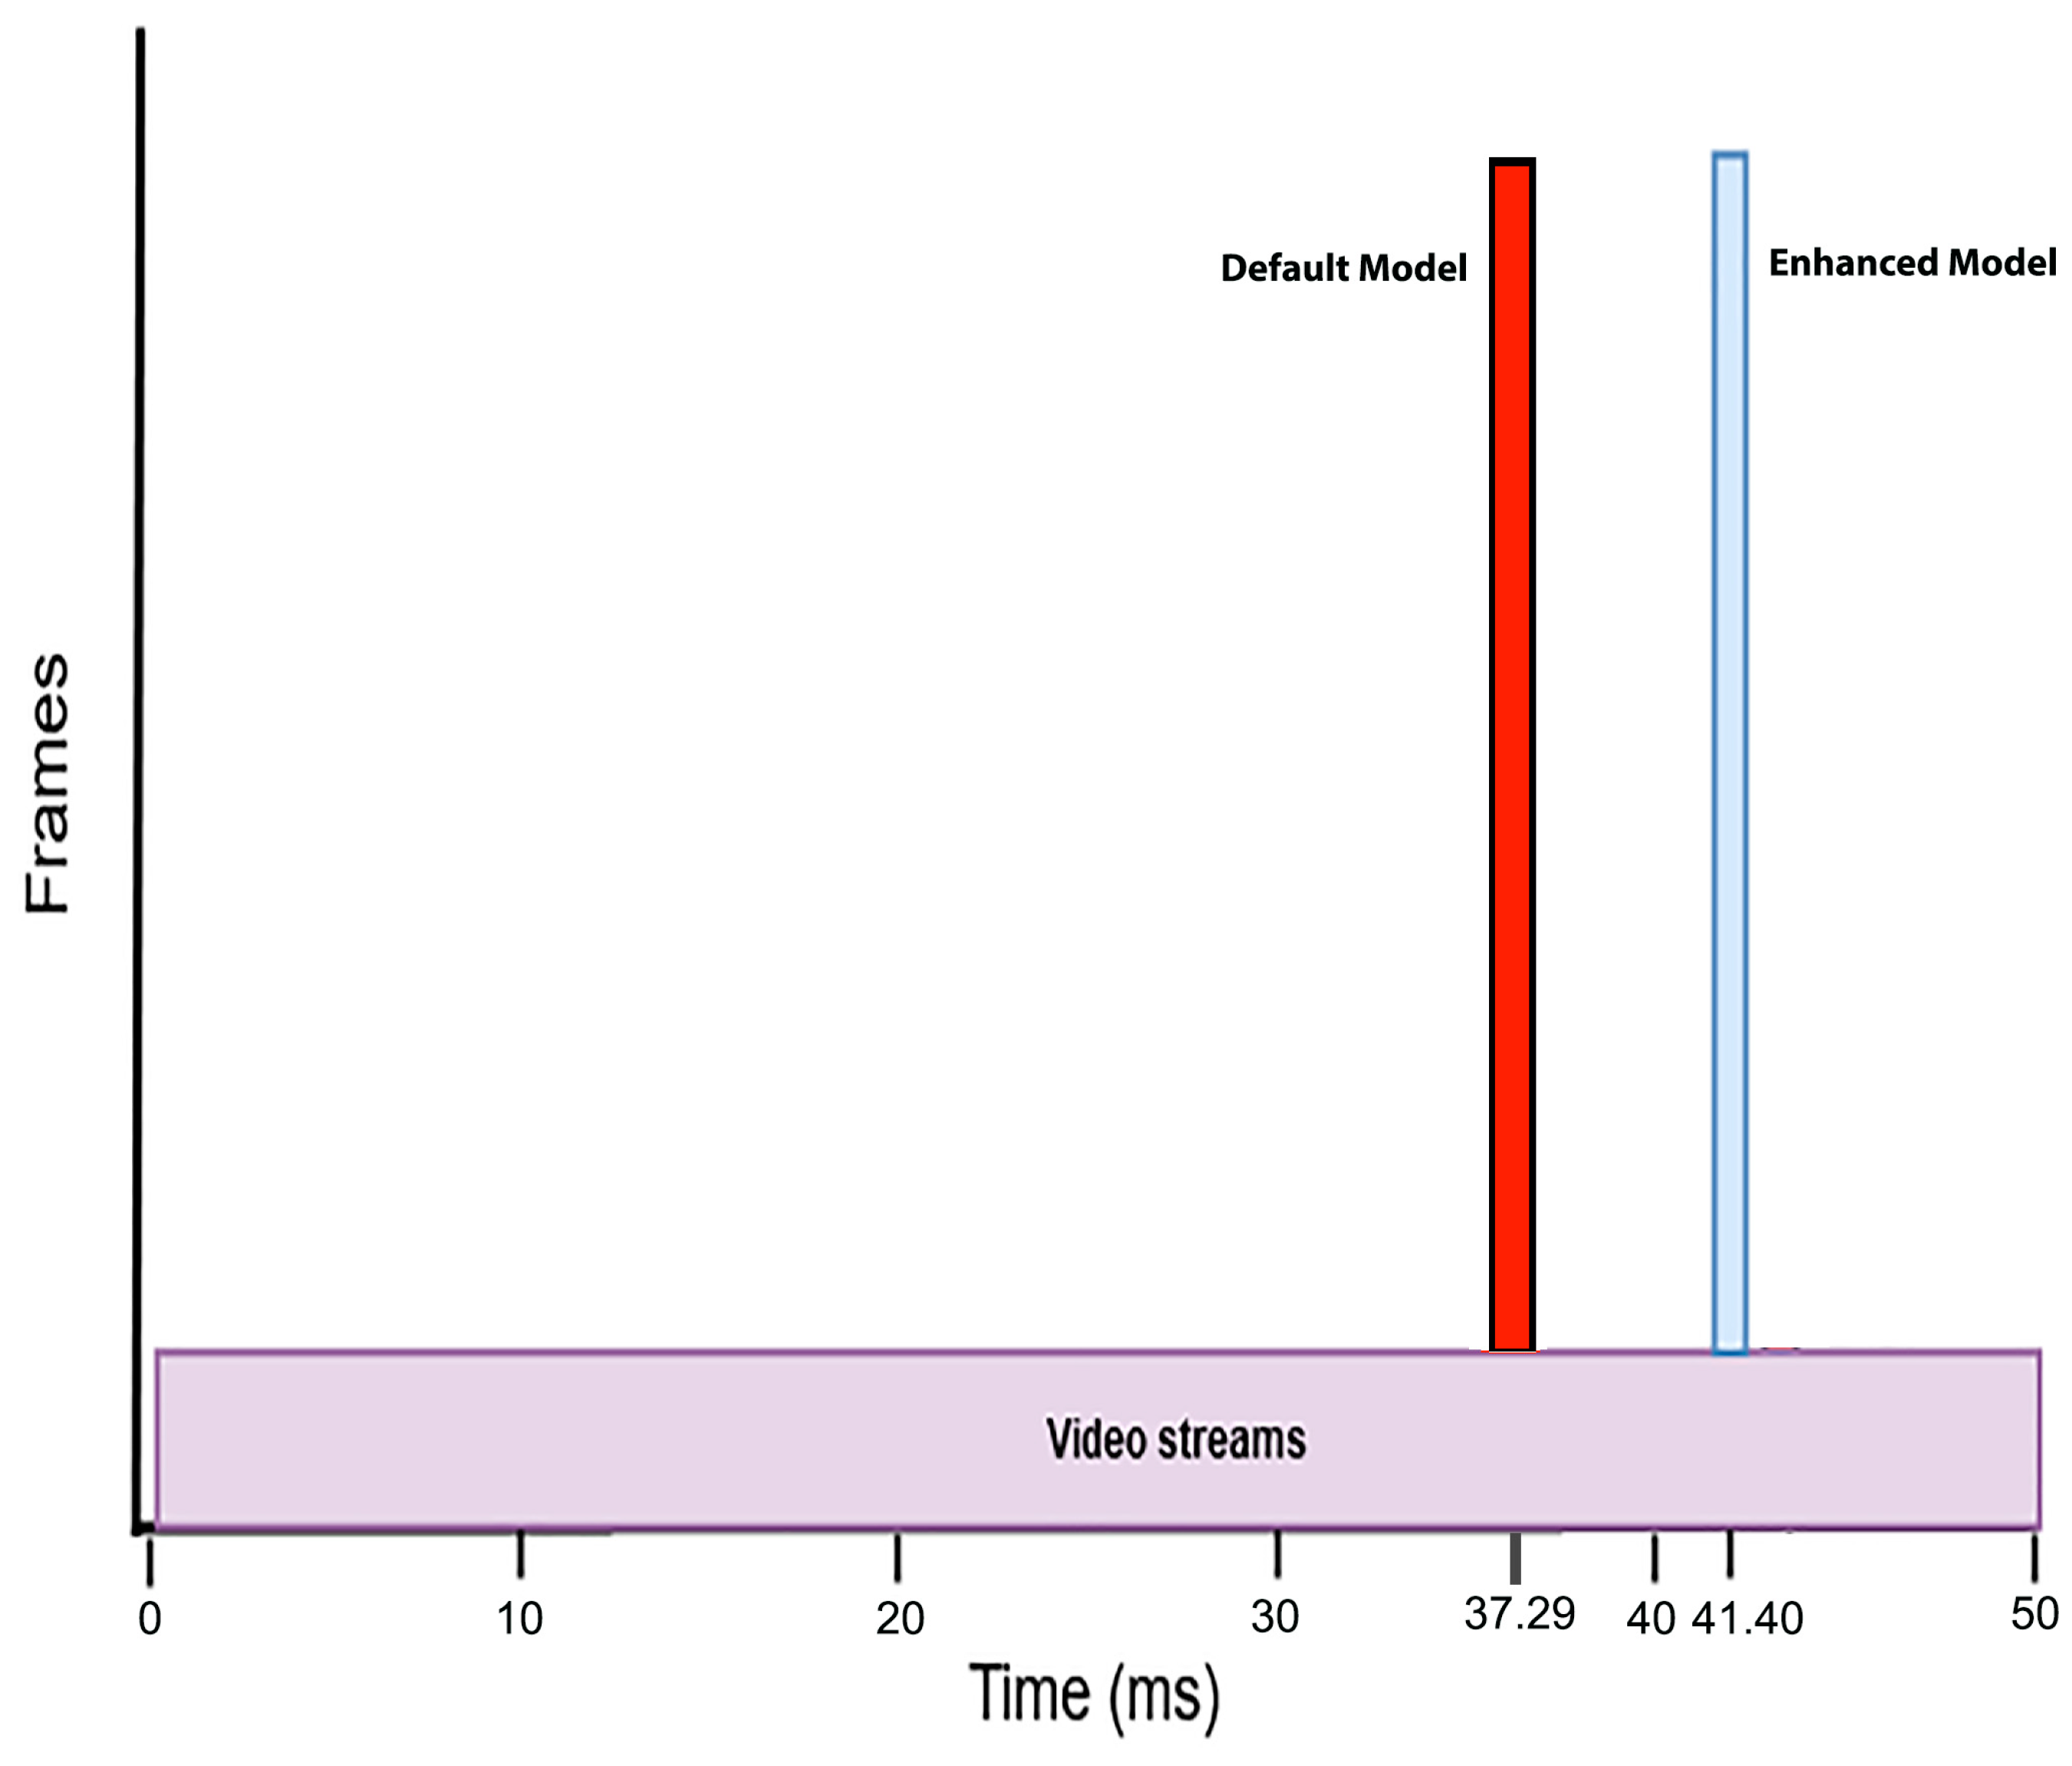
3.3. Performance Metrics for Model Evaluation

To evaluate the performance metrics for recognition of coffee, spot, chocolate, tomato paste, jam, cream, conditioner, shaving cream, and toothpaste, the following significant parameters were used.
True Positive (TP): When the centroid is within the boundaries of the specified objects, it is determined to be a true positive. True positives are considered unique when numerous true output detections take place within a frame.
True Negative (TN): This applies when recognition is negative but not false, indicating that there are no defined objects in the specified frames.
False Positive (FP): The identified centroid in the class’s ground-truth is not categorized in the designated objects.
False Negative (FN): The class’s declared objects are not present in the frame.
The following parameters are used to effectively assess how well an enhanced model performs.
Precision: This is utilized to determine how well the enhanced model can identify the class’s declared objects [41].
P r e c i s i o n   P r e = T P T P + F P × 100
Sensitivity: This metric assesses the proportion of the real class the target object belongs to. It is also called the true positive rate or recall [41].
S e n s i t i v i t y   S e n = T P T P + F N × 100
It is worth noting that sensitivity with respect to the contaminated spots is the most important metric for our predictive approach. Indeed, it is generally a more costly error to mis-identify a stained package as pristine than vice versa. Sensitivity allows us to monitor this aspect of our model. Table 2 shows a general improvement in the sensitivity of eight out of nine of our contaminants.
F2-score and F1-score: Both are determined by the mean of precision and sensitivity within a certain range of [0, 1]. Both of these scores were taken into consideration to maintain precision and sensitivity. Below is the F1-score [41]:
F 1 s c o r e = 2 × S e n × P r e S e n + P r e × 100

3.4. Loss Function

The sum square error loss evaluation is used throughout the object detecting method [42,43]. The CNN end-to-end network is prone to basic addition problems, including coordinate error, classification error and IOU error. The given formula can be utilized to determine the loss function. The loss function is discussed in detail in [44], which includes a summary of different loss functions.
l o s s = i = 0 g 2 c o o r d E r r + i o u E r r + c l s E r r
To obtain the overall loss, the output weight of each loss function is determined. When a prediction error and a continuous coordinate error occur during training, the model flags chaotic action and divergence. As a result, the location error weight value is λ = 5. YOLO assigns no-object for the IOU error to escape confusion between the grids that include objects and those that do not.
l o s s = λ coord   i = 0 g 2 J = 0 B l i j o b j a i a ^ i 2 + b i b ^ i 2 + λ coord   i = 0 g 2 j = 0 n l t j o b j w i w ^ i 2 + h i h ^ i 2 + i = 0 g 2 j = 0 B t i j o b j c i c ^ i 2 + λ noobj   i = 0 g 2 j = 0 B l i j o b j c i c ^ i 2 + i = 0 g 2 l i obj   c     class   R i c R ^ i c 2
In Equation (6) [44] above, B is utilized to indicate every number of cells associated with the prediction boxes, and g is utilized to indicate the number of grids. The coordinate origin of each cell is indicated using the symbols (a, b). Moreover, its height and width are denoted by the letters w and h, respectively. The detection confidence is denoted as c, and the object confidence is labeled using R. The λcoord is utilized to show the weight of the loss function place. λnoobj shows the classification weight of loss function. If an object from the class that has been trained is available, the value of cell is set to one; otherwise, it is zero.

4. Conclusions

The coffee, spot, chocolate, tomato paste, jam, cream, conditioner, shaving cream, and toothpaste classes were detected by implementing the reported CNN architecture with safe human–robot collaboration using a proximity sensor on a mechatronic platform. Results were compared with the default CNN architecture. The purpose of this work was to achieve high-quality inspection to reveal contamination of packaged products with quick and automated instruments. Future work may focus on adding more contamination classes to develop a more complete and enhanced contamination detection system. Also, the algorithm could be implemented in a real robot with a conveyor belt to create an industrial setup for quality inspection.

Author Contributions

Conceptualization, S.A.H., M.A.K. and C.M.O.; methodology, S.A.H., F.A., M.F., A.M. and C.M.O.; formal analysis, D.C., M.A.K. and S.A.H.; investigation, S.A.H. and M.A.K.; dataset creation, S.A.H.; writing—review and editing, S.A.H. and C.M.O.; supervision, C.M.O. All authors have read and agreed to the published version of the manuscript.

Funding

This project has received funding from the European Union’s Horizon 2020 research and innovation program under the Marie Sklodowska-Curie grant agreement No. 956745 (European Training Network for InduStry Digital Transformation across Innovation Ecosystems—EINST4INE). Results reflect the authors’ views only. The European Commission is not responsible for any use that may be made of the information this paper contains.

Institutional Review Board Statement

Not Applicable.

Data Availability Statement

The data presented in this study are available on request from the corresponding authors.

Conflicts of Interest

The authors declare no conflict of interest.

References

  1. Malamas, E.N.; Petrakis, E.G.M.; Zervakis, M.; Petit, L.; Legat, J.-D. A survey on industrial vision systems, applications and tools. Image Vis. Comput. 2003, 21, 171–188. [Google Scholar] [CrossRef]
  2. Jiang, J.; Cao, P.; Lu, Z.; Lou, W.; Yang, Y. Surface defect detection for mobile phone back glass based on symmetric convolutional neural network deep learning. Appl. Sci. 2020, 10, 3621. [Google Scholar] [CrossRef]
  3. Darwish, A.; Ricci, M.; Zidane, F.; Vasquez, J.A.; Casu, M.R.; Lanteri, J.; Migliaccio, C.; Vipiana, F. Physical contamination detection in food Industry using microwave and machine learning. Electronics 2022, 11, 3115. [Google Scholar] [CrossRef]
  4. Coulthard, M.A. Image processing for automatic surface defect detection. In Proceedings of the Third International Conference on Image Processing and its Applications, Warwick, UK, 18–20 July 1989; pp. 192–196. [Google Scholar]
  5. Zhu, L.; Spachos, P.; Pensini, E.; Plataniotis, K.N. Deep learning and machine vision for food processing: A survey. Curr. Res. Food Sci. 2021, 4, 233–249. [Google Scholar] [CrossRef]
  6. Weiss, K.; Khoshgoftaar, T.M.; Wang, D. A survey of transfer learning. J. Big Data 2016, 3, 1–40. [Google Scholar] [CrossRef]
  7. Park, J.-K.; Kwon, B.-K.; Park, J.-H.; Kang, D.-J. Machine learning-based imaging system for surface defect inspection. Int. J. Precis. Eng. Manuf. Technol. 2016, 3, 303–310. [Google Scholar] [CrossRef]
  8. Albawi, S.; Mohammed, T.A.; Al-Zawi, S. Understanding of a convolutional neural network. In Proceedings of the 2017 International Conference On Engineering and Technology (ICET), Antalya, Turkey, 21–23 August 2017; pp. 1–6. [Google Scholar]
  9. LeCun, Y.; Bottou, L.; Bengio, Y.; Haffner, P. Gradient-based learning applied to document recognition. Proc. IEEE 1998, 86, 2278–2324. [Google Scholar] [CrossRef]
  10. Kim, P.; Kim, P. MATLAB Deep Learning with Machine Learning Neural Networks Artificial Intelligence. In Convolutional Neural Network; Springer: Berlin/Heidelberg, Germany, 2017; pp. 121–147. [Google Scholar]
  11. Ciregan, D.; Meier, U.; Schmidhuber, J. Multi-column deep neural networks for image classification. In Proceedings of the 2012 IEEE Conference on Computer Vision and Pattern Recognition, Providence, RI, USA, 16–21 June 2012; pp. 3642–3649. [Google Scholar]
  12. Krichen, M. Convolutional Neural Networks: A Survey. Computers 2023, 12, 151. [Google Scholar] [CrossRef]
  13. Alahmari, F.; Naim, A.; Alqahtani, H. E-Learning Modeling Technique and Convolution Neural Networks in Online Education. In IoT-Enabled Convolutional Neural Networks: Techniques and Applications; River Publishers: Aalborg, Denmark, 2023; pp. 261–295. [Google Scholar]
  14. Zhou, L.; Zhang, C.; Liu, F.; Qiu, Z.; He, Y. Application of deep learning in food: A review. Compr. Rev. Food Sci. Food Saf. 2019, 18, 1793–1811. [Google Scholar] [CrossRef]
  15. Vaddi, R.; Manoharan, P. Hyperspectral image classification using CNN with spectral and spatial features integration. Infrared Phys. Technol. 2020, 107, 103296. [Google Scholar] [CrossRef]
  16. Ng, W.; Minasny, B.; McBratney, A. Convolutional neural network for soil microplastic contamination screening using infrared spectroscopy. Sci. Total Environ. 2020, 702, 134723. [Google Scholar] [CrossRef] [PubMed]
  17. Andri, R.; Cavigelli, L.; Rossi, D.; Benini, L. YodaNN: An ultra-low power convolutional neural network accelerator based on binary weights. In Proceedings of the 2016 IEEE Computer Society Annual Symposium on VLSI (ISVLSI), Pittsburgh, PA, USA, 11–13 July 2016; pp. 236–241. [Google Scholar]
  18. Yepeng, Z.; Yuezhen, T.; Zhiyong, F. Application of digital image process technology to the mouth of beer bottle defect inspection. In Proceedings of the 2007 8th International Conference on Electronic Measurement and Instruments, Xi’an, China, 16–18 August 2007; pp. 2–905. [Google Scholar]
  19. Shah, S.S.A.; Khalil, M.A.; Shah, S.I.; Khan, U.S. Ball Detection and Tracking Through Image Processing Using Embedded Systems. In Proceedings of the 2018 IEEE 21st International Multi-Topic Conference (INMIC), Karachi, Pakistan, 1–2 November 2018; pp. 1–5. [Google Scholar]
  20. Hassan, S.-A.; Rahim, T.; Shin, S.-Y. An Improved Deep Convolutional Neural Network-Based Autonomous Road Inspection Scheme Using Unmanned Aerial Vehicles. Electronics 2021, 10, 2764. [Google Scholar] [CrossRef]
  21. Gopalakrishnan, K.; Khaitan, S.K.; Choudhary, A.; Agrawal, A. Deep convolutional neural networks with transfer learning for computer vision-based data-driven pavement distress detection. Constr. Build. Mater. 2017, 157, 322–330. [Google Scholar] [CrossRef]
  22. Raza, K.; Song, H. Fast and accurate fish detection design with improved YOLO-v3 model and transfer learning. Int. J. Adv. Comput. Sci. Appl. 2020, 11, 2. [Google Scholar] [CrossRef]
  23. Liu, Y.; Zhang, X.; Gao, Y.; Qu, T.; Shi, Y. Improved CNN method for crop pest identification based on transfer learning. Comput. Intell. Neurosci. 2022, 2022. [Google Scholar] [CrossRef]
  24. He, K.; Gkioxari, G. Mask r-cnn. In Proceedings of the IEEE International Conference on Computer Vision, Venice, Italy, 22–29 October 2017; pp. 2961–2969. [Google Scholar]
  25. Sharma, A.K.; Foroosh, H. Slim-cnn: A light-weight cnn for face attribute prediction. In Proceedings of the 2020 15th IEEE International Conference on Automatic Face and Gesture Recognition (FG 2020), Buenos Aires, Argentina, 16–20 November 2020; pp. 329–335. [Google Scholar]
  26. Misra, D. Mish: A Self Regularized Non-Monotonic Activation Function. 2019. Available online: https//www.bmvc2020-conference.com/assets/papers/0928.pdf (accessed on 30 July 2023).
  27. Wittenberg, C. Human-CPS Interaction-requirements and human-machine interaction methods for the Industry 4.0. IFAC-PapersOnLine 2016, 19, 420–425. [Google Scholar] [CrossRef]
  28. Gambao, E.; Hernando, M.; Surdilovic, D. A new generation of collaborative robots for material handling. In Proceedings of the ISARC, International Symposium on Automation and Robotics in Construction; IAARC Publications: Eindhoven, Netherlands, 2012; p. 1. [Google Scholar]
  29. Krüger, J.; Lien, T.K.; Verl, A. Cooperation of human and machines in assembly lines. CIRP Ann. 2009, 58, 628–646. [Google Scholar] [CrossRef]
  30. Redmon, J.; Divvala, S.; Girshick, R.; Farhadi, A. You only look once: Unified, real-time object detection. In Proceedings of the IEEE Conference on Computer Vision and Pattern Recognition, Las Vegas, NV, USA, 26 June–1 July 2016; pp. 779–788. [Google Scholar]
  31. Ramachandran, P.; Zoph, B.; Le, Q.V. Swish: A self-gated activation function. arXiv 2017, arXiv:1710.059415. [Google Scholar]
  32. Kabir, S.; Sakib, S.; Hossain, M.A.; Islam, S.; Hossain, M.I. A convolutional neural network based model with improved activation function and optimizer for effective intrusion detection and classification. In Proceedings of the 2021 International Conference on Advance Computing and Innovative Technologies in Engineering (ICACITE), Greater Noida, India, 4–5 March 2021; pp. 373–378. [Google Scholar]
  33. Pattanaik, A.; Balabantaray, R.C. Enhancement of license plate recognition performance using Xception with Mish activation function. Multimed. Tools Appl. 2023, 82, 16793–16815. [Google Scholar] [CrossRef]
  34. Rasamoelina, A.D.; Adjailia, F.; Sinčák, P. A review of activation function for artificial neural network. In Proceedings of the 2020 IEEE 18th World Symposium on Applied Machine Intelligence and Informatics (SAMI), Herlany, Slovakia, 23–25 January 2020; pp. 281–286. [Google Scholar]
  35. Kumar, R. APTx: Better activation function than MISH, SWISH, and ReLU’s variants used in deep learning. arXiv 2023, arXiv:2209.06119. [Google Scholar] [CrossRef]
  36. He, K.; Zhang, X.; Ren, S.; Sun, J. Deep residual learning for image recognition. In Proceedings of the IEEE Conference on Computer Vision and Pattern Recognition, Las Vegas, NV, USA, 26 June–1 July 2016; pp. 770–778. [Google Scholar]
  37. Montalbo, F.J.P. A computer-aided diagnosis of brain tumors using a fine-tuned YOLO-based model with transfer learning. KSII Trans. Internet Inf. Syst. 2020, 14, 4816–4834. [Google Scholar]
  38. Wei, Y.; Liu, X. Dangerous goods detection based on transfer learning in X-ray images. Neural Comput. Appl. 2020, 32, 8711–8724. [Google Scholar] [CrossRef]
  39. Zhang, S.; Wu, Y.; Men, C.; Li, X. Tiny YOLO optimization oriented bus passenger object detection. Chinese J. Electron. 2020, 29, 132–138. [Google Scholar] [CrossRef]
  40. Adarsh, P.; Rathi, P.; Kumar, M. YOLO v3-Tiny: Object Detection and Recognition using one stage improved model. In Proceedings of the 2020 6th International Conference on Advanced Computing and Communication Systems (ICACCS), Coimbatore, India, 6–7 March 2020; pp. 687–694. [Google Scholar]
  41. Rahim, T.; Hassan, S.A.; Shin, S.Y. A deep convolutional neural network for the detection of polyps in colonoscopy images. Biomed. Signal Process. Control 2021, 68, 102654. [Google Scholar] [CrossRef]
  42. Ranjbar, M.; Lan, T.; Wang, Y.; Robinovitch, S.N.; Li, Z.-N.; Mori, G. Optimizing nondecomposable loss functions in structured prediction. IEEE Trans. Pattern Anal. Mach. Intell. 2012, 35, 911–924. [Google Scholar] [CrossRef] [PubMed]
  43. Jiang, P.; Ergu, D.; Liu, F.; Cai, Y.; Ma, B. A Review of Yolo algorithm developments. Procedia Comput. Sci. 2022, 199, 1066–1073. [Google Scholar] [CrossRef]
  44. Wang, Q.; Ma, Y.; Zhao, K.; Tian, Y. A comprehensive survey of loss functions in machine learning. Ann. Data Sci. 2020, 1–26. [Google Scholar] [CrossRef]
Figure 1. Block scheme of the experimental setup.
Electronics 12 04260 g001
Figure 2. Flowchart of the detection model.
Electronics 12 04260 g002
Figure 3. Flowchart of the human safety algorithm.
Electronics 12 04260 g003
Figure 4. Architecture of the default CNN model.
Electronics 12 04260 g004
Figure 5. Architecture of the enhanced CNN model.
Electronics 12 04260 g005
Figure 6. Mish activation function [20].
Electronics 12 04260 g006
Figure 7. Real-time enhanced CNN model training stage.
Electronics 12 04260 g007
Figure 8. Real-time CNN model training stage.
Electronics 12 04260 g008
Figure 9. Inference time comparison of both models.
Electronics 12 04260 g009
Figure 10. Experimental trials of real-time detection using the reported CNN.
Electronics 12 04260 g010
Table 1. The parameters utilized in both models.
ParametersValues
Learning rate0.001
OptimizerSGD
Batch size32
Subdivisions4
Input dimension416 × 416
Exposure1.5
Saturation1.5
Channels3
Hue0.1
Momentum0.9
Decay0.0005
Table 2. Comparison of the default and enhanced models’ detection performance.
Performance Metrics
Default Model (%)Enhanced Model (%)
Pre100Pre56.34
Shaving FoamSen95.77Sen79.06
Pre63.7Pre97.45
Spot.Sen58.95Sen86.46
Pre100Pre96.77
Tomato PasteSen62.83Sen83.33
Pre100Pre100
ChocolateSen.56.6Sen80
Pre92.1Pre100
CoffeeSen70.1Sen88.53
Pre100Pre97.1
ConditionerSen55.6Sen78.82
Pre98.83Pre96.51
CreamSen60.71Sen82.17
Pre95.29Pre98.79
JamSen59.55Sen82
Pre97.53Pre100
ToothpasteSen58.95Sen81.81
Table 3. Results comparison of both CNN models.
ModelmAP%F1-Score%sAverage Recall%
Default Model93.2193.0094.00
Enhanced Model99.7498.0098.00
Disclaimer/Publisher’s Note: The statements, opinions and data contained in all publications are solely those of the individual author(s) and contributor(s) and not of MDPI and/or the editor(s). MDPI and/or the editor(s) disclaim responsibility for any injury to people or property resulting from any ideas, methods, instructions or products referred to in the content.

