Optimal Design of a Hybrid Power System for a Remote Fishpond Based on Hydro-Turbine Performance Parameters


Abstract
:1. Introduction
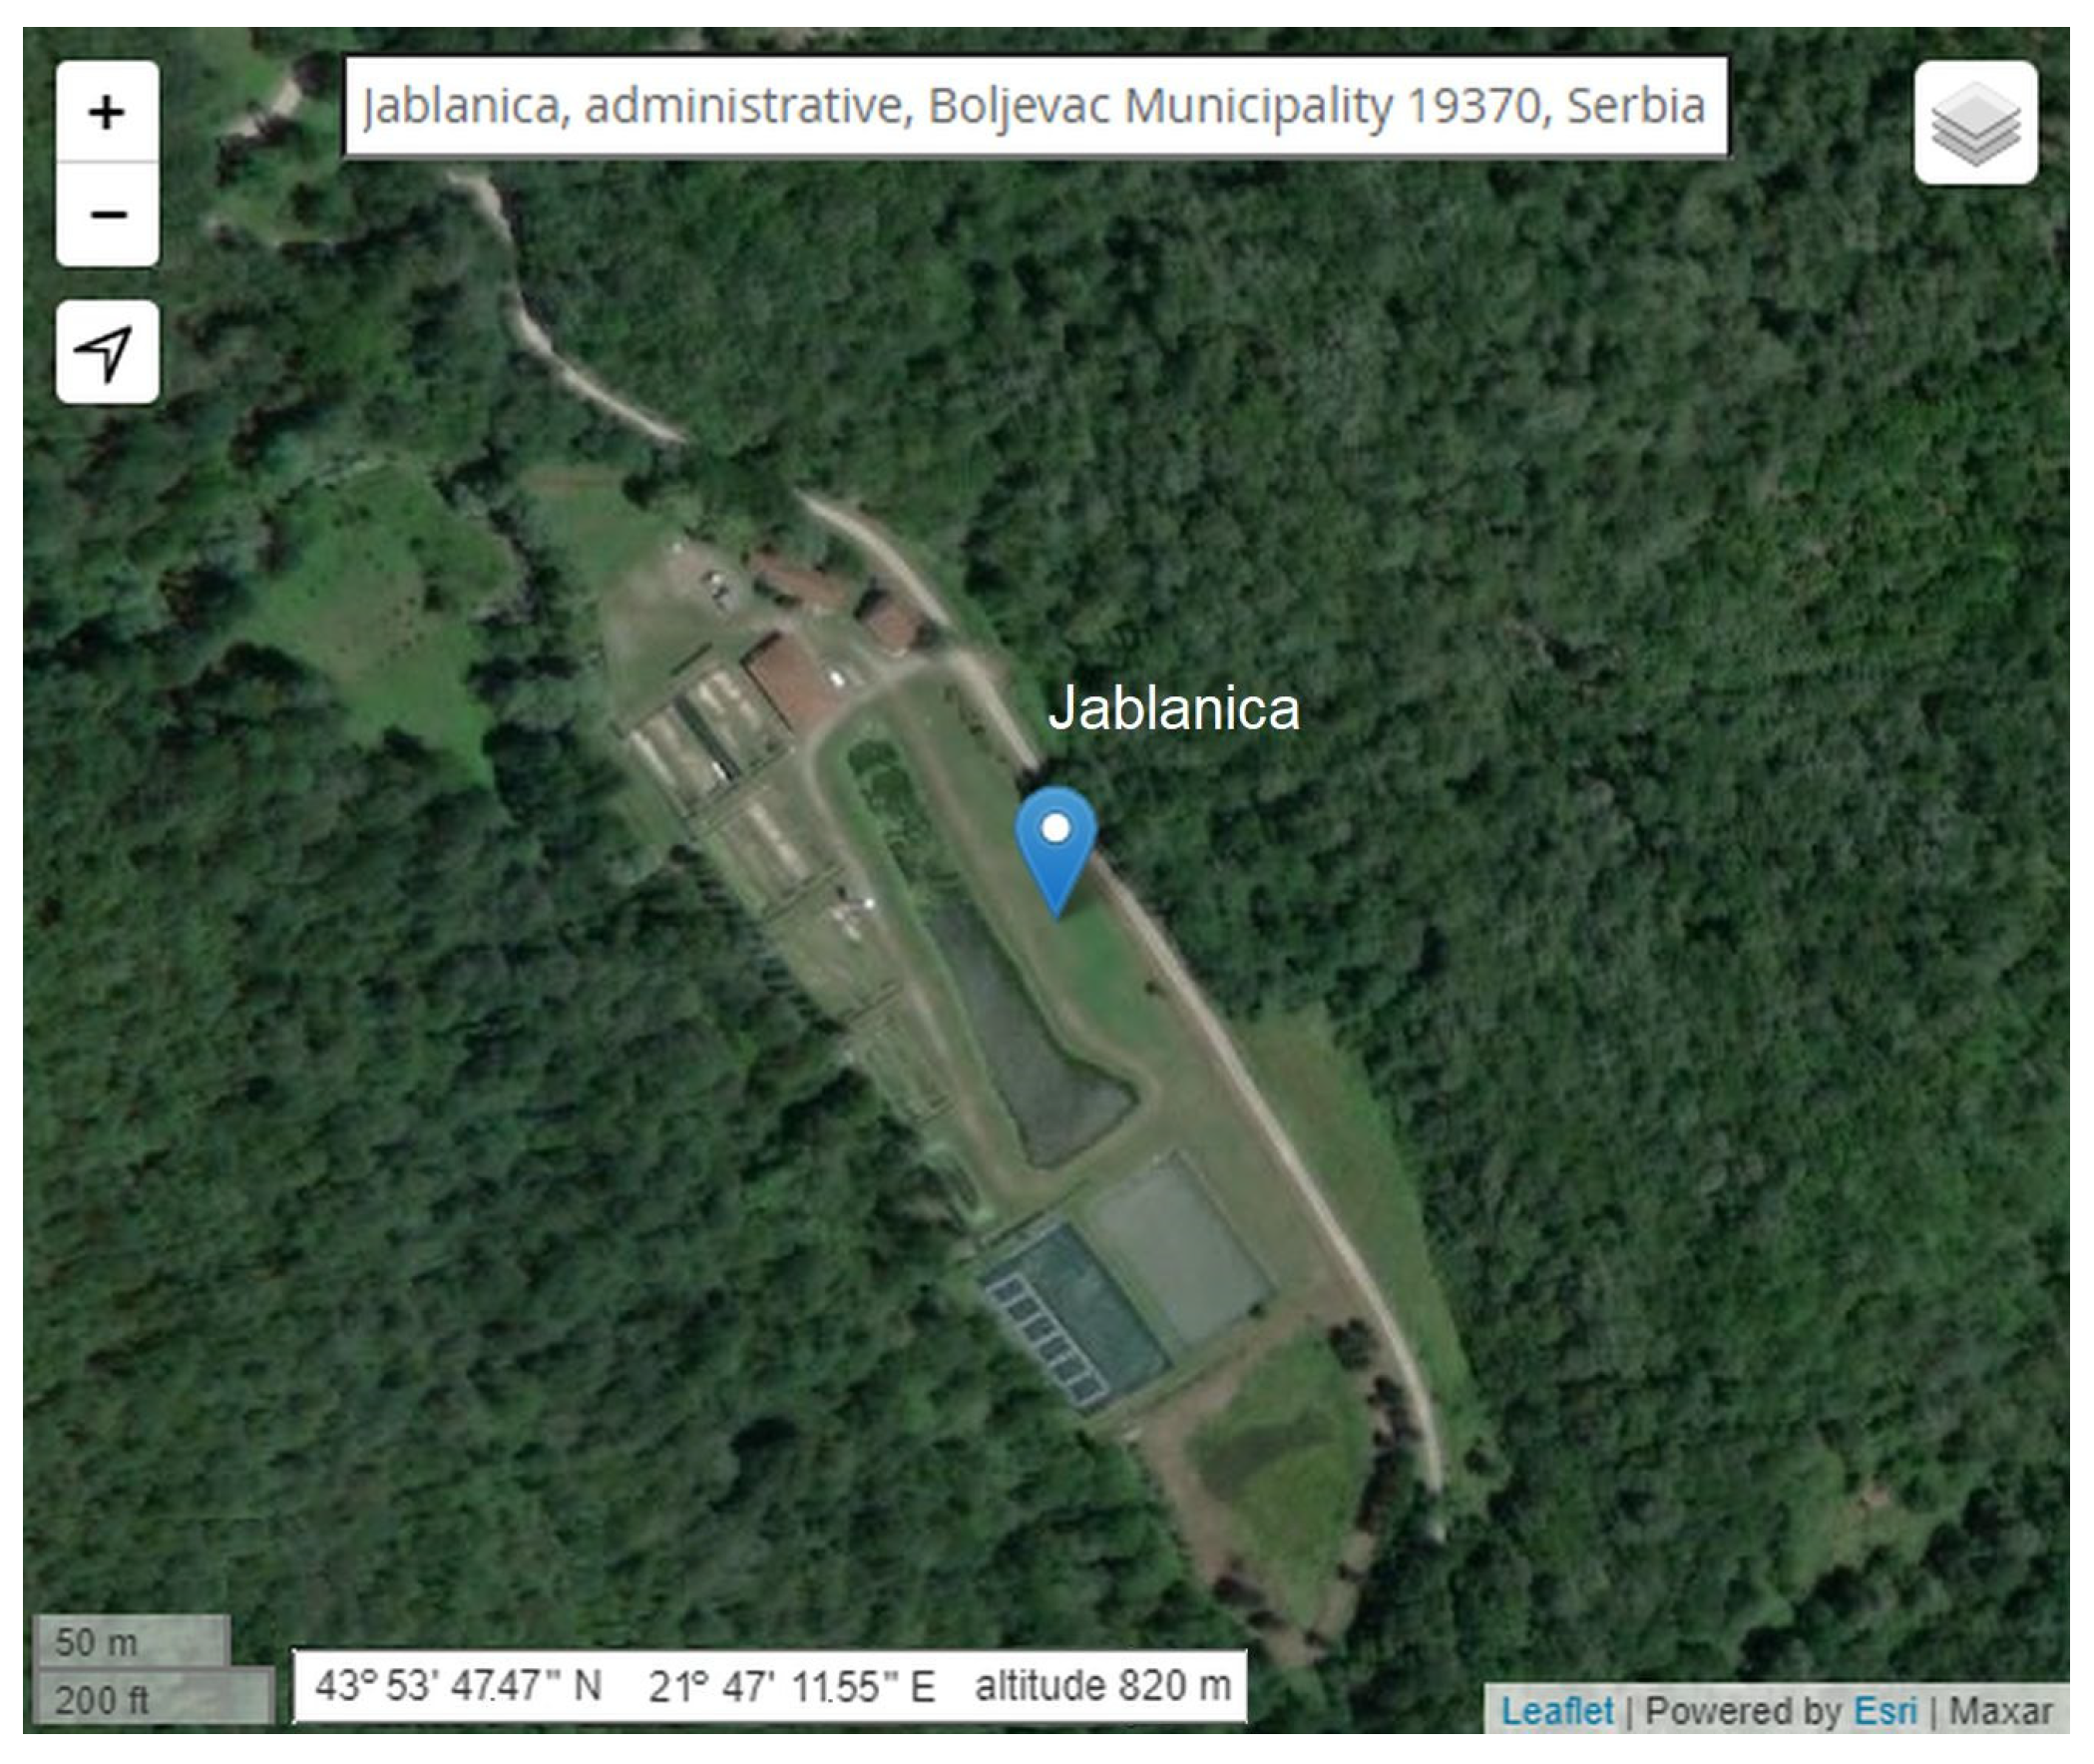
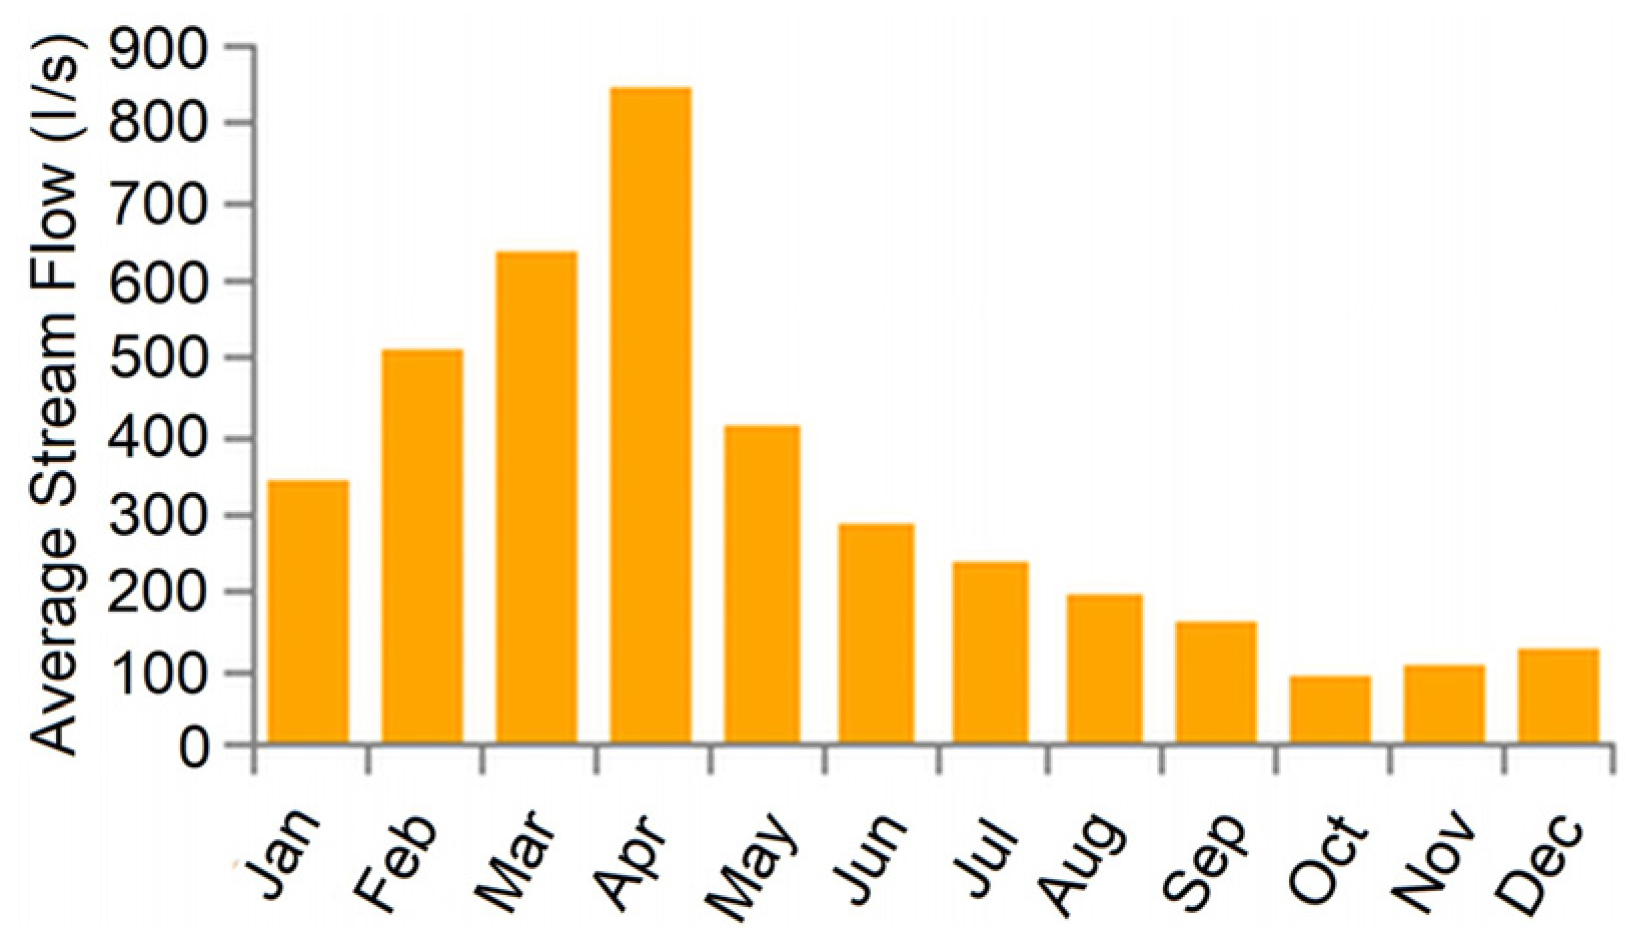
2. Energy Resources of the Trout Pond of Jablanica
3. Techno-Economic Analysis
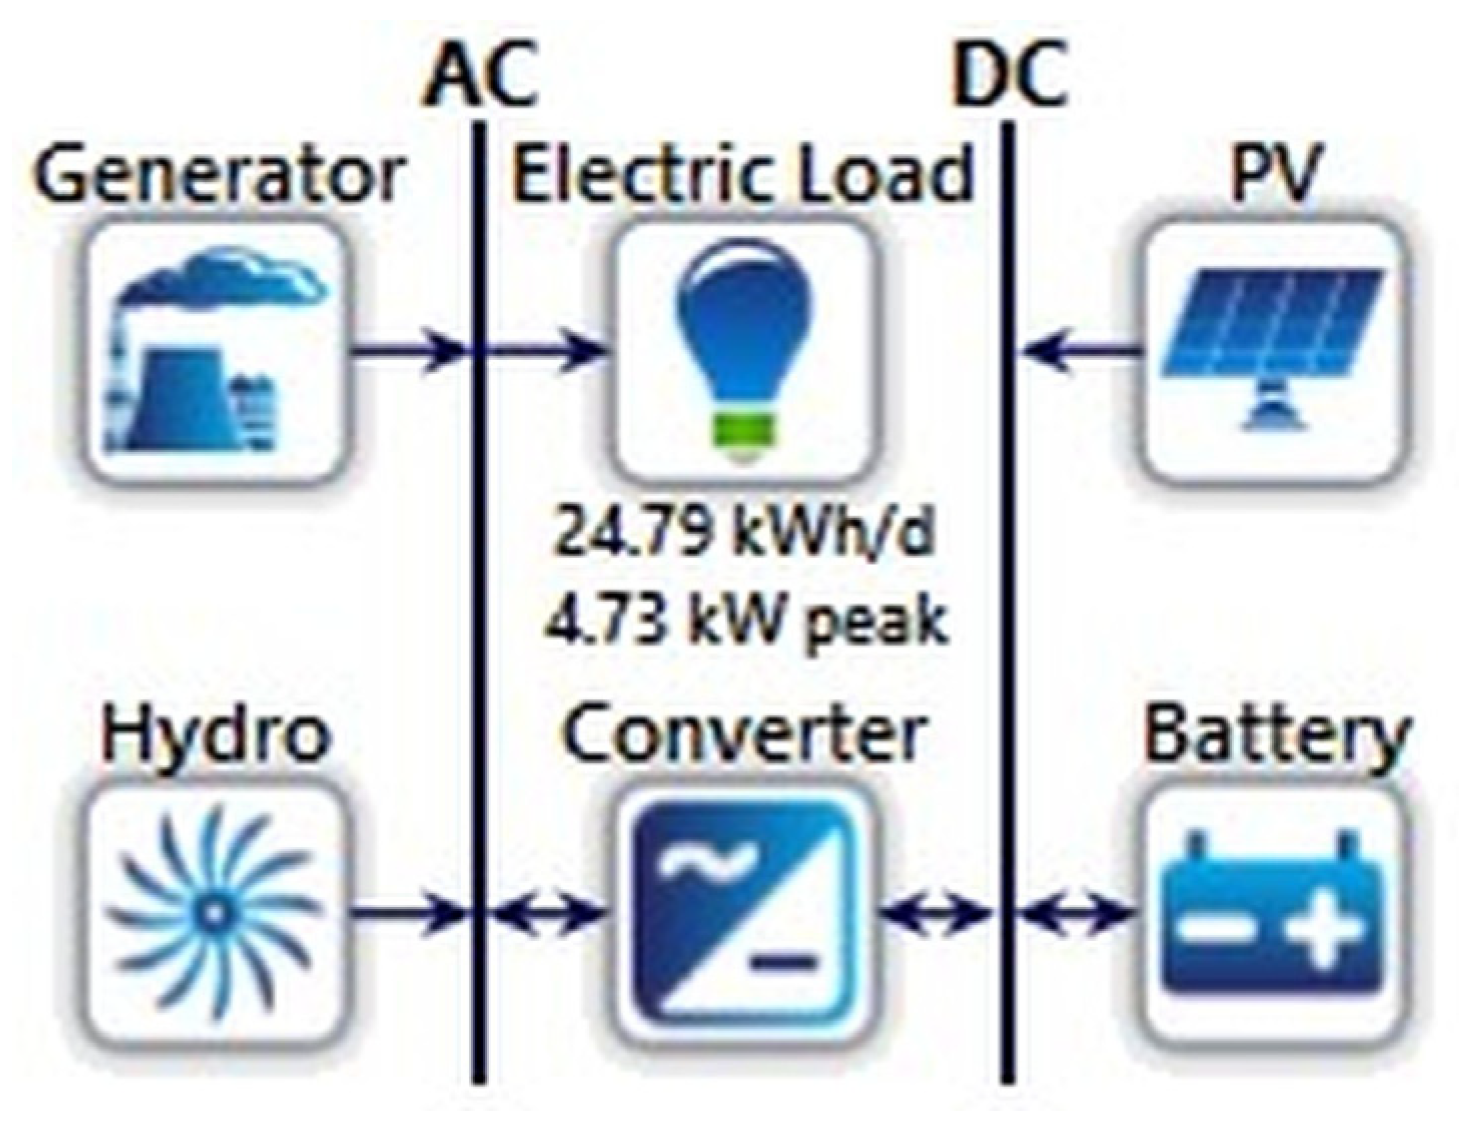
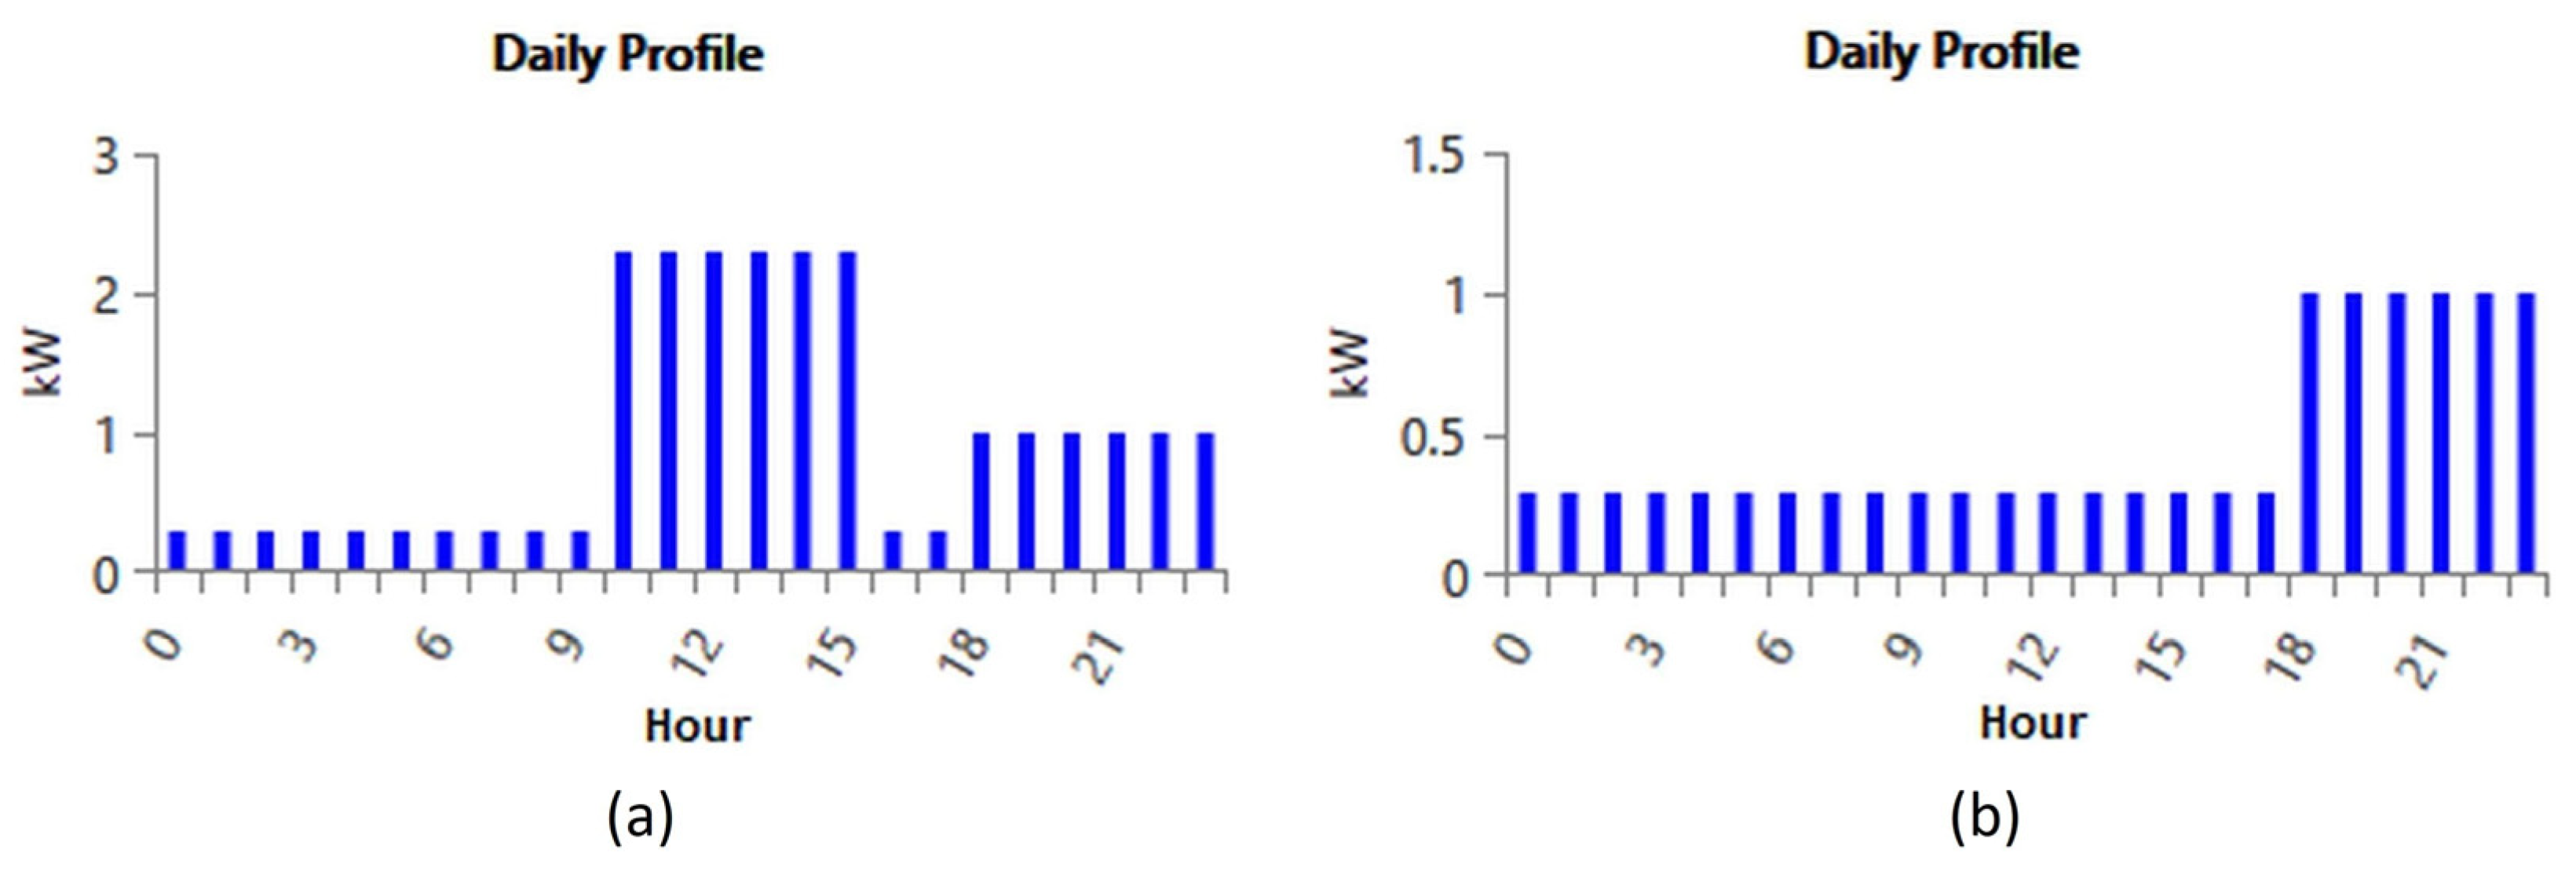
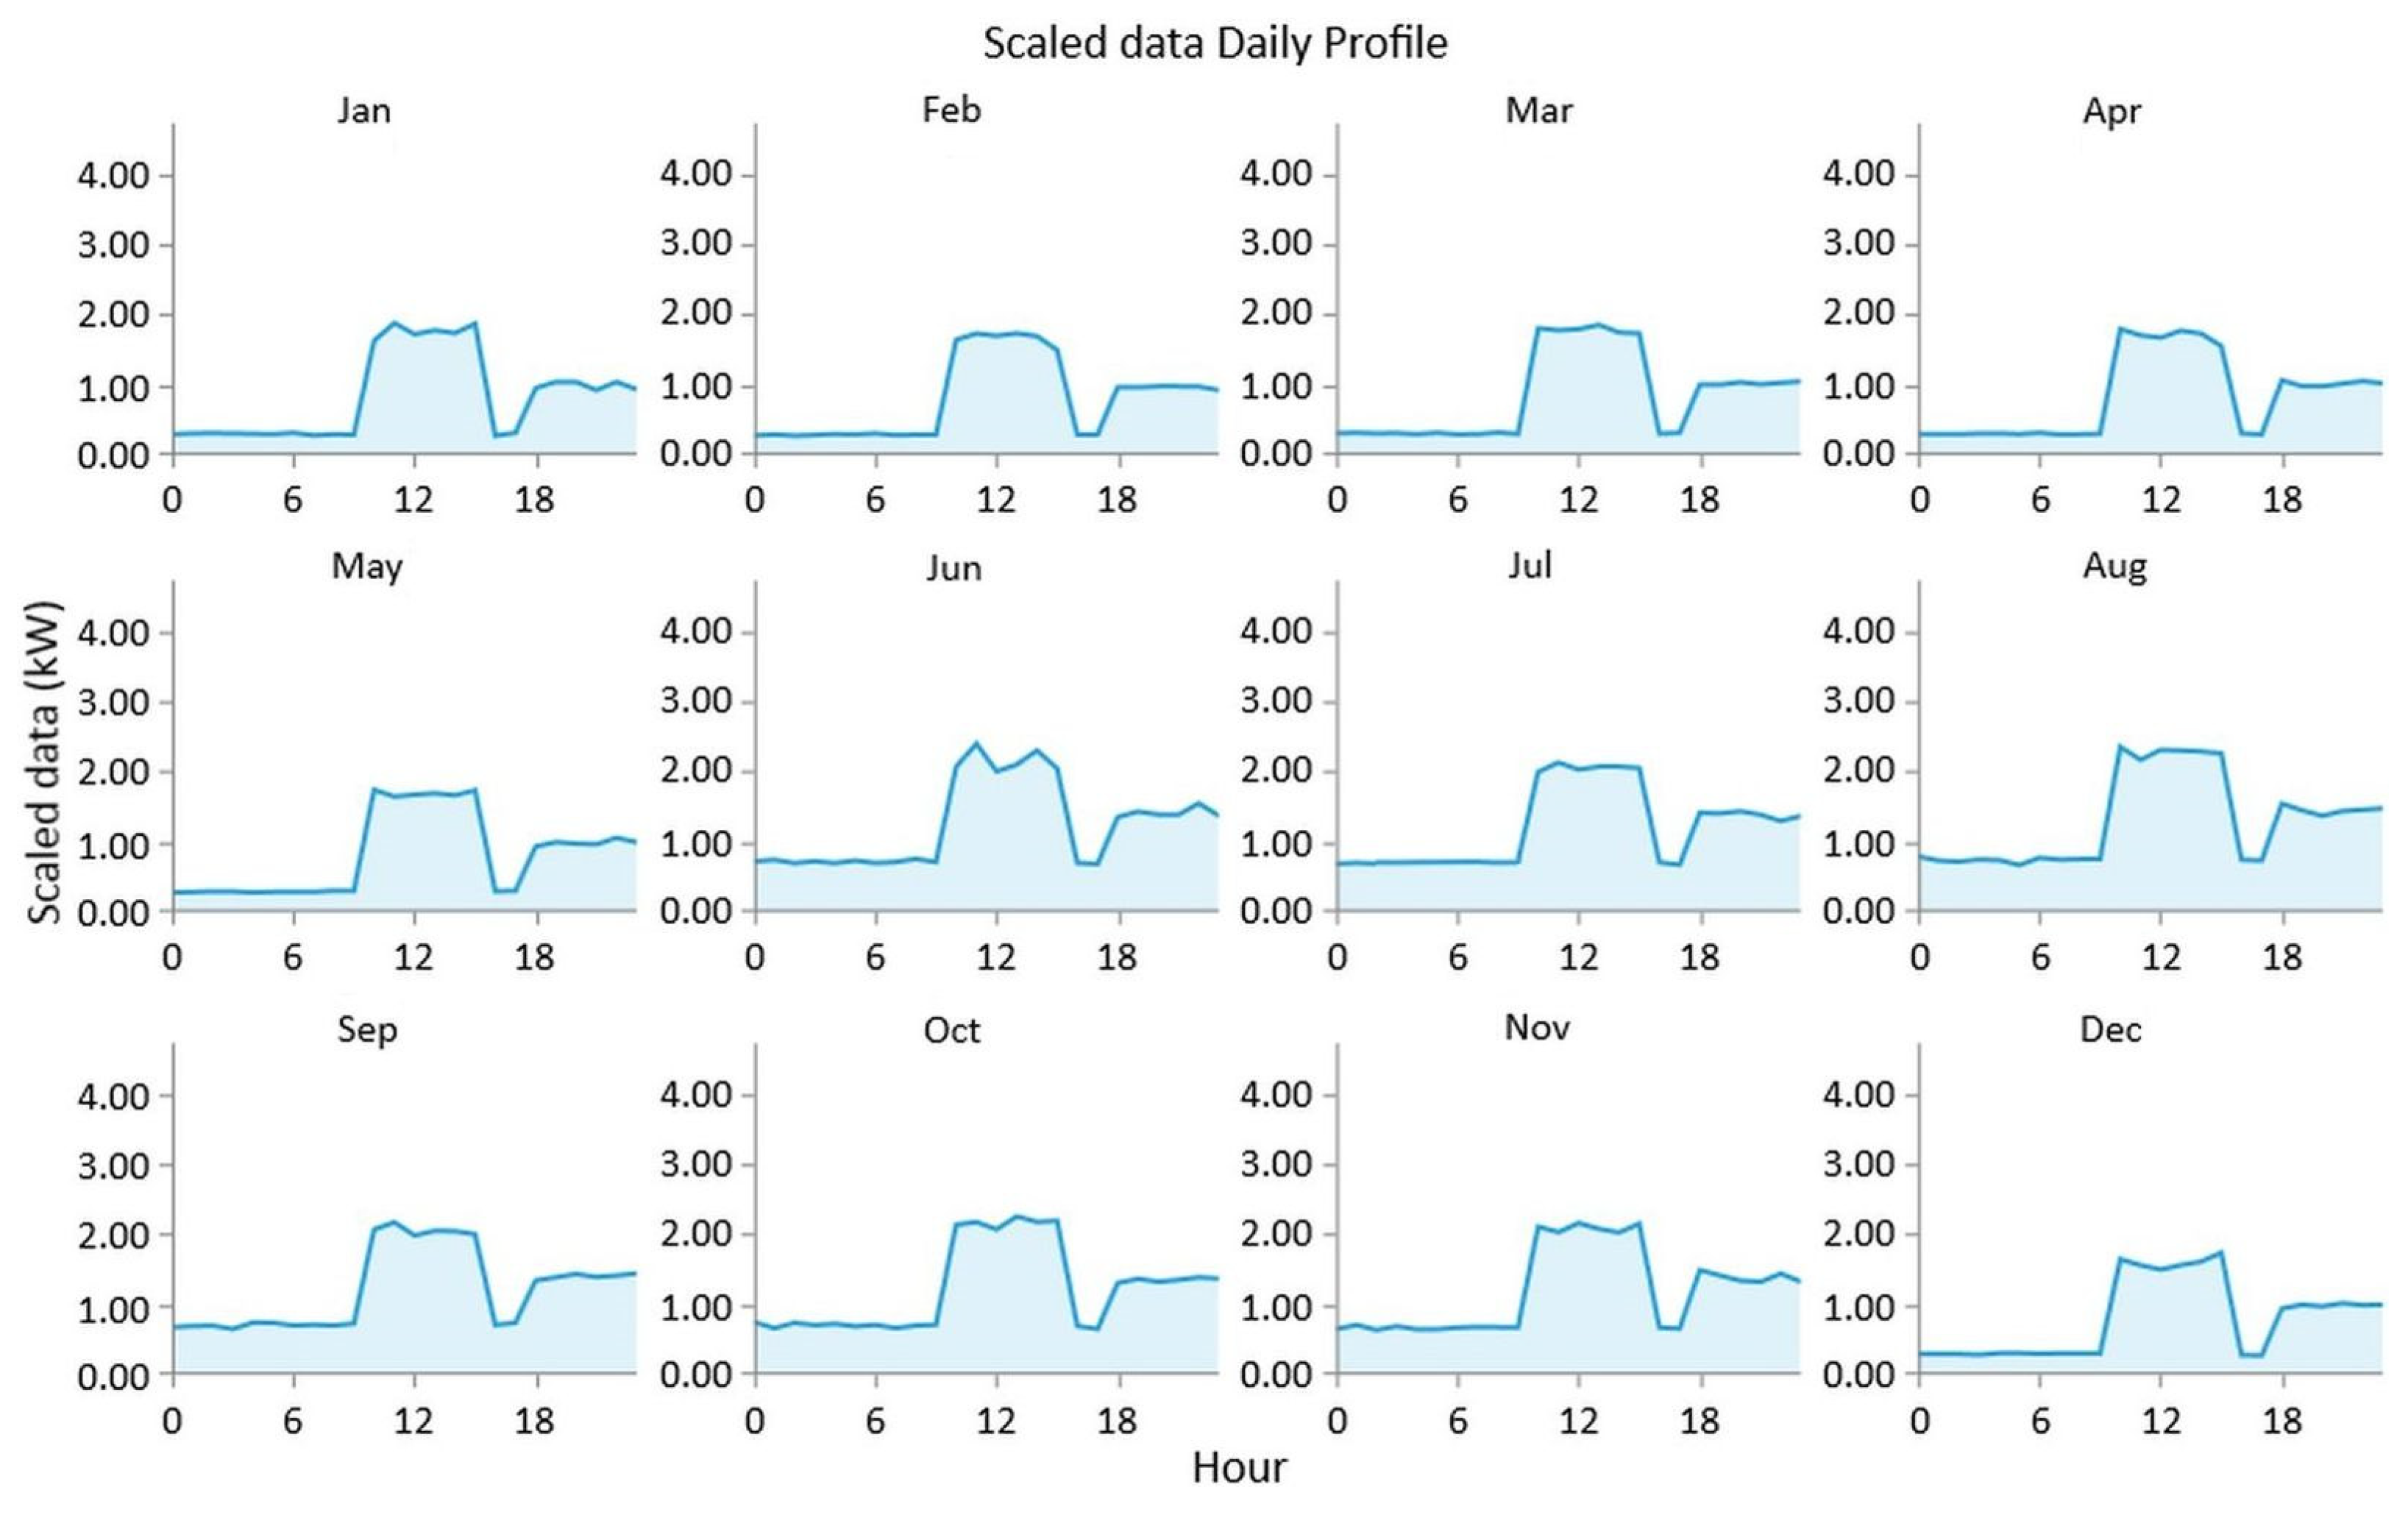
3.1. Daily Load Profile
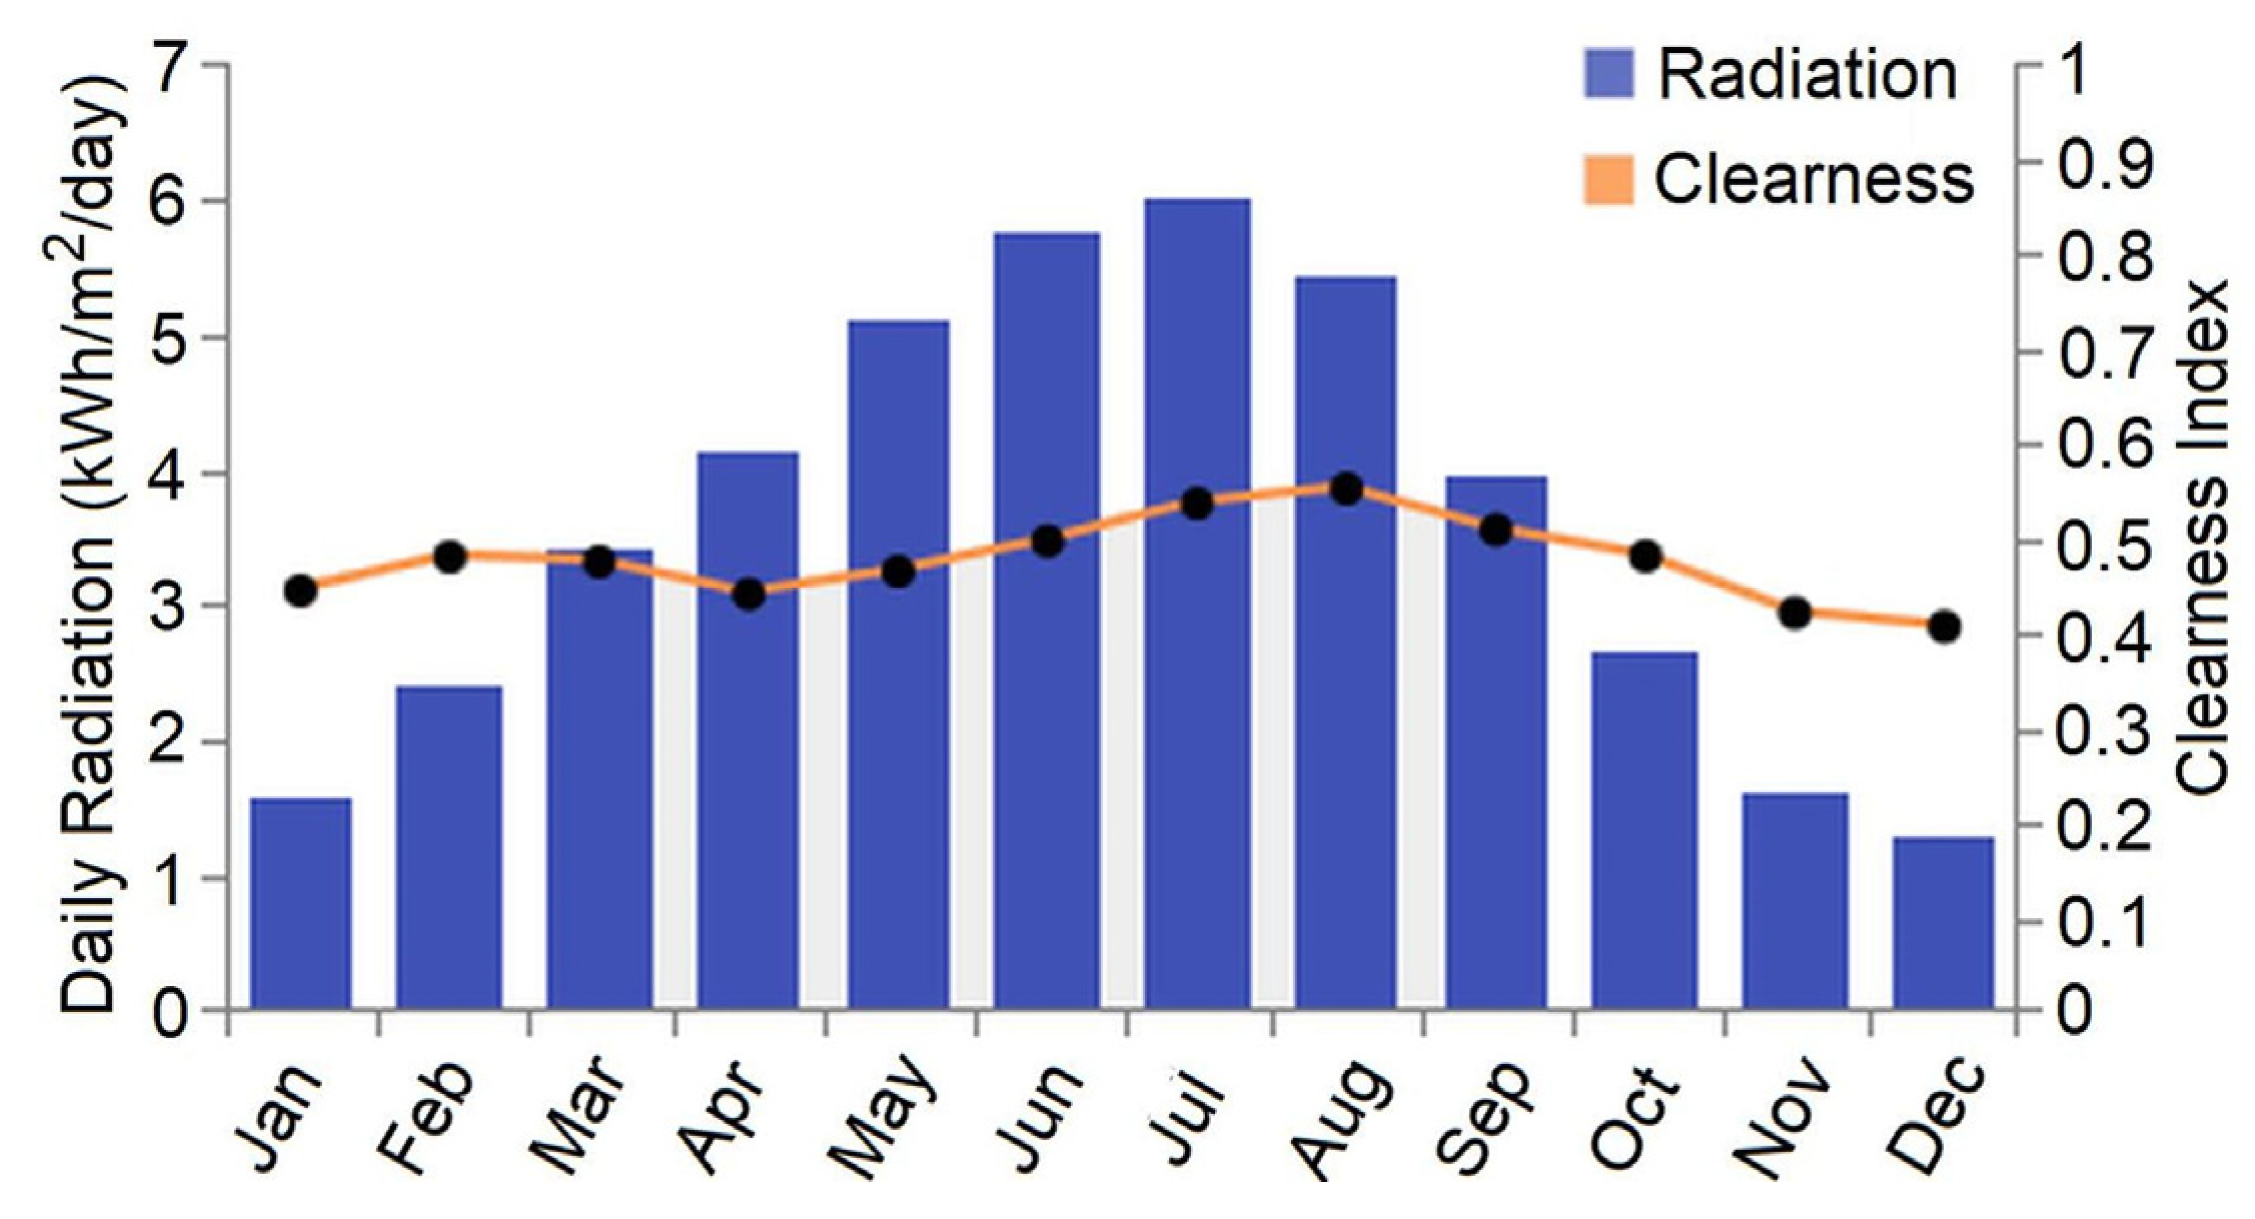
3.2. Solar Radiation and PV Generator
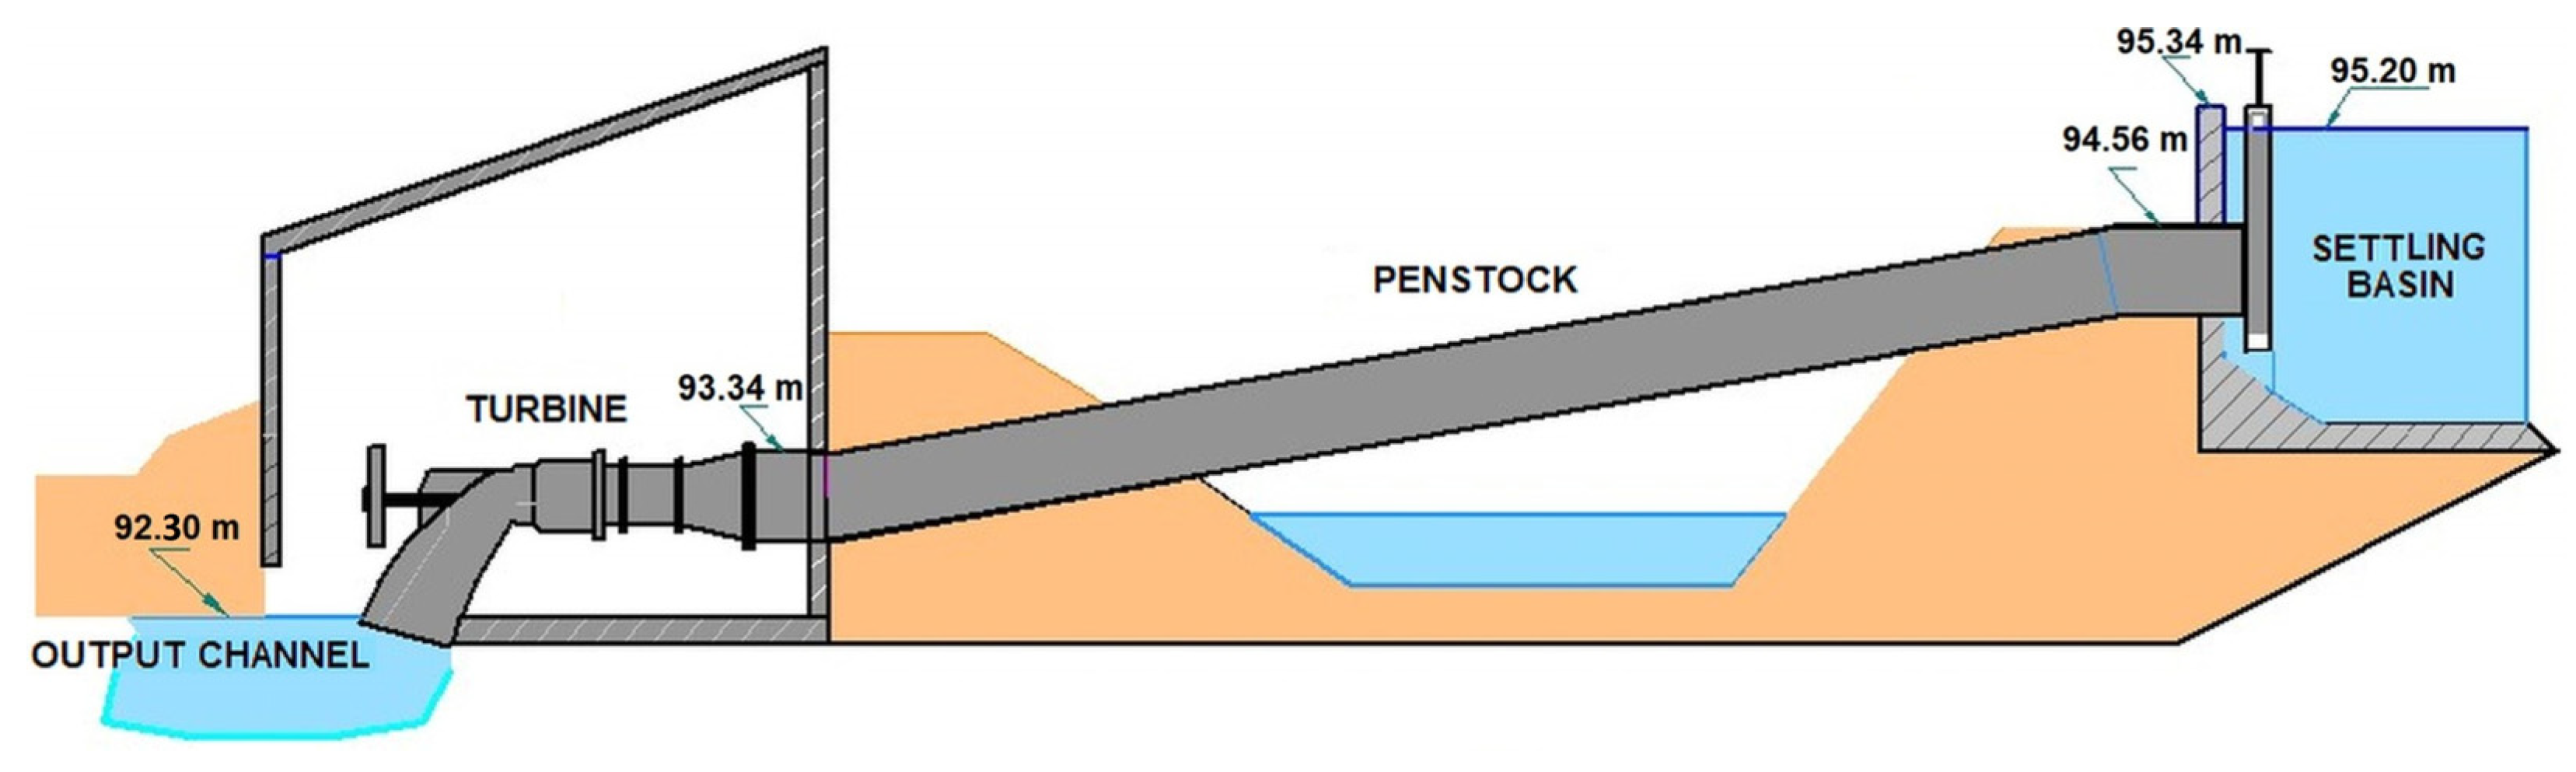
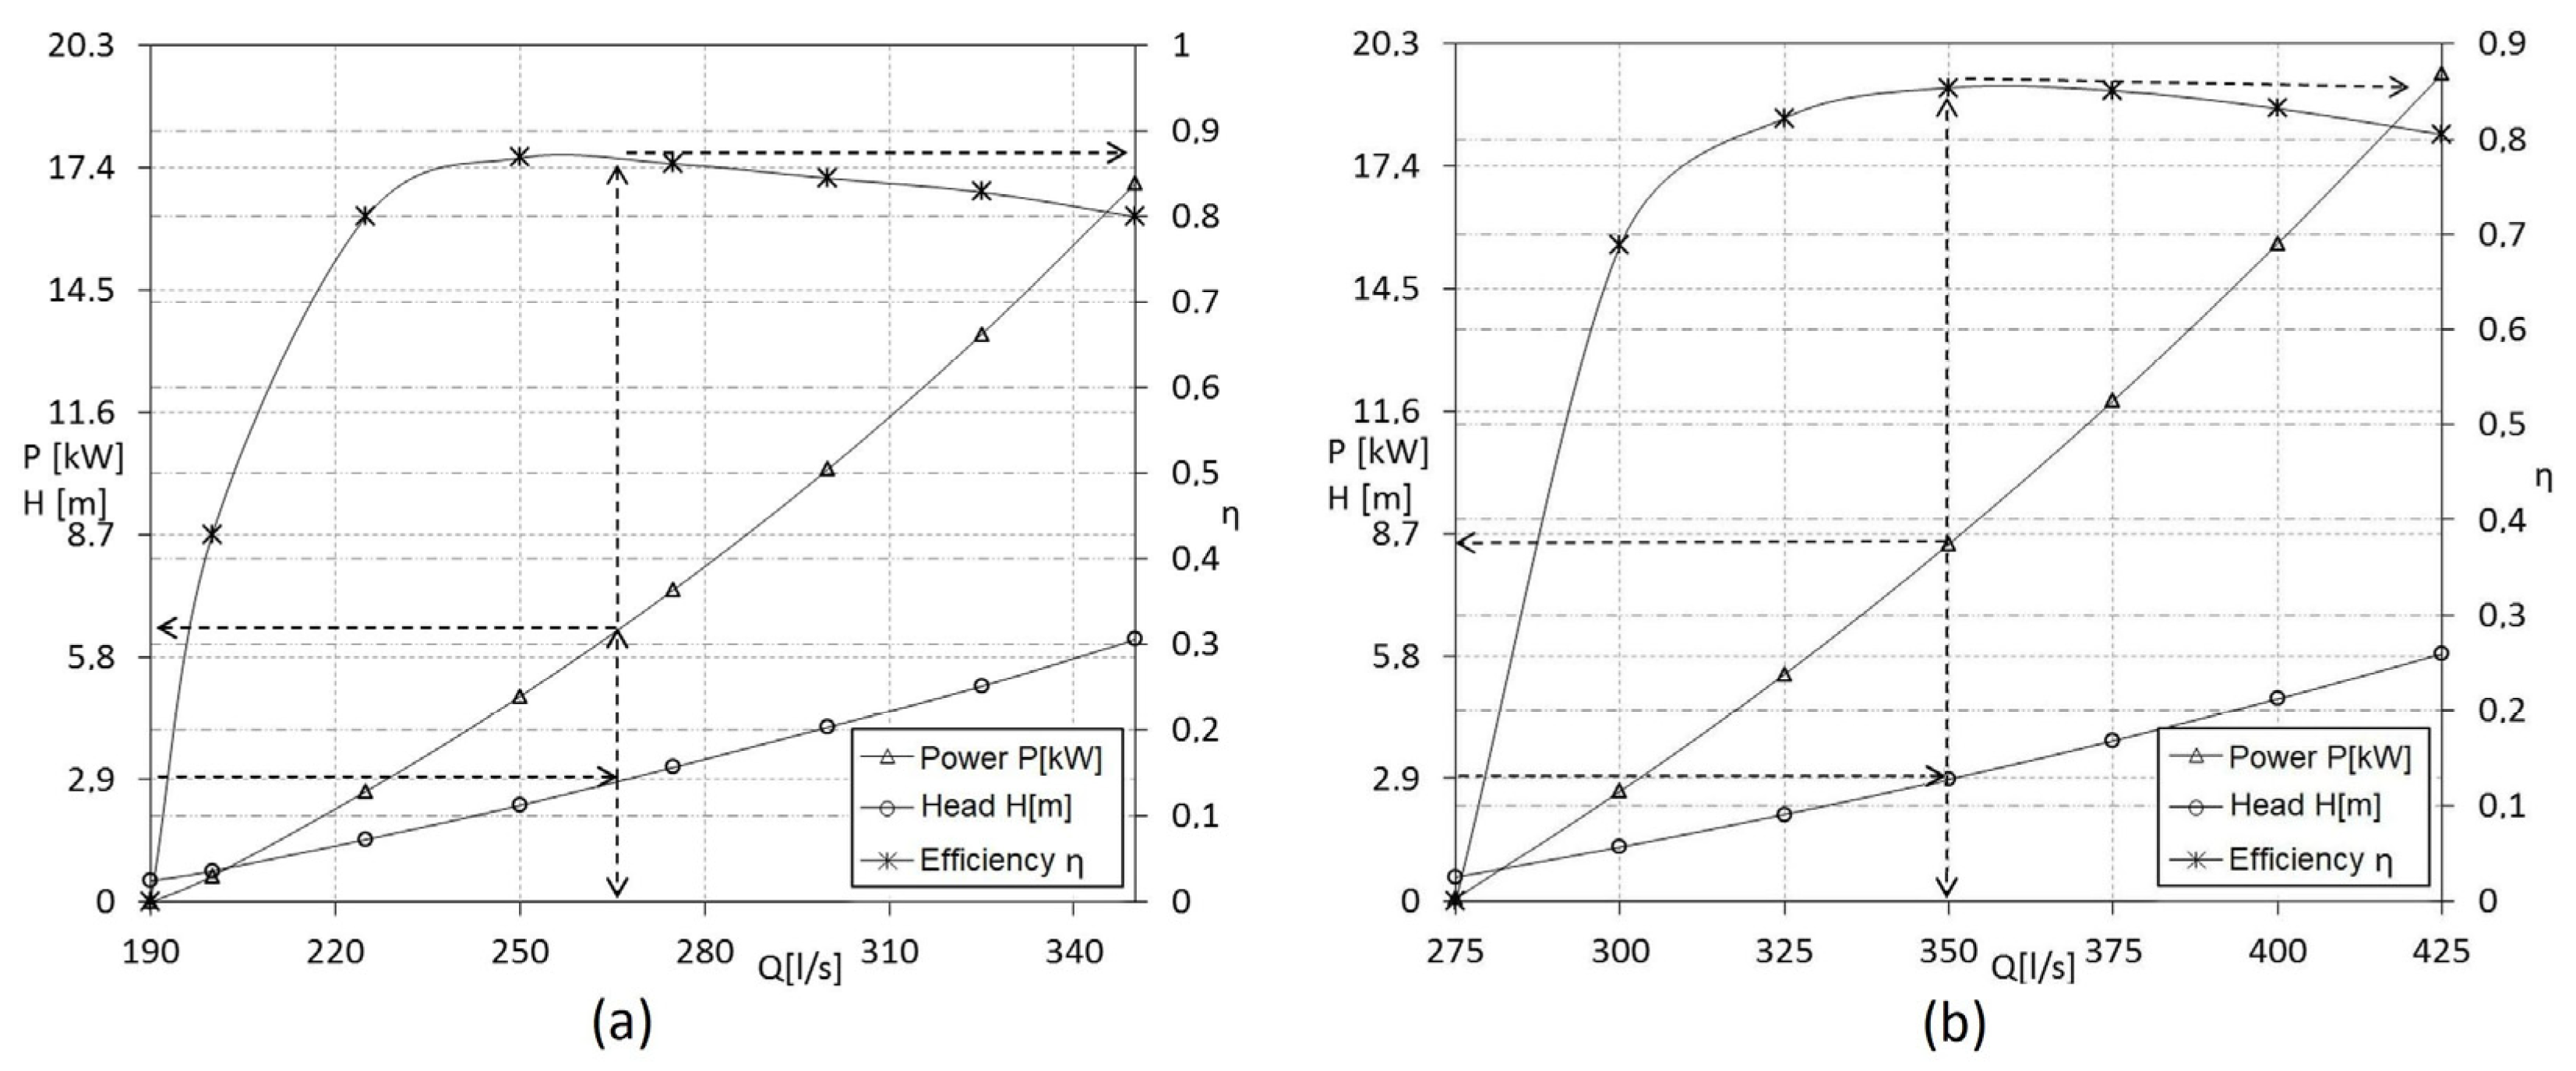
3.3. Hydropower and MHPP
3.4. Diesel Generator
3.5. Converter
3.6. Batteries
4. Results and Discussion
5. Conclusions
Author Contributions
Funding
Data Availability Statement
Acknowledgments
Conflicts of Interest
References
- Panić, M.; Urošev, M.; Pešić, A.M.; Brankov, J.; Bjeljac, Ž. Small hydropower plants in Serbia: Hydropower potential, current state and perspectives. Renew. Sustain. Energy Rev. 2013, 23, 341–349. [Google Scholar] [CrossRef]
- Djurdjevic, Z.D. Perspectives and assessments of solar PV power engineering in the Republic of Serbia. Renew. Sustain. Energy Rev. 2011, 15, 2431–2446. [Google Scholar] [CrossRef]
- Pavlović, T.; Milosavljević, D.; Radonjić, I.; Pantić, L.; Radivojević, A.; Pavlović, M. Possibility of electricity generation using PV solar plants in Serbia. Renew. Sustain. Energy Rev. 2013, 20, 201–218. [Google Scholar] [CrossRef]
- Kenfack, J.; Neirac, F.P.; Tatietse, T.T.; Mayer, D.; Fogue, M.; Lejeune, A. Microhydro-PV hybrid system: Sizing a small hydro-PV-hybrid system for rural electrification in developing countries. Renew. Energy 2009, 34, 2259–2263. [Google Scholar] [CrossRef]
- Ogueke, N.V.; Ikpamezie, I.I.; Anyanwu, E.E. The potential of a small hydro/photovoltaic hybrid system for electricity generation in FUTO, Nigeria. Int. J. Ambient Energy 2016, 37, 256–265. [Google Scholar] [CrossRef]
- Teixeira, L.E.; Caux, J.; Beluco, A.; Bertoldo, I.; Louzada, J.A.S.; Eifler, R.C. Feasibility study of a hydro PV hybrid system operating at a dam for water supply in Southern Brazil. J. Power Energy Eng. 2015, 3, 70–83. [Google Scholar] [CrossRef]
- Beluco, A.; Souza, P.K.; Krenzinger, A. PV hydro hybrid systems. IEEE Lat. Am. Trans. 2008, 6, 626–631. [Google Scholar] [CrossRef]
- Aziz, A.S.; Tajuddin, M.F.N.; Adzman, M.R.; Azmi, A.; Ramli, M.A.M. Optimization and sensitivity analysis of standalone hybrid energy systems for rural electrification: A case study of Iraq. Renew. Energy 2019, 138, 775–792. [Google Scholar] [CrossRef]
- Oladigbolu, J.O.; Ramli, M.A.M.; Al-Turki, Y.A. Optimal design of a hybrid PV solar/micro-hydro/diesel/battery energy system for a remote rural village under tropical climate conditions. Electronics 2020, 9, 1941. [Google Scholar] [CrossRef]
- Adebanji, B.; Adepoju, G.A.; Oni, J.O.; Olulope, P.K. Optimal sizing of an off-grid small hydro-photovoltaic-diesel generator hybrid power system for a distant village. Int. J. Sci. Technol. Res. 2017, 6, 208–213. [Google Scholar]
- Nigussie, T.; Bogale, W.; Bekele, F.; Dribssa, E. Feasibility study for power generation using off-grid energy system from micro hydro-PV-diesel generator-battery for rural area of Ethiopia: The case of Melkey Hera village, Western Ethiopia. AIMS Energy 2017, 5, 667–690. [Google Scholar] [CrossRef]
- Goel, S.; Sharma, R. Optimal sizing of a biomass-biogas hybrid system for sustainable power supply to a commercial agricultural farm in northern Odisha, India. Environ. Dev. Sustain. 2019, 21, 2297–2319. [Google Scholar] [CrossRef]
- Castellanos, J.G.; Walker, M.; Poggio, D.; Pourkashanian, M.; Nimmo, W. Modelling an off-grid integrated renewable energy system for rural electrification in India using photovoltaics and anaerobic digestion. Renew. Energy 2015, 74, 390–398. [Google Scholar] [CrossRef]
- Benhachani, Z.; Azoui, B.; Abdessemed, R.; Chabane, M. Optimal sizing of a solar-wind hybrid system supplying a farm in a semi-arid region of Algeria. In Proceedings of the 2012 47th International Universities Power Engineering Conference (UPEC), Uxbridge, UK, 4–7 September 2012; pp. 1–6. [Google Scholar]
- Abbaszadeh, M.A.; Ghourichaei, M.J.; Mohammadkhani, F. Thermo-economic feasibility of a hybrid wind turbine/PV/gas generator energy system for application in a residential complex in Tehran, Iran. Environ. Prog. Sustain. Energy 2020, 39, e13396. [Google Scholar] [CrossRef]
- Borges Neto, M.R.; Carvalho, P.C.M.; Carioca, J.O.B.; Canafístula, F.J.F. Biogas/photovoltaic hybrid power system for decentralized energy supply of rural areas. Energy Policy 2010, 38, 4497–4506. [Google Scholar] [CrossRef]
- Rashid, S.; Rana, S.; Shezan, S.K.A.; Karim, S.A.B.; Anower, S. Optimized design of a hybrid PV-wind-diesel energy system for sustainable development at coastal areas in Bangladesh. Environ. Prog. Sustain. Energy 2017, 36, 297–304. [Google Scholar] [CrossRef]
- Shezan, S.K.A.; Al-Mamoon, A.; Ping, H.W. Performance investigation of an advanced hybrid renewable energy system in Indonesia. Environ. Prog. Sustain. Energy 2018, 37, 1424–1432. [Google Scholar] [CrossRef]
- Nallolla, C.A.; Perumal, V. Optimal design of a hybrid off-grid renewable energy system using techno-economic and sensitivity analysis for a rural remote location. Sustainability 2022, 14, 15393. [Google Scholar] [CrossRef]
- Nikolaidis, P. Pulsed-supplied water electrolysis via two-switch converter for PV capacity firming. Electricity 2022, 3, 131–144. [Google Scholar] [CrossRef]
- Arif, S.; Rabbi, A.E.; Ahmed, S.U.; Hossain Lipu, M.S.; Jamal, T.; Aziz, T.; Sarker, M.R.; Riaz, A.; Alharbi, T.; Hussain, M.M. Enhancement of solar PV hosting capacity in a remote industrial microgrid: A methodical techno-economic approach. Sustainability 2022, 14, 8921. [Google Scholar] [CrossRef]
- Ullah, R.; Cheema, T.A. Experimental investigation of runner design parameters on the performance of vortex turbine. Eng. Proc. 2022, 23, 14. [Google Scholar]
- Duan, L.; Wang, D.; Wang, G.; Han, C.; Zhang, W.; Liu, X.; Wang, C.; Che, Z.; Chen, C. Piecewise causality study between power load and vibration in hydro-turbine generator unit for a low-carbon era. Energies 2022, 15, 1207. [Google Scholar] [CrossRef]
- Vijay Kumar, M.; Subba Reddy, T.; Sarala, P.; Varma, P.S.; Chandra Sekhar, O.; Babqi, A.; Alharbi, Y.; Alamri, B.; Reddy, C.R. Experimental investigation and performance characteristics of Francis turbine with different guide vane openings in hydro distributed generation power plants. Energies 2022, 15, 6798. [Google Scholar] [CrossRef]
- Wu, K.-T.; Lo, K.-H.; Kao, R.-C.; Hwang, S.-J. Numerical and experimental investigation of the effect of design parameters on Savonius-type hydrokinetic turbine performance. Energies 2022, 15, 1856. [Google Scholar] [CrossRef]
- Novković, Đ.; Maričić, N.; Jevtić, M.; Glavčić, Z. Improving small bulb turbine performances using CFD. Energ. Ekon. Ekol. 2013, 3–4, 309–316. [Google Scholar]
- HOMER Energy. HOMER Pro Version 3.16.2 User Manual; HOMER Energy: Boulder, CO, USA, 2023. [Google Scholar]
- Lambert, T.; Gilman, P.; Lilienthal, P. Micropower system modeling with HOMER. In Integration of Alternative Sources of Energy; Farret, F.A., Simões, M.G., Eds.; John Wiley & Sons, Inc.: Hoboken, NJ, USA, 2006; pp. 379–418. [Google Scholar]
- NASA/SSE. Surface Meteorology and Solar Energy. Available online: https://power.larc.nasa.gov/ (accessed on 16 August 2023).
- ABiSolar. Available online: https://abisolar.rs/proizvod/solarni-paneli-sharp/50/ (accessed on 16 August 2023).
- Exchange Rate. Available online: https://www.kursna-lista.info/valuta/usd-americki-dolar (accessed on 16 August 2023).
- Green Resource Center. Available online: https://thebalkanforum.org/file/repository/NK60 (accessed on 16 August 2023). (In Serbian).
- Halooglasi. Available online: https://www.halooglasi.com/masine-alati-oprema/elektromotori-i-agregati/agregat-besumni-dizel-yamaha-12kw/5425637009922?kid=1 (accessed on 16 August 2023).
- Retail Serbia. Available online: https://retailserbia.com/info/cene-goriva-srbija (accessed on 16 August 2023).
- National Bank of Serbia. Available online: https://www.nbs.rs/sr_RS/finansijsko_trziste/medjubankarsko-devizno-trziste/kursna-lista/zvanicni-srednji-kurs-dinara/index.html (accessed on 16 August 2023).
- ABiSolar. Available online: https://abisolar.rs/proizvod/invertori-occren-nb-1000w-cist-sinus/110/ (accessed on 16 August 2023).
- Andreja doo Temerin. Available online: https://www.akumulator-shop.rs/akumulatori-za-brodove/trojan-27tmx-12v-105ah (accessed on 16 August 2023).
- Al-Juboori, S.S.; Mutlag, A.H.; Abduljabbar, R.H. Evaluation of stand alone remote area hybrid power system. Int. J. Electr. Electron. Eng. 2014, 3, 61–68. [Google Scholar]
- Anayochukwu, A.V.; Ndubueze, N.A. Potentials of optimized hybrid system in powering off-grid macro base transmitter station site. Int. J. Renew. Energy Res. 2013, 3, 861–871. [Google Scholar]
- Akinyele, D.; Okakwu, I.; Olabode, E.; Blanchard, R.; Ajewole, T.; Monyei, C. Integrated TEEP approach to microgrid design and planning with small hydro/solar/diesel resources for standalone application. e-Prime-Adv. Electr. Eng. Electron. Energy 2022, 2, 100091. [Google Scholar]


| MHPP | Storage Battery Unit |
|---|---|
where Phyd is the power output of the MHPP (kW), ηhyd is the efficiency of the MHPP (%), ρwater is the water density (1000 kg/m3), g is the acceleration due to gravity (9.81 m/s2), hnet is the net head (m), and Qturbine is the flow rate through the MHPP (m3/s). | where cbw is the battery wear cost depending on the cost of cycling energy through the battery unit ($), is the cost of replacing the battery unit ($), is the number of batteries in the battery unit, is lifetime throughput of a single battery (kWh), and is the battery round-trip efficiency (fractional). |
| PV generator | |
where is the power output of the PV generator (kW), is the rated capacity of the PV generator, meaning its power output at the standard test conditions (STC) (kW), is the PV derating factor (%), is the solar irradiance in the current time step (kW/m2), is the solar irradiance at the STC (1 kW/m2), is the temperature coefficient of power (%/°C), is the PV cell temperature in the current time step (°C), and is the PV cell temperature at the STC (25 °C). | where is the number of cycles to failure, is the depth of discharge (%), is the maximum capacity of the battery (Ah), and is the nominal voltage of the battery (V). |
| Economic modeling | |
where is the total NPC ($), is the total annualized cost ($/year), is a function returning the capital recovery factor, is annual real interest rate (discount rate) (%), and is the projected lifetime (year). | |
| Diesel generator | |
where is the fuel consumption rate (l/h), is the fuel curve intercept coefficient (l/h/kW), is the fuel curve slope (l/h/kW), is the rated capacity of the generator (kW), and is the output of the generator in the current time step (kW). | where is annual real interest rate (%), and is the number of years. |
where is the levelized COE ($/kWh), is the total annualized cost of the system ($/year), is the AC primary load that is supplied with electricity (kWh/year), is the deferrable load that is supplied with electricity (kWh/year), and is the electricity sold to the grid (kWh/year). | |
where is the generator fixed COE ($), is the operating and maintenance (O&M) cost ($/h), is the cost of replacing ($), is the generator lifetime (h), is the fuel curve intercept coefficient (l/h/kW), is the rated capacity of the generator (kW), and is the effective price of diesel fuel ($/l). |
| Component or Entire System | Power (kW) | Total NPC ($) | Total Annual Electricity Generation (kWh/Year) | ||||||
|---|---|---|---|---|---|---|---|---|---|
| Case 1 | Case 2 | Case 3 | Case 1 | Case 2 | Case 3 | Case 1 | Case 2 | Case 3 | |
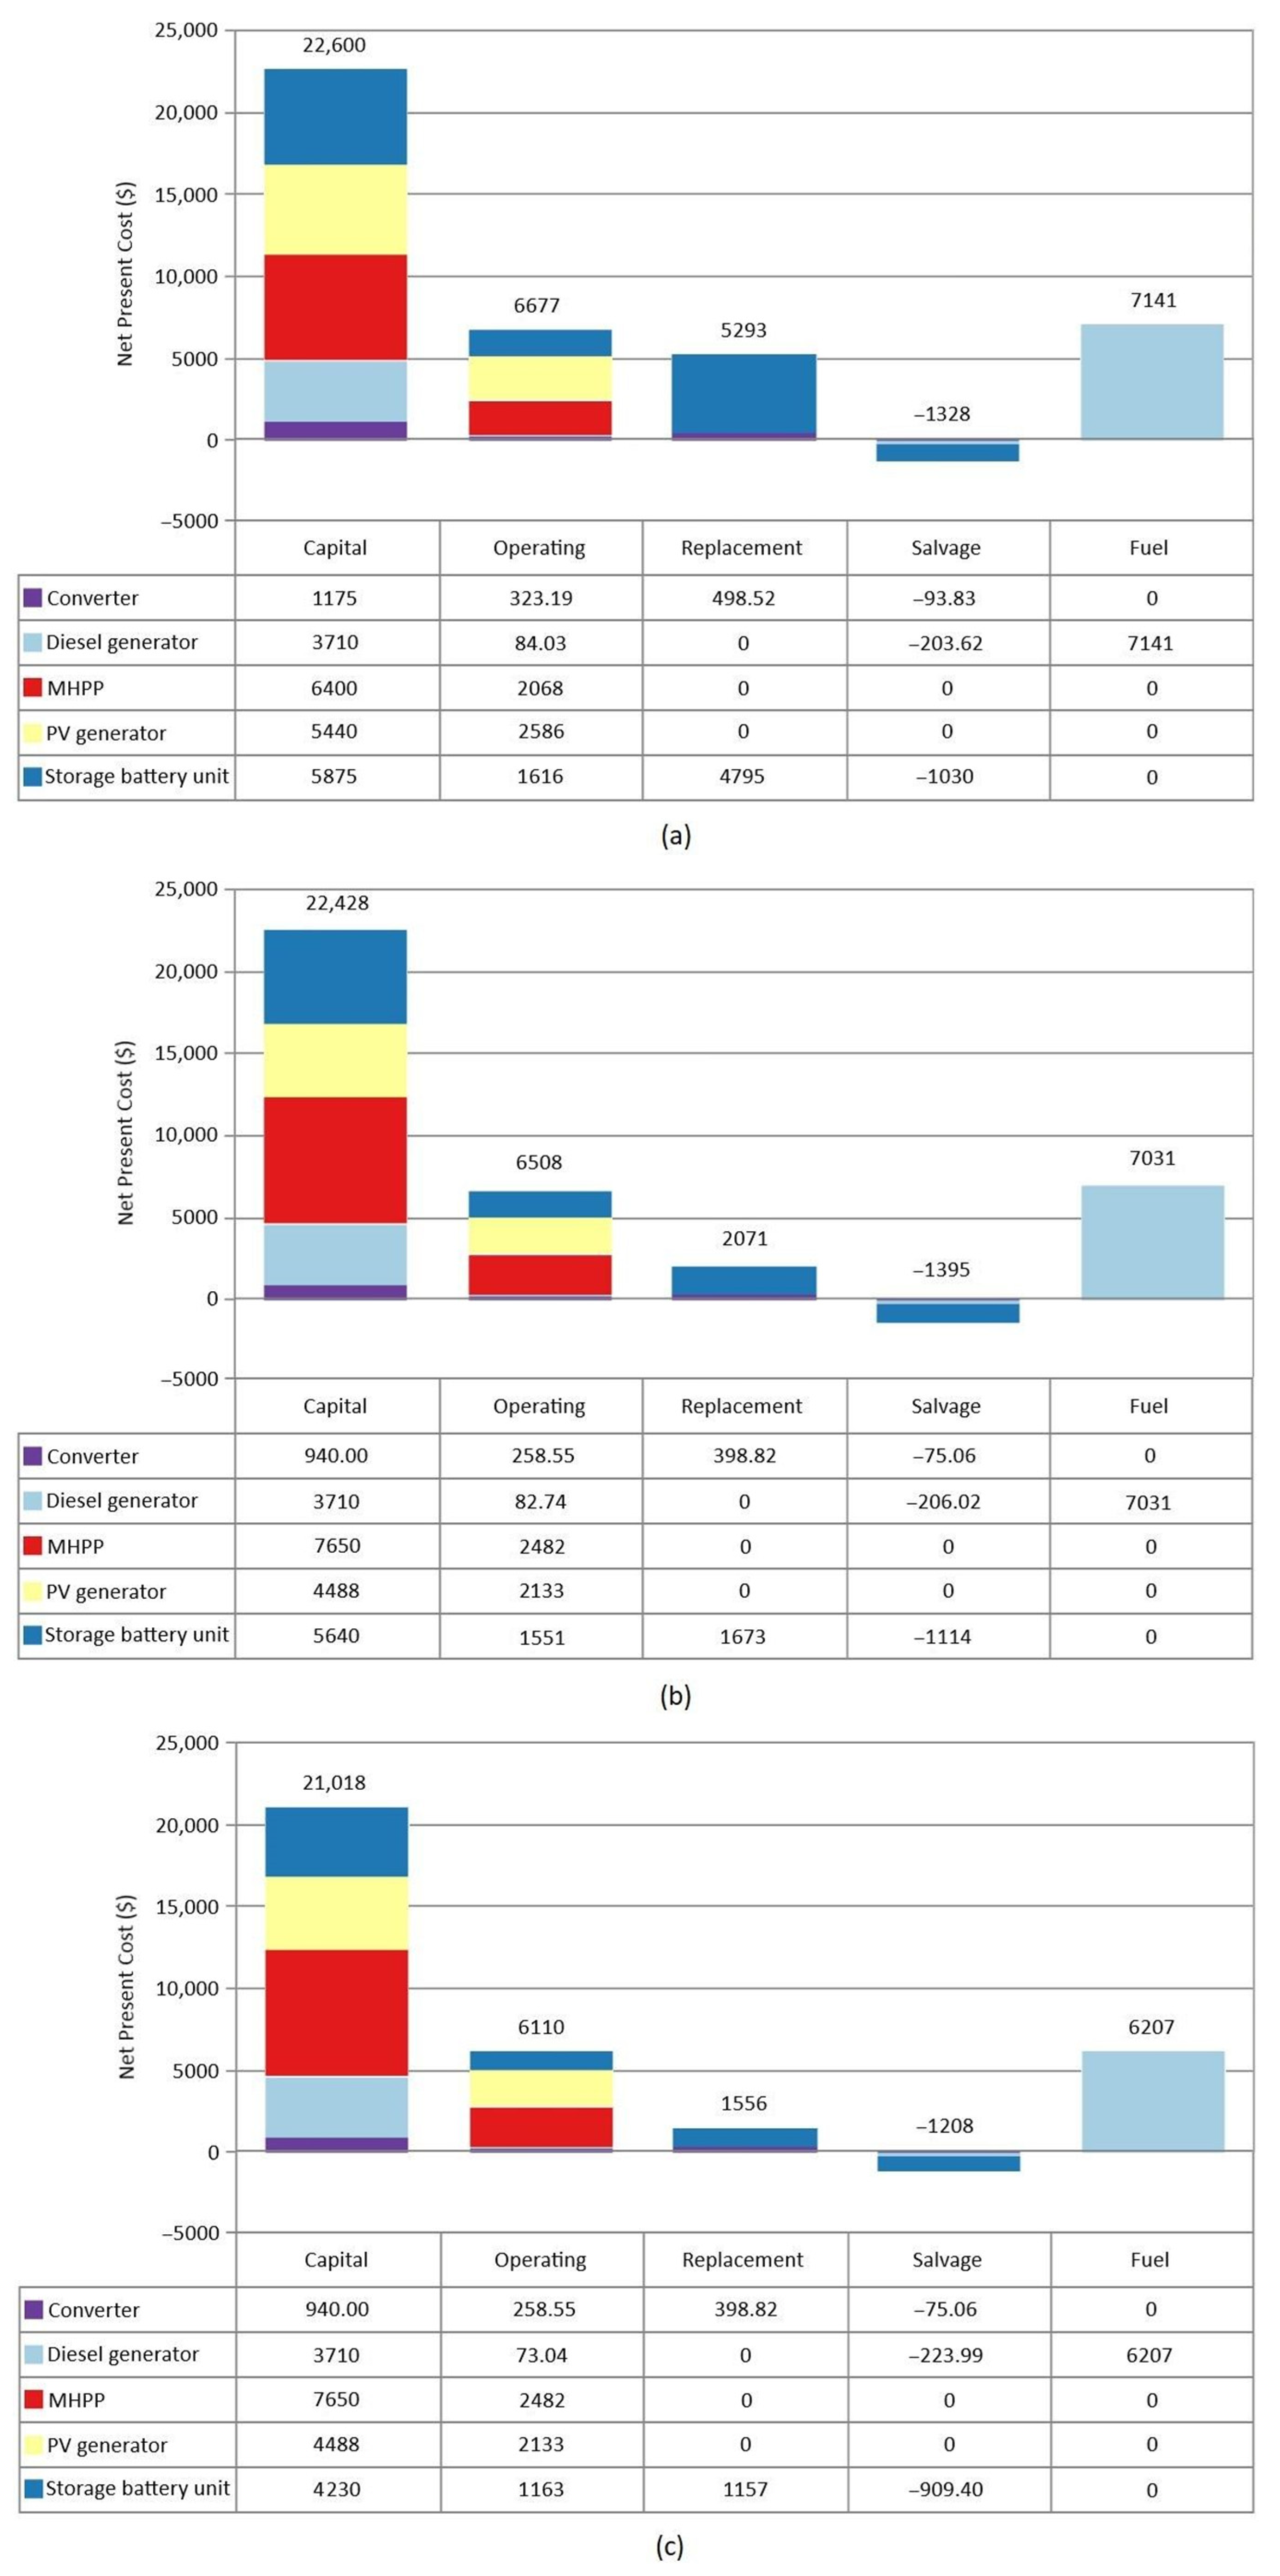
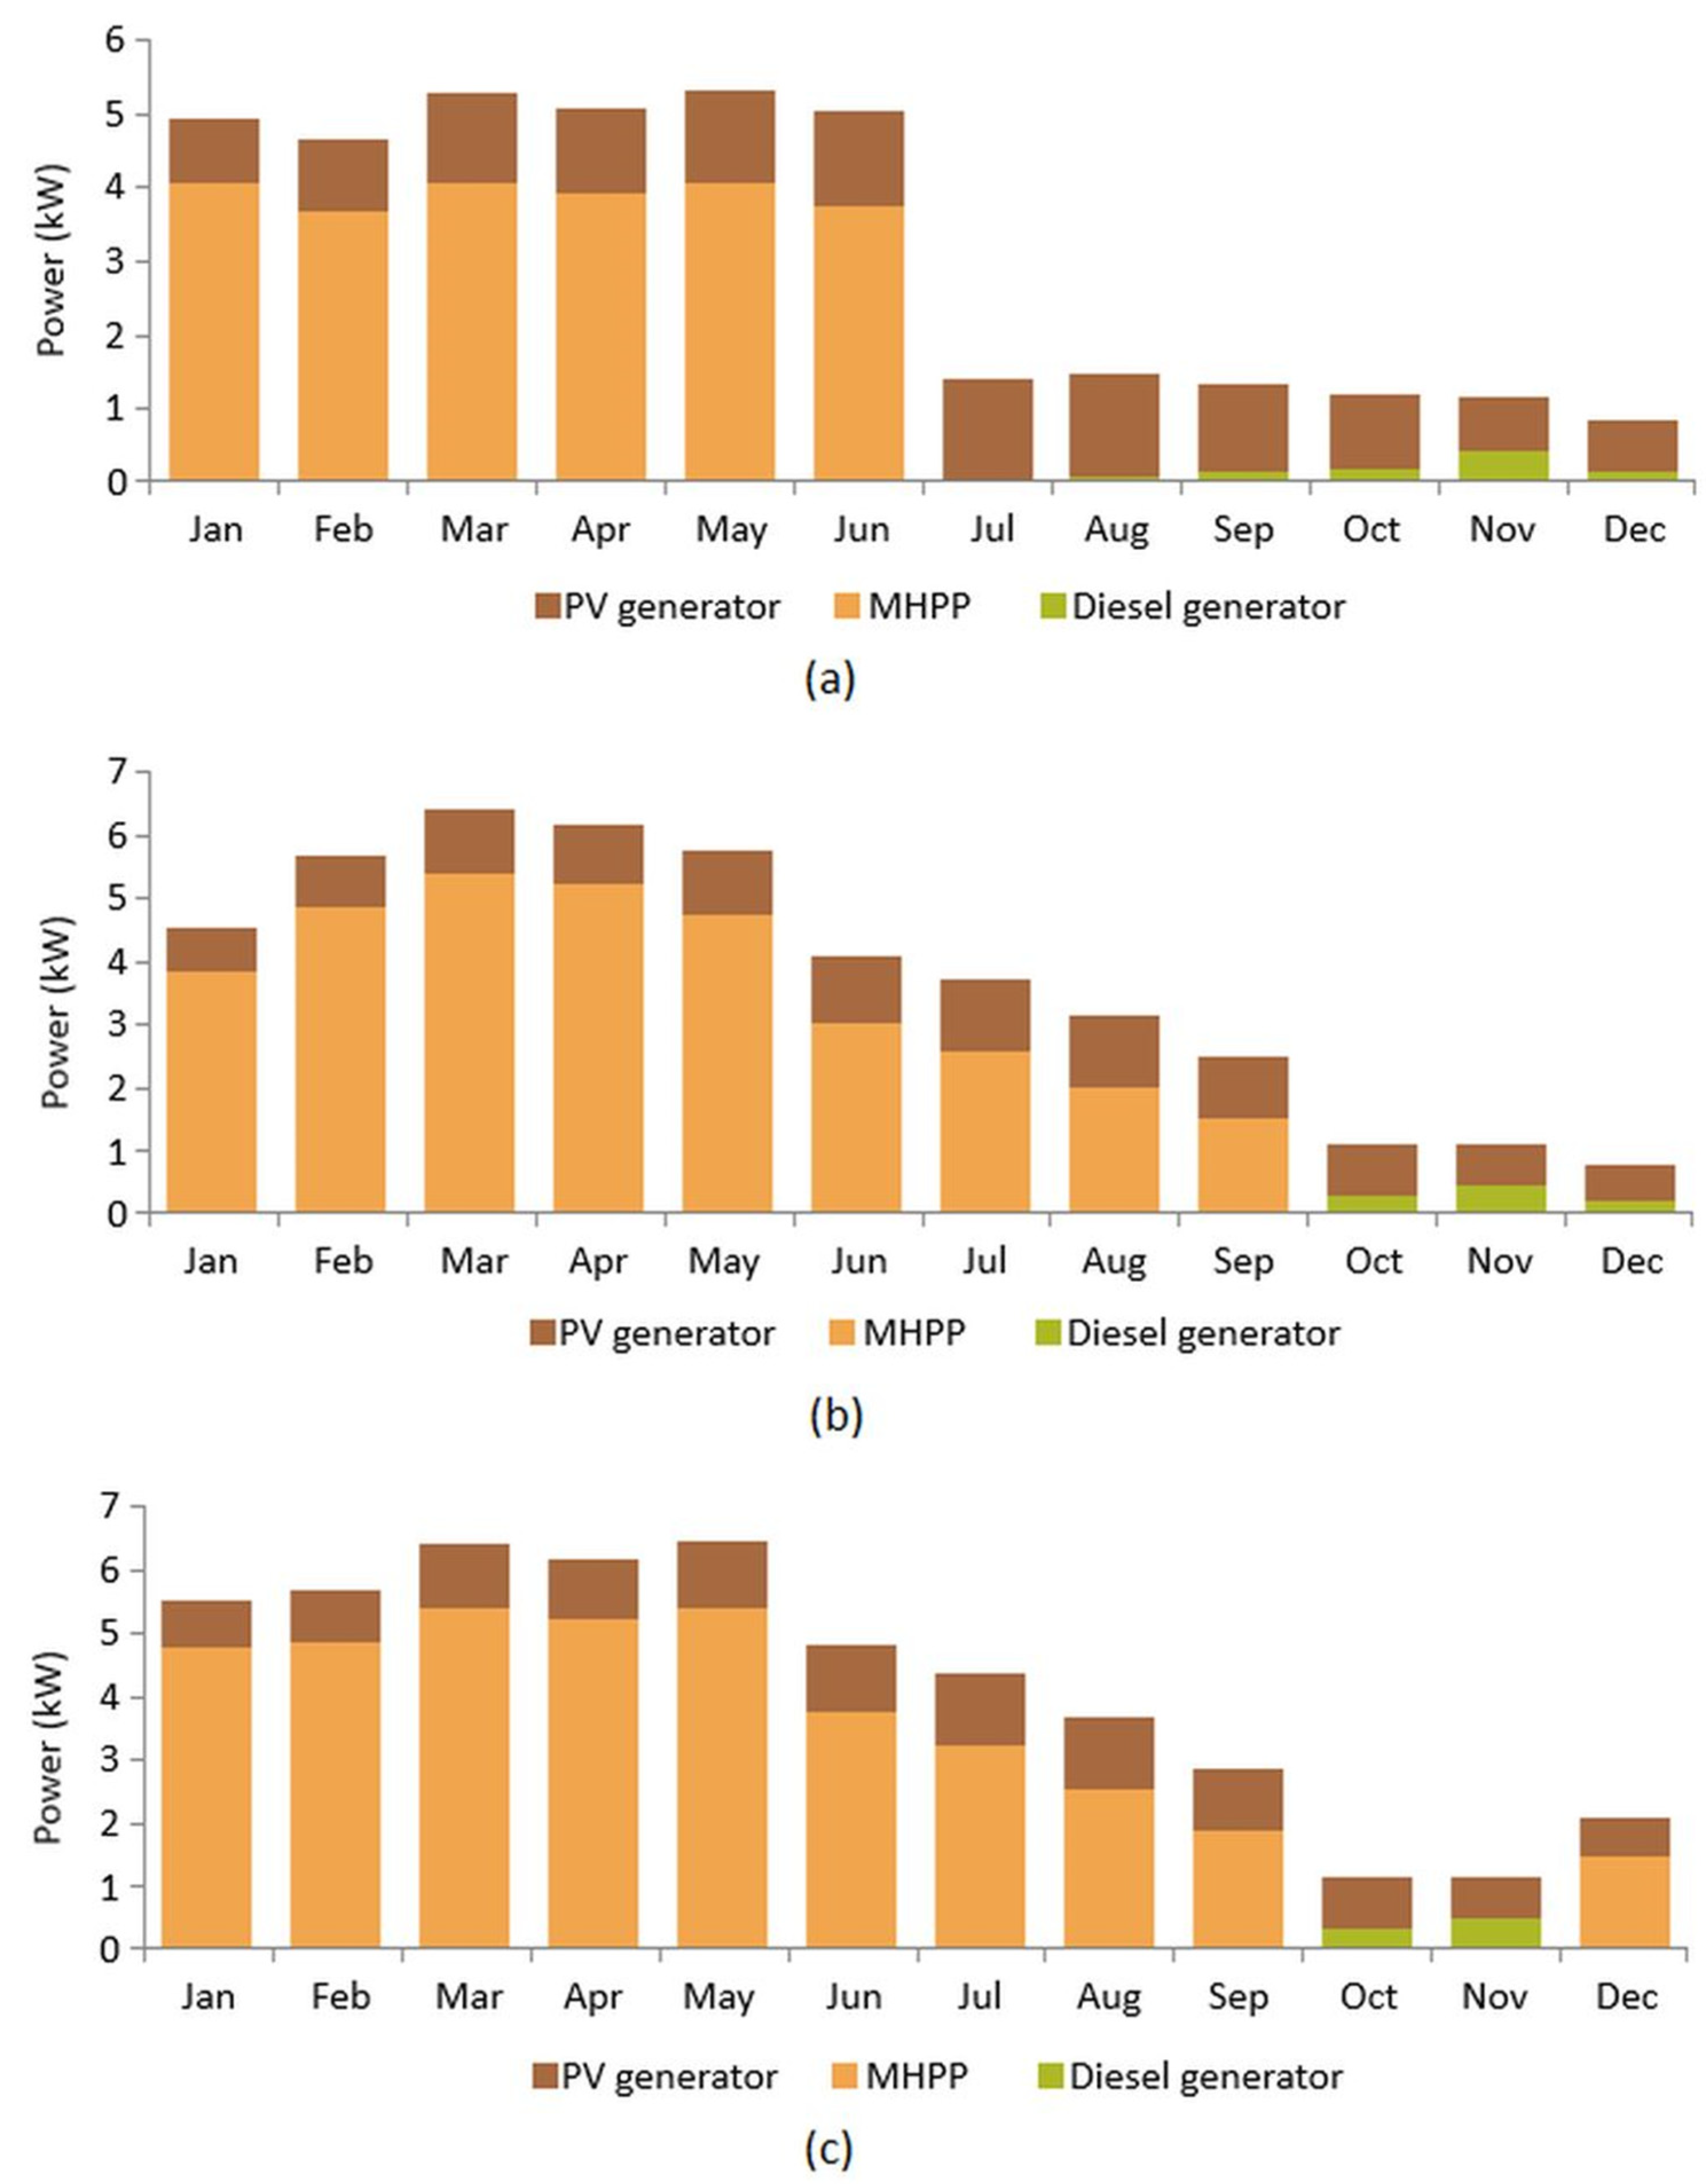
| MHHP | 6.4 | 8.5 | 8.5 | 8468 | 10,132 | 10,132 | 23,444 (62.4%) | 32,979 (73.7%) | 38,399 (76.7%) |
| PV generator | 10 | 8.25 | 8.25 | 8026 | 6621 | 6621 | 13,184 (35.1%) | 10,877 (24.3%) | 10,877 (21.7%) |
| Diesel generator | 12 | 12 | 12 | 10,731 | 10,617 | 9766 | 936 (2.5%) | 922 (2%) | 814 (1.6%) |
| Storage battery unit | 25 | 24 | 18 | 11,255 | 7750 | 5641 | / | / | / |
| Converter | 5 | 4 | 4 | 1903 | 1522 | 1522 | / | / | / |
| Entire system | 28.4 | 28.75 | 28.75 | 40,383 | 36,643 | 33,683 | 37,564 (100%) | 44,777 (100%) | 50,090 (100%) |
| Case | Power Output of MHPP (kW) | Power Output of PV Generator (kW) | Power Output of Diesel Generator (kW) | Input Power of Storage Battery Unit (kW) | Power Output of Converter (kW) | |
|---|---|---|---|---|---|---|
| Inverter | Rectifier | |||||
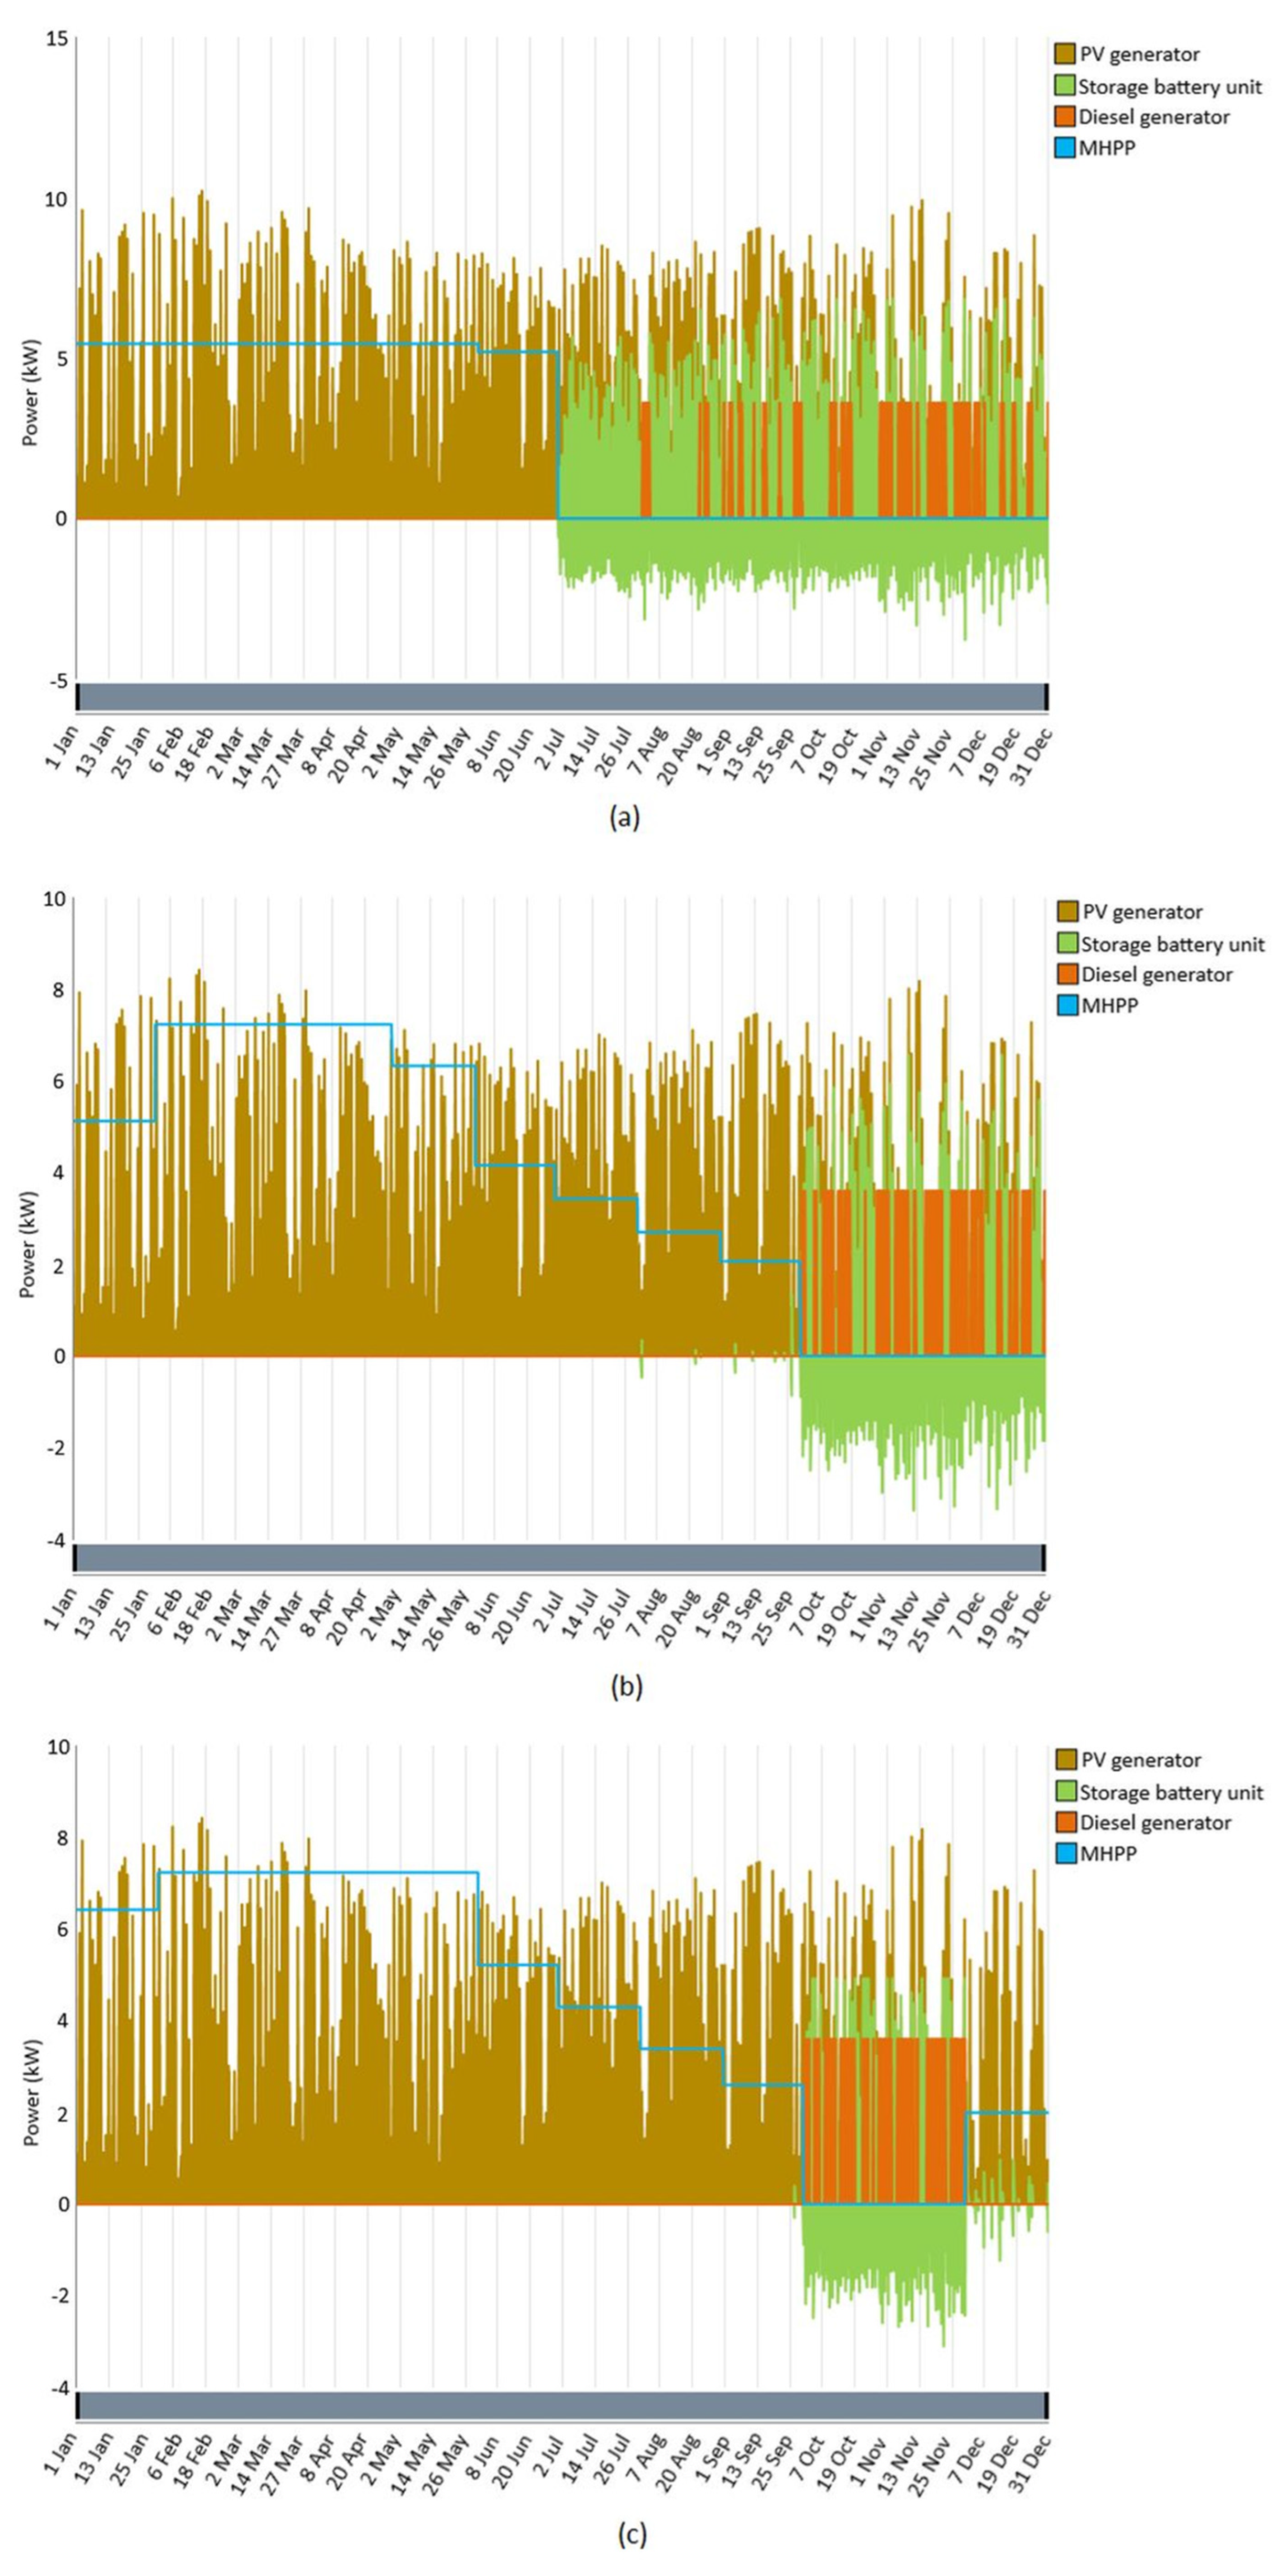
| 1 * | 5.44 | / | 3.6 | 3 | 2.71 | 3 |
| 1 ** | / | 12.2 | 3.6 | 9.02 | 4.42 | 3.2 |
| 2 * | 7.23 | / | 3.6 | 2.73 | 2.7 | 2.73 |
| 2 ** | / | 12.2 | 3.6 | 9.02 | 4.42 | 3.2 |
| 3 * | 7.23 | / | 3.6 | 2.73 | 2.66 | 2.73 |
| 3 ** | / | 12.2 | 3.6 | 9.02 | 4.42 | 3.2 |
| Pollutant | Emissions (kg/Year) | ||
|---|---|---|---|
| Case 1 | Case 2 | Case 3 | |
| Carbon dioxide | 848 | 835 | 737 |
| Carbon monoxide | 5.29 | 5.21 | 4.6 |
| Unburned hydrocarbons | 0.233 | 0.23 | 0.203 |
| Particulate matter | 0.0317 | 0.0313 | 0.0276 |
| Sulphur dioxide | 1.71 | 1.69 | 1.49 |
| Nitrogen oxides | 4.98 | 4.9 | 4.33 |
| Total | 860.25 | 847.06 | 747.65 |
| Study or Reference | Total NPC ($) | Levelized COE ($/kWh) | Total Annual Electricity Generation (kWh/Year) | Main Source of Electricity Generation (kWh/Year) |
|---|---|---|---|---|
| This study, Case 3 | 33,683 | 0.288 $/kWh | 50,090 | MHPP 38,399 |
| [4] | 70,042 | 0.278 $/kWh | 25,515 | MHPP 15,493 |
| [8] | 113,201 | 0.054 $/kWh | 227,504 | MHPP 189,262 |
| [9] | 963,431 | 0.112 $/kWh | 1,518,895 | MHPP 1,178,600 |
| [10] | / | 0.131–0.206 $/kWh | / | / |
| [11] | 997,334 | 0.133 $/kWh | / | MHPP 497,075 |
| [38] | 316,827 | 0.566 $/kWh | 55,344 | MHPP 45,144 |
| [39] | 6,804,257 | / | 101,572 | MHPP 55,885 |
| [40] | 2,650,126 | 0.5611 $/kWh | 620,002 | MHPP 508,874 |
Disclaimer/Publisher’s Note: The statements, opinions and data contained in all publications are solely those of the individual author(s) and contributor(s) and not of MDPI and/or the editor(s). MDPI and/or the editor(s) disclaim responsibility for any injury to people or property resulting from any ideas, methods, instructions or products referred to in the content. |
© 2023 by the authors. Licensee MDPI, Basel, Switzerland. This article is an open access article distributed under the terms and conditions of the Creative Commons Attribution (CC BY) license (https://creativecommons.org/licenses/by/4.0/).
Share and Cite
Tomović, M.; Gajić, M.; Klimenta, D.; Jevtić, M. Optimal Design of a Hybrid Power System for a Remote Fishpond Based on Hydro-Turbine Performance Parameters. Electronics 2023, 12, 4254. https://doi.org/10.3390/electronics12204254
Tomović M, Gajić M, Klimenta D, Jevtić M. Optimal Design of a Hybrid Power System for a Remote Fishpond Based on Hydro-Turbine Performance Parameters. Electronics. 2023; 12(20):4254. https://doi.org/10.3390/electronics12204254
Chicago/Turabian StyleTomović, Milan, Milena Gajić, Dardan Klimenta, and Miroljub Jevtić. 2023. "Optimal Design of a Hybrid Power System for a Remote Fishpond Based on Hydro-Turbine Performance Parameters" Electronics 12, no. 20: 4254. https://doi.org/10.3390/electronics12204254
APA StyleTomović, M., Gajić, M., Klimenta, D., & Jevtić, M. (2023). Optimal Design of a Hybrid Power System for a Remote Fishpond Based on Hydro-Turbine Performance Parameters. Electronics, 12(20), 4254. https://doi.org/10.3390/electronics12204254