Article

A Linear Quadratic Regression-Based Synchronised Health Monitoring System (SHMS) for IoT Applications

1
Department of Computer Science & Engineering, ABES Engineering College, Ghaziabad 201009, India
2
Department of Computer Science, College of Arts and Sciences, Prince Sattam bin Abdulaziz University, Wadi Aldawaser 11991, Saudi Arabia
3
Big Data and Machine Learning Lab, South Ural State University (National Research University), 454080 Chelyabinsk, Russia
*
Authors to whom correspondence should be addressed.
Electronics 2023, 12(2), 309; https://doi.org/10.3390/electronics12020309
Submission received: 1 November 2022 / Revised: 13 December 2022 / Accepted: 22 December 2022 / Published: 6 January 2023
(This article belongs to the Special Issue AI Technologies and Smart City)

Abstract

:
In recent days, the IoT along with wireless sensor networks (WSNs), have been widely deployed for various healthcare applications. Nowadays, healthcare industries use electronic sensors to reduce human errors while analysing illness more accurately and effectively. This paper proposes an IoT-based health monitoring system to investigate body weight, temperature, blood pressure, respiration and heart rate, room temperature, humidity, and ambient light along with the synchronised clock model. The system is divided into two phases. In the first phase, the system compares the observed parameters. It generates advisory to parents or guardians through SMS or e-mails. This cost-effective and easy-to-deploy system provides timely intimation to the associated medical practitioner about the patient’s health and reduces the effort of the medical practitioner. The data collected using the proposed system were accurate. In the second phase, the proposed system was also synchronised using a linear quadratic regression clock synchronisation technique to maintain a high synchronisation between sensors and an alarm system. The observation made in this paper is that the synchronised technology improved the performance of the proposed health monitoring system by reducing the root mean square error to 0.379% and the R-square error by 0.71%.

1. Introduction

The Internet of things (IoT) is a crucial technological innovation in networking. IoT has brought limitless prospects and influenced daily life [1,2,3,4]. It will bring a revolution in healthcare and biomedical infrastructure. A reliable and accurate IoT-based healthcare monitoring system is a challenging goal in modern-day society [5]. The need to provide good-quality healthcare to the people by reducing cost, improving accuracy, and fulfilling the insufficiency of the medical staff are important reasons to worry.
The UNICEF report [6] in the year 2016 stated that India is among the riskiest countries for neonates. According to a study by UNICEF, a government with a low-income level has a higher health mortality rate. Providing quality care to patients by reducing the cost and shortages of nursing supervisors is the primary concern. Recent global population aging and the pervasiveness of chronic illnesses are also becoming major issues [7]. Premature birth also results in a high chance of prolonged run diseases influencing the child and caretaker [8,9,10].
The health monitoring system provides nursing and crucial care for infants. The Internet of things (IoT) is considered a revolution for information and communication technology as it happened at the beginning of the 21st century [11]. It provides a platform to connect sensors, databases, and other devices to the Internet. It enables a global infrastructure for physical networked architecture working on the web [12]. The architecture should be highly synchronised and accurate to deploy the IoT for critical applications, such as health monitoring systems.
The proposed system’s main aim is to provide a simple, economic, multifunctional, and convenient health monitoring system that can constantly take readings of various parameters and provide information about patients’ health conditions. The health monitoring system comprises parameters such as body temperature, heartbeat, room temperature, humidity, etc. The sensors calculating the above-stated parameters are connected to a central processing unit (CPU). The CPU processes the acquired data and displays them on a monitor using a graphical user interface. It also stores the data in the health report, which plots the data to show the variations of various parameters and the number of times the value occurred (frequency). Thus, the main contribution of this paper can be summarised as follows.
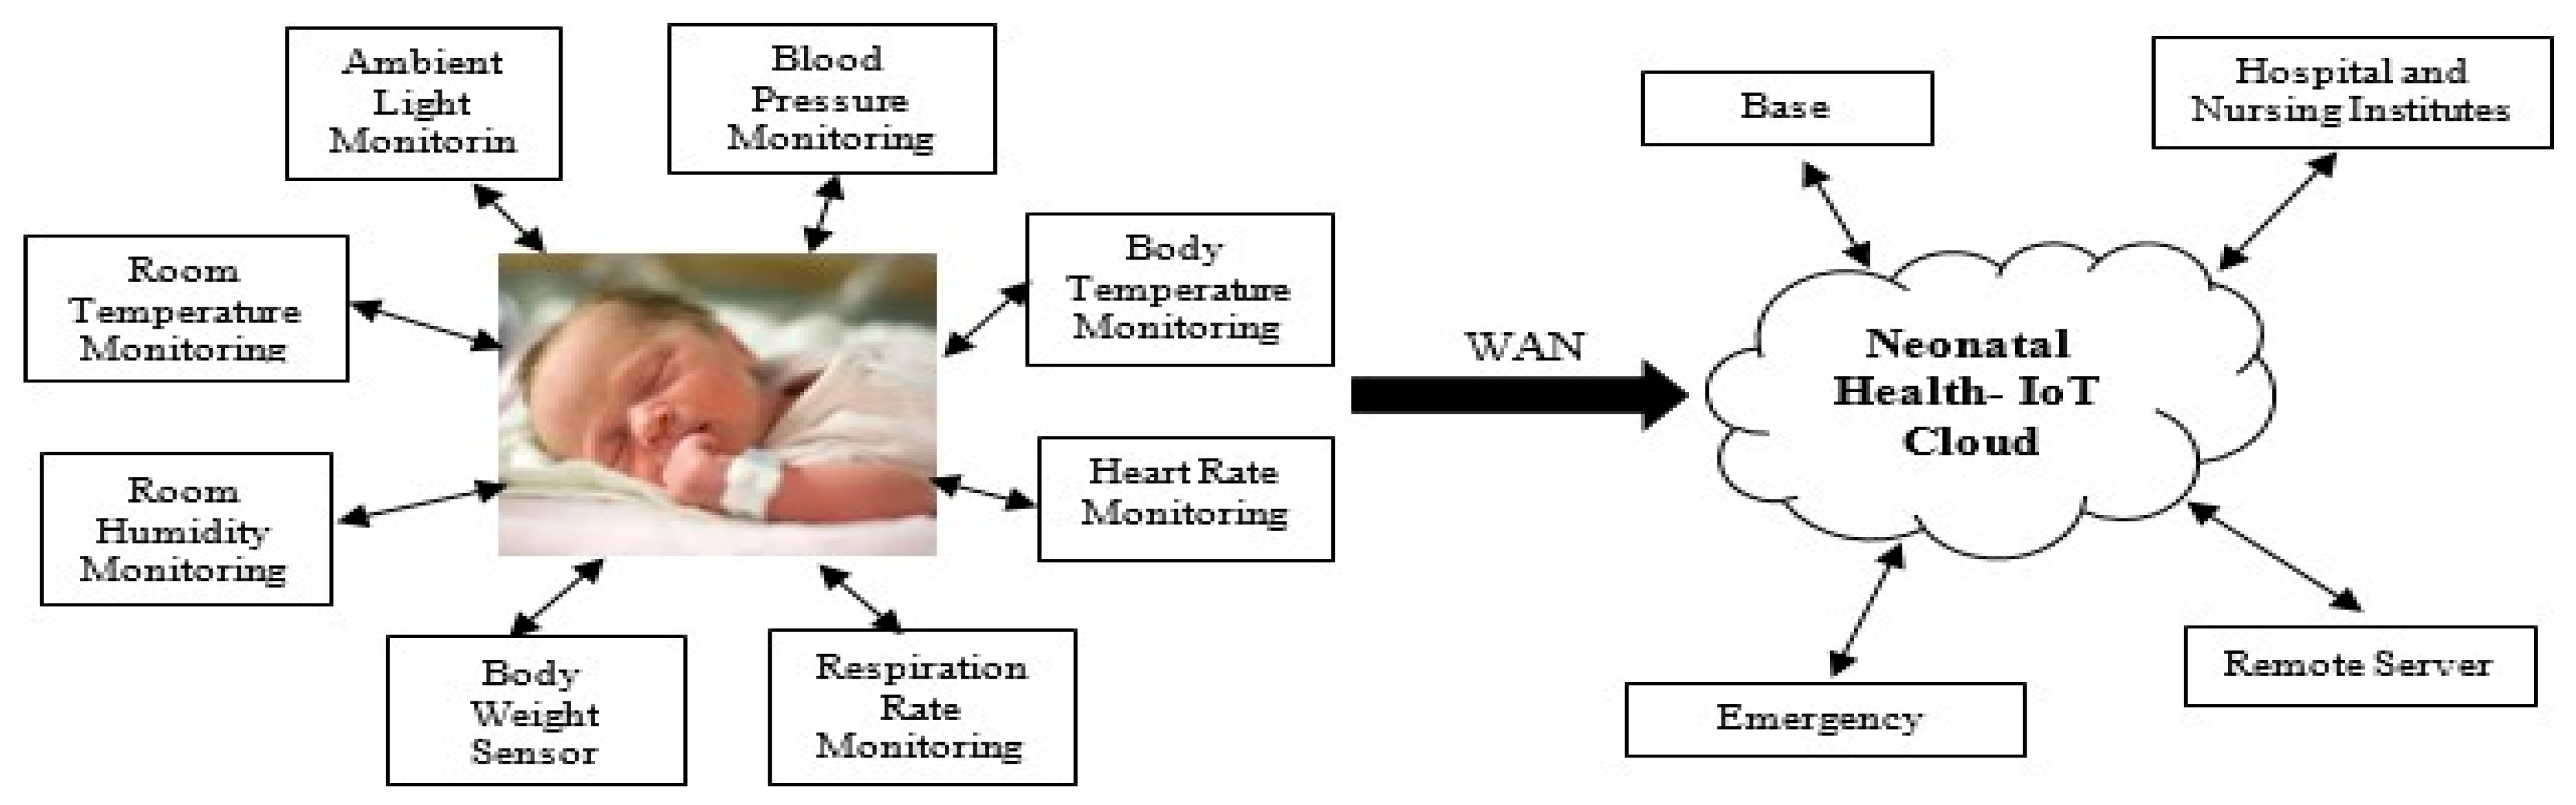
  • This paper aims to design an efficient IoT-aware health monitoring system that leverages the characteristics of various body and room sensors at the physical layer. It helps provide efficient nursing care while sustaining the quality of services at the application layer.
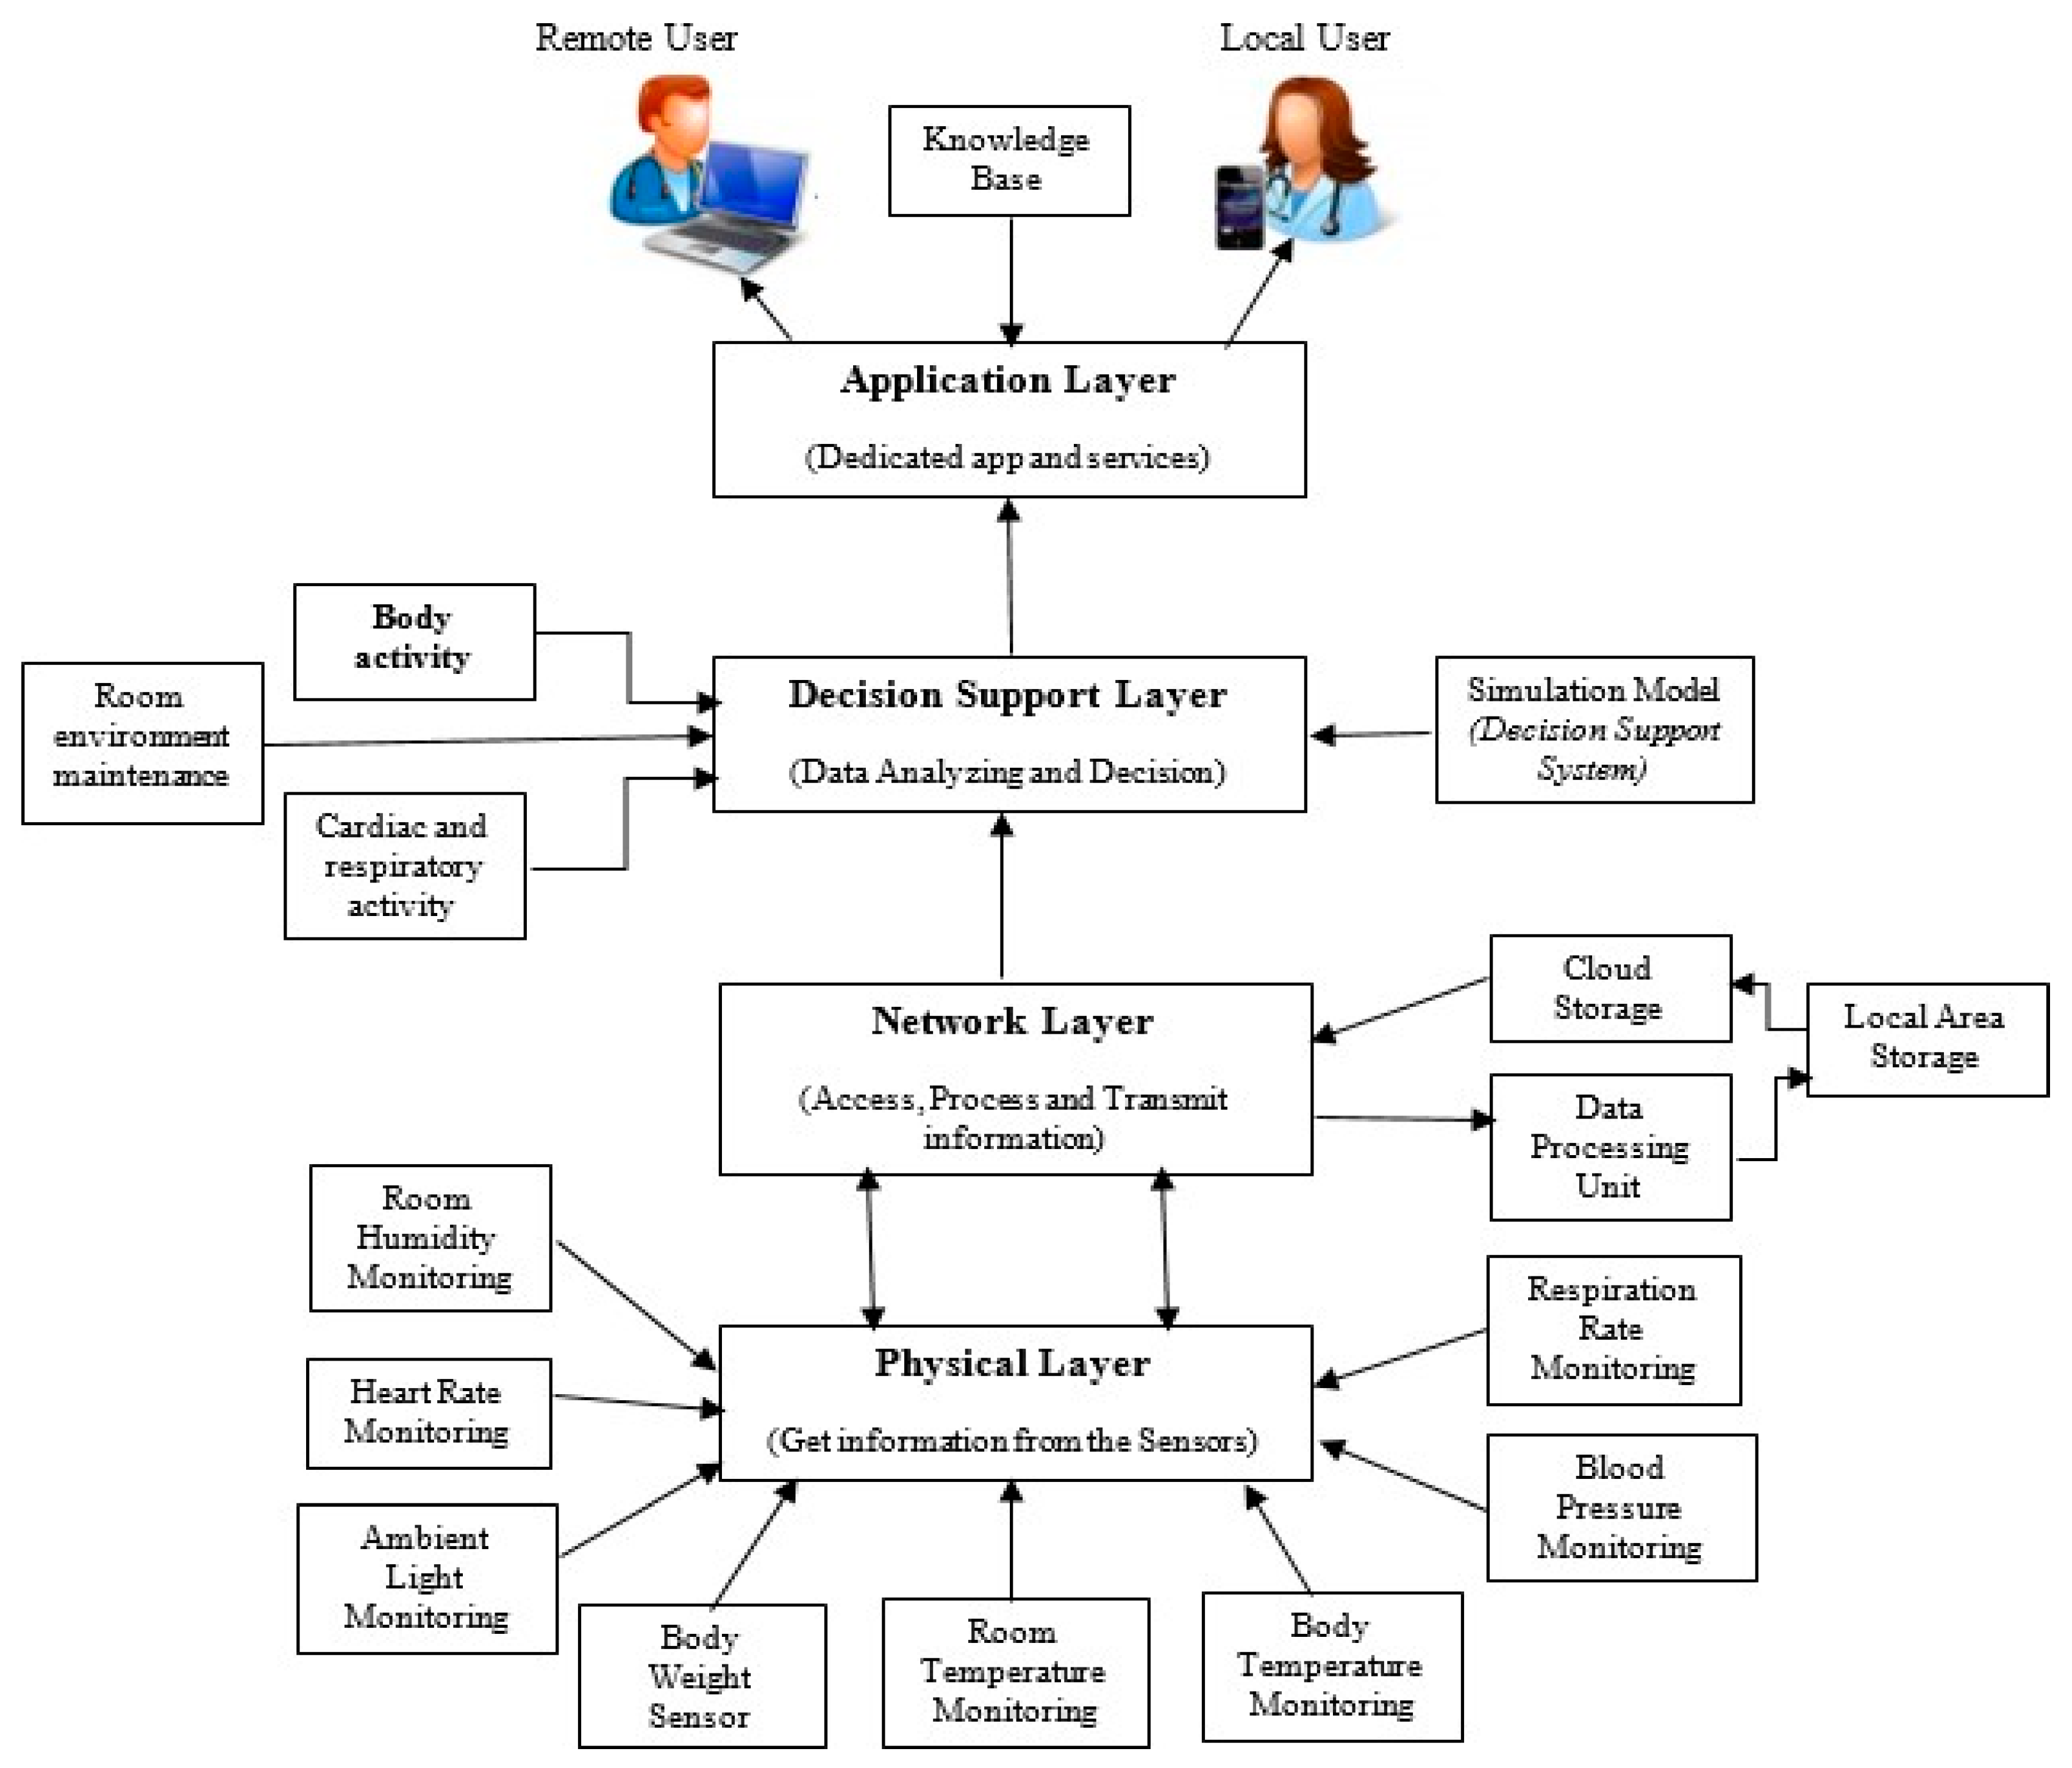
  • Deployment of a network-layered architecture includes generating data at the physical layer to access, process, and transmit data at the network layer for analysis and decision-making at the decision-support layer, and application support for health care practitioners and patient caretakers.
  • Analytical proof that the proposed system results in increased healthcare facilities and reduces the effort of the medical consultants. The data collected during the process are also accurate and will be analysed.
  • The proposed system is also reviewed through simulations discussing the collected and actual data during the monitoring process. The results observed the proposed solution’s gain and ease of use.
Further, the paper is arranged in various sections. Section 2 presents the motivation and literature survey behind the research. Section 3 gives an overview of the IoT-based health monitoring system architecture. Section 4 analyses the sensors deployed during the experimental setup for the proposed approach. The sensors were analysed based on their performance and accuracy in patient data collection. It also discusses the clock synchronisation issues and an adaptive non-linear clock synchronisation technique. The research is concluded in Section 5.

2. Literature Review

Recent technological advancements have opened gates for deploying devices to make intelligent environments. Specifically, in medical sciences, various sensors are developed to measure vital signs such as body temperature, pressure, movement, ECG, heart rate, etc. This development motivates the design of innovative facilities capable of improving the patient’s healthcare. Among the various research activities presented in the literature, those related to using sensors for health care and told to synchronise time between the sensors of WSNs are mainly focused. In [13], an intelligent WSN is presented for nursing patients’ monitoring, tracking, and localisation facilities within health care and nursing institutions. In [14], architecture for automatic tracking and monitoring of patients is presented based on the RFID, 6LoWPAN, WSN, and constrained application protocol.
Additionally, established literature related to the sensors and WSNs are implemented to meet the definite requirements for ongoing health care. In [15], an automatic health monitoring system is presented based on WSN sensors and mobile cloud computing (SMCC). It can detect hyperthermia, hypothermia, cardiac issues, and irregular body movements. It also provides information on Android-based applications and stores the data in the cloud. In [16], a WSN-based reliable jaundice detection system is presented. The system was implemented for healthcare industries and intensive care units (NICU). An integrated monitoring system [17] for women is introduced using mobile cognitive radio and body sensors. These are connected to a WSN. Wireless sensor networks are also deployed to analyse bioelectric signals produced by the human body. This deployment’s significant problems are energy consumption and radioelectric interference since these networks consist of small and limited nodes. In [18], two different priority schemes were proposed to improve the performance of these networks. They consist of reducing the number of transmissions from low-energy nodes and prioritising data toward the sink node for fast and efficient processing.
A survey on the state-of-the-art of radio frequency identification (RFID) is discussed by Sara A. [19]. It is applied to body-centric systems for collecting data related to the living environment of user-based on temperature, various gases, and humidity.
A physical layer data-specific transceiver design for healthcare IoT applications is proposed by [20] that inherits generated information characteristics and reduces data transmitted with overheads. It also maintains the quality-of-service requirements of the application. Various data compression techniques were also analysed to improve e-health applications. A codebook-based online single-data compression technique is applied to monitor patients’ health using wearable devices [21]. It will help in representing data patterns efficiently. Another lossy compression algorithm for biometric signals is analysed in ECG [22] data using auto-encoders. A mental disorder monitoring system using EEG [23] data are examined for lightweight 1.5-D multi-channel compression. A remote patient monitoring system for lossy compression techniques using multidimensional bio-medical signals is anticipated [24] using linear prediction based on the codebook approach.
Publication No.US20160015277 [25] relates the method of video evaluation of a patient for the heart rate and respiration rate under dim light or at night. This device comprises a video camera along with a source of infrared light. It evaluates the patient’s heart rate and respiratory rate using plethysmograph analysis. Patil and Mhetre [26] discuss the patient monitoring system based on the GSM network, working only in the emergency case or when the parameter value is out of the described range. It does not store the benefits of health parameters as it is designed over a microcontroller PIC18F4520 which does not provide space to store the health parameter values. De et al. [15] present a sensor–mobile cloud computing system for automatic neonatal health monitoring.
The article [27] discussed essential parameters for monitoring a newborn’s health, such as sleeping activity, oxygen level, respiration patterns, etc., necessary for ensuring salubriousness for their health. This approach lets parents observe the patient and ensure their good health. Another article [28] presents critical parameters such as body temperature, pulse rate, and moisture for monitoring patient health. It also presents the storage for measured values on the cloud with suitable security. In [29], a low-cost incubator for monitoring premature baby health is proposed. It majors the critical health parameters in real-time. It automatically sends the alerts and immediately takes necessary actions to safeguard babies. IoT-based flexible, pervasive, intelligent healthcare platforms for various healthcare, physiological, and environmental parameters monitoring are discussed in [30,31,32]. Sun et al. defined a privacy-aware and lightweight fine-grained access control mechanism for IoT-oriented smart health [33].
As all the above, the discussed research focuses on designing a smart and intelligent healthcare system for monitoring and analysing patients. There is still much scope for improvement in the techniques used for data exchange between the monitoring and analysing devices. A strong, synchronised patient healthcare system is a requirement in high demand.

3. Architecture Overview

This paper aims to design a reliable, accurate, and IoT-based health monitoring system. The system visualises a real-time environment by collecting the patient’s body parameters and providing them to the control centre. The data collected are analysed at the decision support layer. Accordingly, alert or warning messages are sent in case of emergency. Figure 1 and Figure 2 illustrate the sensor deployment and network architecture for the IoT-based health monitoring system. It comprises sensors to monitor body temperature, respiration, heart rate, blood pressure, room temperature, humidity, and ambient light. The data collected in real-time are transmitted to the IoT cloud for storage and further action. Hospitals, nursing institutes, and emergency centres are connected to the cloud. In case of any emergency, it generates alerts and warning messages which are communicated via mobile applications.
The network layer is connected to the processing unit for processing collected data and storage devices. After processing the data, the network layer transmits the data to the decision support layer. In this layer, the decision regarding the health of the patient is simulated. The choice is based on body activity, heart/respiratory activities, and room environment. An alert or a warning message will be generated based on data collected within 30 s. The messages are then transmitted to the application layer for further processing. The application layer then sends information to a local or remote user based on its knowledge base.
Figure 3 presents the working schema that depicts the network component and a communication protocol to connect the components. Figure 4 shows the GUI for the mobile application of the proposed health monitoring system. Figure 5 presents the proposed WSN-based IoT setup along with sensors for collecting the data. The structure was arranged using Raspberry Pi and various body and room sensors. The system presented here is the functional layout of the physical layer. As shown in Figure 2, this layer is responsible for collecting data and gathering information. These data are then transmitted to the network layer. At the network layer, the reading obtained is stored in a database and processed accordingly. A wireless ZigBee XBP24-ZB architecture is used to transmit readings through the gateway to the cloud database. Table 1 presents the specification of the proposed WSN architecture.
The application layer is classified based on various factors such as the health monitoring business model, the network used, availability, coverage, heterogeneity, and real-time data requirements. Table 2 presents the characteristics of the smart health monitoring application domain. Significant factors are network connectivity, network size, and bandwidth requirements.
The decision support layer provides management services to the above layer. It provides an operational support system service analytical platform, including statistical analysis, data mining, etc. It also performs periodic IoT data filtering and triggers periodic events based on sensor data, which may require immediate response and delivery. The network layer focuses on communication technologies. Routers, switches, and hubs are required to transmit a massive volume of IoT data to the storage or cloud. For the proposed system, a LAN relates to a microcontroller for transmission.
Finally, the physical layer comprises sensors and intelligent devices for collecting information.
Section 5 discusses the deployment of sensors and their analysis at the physical layer.

4. Results and Analysis of the Health Monitoring System

The proposed system is deployed in two phases: the health monitoring system and synchronising the clock skew of the system.

4.1. Phase 1: Health Monitoring System Analysis

The proposed system was deployed for collecting real-time patient body data and was analyzed in terms of accuracy. The sensors’ performance was observed to be highly accurate and operated at low voltage. It was also observed that these sensors are designed to reduce errors and save power. This section analyses the data collected and the accuracy calculated of temperature, heart rate, and humidity sensors. MAX30205 was used to gather the body temperature. The data are collected daily at regular intervals. Figure 6 presents a small range of data collected for body temperature on 20 November between 1:35 PM and 1:45 PM. The sensor converts the measured temperature into a digital form using a sigma–delta analogue to a digital converter. The sensor was observed as highly accurate, with an accuracy of 0.1 °C between 37 °C and 39 °C. It has a temperature resolution of 16 bits and operates at a supply voltage ranging from 2.7 V to 3.3 V. Figure 6 presents the graphs between the operating characteristics between accuracy and temperature for the deployed human body temperature sensor.
The accuracy is calculated using the sensor’s value and the actual value of the body temperature. The accuracy is defined as the amount of measurement of uncertainty concerning the absolute value. Here, accuracy conditions consist of the effect of errors due to balancing and gaining parameters. The accuracy of the system is evaluated using (1):
Accuracy = Actual   Value ( Actual Observed ) Value Actual   Value
In Figure 7a–c, the sigma error presents a value to quantify the variation in the dataset representing the relationship between accuracy and temperature and 3-sigma defines upper and lower control limits within three deviations from the mean. The PC-3147 heart rate sensor is deployed for collecting the data. It measures the pulse rate ranging from 0 to 200 bpm with a resolution of 1 bpm. This sensor transmits the light level through the vascular tissues in the ear lobe or fingertips. It measures the variation in the intensity of light absorbed in the blood due to changes in tissues. Figure 8 presents the sensor’s real-time data on ten days ranging from 12 December to 21 December at around 1:35 PM daily. The data collected are vast. Figure 9 presents the light-absorbing property of hemoglobin for measuring the heart rate.
Another sensor used for measuring room temperature and humidity is DHT11. It includes a resistive-type component for humidity measurement and an element based on NTC for temperature measurement.
It relates to a high-performance 8-bit microcontroller to provide fast response, excellent quality, and anti-interference ability, and it is cheap. DHT11 is highly accurate in calibrating humidity. Table 3 presents the operational characteristics analysed during the deployment of DHT11 for humidity and temperature. Figure 10 shows the graphs between the data collected for room humidity and temperature. Equation (1) is used to calculate the accuracy of DHT11.
Data were collected using a PC-3147 heart rate sensor based on light absorption level.

4.2. Phase 2: Synchronising the Clock Skew of the Monitoring System

The Internet of things (IoT) is likely to impact the day-to-day life of its users by empowering the exchange of data among pervasive stuff over the Internet. Such a broad objective puts limitations on health monitoring applications demanding clock-synchronised sensor networks for sequential data ordering and synchronous execution of medical-related operations. The existing clock synchronisation solution, such as the network time protocol, is to resource constraint devices. Therefore, for resource constraint devices, various clock synchronisation methods are derived, as illustrated in [22,24,27]. These clock synchronisation solutions will help improve the performance and accuracy of IoT-based health monitoring systems. The data set collected on various patients at different times using the proposed health monitoring system was used for analysis.
This paper emphasises the clock synchronisation problem for WSNs. Important clock parameters resulting in synchronisation errors are offset, skewed and network delayed. Clock skew is the difference in the tick duration of two or more clocks. It can also be measured as the offset’s differential coefficient [35], the skew is denoted as αA, and B(t) between node A and node B at time t. It can be represented as given in and shown in (2):
α A , B ( t ) = d θ A , B ( t ) d t
where θA and θB(t) represent the clock offset value, defined as the time difference between two nodes, A and B. Hence, clock skew can also be calculated as given by (3):
α A , B ( t ) = θ A , B ( t + T ( t ) ) θ A , B ( t ) T ( t )
where T(t) is the sampling interval.
The value of the clock offset is calculated by implementing a two-way message-passing scheme.
By applying (2), the value of the clock skew is calculated.
As stated in [35], clock skew is dependent and sensitive to various factors such as battery power, sensor heat, etc. Therefore, it cannot be treated as a fixed random variable. Hence, it cannot be predicted using a random algorithm, such as MLE. Therefore, the linear quadratic regression-based model is applied to estimate the best possible clock skew value.

4.3. The Linear Quadratic Regression Model

The main idea behind the linear quadratic regression model is that if the sample values have a temporal correlation, then the past sample can be used to predict the present and future value of the sample. The sample value of the clock skew to be estimated can be closely approximated as a linear combination of the past sample value. The quadratic model works on a linear term, an intercept, square terms, and an interaction. The estimation coefficient can be determined by minimising the certain function of differences between the sample skew value and the estimated skew value. A scatterplot was used to define the strength of the relationship between variables. It was found that the dataset for clock skew is in a linear relationship.
The basic idea of linear estimation is that ∆αA,B(t) is approximated using its historical values (∆αA,B(t−1), ∆αA,B(t−2), …, ∆αA,B(tk)). Two symbols are defined (i) Δ α A , B ( t ) ^ , which is the estimated value of clock skew ∆αA,B(t) and (ii) et, as the estimated error between the estimated skew value Δ α A , B ( t ) ^ and real skew value ∆αA,B(t). Δ α A , B ( t ) ^ and et can be expressed as (4) and (5):
Δ α A , B ( t ) ^ = a 1 Δ α A , B ( t 1 ) + + a k Δ α A , B ( t k ) = i = 1 k a i Δ α A , B ( t i )
e t = Δ α A , B ( t ) Δ α A , B ( t ) ^ = Δ α A , B ( t ) i = 1 k a i Δ α A , B ( t i )
where ai is the skew estimation coefficient, and k is the skew estimation order. Table 3 represents the simulation parameters for the proposed linear prediction algorithm.
The proposed algorithm’s main objective is to design an IoT-based system with high reliability and accuracy by synchronising the sensors and other devices used to implement the system. The flowchart for the proposed model is represented in Figure 11.

4.4. The Linear Quadratic Regression Model for Estimating Clock Skew

Linear quadratic regression helps in modelling the relationship between a response or dependent variable and one or more estimator or independent variables x (x1xn) and z (z1zn) using (6):
y = y = β0 + β1x + β2z + e
where β0 is the y-axis intercept, β1 and β2 are the regression coefficients, and e is an error.
For “n” observed values, the linear relation can be observed, as shown in (7):
[ y 1 y 2 y n ] = [ 1 x 1 1 x 2 1 x n ] [ 1 z 1 1 z 2 1 z n ] [ β 0 β 1 ]
Y = [ y 1 y 2 y n ] ,   X = [ 1 x 1 1 x 2 1 x n ] ,   [ 1 z 1 1 z 2 1 z n ]   z = and   B = [ β 0 β 1 ]

4.4.1. Input Selection

From the given set of available input and output pairs, the linear vector and linear matrix are constructed as given in (7) and (8), respectively. The relationship can be stated as:
Y = X.Z. B

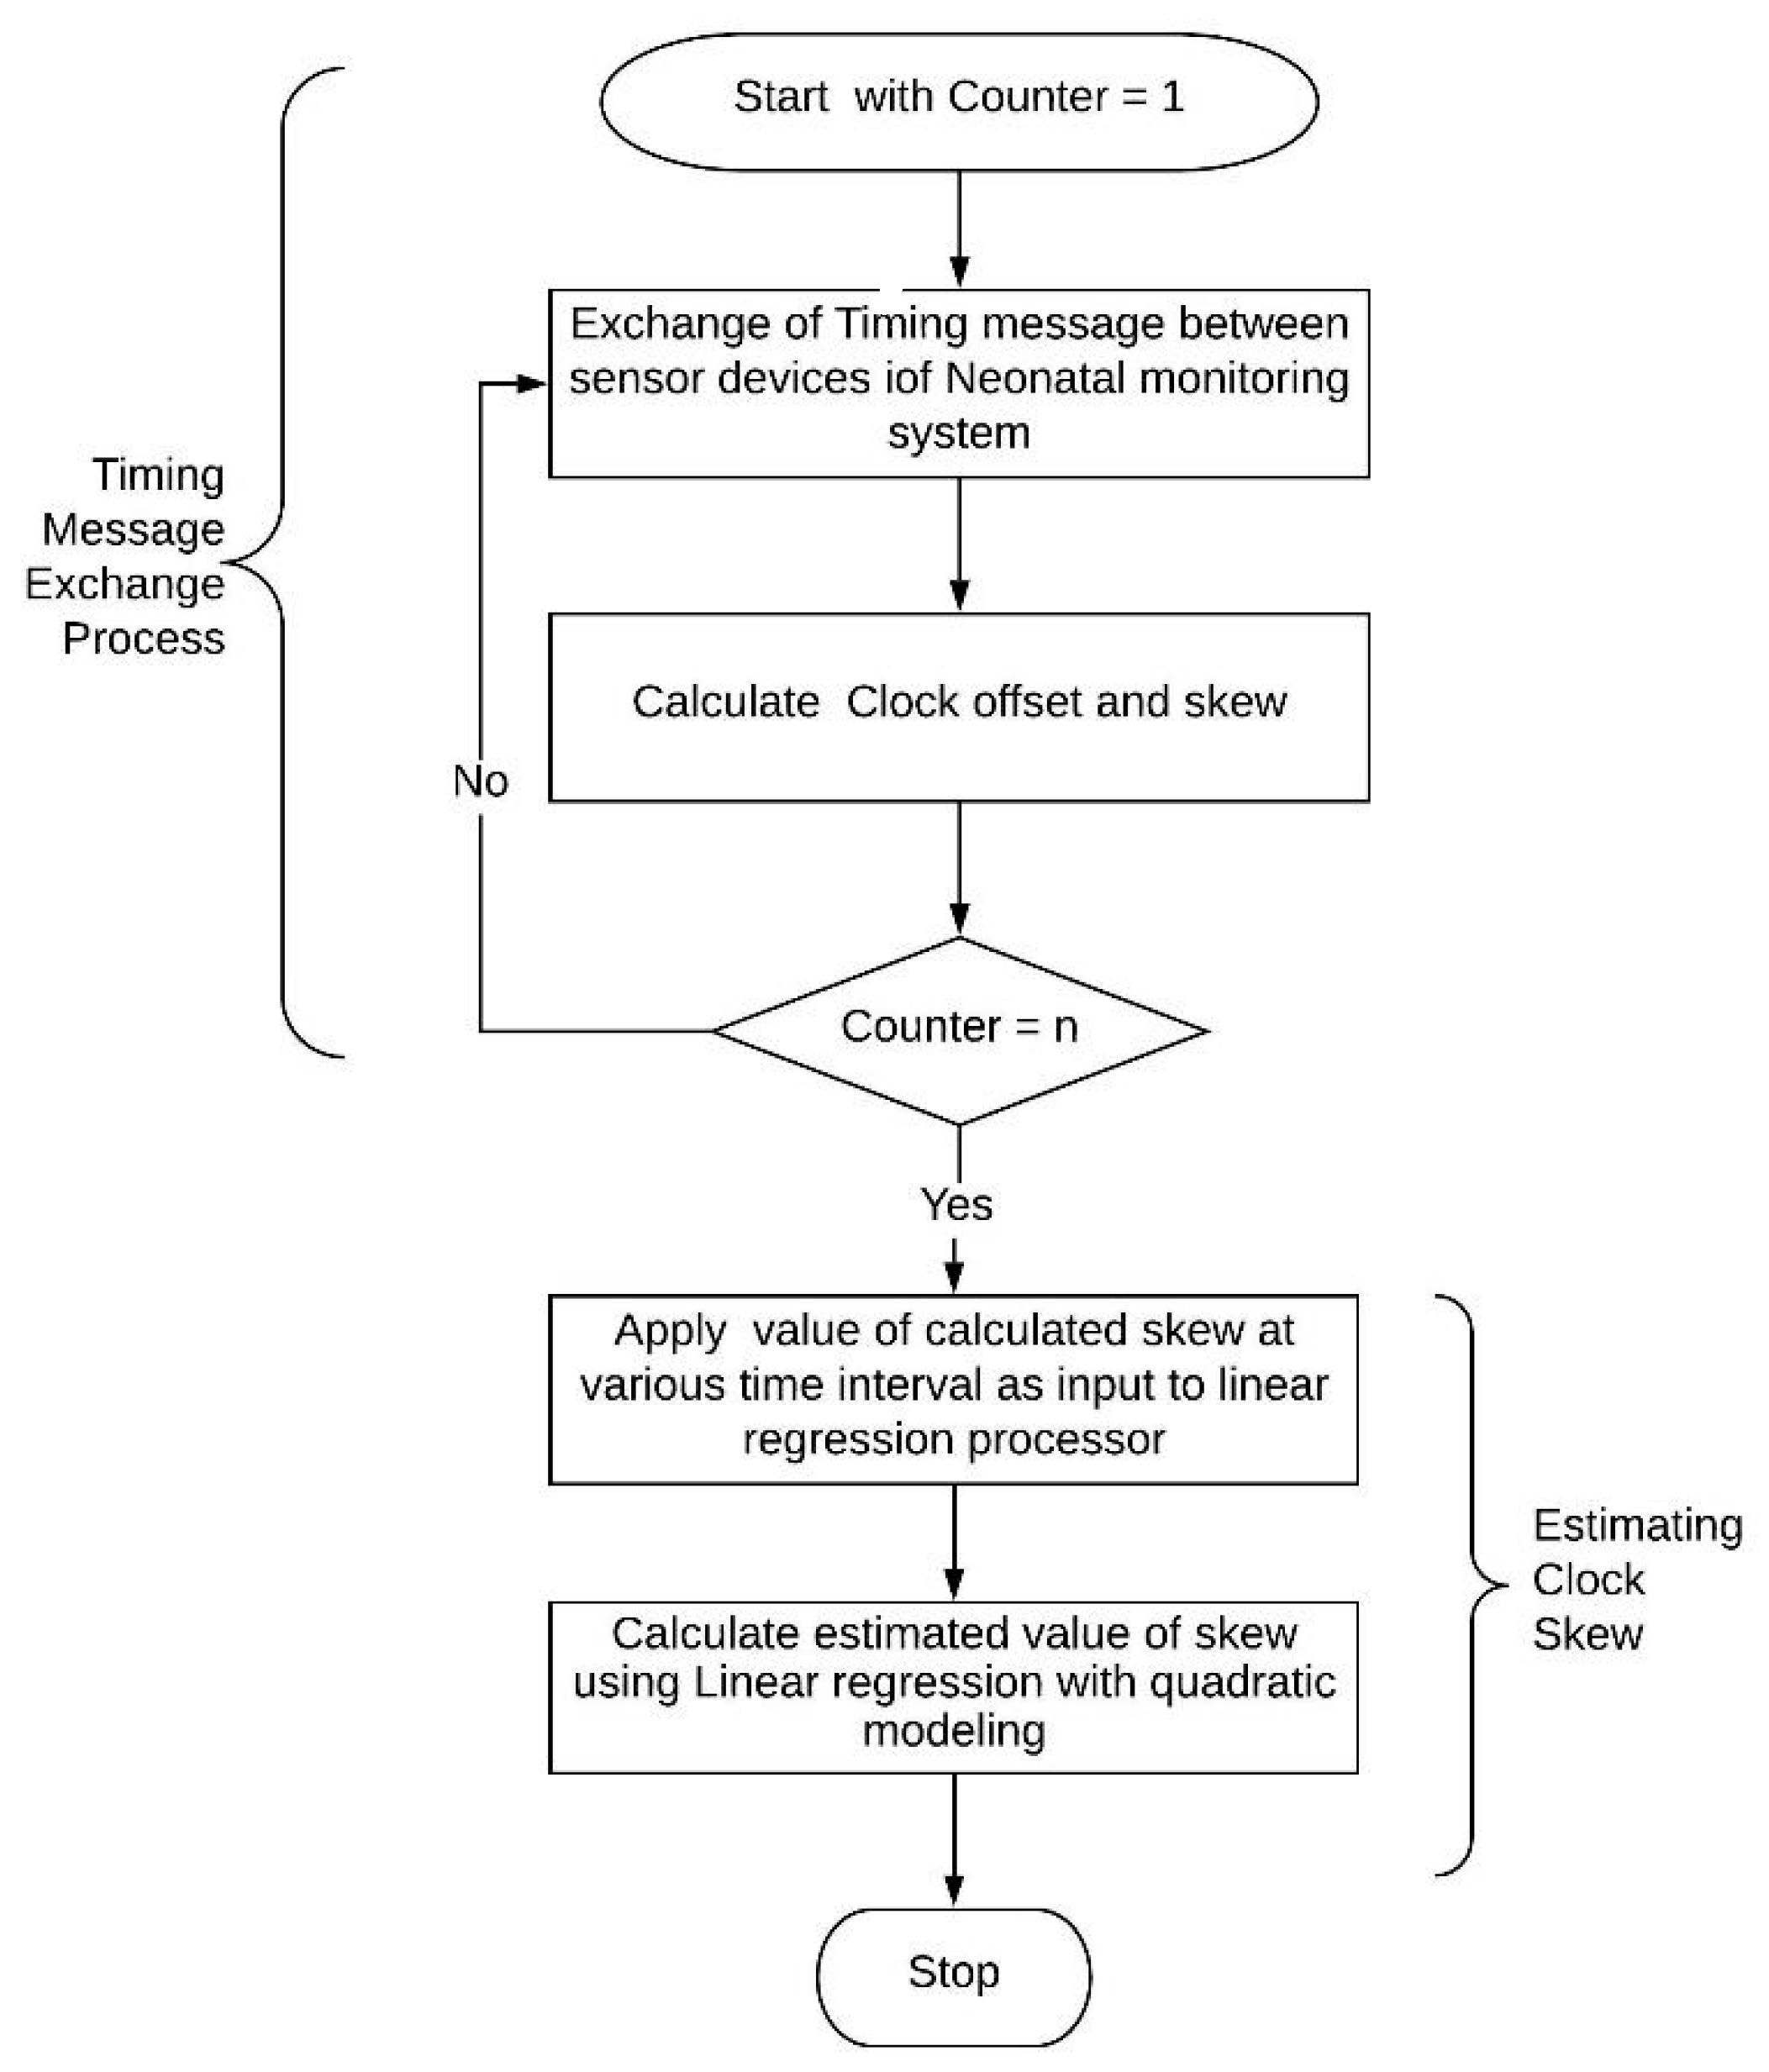
4.4.2. Algorithm for Calculating Δ α A , ( t ) ^

  • Calculate ∆αA,(t), i.e., the clock skews between two sensor nodes, A and B.
  • Apply ∆αA,(t), …, ∆αA,B(t−2)αA,B(tp−1) and t1, t2, …, tn as input to a linear quadratic regression processor.
  • Apply linear regression with quadratic type to calculate Δ α A , ( t ) ^ . The quadratic model works on a linear term, an intercept, square terms, and an interaction.
  • Output Δ α A , ( t ) ^ is obtained, as shown in Figure 12. In Figure 13, the plot between the actual and the estimated value is presented.

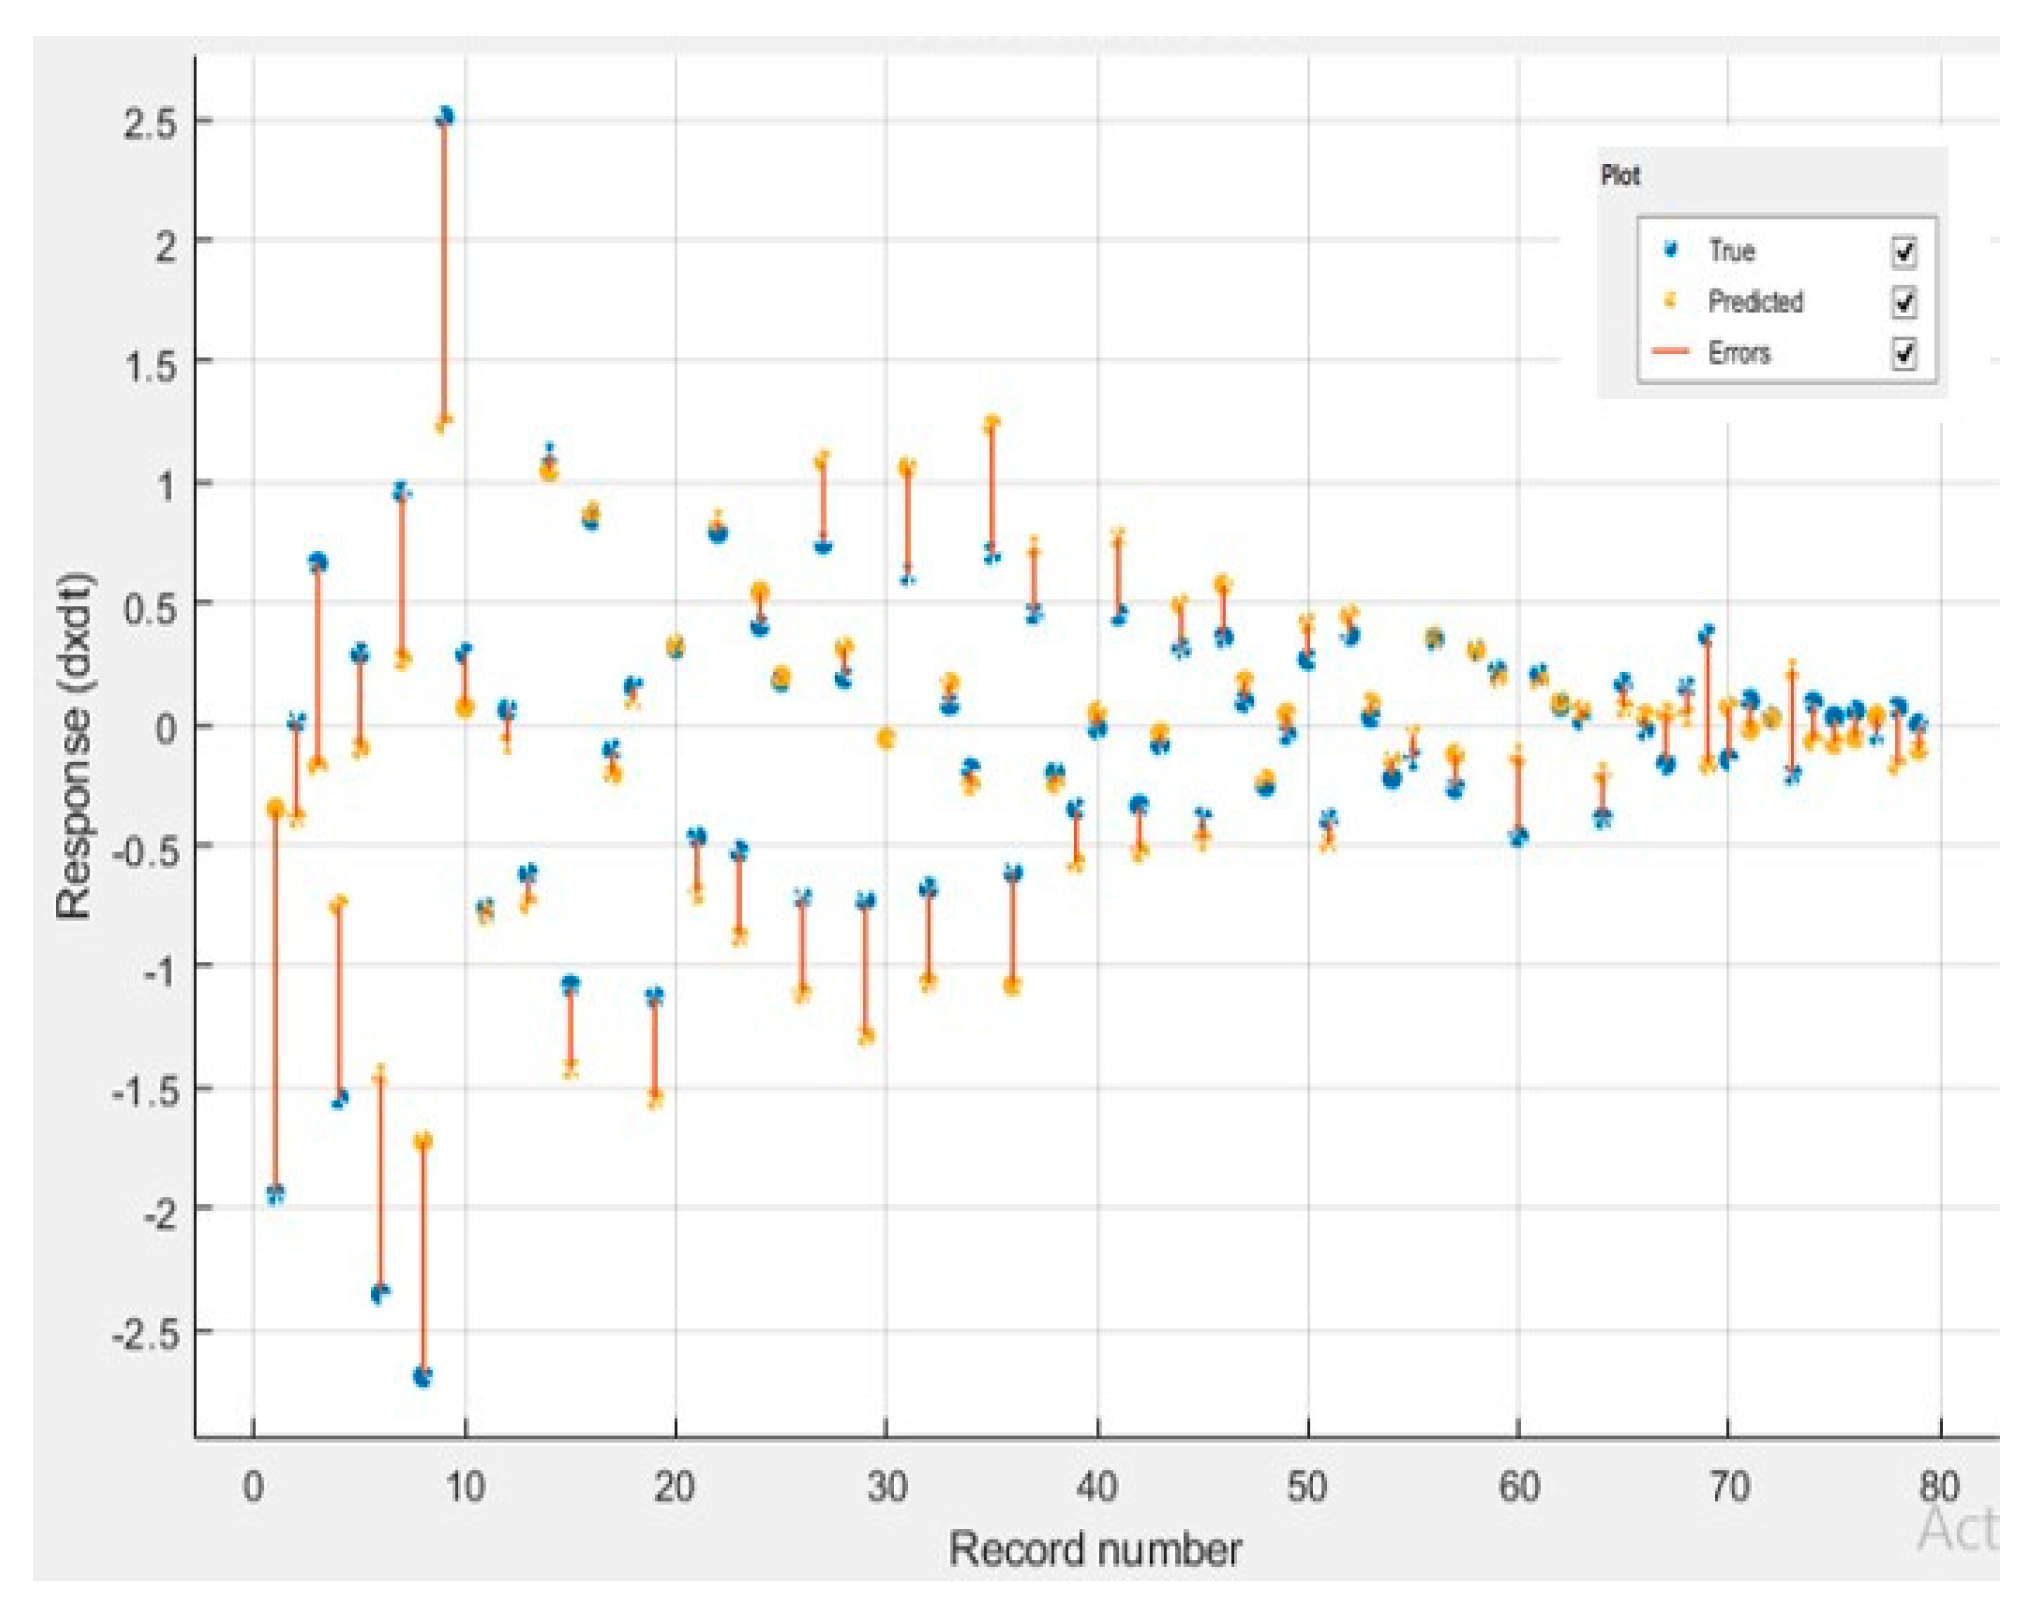
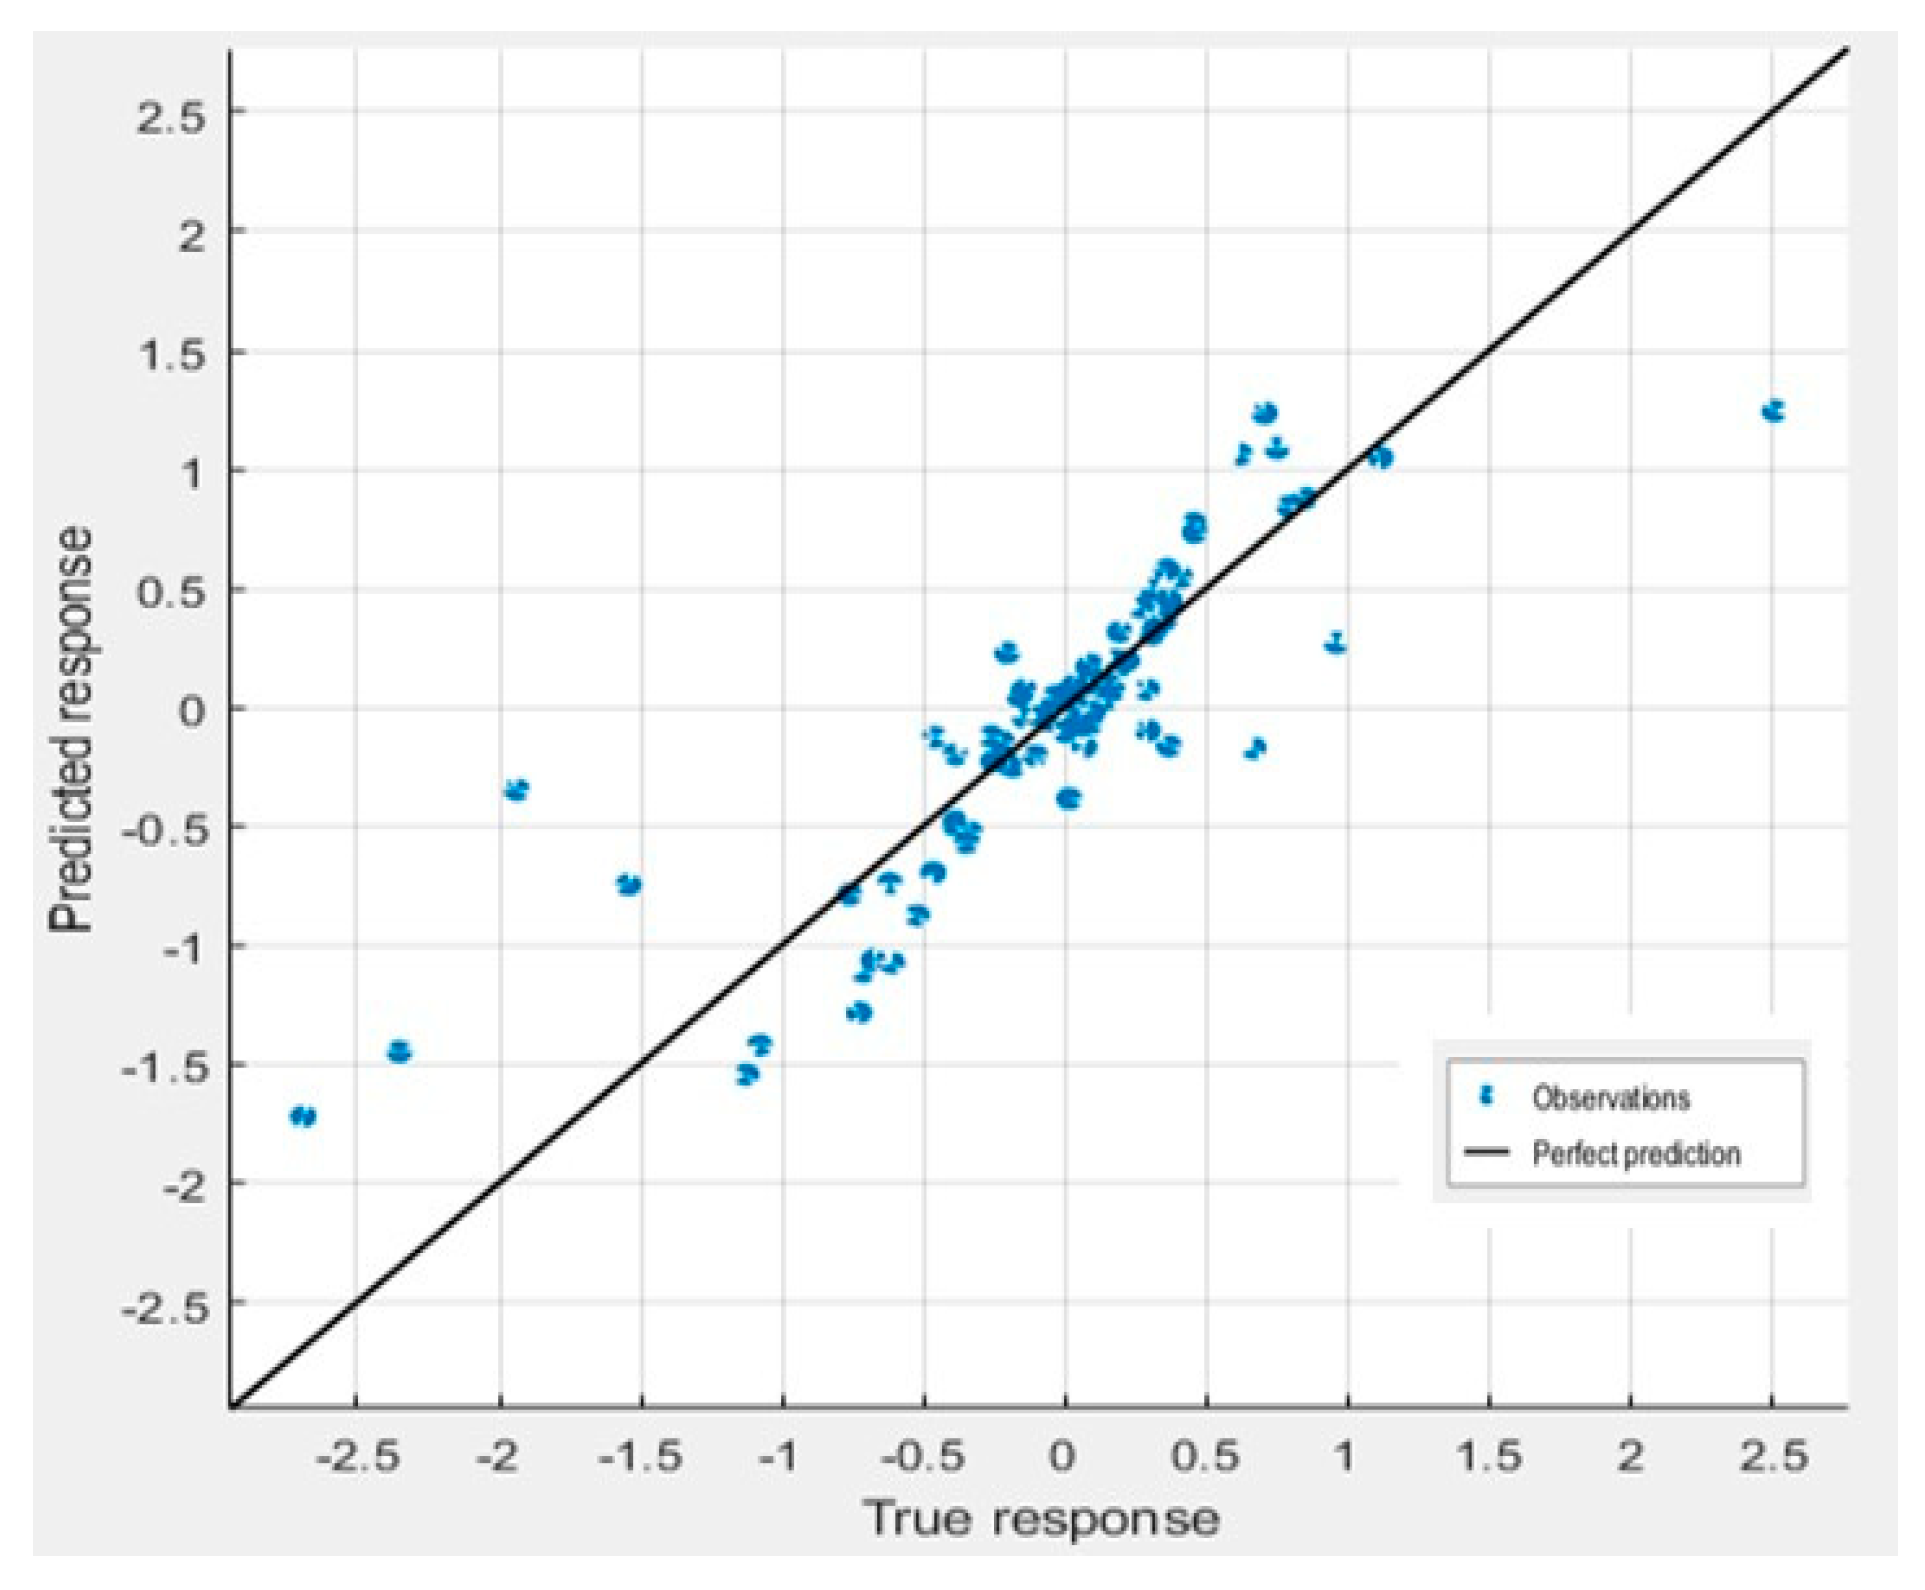
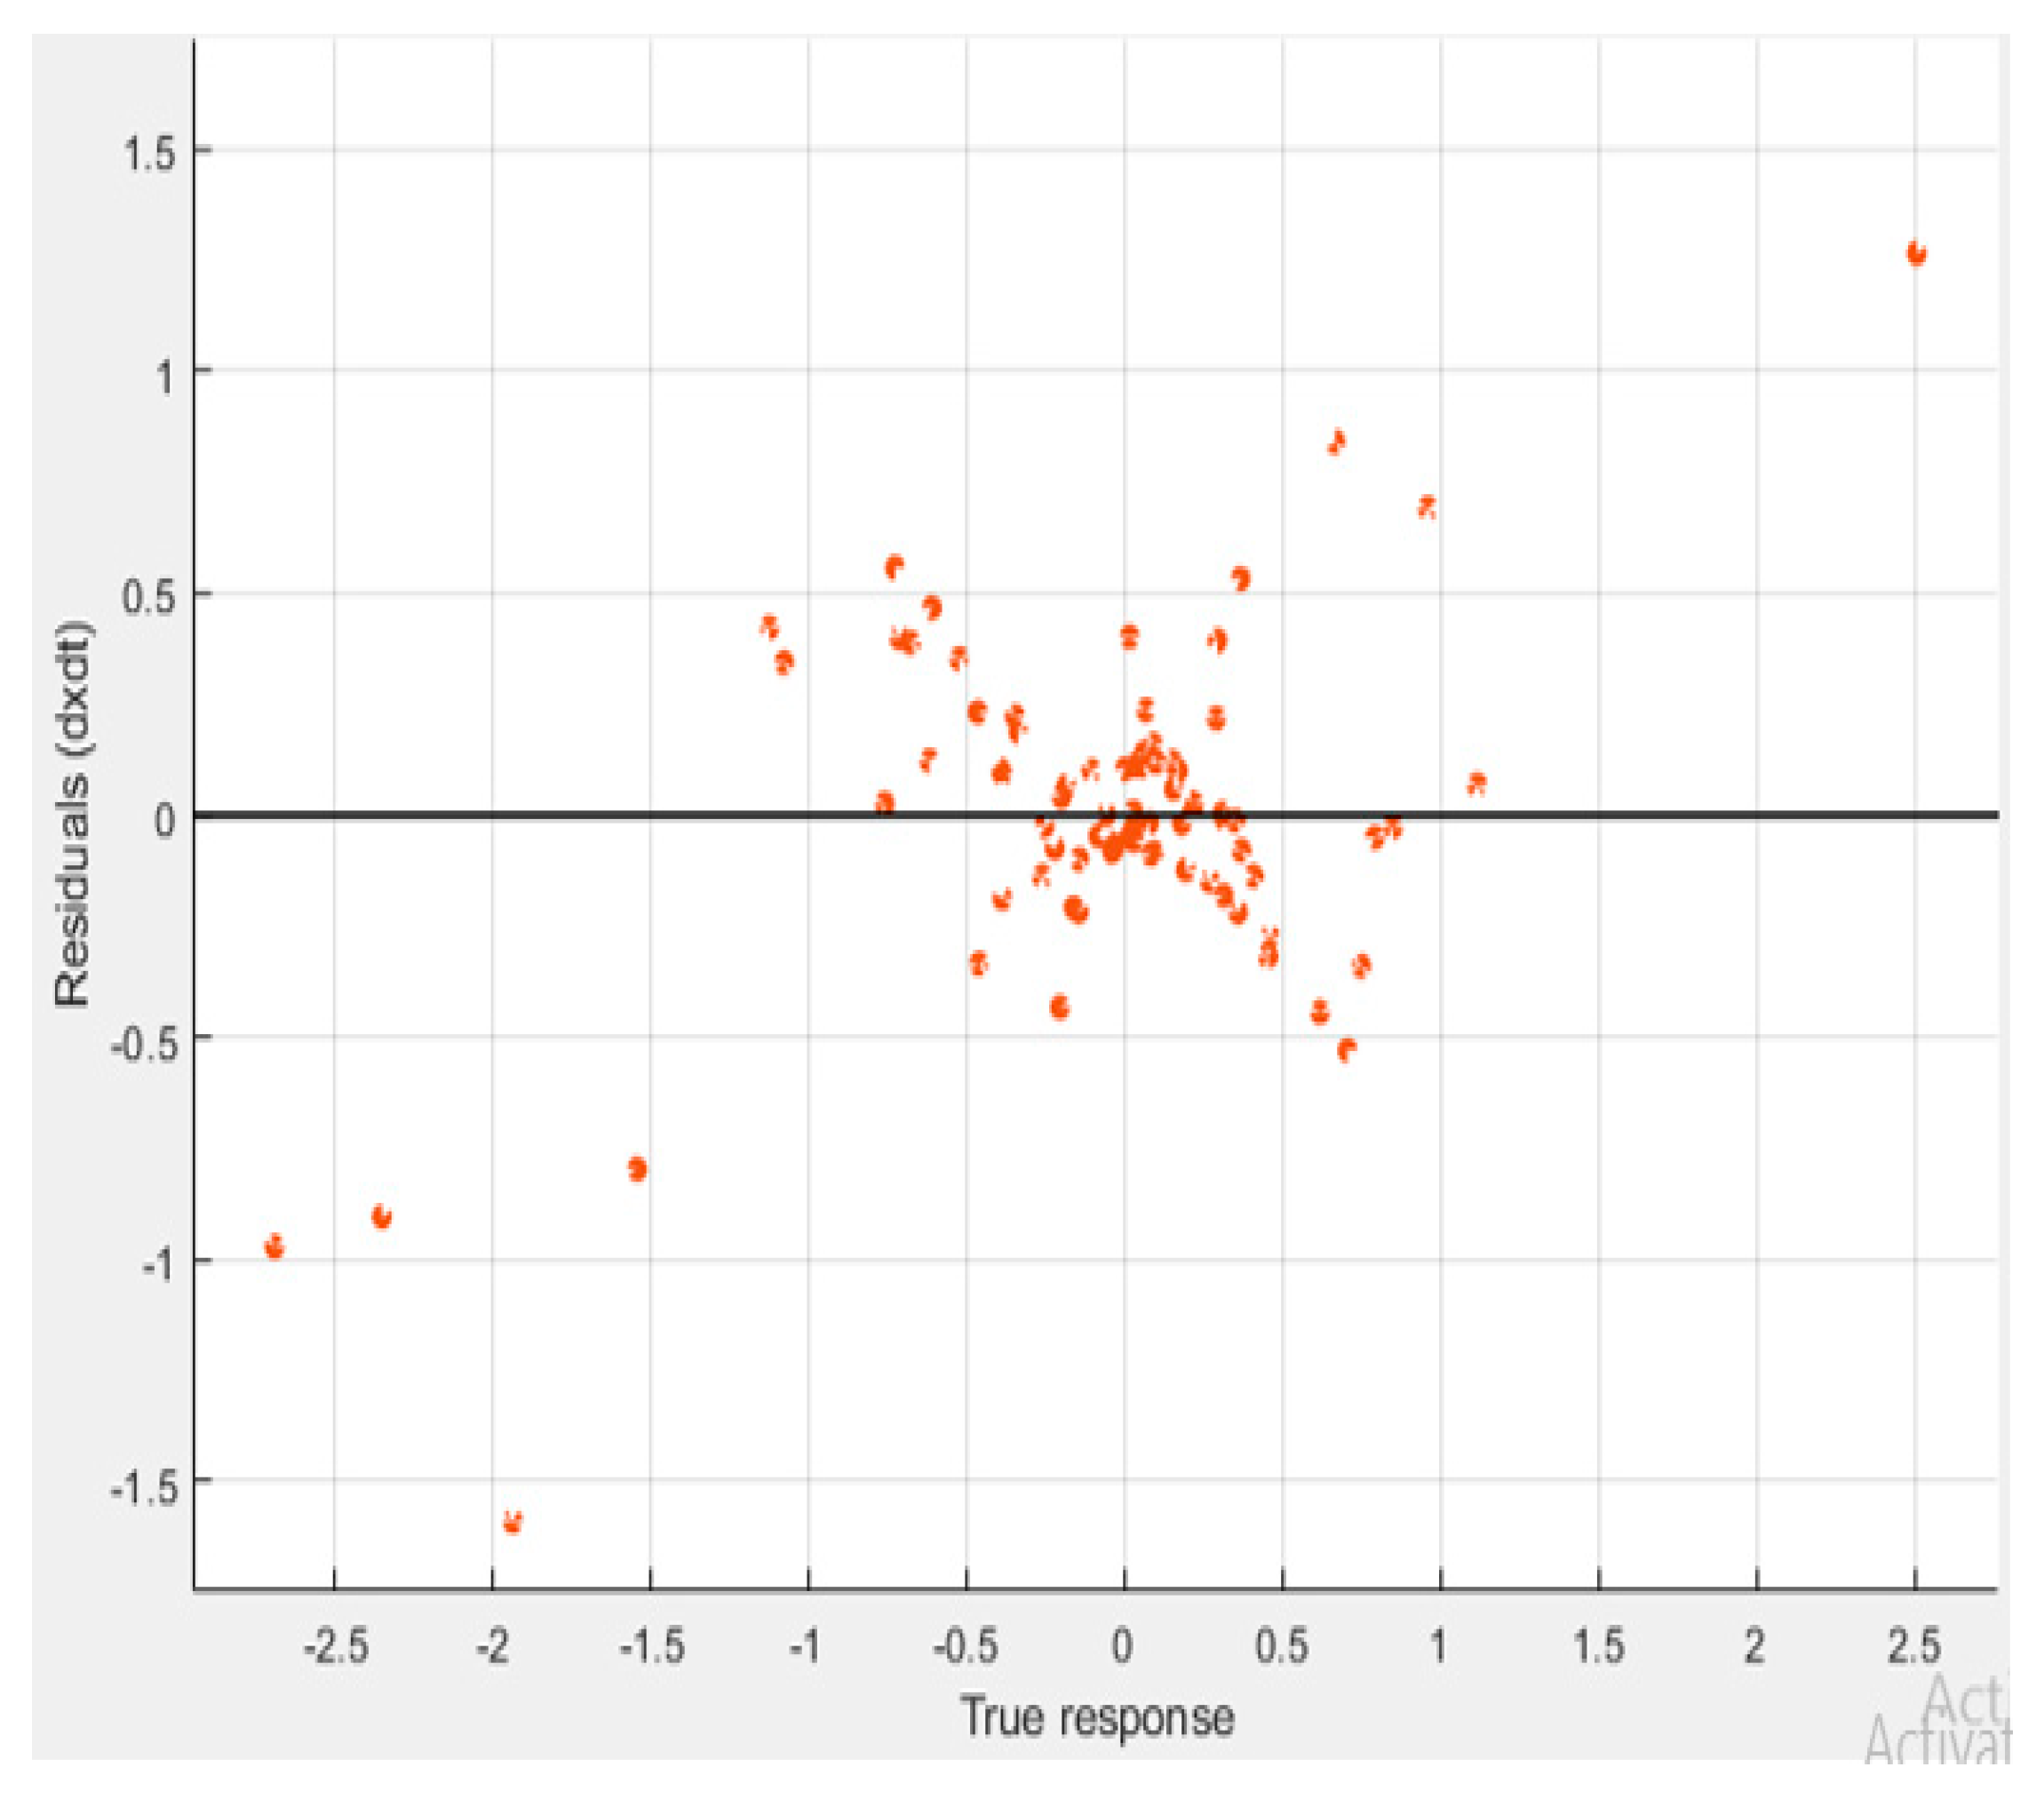
4.5. Model Validation

Model validation is an essential part as it evaluates the goodness of fit for any model. A residual plot is a fundamental statistical tool to measure the goodness of a fitted model. Model validation is important for linear regression modelling, as the estimator requires to define regression function and identical, and the independent distribution of errors should be consistent. Figure 14 represents the residual plot for the proposed linear regression estimator.

4.6. Performance Evaluation

Table 4 presents the linear quadratic regression model’s performance in the proposed work for estimating clock skew. The root means square error (RMSE) and R-square help calculate the goodness of fit for any function. The table also presents the value of mean squared error (MSE) and mean absolute error (MAE).
It was observed that the model gives reasonable results by reducing RMSE to 0.379. The value of the R-square should be between 0 and 1. For the proposed model, its value is 0.71. Table 5 presents the estimation speed and training time taken by the proposed model for estimating the value of Δ α A , ( t ) ^ , i.e., clock skew.
The proposed model is also compared with the existing model, and the results observed favour the linear quadratic regression (LQR). The LQR was compared with the linear regression (LR) [36], Gaussian process regression (GPR) [37] and non-linear Gaussian regression (NGR) [34] models for the same dataset for step one were used to estimate skew using a timestamp. It was observed that the proposed model gives better results. Table 6 presents the estimation of speed & training time for the proposed model. Table 7 shows the comparative analysis. The exact process was repeated with other sensors used in the IoT-based neonatal monitoring system. The average value of the RMSE value observed is 0.35. This outcome for the cock skew estimation indicates that the approach discussed in this paper provides high performance regarding accuracy.

5. Conclusions

The IoT has developed much popularity in various applications. Therefore, providing an accurate and reliable model for IoT-based applications is challenging nowadays. The synchronising clock of the sensors and WSNs deployed for execution of the IoT-based system can help improve the system’s performance. Hence, this paper proposed a framework for an IoT-based neonatal monitoring system and an estimator for estimating the clock skew for synchronising time and duration of resynchronisation. The estimator is based on the linear quadratic regression model. The proposed estimator was compared with existing models such as linear regression [36], Gaussian process regression [35], and non-linear Gaussian regression [34]. It was observed that the proposed work gives better results when compared. This model can provide a reliable and accurate estimate for clock skew by reducing the error rate to 0.35%. It will also help reduce the sensor overhead and save sensor energy. In the future, analyzing the model for some more parameters such as scalability, fault tolerance, and complexity will be a good way to extend the work.

Author Contributions

Conceptualization, D.U. and S.K.; methodology, D.U. and P.G.; validation, S.M.A. and J.S.; writing—original draft preparation, D.U. and P.G.; funding acquisition, S.M.A. and J.S.; writing—review and editing, S.K.; supervision, S.K. All authors have read and agreed to the published version of the manuscript.

Funding

This study is supported via funding from Prince Sattam bin Abdulaziz University project number (PSAU/2023/R/1444).

Data Availability Statement

Data may be available on request.

Acknowledgments

The authors are thankful to the deanship of Scientific Research Prince Sattam bin Abdulaziz University.

Conflicts of Interest

The authors declare no conflict of interest.

References

  1. Ngu, A.H.; Gutierrez, M.; Metsis, V.; Nepal, S.; Sheng, Q.Z. IoT middleware: A survey on issues and enabling technologies. IEEE Internet Things J. 2017, 4, 1–20. [Google Scholar] [CrossRef]
  2. Raggett, D. The Web of Things: Challenges and Opportunities. Computer 2015, 48, 26–32. [Google Scholar] [CrossRef]
  3. Want, R.; Schilit, B.N.; Jenson, S. Enabling the Internet of Things. Computer 2015, 48, 28–35. [Google Scholar] [CrossRef]
  4. Tournier, J.; Lesueur, F.; Le Mouël, F.; Guyon, L.; Ben-Hassine, H. A survey of IoT protocols and their security issues through the lens of a generic IoT stack. Internet Things 2021, 16, 100264. [Google Scholar] [CrossRef]
  5. Catarinucci, L.; De Donno, D.; Mainetti, L.; Palano, L.; Patrono, L.; Stefanizzi, M.L.; Tarricone, L. An IoT-Aware Architecture for Smart Healthcare Systems. IEEE Internet Things J 2015, 2, 515–526. [Google Scholar] [CrossRef]
  6. Health Strateg. Available online: https://www.unicef.org/health/files/UNICEF_Health_Strategy_Final.pdf (accessed on 12 December 2018).
  7. Yang, G.; Xie, L.; Mäntysalo, M.; Zhou, X.; Pang, Z.; Da Xu, L.; Kao-Walter, S.; Chen, Q.; Zheng, L.R. A Health-IoT Platform Based on the Integration of Intelligent Packaging, Unobtrusive Bio-Sensor, and Intelligent Medicine Box. IEEE Trans. Ind. Inform. 2014, 10, 2180–2191. [Google Scholar] [CrossRef] [Green Version]
  8. Lakshmanan, A.; Agni, M.; Lieu, T.; Fleegler, E.; Kipke, M.; Friedlich, P.S.; McCormick, M.C.; Belfort, M.B. The impact of preterm birth < 37 weeks on parents and families: A cross-sectional study in the 2 years after discharge from the neonatal intensive care unit. Health Qual. Life Outcomes 2017, 15, 1–13. [Google Scholar] [CrossRef] [Green Version]
  9. Khazaei, H.; Mench-Bressan, N.; McGregor, C.; Pugh, J.E. Health Informatics for Neonatal Intensive Care Units: An Analytical Modeling Perspective. IEEE J. Transl. Eng. Health Med. 2015, 3, 1–9. [Google Scholar] [CrossRef] [PubMed]
  10. Kramer, M.S.; Platt, R.; Yang, H.; Joseph, K.S.; Wen, S.W.; Morin, L.; Usher, R.H. Secular trends in preterm birth: A hospital-based cohort study. JAMA 1998, 280, 1849–1854. [Google Scholar] [CrossRef] [PubMed] [Green Version]
  11. Minerva, R.; Biru, A.; Rotondi, D. Towards a Definition of the Internet of Things (IoT). IEEE Internet Initiat. 2015, 1, 1–86. [Google Scholar]
  12. Ray, P.P. A survey on Internet of Things architectures. J. King Saud Univ. Comput. Inf. Sci. 2018, 30, 291–319. [Google Scholar] [CrossRef]
  13. Redondi, A.; Chirico, M.; Borsani, L.; Cesana, M.; Tagliasacchi, M. An integrated system based on wireless sensor networks for patient monitoring localisation and tracking. Ad Hoc Netw. 2013, 11, 39–53. [Google Scholar] [CrossRef]
  14. Mohammad, G.B.; Shitharth, S.; Syed, S.A.; Dugyala, R.; Rao, K.; Alenezi, F.; Althubiti, S.A.; Polat, K. Mechanism of Internet of Things (IoT) Integrated with Radio Frequency Identification (RFID) Technology for Healthcare System. Math. Probl. Eng. 2022, 2022, 4167700. [Google Scholar] [CrossRef]
  15. De, D.; Mukherjee, A.; Sau, A.; Bhakta, I. Design of smart neonatal health monitoring system using SMCC. Healthc. Technol. Lett. 2016, 4, 13–19. [Google Scholar] [CrossRef] [PubMed]
  16. Hakimi, A.; Hassan, N.; Anwar, K.; Zakaria, A.; Ashraf, A. Development of real-time patient health (jaundice) monitoring using wireless sensor network. In Proceedings of the 3rd International Conference on Electronic Design (ICED), Phuket, Thailand, 11–12 August 2016; pp. 404–409. [Google Scholar]
  17. Santhi, S.; Gandhi, A.; Geetha, M.; Nirmala, K.J.B.I.J. Smart Maternal Healthcare Monitoring System using Wireless Sensors Network. BioTechnol. Indian J. 2016, 12, 1–7. [Google Scholar]
  18. Martínez Chávez, S.M.; Rivero-Angeles, M.E.; Garay-Jiménez, L.I.; Romero Ibarra, I.C. Priority Schemes for Life Extension and Data Delivery in Body Area Wireless Sensor Networks with Cognitive Radio Capabilities. Wirel. Commun. Mob. Comput. 2019, 2019, 2637830. [Google Scholar] [CrossRef] [Green Version]
  19. Amendola, S.; Lodato, R.; Manzari, S.; Occhiuzzi, C.; Marrocco, G. RFID Technology for IoT-Based Personal Healthcare in Smart Spaces. IEEE Internet Things J. 2014, 1, 144–152. [Google Scholar] [CrossRef]
  20. Abdellatif, A.A.; Khafagy, M.G.; Mohamed, A.; Chiasserini, C.-F. EEG-Based Transceiver Design With Data Decomposition for Healthcare IoT Applications. IEEE Internet Things J. 2018, 5, 3569–3579. [Google Scholar] [CrossRef]
  21. Hooshmand, M.; Zordan, D.; Del Testa, D.; Grisan, E.; Rossi, M. Boosting the Battery Life of Wearables for Health Monitoring Through the Compression of Biosignals. IEEE Internet Things J. 2017, 4, 1647–1662. [Google Scholar] [CrossRef]
  22. Del Testa, D.; Rossi, M. Lightweight lossy compression of biometric patterns via denoising auto encoders. IEEE Signal Process. Lett. 2015, 22, 2304–2308. [Google Scholar] [CrossRef]
  23. Xu, G.; Han, J.; Zou, Y.; Zeng, X. A 1.5-D Multi-Channel EEG Compression Algorithm Based on NLSPIHT. IEEE Signal Process. Lett. 2015, 22, 1118–1122. [Google Scholar] [CrossRef]
  24. Carotti, E.S.; De Martin, J.C.; Merletti, R.; Farina, D. Compression of Multidimensional Biomedical Signals with Spatial and Temporal Codebook-Excited Linear Prediction. IEEE Trans. Biomed. Eng. 2009, 56, 2604–2610. [Google Scholar] [CrossRef] [PubMed]
  25. Akiike, J. Slurry for Lithium Ion Secondary Battery Porous Film, Production Method Therefor, Separator for Lithium Ion Secondary Battery, and Lithium Ion Secondary Battery. U.S. Patent Application No. 2016/0,013,465, 17 August 2021. [Google Scholar]
  26. Patil, S.P.; Mhetre, M.R. Intelligent patient monitoring system. Trans. Electr. Electron. Eng. 2014, 2, 2320–8945. [Google Scholar]
  27. Patke, H.; Borkar, M.; Kenkre, N.; Gupta, A. An innovative approach for infant monitoring system using pulse rate and oxygen level. In Proceedings of the 2017 International Conference on Intelligent Computing and Control Systems (ICICCS), Madurai, India, 15–16 June 2017; pp. 0975–8887. [Google Scholar]
  28. Angelov, G.V.; Nikolakov, D.P.; Ruskova, I.N.; Gieva, E.E.; Spasova, M.L. Healthcare Sensing and Monitoring. In Enhanced Living Environments; Lecture Notes in Computer Science; Ganchev, I., Garcia, N., Dobre, C., Mavromoustakis, C., Goleva, R., Eds.; Springer: Berlin/Heidelberg, Germany, 2019; pp. 226–262. [Google Scholar] [CrossRef] [Green Version]
  29. Nirmala, G.; Jeyashree, S.; Murugalakshmi, B.; Nandhin, K. A secure IoT based patient healthcare monitoring and maintenance system in cloud. Int. J. Curr. Eng. Sci. Res. 2018, 5, 2393–8374. [Google Scholar]
  30. Birje, M.N.; Hanji, S.S. Internet of things based distributed healthcare systems: A review. J. Data Inf. Manag. 2020, 2, 149–165. [Google Scholar] [CrossRef]
  31. Habibzadeh, H.; Dinesh, K.; Shishvan, O.R.; Boggio-Dandry, A.; Sharma, G.; Soyata, T. A Survey of Healthcare Internet of Things (HIoT): A Clinical Perspective. IEEE Internet Things J. 2019, 7, 53–71. [Google Scholar] [CrossRef]
  32. Haghi, M.; Neubert, S.; Geissler, A.; Fleischer, H.; Stoll, N.; Stoll, R.; Thurow, K. A Flexible and Pervasive IoT-Based Healthcare Platform for Physiological and Environmental Parameters Monitoring. IEEE Internet Things J. 2020, 7, 5628–5647. [Google Scholar] [CrossRef]
  33. Sun, J.; Xiong, H.; Liu, X.; Zhang, Y.; Nie, X.; Deng, R.H. Lightweight and Privacy-Aware Fine-Grained Access Control for IoT-Oriented Smart Health. IEEE Internet Things J. 2020, 7, 6566–6575. [Google Scholar] [CrossRef]
  34. Mishura, Y.; Ralchenko, K.; Shklyar, S. Maximum likelihood estimation for Gaussian process with non-linear drift. Nonlinear Anal. Model. Control. 2018, 23, 120–140. [Google Scholar] [CrossRef]
  35. Yang, Z.; Cai, L.; Liu, Y.; Pan, J. Environment-aware clock skew estimation and synchronisation for wireless sensor networks. In Proceedings of the 2012 Proceedings IEEE INFOCOM, Orlando, FL, USA, 25–30 March 2012; pp. 1017–1025. [Google Scholar]
  36. Khandoker, T.U.I.; Huang, D.; Sreeram, V. A low complexity linear regression approach to time synchronisation in underwater networks. In Proceedings of the 2011 8th International Conference on Information, Communications & Signal Processing, Singapore, 13–16 December 2011; pp. 1–5. [Google Scholar]
  37. Jeong, S.; Kim, S.C. Time Synchronization for Underwater Cellular Networks. In Proceedings of the 2017 International Conference on Information Networking (ICOIN), Da Nang, Vietnam, 11–13 January 2017; pp. 512–517. [Google Scholar]
Figure 1. Deployment of sensors for the IoT aware health monitoring system.
Electronics 12 00309 g001
Figure 2. Network layered architecture for the IoT-based health monitoring system.
Electronics 12 00309 g002
Figure 3. A schema depicting the network component and communication protocol.
Electronics 12 00309 g003
Figure 4. The GUI for health monitoring systems at the application layer.
Electronics 12 00309 g004
Figure 5. Proposed IoT setup along with sensors for collecting the data.
Electronics 12 00309 g005
Figure 6. Data were collected on 20 Nov from 1:35 PM to 1:45 PM using body temperature sensor MAX30205.
Electronics 12 00309 g006
Figure 7. Operating characteristics of the human body temperature sensor [34].
Electronics 12 00309 g007
Figure 8. Heartrate sensor data collected with PC-3147.
Electronics 12 00309 g008
Figure 9. Light level absorption for heart rate measurement.
Electronics 12 00309 g009
Figure 10. Graphs between the data collected for room humidity and temperature with DHT11.
Electronics 12 00309 g010
Figure 11. Flowchart for the proposed clock skew estimator using linear quadratic regression.
Electronics 12 00309 g011
Figure 12. Performance analysis of a synchronisation error linear quadratic regression model for nodes A and B.
Electronics 12 00309 g012
Figure 13. True and predicted responses.
Electronics 12 00309 g013
Figure 14. Residual plot of a linear quadratic regression model.
Electronics 12 00309 g014
Table 1. Specification of proposed architecture of WSNs.
ParametersValue
ZigBee moduleXBP24-ZB
GPRS moduleMTSMC-G2-SP
ArchitectureSingle-tier heterogeneous
Transmission range≤25 m
Heartrate sensorPC-3147
Body temperature sensorMAX30205
Room temperature sensorDHT11
Humidity sensorDHT11
Visual monitoringPi camera
Data upload interval10 min
Table 2. Smart health monitoring application domain.
CharacteristicsSmart Health Monitoring Application
Network size20 nodes
Network connectivityWPAN (Zigbee), WLAN, 3G, 4G, and Internet
Bandwidth requirements2 kbps to 8 kbps based on 2 bytes per sample
Table 3. Operational characteristics of DGT11 humidity and temperature sensor.
DHT11Measurement RangeAccuracyResolution
Humidity20–90% R.H.±5 R.H.1
Temperature0–50 °C±2 °C
Table 4. Development parameters for estimating clock skew.
ParametersValue
Model TypeLinear Regression
PresetLinear
TermQuadratic
Table 5. The proposed model’s goodness of fit is based on RMSE, R-Square, MSE, and MAE.
RMSER-SquareMSEMAE
0.3790.710.1440.244
Table 6. Estimation speed and training time for the proposed model.
Prediction SpeedTraining Time
~1800 obs/s1.725 s
Table 7. The goodness of fit of the linear quadratic regression (LQR), linear regression (LR), gaussian process regression (GPR), and non-linear gaussian regression (NGR).
Goodness of Fit
TypeRMSER-SquareRef.
LQR0.3790.71
LR0.5180.47[36]
GPR7.800.25[37]
NGR5.0990.694[34]
Disclaimer/Publisher’s Note: The statements, opinions and data contained in all publications are solely those of the individual author(s) and contributor(s) and not of MDPI and/or the editor(s). MDPI and/or the editor(s) disclaim responsibility for any injury to people or property resulting from any ideas, methods, instructions or products referred to in the content.

