Article

Improving OSAHS Prevention Based on Multidimensional Feature Analysis of Snoring

School of Electrical Engineering and Electronic Information, Xihua University, Chengdu 610000, China
*
Author to whom correspondence should be addressed.
Electronics 2023, 12(19), 4148; https://doi.org/10.3390/electronics12194148
Submission received: 30 August 2023 / Revised: 28 September 2023 / Accepted: 4 October 2023 / Published: 5 October 2023

Abstract

:
Obstructive Sleep Apnea–Hypopnea Syndrome (OSAHS), a severe respiratory sleep disorder, presents a significant threat to human health and even endangers life. As snoring is the most noticeable symptom of OSAHS, identifying OSAHS via snoring sound analysis is vital. This study aims to analyze the time-domain and frequency-domain characteristics of snoring sounds to detect OSAHS and its severity. The snoring sounds are extracted and scrutinized from nighttime acoustic signals, with spectral energy ratio features being applied, calculated via the snore detection frequency division method. A variety of time and frequency-domain features are derived from the snoring sounds. A novel Snore Detection Cepstral Coefficient (SDCC) is proposed, based on Mel Frequency Cepstral Coefficients (MFCCs) and snore detection frequency division. Relief-F feature screening is then applied to SDCC and MFCC. Canonical Correlation Analysis (CCA) is utilized on the fusion features obtained as a result, and the results indicate the highest accuracy (97.8%) with Subspace KNN. The optimal classifier with feature combination is used for the snore model of OSASH early warnings all night, effectively recognizing and assessing OSAHS and reflecting the severity of its disease. This result, achieving high accuracy and low computational complexity, shows that the proposed method holds significant promise for developing portable sleep health detection devices.

1. Introduction

Sleep, an inherent part of human biology, is integral to preserving an individual’s physical and mental well-being. A reciprocal dependence can sometimes evolve between deteriorating sleep and health conditions [1]. Snoring, a prevalent symptom of Obstructive Sleep Apnea–Hypopnea Syndrome (OSAHS), poses a significant risk if overlooked or not promptly addressed.
OSAHS is a widespread respiratory disorder marked by recurrent obstruction of the upper respiratory tract during sleep, resulting in episodes of apnea or hypopnea. It independently increases the risk of several significant cardiovascular diseases, contributes to poor sleep quality, and compromises the overall quality of life [2,3,4]. Obstructive sleep apnea is typically characterized by a cessation of breathing that lasts for a minimum of 10 s [5].
The Apnea Hypopnea Index (AHI) gauges the severity of OSAHS by tracking the number of apnea and hypopnea incidents per hour. Polysomnography (PSG) is recognized as the gold standard for diagnosing OSAHS. However, PSG has limitations. It is intrusive and requires numerous sensors that can disrupt natural sleep. The procedure is costly, particularly in a sleep lab setting, and access to PSG facilities can be limited, especially in underserved regions. Additionally, it can cause the patient considerable discomfort [6]. Given the high costs associated with PSG, it is essential to explore potential methods that are less invasive and more cost-effective, especially since OSAHS requires thorough diagnosis and treatment.
Numerous studies have demonstrated that snoring sounds can divulge details such as a patient’s condition severity and the location of upper airway obstruction [7]. For instance, a study conducted by Herzog [8] using Fast Fourier Transform (FFT) analysis revealed that simple snorers typically exhibit a spectrum between 100 and 300 Hz, whereas patients with OSAHS tend to demonstrate peak intensities above 1000 Hz. Such frequency analyses can help distinguish different snoring patterns. Perez and their team [9] identified a discrepancy in the power spectrum between simple snorers and those with OSAHS. They suggested that the characteristic PR800—the power ratio of frequencies above 800 Hz to those below 800 Hz—can help differentiate between simple snorers and OSAHS patients. Dulip et al. [10] employed a multivariate Gaussian Mixed Model (GMM) and Hidden Markov Model (HMM) related acoustic model, subsequently using HMMs and Mel Frequency Cepstral Coefficient (MFCC)-based features to model the signal dynamics within snoring events. Their diagnostic method demonstrated a sensitivity and specificity of 85.7% and 71.4% respectively, for male OSAHS diagnoses. For female OSAHS diagnoses, both sensitivity and specificity were 85.7%.
Recently, researchers have explored the use of machine learning in conjunction with acoustic features of snoring to distinguish between OSAHS patients and simple snorers, capitalizing on the differences between their respective snoring patterns. Shen et al. engineered a fused-features snoring classification algorithm based on Fisher’s criterion for Support Vector Machine (SVM) [11]. This algorithm achieved snoring recognition by leveraging Fisher’s criterion to amalgamate the strengths of various feature parameters. By coupling the fused features with the SVM classifier, they achieved a snoring recognition accuracy of 95.8% on their custom dataset, which comprised simple snoring and snoring in OSAHS patients. This approach represented an improvement of 3.4% and 2.4% compared to the use of traditional Linear Predictive Cepstral Coefficients (LPCCs) and MFCC features in isolation. Jiang et al. further differentiated OSAHS patients by analyzing the acoustic features of nocturnal snoring, utilizing a priori knowledge to enumerate multidimensional feature sets [12]. They selected the first six features and paired them with five machine learning methods to authenticate the efficacy of identifying OSAHS patients through a random forest feature selection algorithm. The process of feature screening and fusion can further enhance the classification accuracy of OSAHS, and machine learning models also demonstrate promising results in this context.
While previous research papers have effectively classified both normal and pathological snoring, achieving high levels of accuracy, they have not delved further into the examination of pathological snoring. The study at hand enhances the level of specificity by introducing a new category of data, called “snoring before and after sleep apnea”, to the original binary classification system, providing a more granular analysis of snoring in patients with OSAHS. Significant variations were observed in the snoring patterns among the three distinct categories. The most indicative characteristics that reflect the disparities between these categories were identified for further use in the classification process. During the experimental phase, a multivariate feature set was employed. The Relief-F algorithm and Canonical Correlation Analysis (CCA) were used to fuse the feature set, thereby reducing data redundancy. Following this, a comparative analysis using various commonly used machine learning methods was conducted to select the combination of features and classifiers that offered the highest robustness. Ultimately, the study was able to produce a model capable of pre-diagnosing OSAHS with enhanced accuracy and efficiency.

2. Sleep Respiratory Signal Acquisition System and Preprocessing

An overall flow chart of the experiment used in this study is shown in Figure 1.

2.1. Data Acquisition System

The data acquisition system and data acquisition environment for this study are shown in Figure 2. Sleep breathing sound signals are captured via portable wearable collection devices for quality sleep acquisition, which include a smartphone or tablet with Android and a wireless microphone. Our study aimed to develop an inexpensive and easy-to-use home sleep monitoring system, so using a commercial wireless headset (PTM165) as well as a commercial wristband (HUAWEI B6-F99) became a better choice for our study. To ensure that a steady breathing signal is obtained throughout the sleep period, a microphone is fixed near the nose using a medical tape [13,14]. The bracelet is worn on the wrist in the position of the pulse, and blood oxygen saturation, as well as rough sleep staging, can be obtained throughout the night. The raw sampling rate is 22.5 kHz, 16 sampling bits, and mono. The data were collected from both healthy male and female participants as well as OSAHS patients during the experiment, totaling over 300 h of recordings.

2.2. Audio Signal Preprocessing and Snoring Event Monitoring

When investigating snoring event detection, there are two primary methodologies: multi-stage and single-stage methods [15]. The approach of this section to snoring detection falls within the category of multi-stage detection, which comprises three pivotal stages: audible segment detection, feature extraction, and snoring detection.
Sleep data gathered over a full night are voluminous, making comprehensive event detection a necessity. Speech event detection generally employs sound event endpoint detection algorithms, which differentiate voiced and unvoiced speech signal segments and identify their respective starting and ending points. The double-threshold method using short-time energy and zero-crossing rates is a standard approach for endpoint detection. However, because the inhalation or exhalation during a breathing event might be prolonged or have a more pronounced sound intensity, an issue arises as a single breathing event’s corresponding audio signal may be erroneously detected as multiple breath events.
The inhalation and exhalation intensities within a single breath can vary, leading to scenarios where only one event is identified while the other is overlooked. Consequently, the detection accuracy of the algorithm suffers. Furthermore, the algorithm’s threshold necessitates multiple adjustments, which proves to be inefficient in practice.
We categorized all sounds during sleep, apart from snoring and breathing, as noise. Given the non-periodic nature of sleep speech and the presence of occasional noise, the algorithm may extract some irrelevant audio. To filter out these instances, we employ the double-threshold method, selecting the screening threshold within the valid segment between 0.8 s and 4.8 s. Specifically, data with valid lengths less than 0.8 s or greater than 4.8 s are deemed invalid. The choice of 0.8 s and 4.8 s as the upper and lower thresholds is based on the average length of the noisy audio within the speech.
According to our experimental results, the snoring period is typically 5 s, which fully encompasses a breathing cycle. Thus, we choose 5 s as the audio length. The entire segmentation process unfolds over four steps:
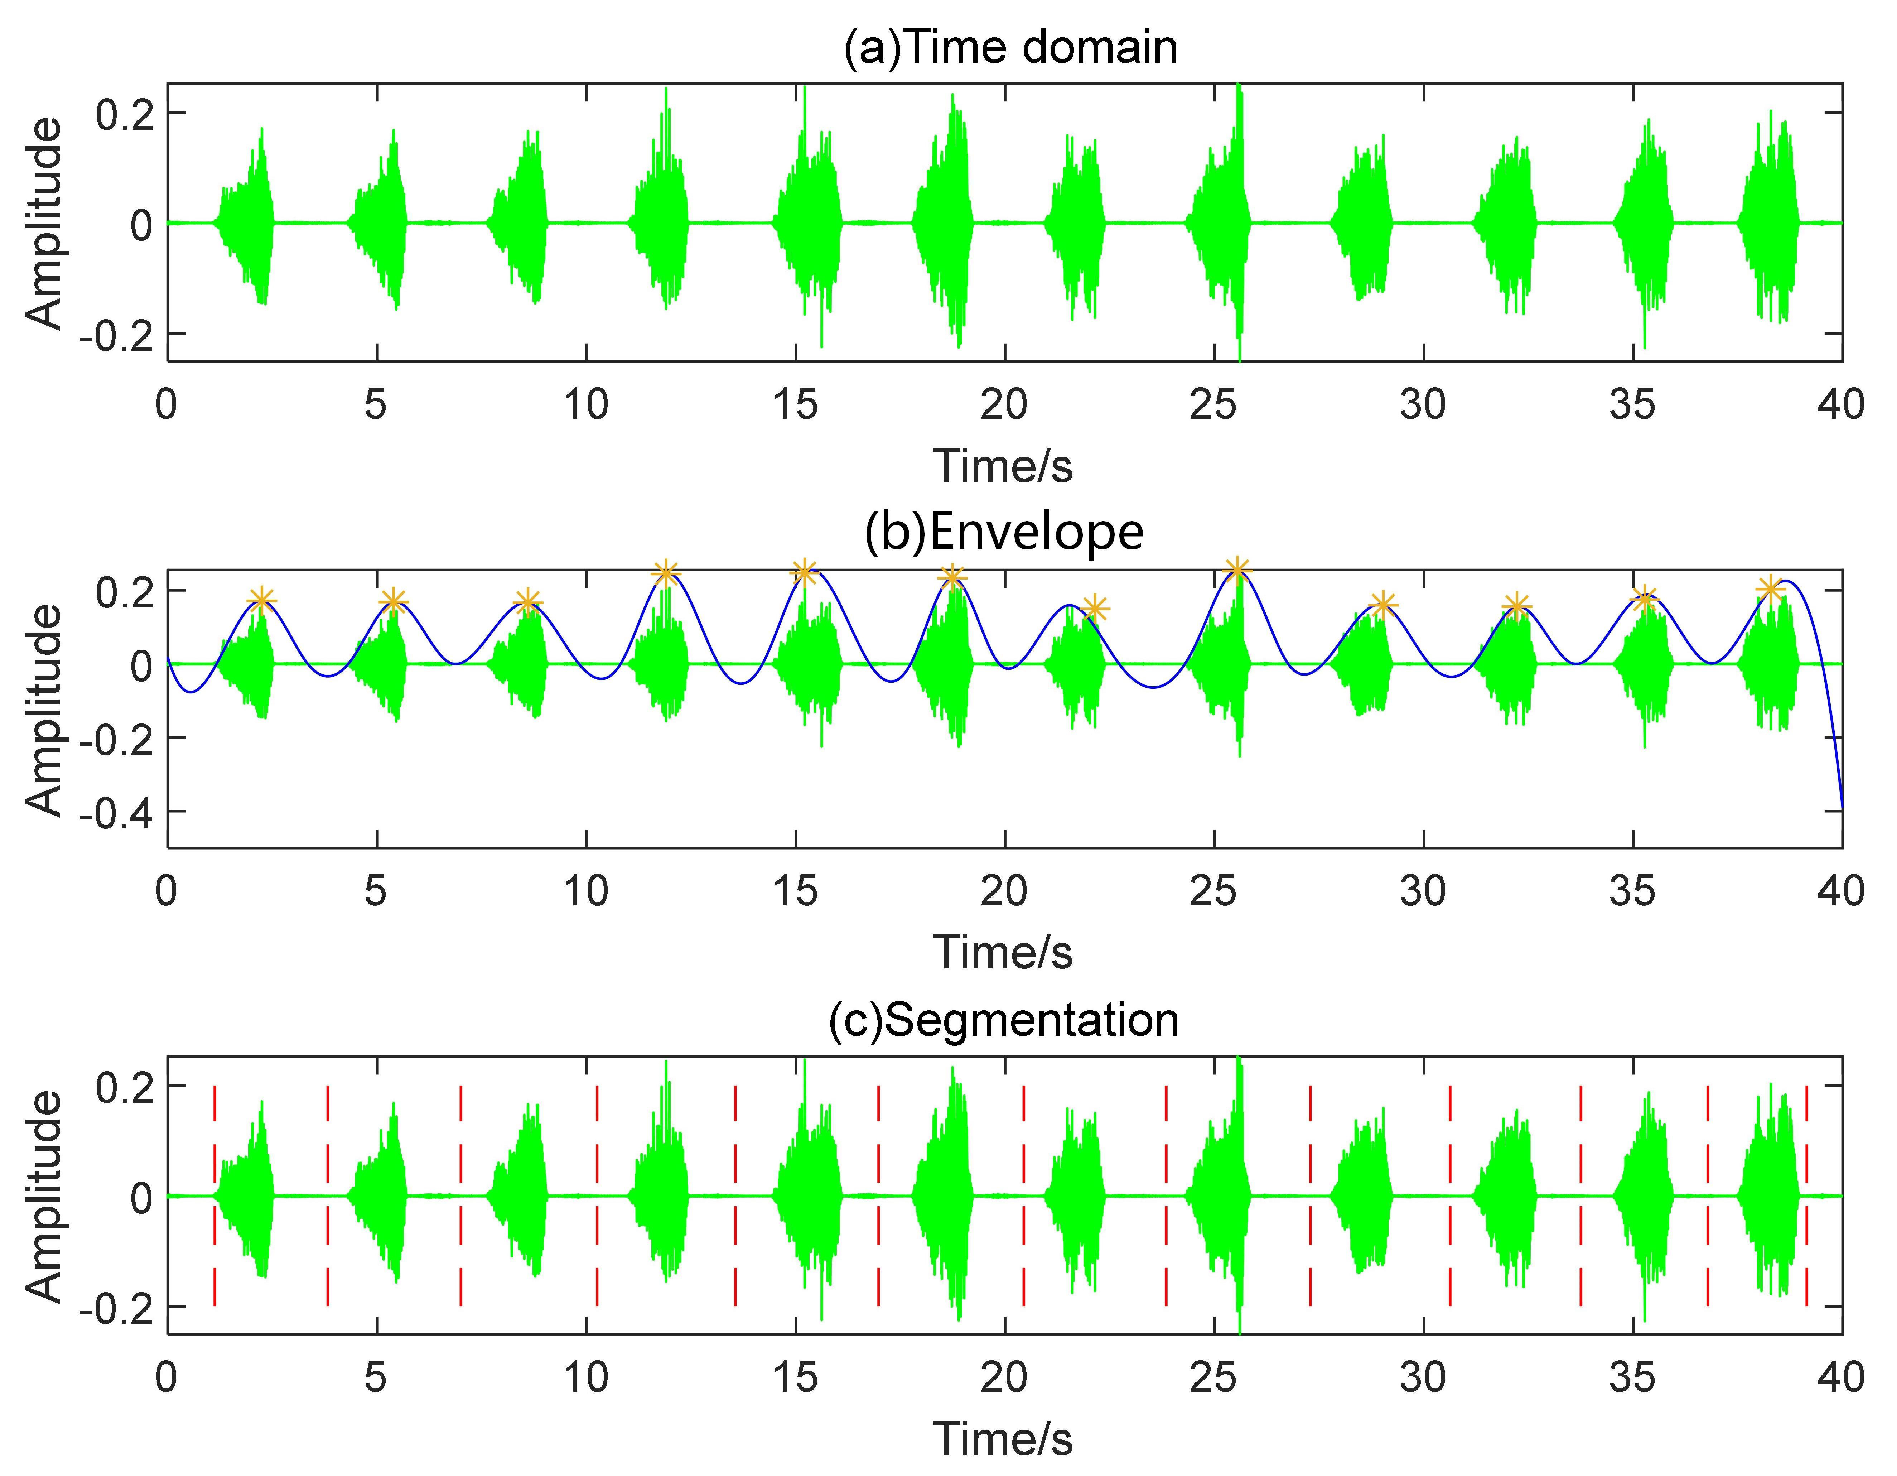
  • Step 1: Read the audio file and generate a time-domain map.
  • Step 2: Utilize the envelope function to extract the waveform’s envelope, selecting “peak” as the function’s argument. Subsequently, employ the “find-peaks” function to locate the envelope’s peaks. The peak interval threshold is set to 5/2*fs, where fs represents the audio sampling rate.
  • Step 3: Compute the midpoints between adjacent peaks, using these points as the start and end to partition the entire audio. The effect of localized segmentation detection is illustrated in Figure 3.
  • Step 4: Locate the segmented audio using the double-threshold method, calculate the valid segment length, filter out valid data falling within the 0.8–4.8 s range, and consolidate the filtered data.

3. Classification of Breath Sound and Snoring

Sleep speech is non-periodic, with a typical breath length of 5 s. The process involves dissecting the audio data recorded throughout a night’s sleep. This continuous audio stream is partitioned into individual segments, each with a duration of 5 s based on the segmentation method above. These 5 s audio segments represent distinct breathing events or cycles, making subsequent analysis and processing more manageable and effective. each representing a breath event. In this manner, a full night’s data can be segmented into numerous 5 s audio pieces. The pre-processed sleep speech signal predominantly comprises breath and snoring sounds. In this study, we propose a new spectral energy share feature of spectral segmentation for classifying snoring and non-snoring episodes.
Initially, these audio segments are resampled to 8000 Hz. This not only ensures compliance with the Nyquist sampling theorem but also decreases the computational burden. Subsequently, features of the snoring and breath sounds are extracted, referred to as the snoring detection spectral energy proportion. This is grounded in an algorithm that computes the spectral energy share of the signal, as illustrated by
E l = i = 1 N D l 2 ( i )
where N denotes the total number of sampling points in the segment, D l signifies the amplitude of sampling points, and i represents the i t h sampling point.
E t o t a l = l = 1 T E l
E l % = E l E t o t a l × 100 %
where T represents the total number of segments in the entire spectrum partition.
We considered the wavelet decomposition, the Mel filter’s center frequency, and the Gammatone filter’s center frequency. These aspects were utilized to divide the spectrum, providing valuable insights. Ultimately, we propose our method of spectral division. The spectral energy is calculated for each partition segment to determine each segment’s percentage.
Wavelet decomposition involves a tree-like disassembly of the entire spectrum, equivalent to an even division of the entire spectrum. The Mel and Gammatone filters divide the spectrum based on their center frequencies. Lower frequencies undergo more division, while higher frequencies are less divided, aligning with the distribution of sleep speech in the spectrum. The snoring detection method amalgamates the features of both uniform and non-uniform divisions. Equation (4) explains its formulation [16].
f sd = f s 2.5 N × l 0 < l 3 N 4 3 f s 10 + f s 1.25 N × ( l 3 N 4 ) 3 N 4 < l N
Here, l denotes the current segment, N signifies the total number of segments, and f s represents the audio’s sample rate.
Transitioning from that, a Cubic SVM classifier was trained on labeled snore/breath sound samples, resulting in a pre-trained snore detection model. The database utilized for this training comprised a combination of the open-source dataset ESC-50 [17] and a set of data obtained from our laboratory.
The classification results for snoring and breathing sounds were then procured, as outlined in Table 1. It is evident from these results that the snoring detection method outperforms the other three methods in terms of accuracy. To validate the feasibility and robustness of the model, the Area Under the Curve (AUC) for the Receiver Operating Characteristic (ROC) of all four methods was also computed. The snore detection algorithm, being straightforward and highly efficient, was chosen for all the following snore/breath classification tasks.
Following the construction of the snoring recognition model, the respiratory events were classified. The model’s prediction for a sleep audio recording of one hour, dichotomizing the detected segmented respiratory events, is displayed in Figure 4. Ultimately, the snoring events were extracted. All snore datasets employed for experimentation in this study were extracted using the model generated by this snoring detection method.

4. Dataset of Sleep Sound Signal

Given that there was no signal in the time domain during apnea, our focus was directed toward the respiratory events preceding and following an apnea event. Considering the vast amount of data and the requirement to ensure that the snoring events do not belong to the same period, random sampling extraction was performed. Audio clips were segmented from six 30 s cycles before and after an apnea event in patients suffering from apnea. The preconditioning method was employed to cut and classify the audio to obtain snoring events before and after sleep apnea. These snoring events are what we term Simple Snores (SSs).
Subsequently, we extracted snoring events from non-sleep apnea segments in OSAHS patients. These events were classified as Pathological Non-Apnea Snores (PNASs).
Ultimately, independent snoring sounds were randomly sampled from 30 h of sleep sounds recorded from individuals without sleep apnea, which were categorized as Apnea Snores (ASs). The three types of snoring events comprise the dataset needed for this study, as depicted in Figure 5.
The diagnostic classification of OSAHS categorizes snoring into Simple Snoring (SS) and OSAHS Pathological Snoring (OPS). However, in this study, we introduce a more nuanced categorization. The snoring from OSAHS patients is further divided into Pathological Non-Apnea Snoring (PNAS) and Apnea Snoring (AS). Hence, this study extends the traditional dichotomy of simple snoring and pathological snoring by distinguishing between pathological non-apnea snoring and apnea snoring. This detailed classification aims to provide a more precise prediction of OSAHS and a more accurate reflection of disease severity.

5. Multi-Features Extraction

5.1. Time-Domain Feature Extraction

In the exploration of snoring classification associated with OSAHS, numerous time-domain and frequency-domain features have proven valuable. Recognizing the distinctions among various snoring sounds, we have selected a set of salient features for this study. It has been established in earlier research that distinct breath sounds are characterized by significant differences in their short-time energy and short-time zero-crossing rate [18]. Since snoring is a form of breath sound, these two features are selected for classification purposes in this work.
The computation of short-time energy and short-time zero crossing rate involves frame segmentation and windowing. Let x ( n ) represent the time-domain signal of the speech waveform, and y i ( n ) , the ith frame speech signal obtained post-windowing with a function w ( n ) . y i ( n ) , can be given by
y i ( n ) = w ( n ) x ( ( i 1 ) i n c + n ) , 1 n L , 1 i f n
where w ( n ) denotes the window function (here, we use the Hamming window), y i ( n ) denotes the frame value (where n = 1 , 2 , L and i = 1 , 2 , f n ), L denotes the frame length, i n c denotes the frameshift length, and f n denotes the total number of frames post-framing.
The short-time energy of the ith frame speech signal, y i ( n ) , is computed, as described in Equation (3). A zero crossing is defined as an instance where adjacent sampled values switch signs. Its formula is shown in
Z ( i ) = 1 2 n = 0 L 1 | sgn [ y i ( n ) ] sgn [ y i ( n 1 ) ] | , 1 i f n
where sgn is the sign function, defined as
s g n [ x ( n ) ] = + 1 if x ( n ) 0 1 if x ( n ) < 0
From the extracted short-time energy and short-time zero-crossing rate, statistical features are then derived to construct the feature vector. These statistical features encompass mean, median, variance, standard deviation, maximum value, kurtosis, and skewness of the characteristic parameters.

5.2. Frequency-Domain Feature Extraction

It has been observed that the snoring sounds produced by subjects of varying severity levels exhibit considerable distinctions, especially within the frequency domain [19].
In Figure 6, panels (a) and (b) depict the time and frequency domains of normal snoring sounds, while panels (c) and (d) represent those of OSAHS snoring sounds. The discrepancy between the frequency domains of the two types of snoring sounds is readily apparent. It can be noted that significant information pertaining to OSAHS snoring sounds extends beyond 1000 Hz. As a result, we are led to extract features related to the spectrum to enable the classification of diverse snoring sounds.
Using the spectrum, eight features are calculated, namely, spectral centroid, spectral spread, spectral flatness, spectral decay point, spectral skewness, spectral slope, spectral entropy, and PR800 [20,21,22,23,24,25,26]. The first seven features are all derived from the spectrum obtained via the Fast Fourier Transform. In spectral flatness, frequency is segmented into five bands: 125–250 Hz, 250–500 Hz, 500–1000 Hz, 1000–2000 Hz, and 2000–4000 Hz. Concurrently, Burg’s method is employed to estimate the power spectrum of PR800. PR800 is represented as a ratio within the power spectrum.

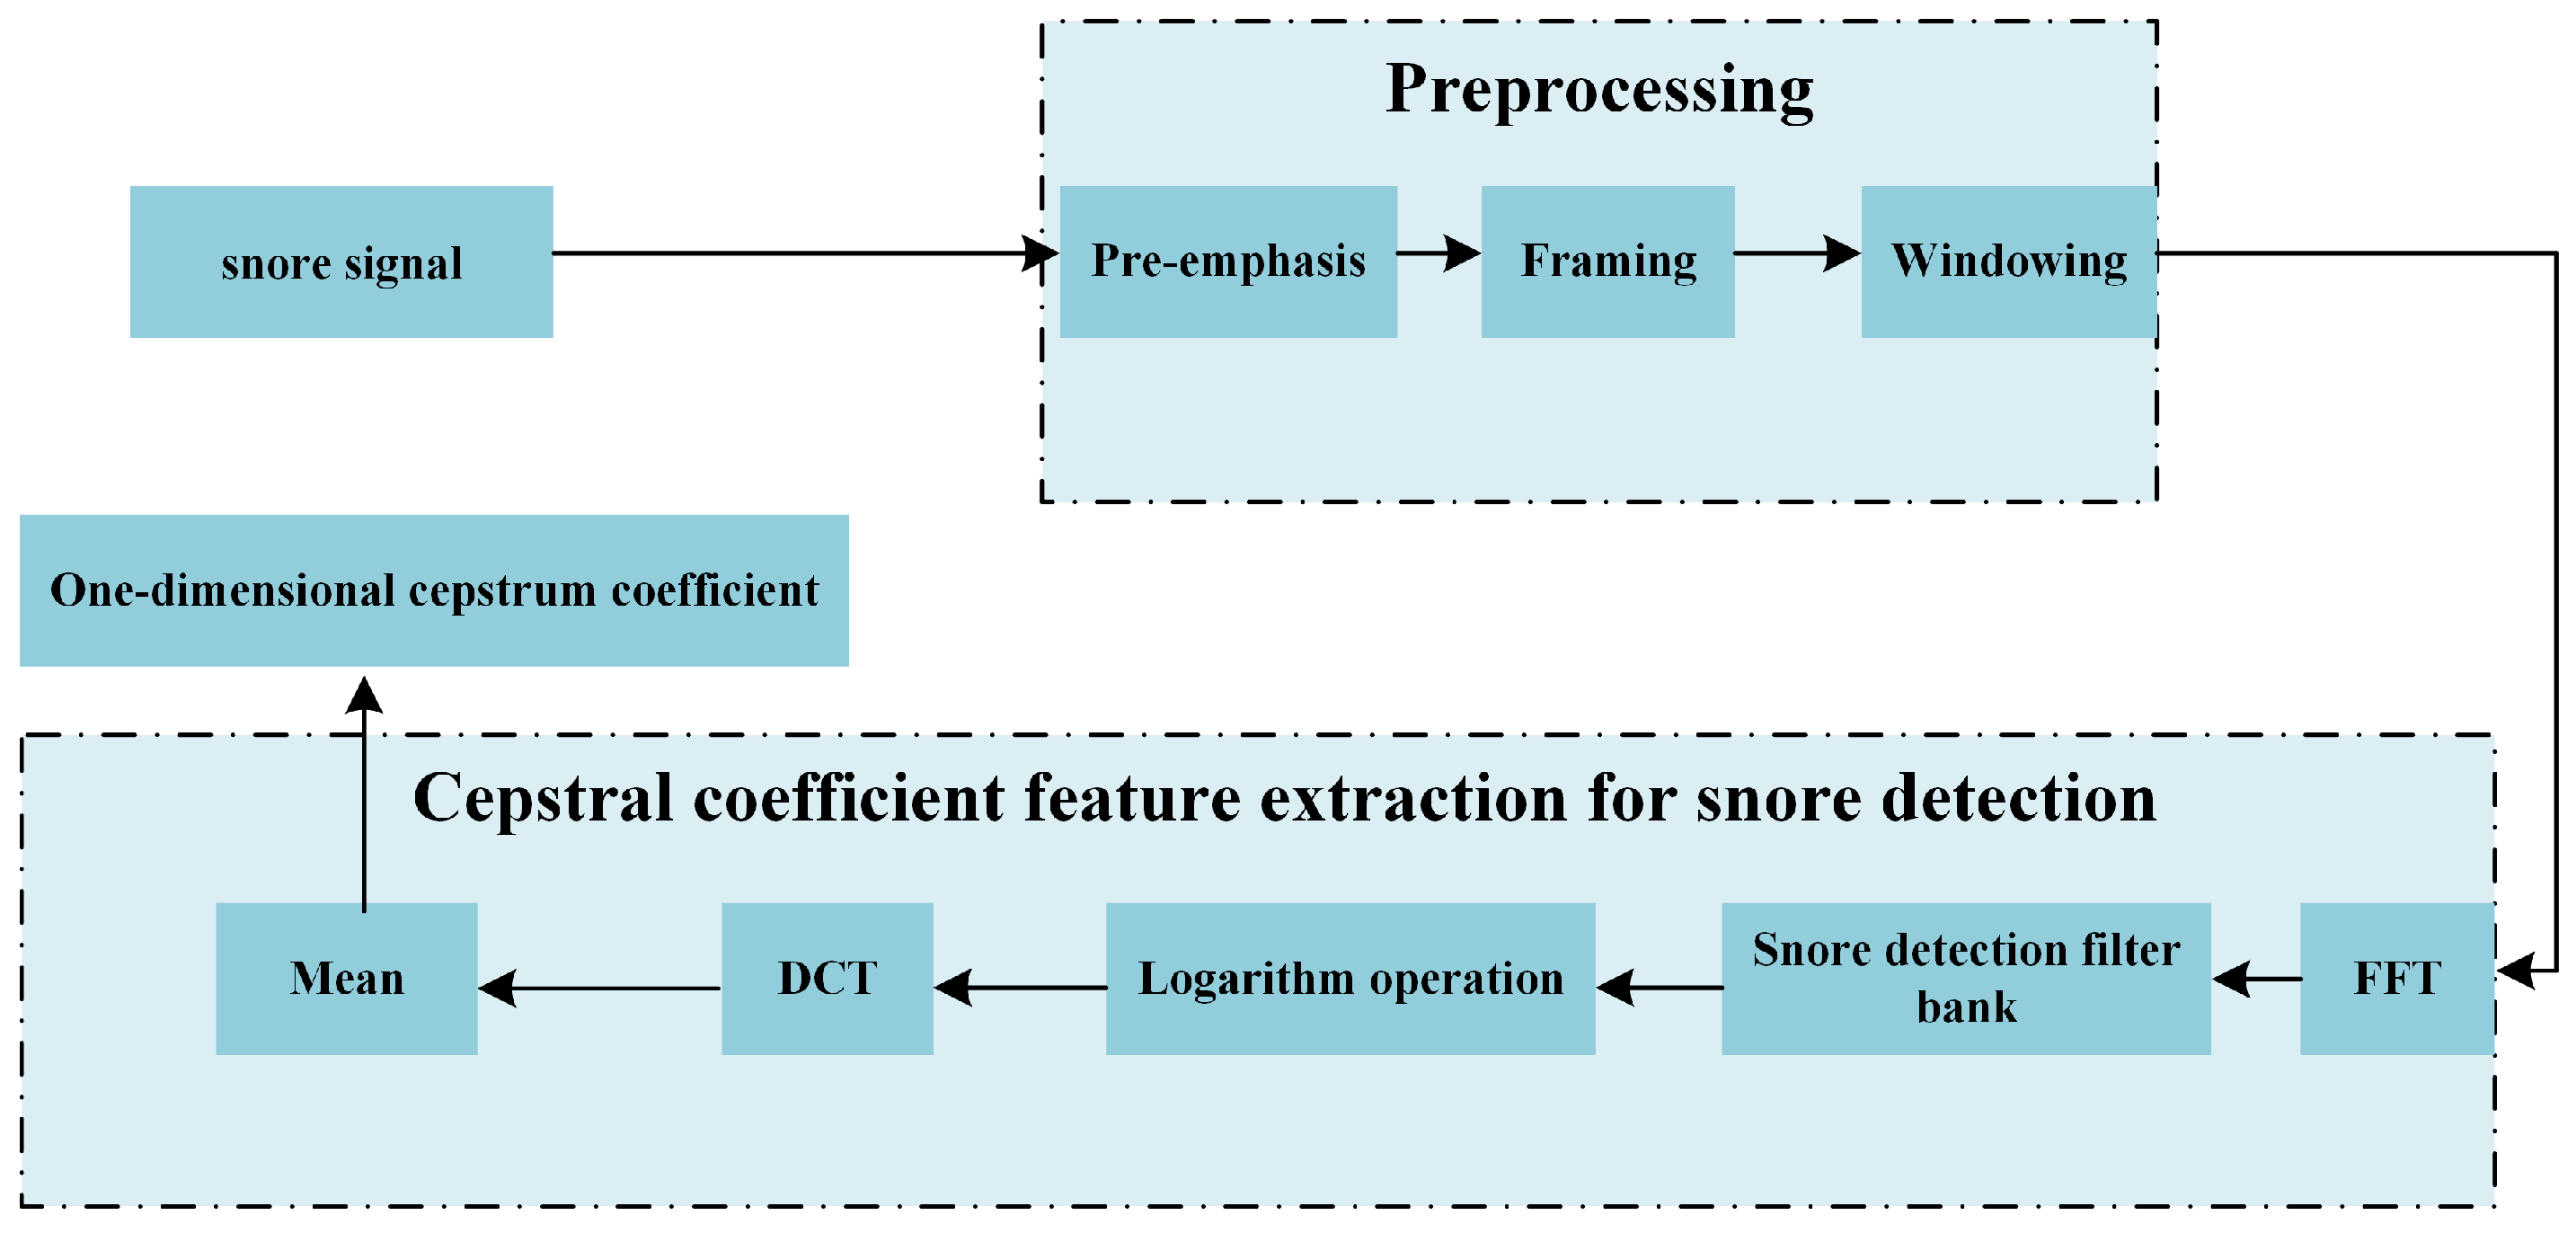
5.3. Cepstral Feature Extraction

The Linear Predictive Cepstral Coefficient (LPCC) serves as a representation of the LPCs in the cepstral domain [27]. The LPCCs offer the advantage of low computational overhead and ease of implementation. In this study, 16 LPC parameters are extracted, followed by the computation of the LPCCs from these LPCs. Subsequently, the coefficients in higher dimensions are averaged. Mel Frequency Cepstral Coefficients (MFCCs) are commonly employed in speech processing, including snore recognition. For this work, we utilize 24 sets of Mel filters and calculate 13-dimensional Mel frequency cepstral coefficients. Given that these coefficients form a high-dimensional matrix, they are averaged to reduce the data volume [28].
The concept of snore detection division is a novel approach, inspired by both uniform and non-uniform divisions. It has been established that snore detection frequency division surpasses other tripartite frequency division methods in the binary classification of snore/breath sounds. As such, we replace the Mel-triangle filter bank with a snore-detection triangular filter bank for coefficient extraction. The steps of Snore Detection Cepstral Coefficient (SDCC) extraction are illustrated in Figure 7.
The procedure includes the following steps:
Step 1: Extraction of the snore signal.
Step 2: Preprocessing of the snore signal, including pre-emphasis, framing, and windowing.
Step 3: Perform Fast Fourier Transform (FFT) on the short-time snore signal as given by
X ( i , k ) = FFT [ x i ( m ) ]
where x i ( m ) denotes the i t h frame of the snore signal.
Step 4: Compute the short-time frame spectral energy, E ( i , k ) , of the snore signal used by
E ( i , k ) = | X ( i , k ) | 2
Step 5: Utilize Equation (6) to compute the center frequency, f ( m ) , of the snore detection division and obtain the snore detection filter bank. After energy filtering, the filtered energy is computed and a series of band-pass filters, H m ( k ) , are set in the spectral interval. The frequency response of the snore detection filter bank is shown in Figure 8.
In Figure 8, the green section represents the low-frequency portion of the snore detection division, and the red section represents the high-frequency portion.
Step 6: Obtain the response, H m ( k ) , corresponding to each filter. The energy of the snore signal within the snore detection filter is computed by multiplying it with the short-term energy, E ( i , k ) , of the snore signal in the frequency domain and summing the results given by
S ( i , m ) = k = 0 N 1 E ( i , k ) H m ( k ) , 0 m < M .
Step 7: The short-time energy S ( i , m ) that passes through the filter undergoes a log transformation and a discrete cosine transformation, as introduced in
S D C C ( i , n ) = 2 / M m = 0 M 1 log ( S ( i , m ) ) cos π n ( 2 m 1 ) 2 M
where M is the number of snore filter banks and n represents the order of SDCC parameters.
In this study, the number of snore detection filter banks is 25, and the order n of SDCC is 13. After SDCC extraction, the average value is calculated.

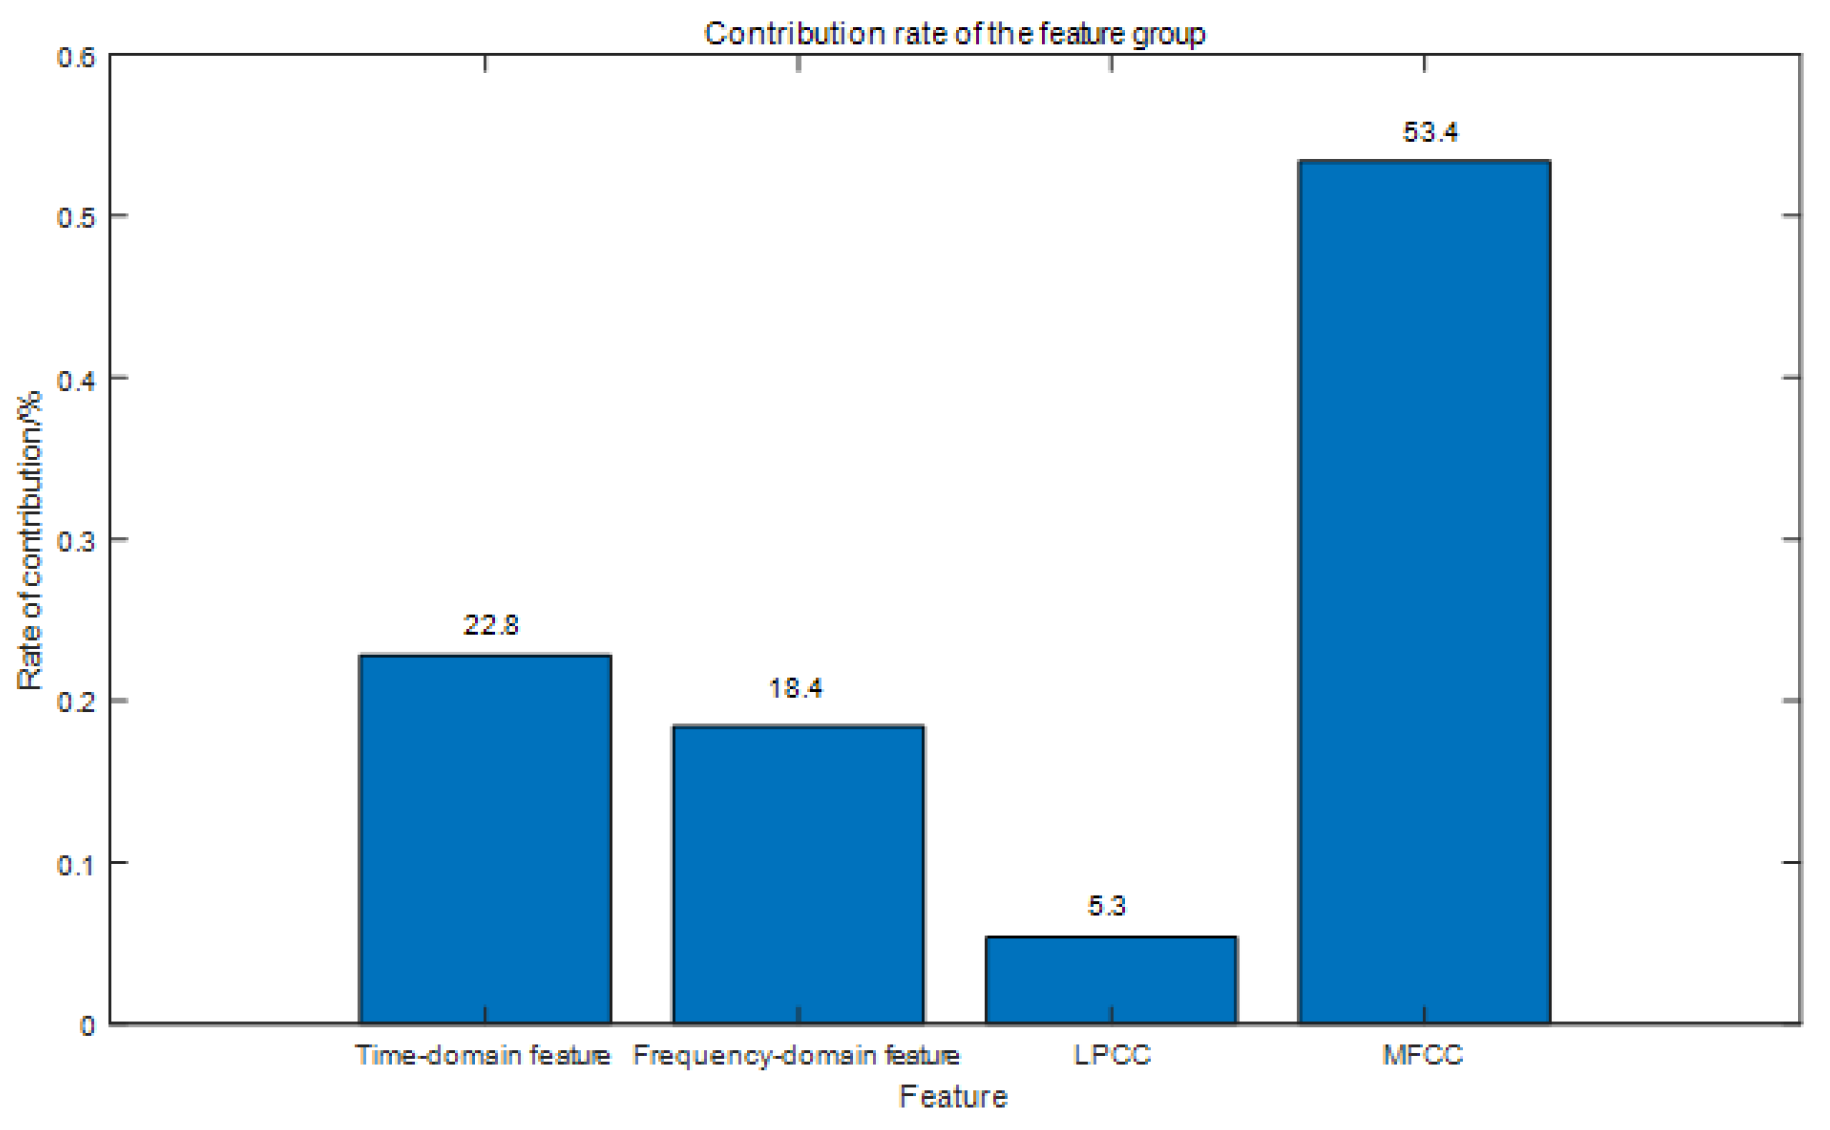
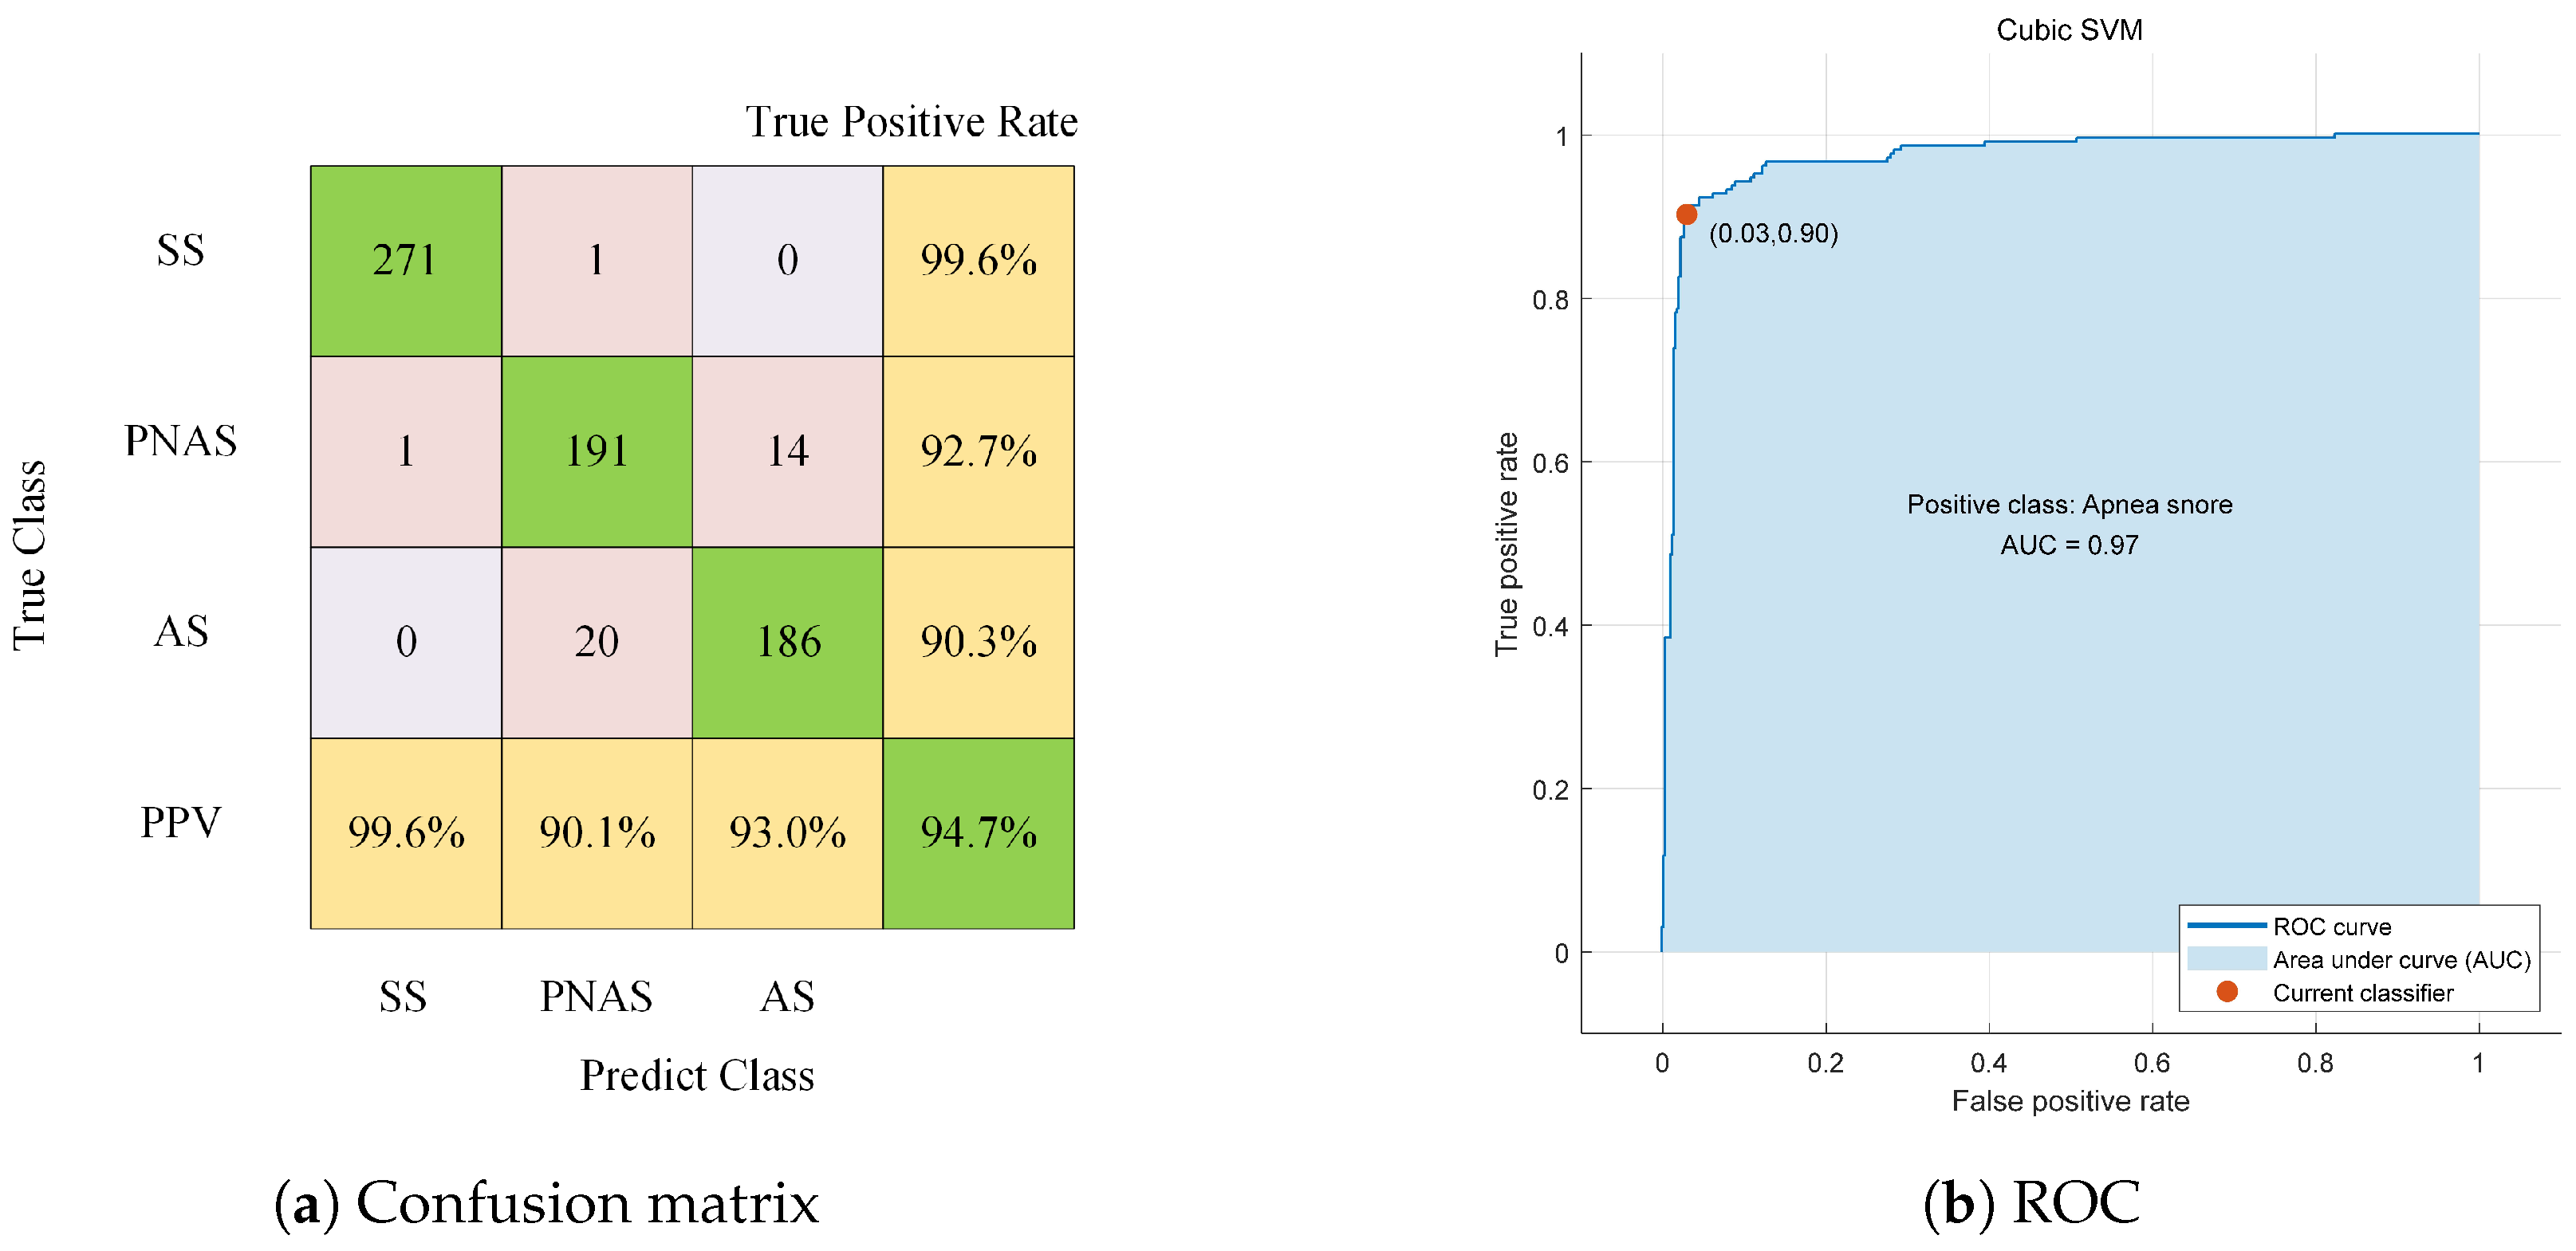
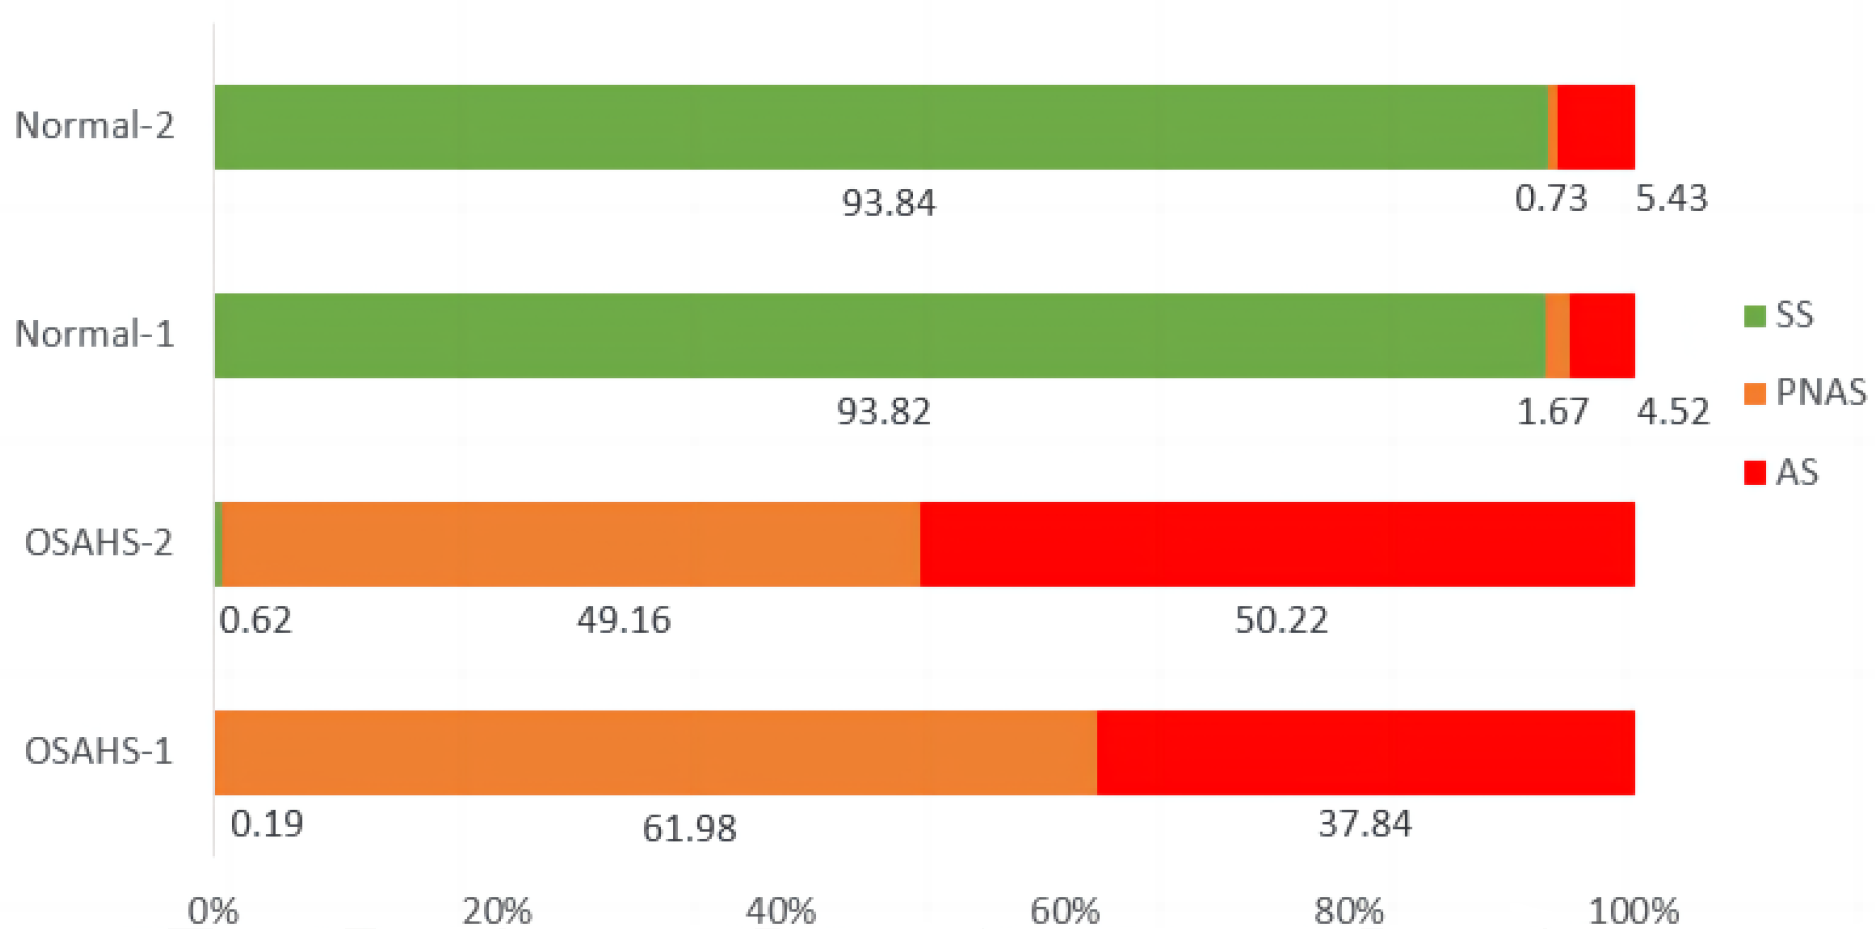
6. Experimental Results and Discussion

The frequency-domain characteristics of the three data types were extracted and visualized using a box plot, as demonstrated in Figure 9. The plots (a)–(h) correspond to spectral entropy, spectral centroid, spectral spread, spectral flatness, spectral roll-off point, spectral skewness, spectral slope, and PR800, respectively. Noticeable differences in the spectral characteristics of the three data types are evident, validating the utility of these features.
The relevant features mentioned in Section 4 are all extracted in this experiment, encompassing 14-dimensional time-domain characteristics, 8-dimensional frequency-domain characteristics, and 29-dimensional cepstral features from LPCC and MFCC, totaling 51 dimensions. The 8-dimensional frequency-domain characteristics are combined with the 29-dimensional cepstral features from LPCC and MFCC to form a 37-dimensional spectral feature set.
The Relief-F method can be employed for feature selection, and the key parameter, K, was determined by 10-fold cross-validation. Canonical Correlation Analysis (CCA) was employed for feature fusion, selecting representative comprehensive indicators from two sets of random variables [29,30,31]. The correlation of these indicators was used to represent the correlation of the original two sets of variables.
Feature selection and fusion were conducted through the ReliefF-CCA method from the time-domain and frequency-domain features. Subsequently, these fused features are integrated with the cepstral features from LPCC and MFCC using ReliefF-CCA once again, resulting in a 6-dimensional feature set.
Through a combination of experiments using the CCA and RelieF methods, the cepstral features of LPCC and MFCC are processed with CCA, and subsequent redundancy segments are filtered out via Relief F. Then, the processed features are sequentially combined with time-domain and frequency-domain features through the Relief F-CCA method, yielding a consolidated 30-dimensional feature set, as depicted in Figure 10.
The contribution rates of different features to the classification task for the 51-dimensional dataset are shown in Figure 11. The breakdown indicates that time-domain features account for 22.8%, frequency-domain features constitute 18.4%, LPCC represents 5.3%, and MFCC comprises 53.4%.
Despite MFCC having the highest contribution rate to the classification task, it cannot surpass the classification accuracy of the four feature sets when used alone. Therefore, a new 26-dimensional cepstral feature set for Subspace KNN is proposed, integrating the previously mentioned 13-dimensional SDCC feature set with the 13-dimensional MFCC.
The features extracted from the dataset underwent ten-fold cross-validation for classification. The classification results is shown in Table 2. The optimal feature combination and fusion method, according to prior knowledge, is the 30-dimensional feature set. The confusion matrix of its final recognition result and its ROC and AUC are shown in Figure 12. The confusion matrix, ROC, and AUC of the final recognition results for the 26-dimensional feature set are shown in Figure 13.
The 26-dimensional feature set, with Cubic SVM as the reference classifier, exhibits a distinct advantage in the two categories of snoring sounds in OSAHS patients. The overall accuracy exceeds that of the 30-dimensional feature set. The subspace KNN for this feature set yields the best results, further enhancing the sensitivity and specificity of binary classification, as shown in Figure 14.
Utilizing only a pair of classifiers does not sufficiently demonstrate the versatility of the proposed methods. As a result, we supplemented our experiment with other classifiers, including K-nearest neighbor, linear SVM, decision tree, linear judgment, bagged decision tree, BPNN (Back Propagation Neural Network), and CNN. These classifiers were trained using features derived from the five proposed methods. The final accuracy results are presented in Figure 15.
As depicted in Figure 15, the accuracy of the additional seven classifiers improves, demonstrating that the Subspace KNN is the optimal classifier for this particular experiment.
We fed the 26-dimensional feature set into the Subspace KNN for training and model generation. The model was then utilized to identify OSAHS using the sleep acoustic signals of an entire night from four subjects. Figure 16 and Figure 17 show the results for four data samples. Specifically, OSAHS-1 has an AHI value of 16, classifying it as a moderate level, while OSAHS-2 has an AHI value of 30, placing it in the severe category. Figure 16 depicts the proportion of three types of snoring across each case. In contrast, Figure 17 illustrates the specific number of events, highlighting the recognition results of various snoring sounds across the individual cases.
From the predicted results, we noted that the percentages of apnea snoring in the two OSAHS patients were 37.84% and 50.22%, lasting 1015 and 1420 s, respectively. With the acoustic event length set at 5 s, we multiplied the number of snoring events by 5 to determine the duration of snoring. Given that the actual snoring duration lies between two and three seconds, we adjusted the duration of snoring by a factor of 2.5 (i.e., 2.5 times the number of snoring events) to make the results more scientific.
The main goal of distinguishing between apnea snoring and pathological snoring is to better understand the severity of apnea. The results show that OSAHS-1 patients, who had a lower AHI than OSAHS-2 patients (AHI = 30), also had a lower percentage of apnea snoring. This suggests that the proportion of apnea snoring can effectively indicate the severity of the patient’s condition.
Moreover, we also monitored the snoring sounds of two normal subjects throughout the night. The data show that simple snoring sounds made up 93.82% and 93.84% of the total snoring sounds for the two normal subjects. Suspected pathological snoring sounds accounted for 6.19% and 6.16%. A comparison of the proportion of pure snoring and pathological snoring among the four test subjects indicates that the proportion of suspected pathological snoring in normal subjects does not exceed 10% of total snoring. This threshold could serve as a useful benchmark for early OSAHS detection.

7. Conclusions

A comprehensive analysis of snoring sounds originating from both OSAHS patients and the general populace was conducted in this study, leading to the proposition of a novel data type: sleep-apnea-associated snoring. The primary aim of this innovative data was to discern differences between apneic and non-apneic snoring sounds, especially in instances where an OSAHS diagnosis had been confirmed. We engaged in the extraction of a broad range of acoustic features which were subsequently filtered and fused to achieve computational reduction and to optimize the feature set.
Our findings indicate that a combination of Cubic SVM and Subspace KNN classifiers with a 26-dimensional feature set yields optimal results, maintaining a balance between computational efficiency and robustness during three-type data classification. A feature set with 30 dimensions was capable of achieving accuracies of 94.7% and 96.1%. The features within this set represent the optimal features derived from prior knowledge fusion and are of low dimensionality, thereby offering the potential for extraction from the snoring sounds of a large subject pool. Notably, the fused 26-dimensional feature set demonstrated superior performance with reduced dimensionality and enhanced accuracy compared to the optimal traditional feature set (30 dimensions). The two reference classifiers yielded impressive accuracies of 95.6% and 97.8%.
The advent of this newly fused feature set is a promising development for OSAHS diagnostic systems. Future research efforts will involve the acquisition of snoring sounds from a larger cohort of subjects, which will serve to confirm the robustness of the methodologies employed in this study and further refine various details. Ultimately, we aim to develop a portable, home-based OSAHS diagnostic tool. As we move forward, we plan to collect a more diverse range of data from OSAHS patients of varying severity levels, thereby providing a more substantial data foundation and scientific basis for our experiments. Concurrently, our research will seek to extract novel features from these new data types to better characterize the severity of OSAHS.

Author Contributions

Conceptualization, Y.F. and D.L.; writing–original draft preparation, Y.F., D.L. and S.Z.; methodology, Y.F., D.L. and S.Z.; software, Y.F. and S.Z.; writing–review and editing, Y.F. and D.L.; validation, Y.F., S.Z. and D.D. All authors have read and agreed to the published version of the manuscript.

Funding

This research was supported by the National Natural Science Foundation of China (grant no.: 61901393), the Ministry of Education “Chunhui Project” of China (grant no.: Z2018118), the National Natural Science Foundation of China (grant no.: 61571371), and the Chunhui Plan of the Ministry of Education of China (no.: 202201500).

Data Availability Statement

Data supporting reported results can be obtained upon request. Please contact the author via email for further information.

Conflicts of Interest

The authors declare no conflict of interest.

References

  1. Koffel, E.; Kroenke, K.; Bair, M.J.; Leverty, D.; Polusny, M.A.; Krebs, E.E. The bidirectional relationship between sleep complaints and pain: Analysis of data from a randomized trial. Health Psychol. 2016, 35, 41–49. [Google Scholar] [CrossRef] [PubMed]
  2. Bradley, T.D.; Floras, J.S. Obstructive sleep apnoea and its cardiovascular consequences. Lancet 2009, 373, 82–93. [Google Scholar] [CrossRef] [PubMed]
  3. Engleman, H.M.; Douglas, N.J. Sleep. 4: Sleepiness, cognitive function, and quality of life in obstructive sleep apnoea/hypop-noea syndrome. Thorax 2004, 59, 618–622. [Google Scholar] [CrossRef] [PubMed]
  4. Fung, J.W.; Li, T.S.; Choy, D.K.; Yip, G.W.; Ko, F.W.; Sanderson, J.E.; Hui, D.S. Severe obstructive sleep apnea is associated with left ventricular diastolic dysfunction. Chest 2002, 121, 422–429. [Google Scholar] [CrossRef]
  5. Yang, H. The Research and Realization of OSAHS Detection System Based on AHI. Ph.D. Thesis, Dalian University of Technology, Dalian, China, 2015. [Google Scholar]
  6. Duan, X.Q.; Zheng, H.L. Obstructive sleep apnea hypopnea syndrome study on pathogenesis and prognosis. J. Clin. Otorhinolaryngol. Head Neck Surg. 2017, 31, 1376–1380. [Google Scholar]
  7. Pevernagie, D.; Aarts, R.M.; Meyer, M.D. The acoustics of snoring. Sleep Med. Rev. 2010, 14, 131–144. [Google Scholar] [CrossRef]
  8. Michael, H.; Andreas, S.; Thomas, B.; Beatrice, H.; Werner, H.; Holger, K. Analysed snoring sounds correlate to obstructive sleep disordered breathing. Eur. Arch. Oto-Rhino-Laryngol. 2008, 265, 105–113. [Google Scholar] [CrossRef]
  9. Perez-Padilla, J.R.; Slawinski, E.; Difrancesco, L.M.; Feige, R.R.; Remmers, J.E.; Whitelaw, W.A. Characteristics of the snoring noise in patients with and without occlusive sleep apnea. Am. Rev. Respir. Dis. 1993, 147, 635–644. [Google Scholar] [CrossRef]
  10. Herath, D.L.; Abeyratne, U.R.; Hukins, C. HMM-based Snorer Group Recognition for Sleep Apnea Diagnosis. In Proceedings of the 35th Annual International Conference of the IEEE EMBS, Osaka, Japan, 3–7 July 2013; pp. 3962–3964. [Google Scholar]
  11. Shen, K.; Li, W.; Yue, K. Support Vector Machine OSAHS Snoring Recognition by Fusing LPCC and MFCC. J. Hangzhou Dianzi Univ. Sci. 2020, 40, 1–6. [Google Scholar]
  12. Jiang, Y.; Peng, J.; Song, L. An OSAHS evaluation method based on multi-features acoustic analysis of snoring sounds. Sleep Med. 2021, 84, 317–323. [Google Scholar] [CrossRef]
  13. Luo, Y.; Jiang, Z. A simple method for monitoring sleeping conditions by all-night breath sound measurement. J. Interdiscip. Math. 2017, 20, 307–317. [Google Scholar] [CrossRef]
  14. Fang, Y.; Jiang, Z.W.; Wang, H.B. A novel sleep respiratory rate detection method for obstructive sleep apnea based on characteristic moment waveform. J. Healthc. Eng. 2018, 2018, 1–10. [Google Scholar] [CrossRef]
  15. Sun, J.; Hu, X.; Peng, S.; Ma, Y. A Review on Snore Detection. World J. Sleep Med. 2020, 7, 552–554. [Google Scholar]
  16. Zhao, S.; Fang, Y.; Wang, W.; Liu, D. Analysis of Sleeping Respiratory Signal Utilizing Frequency Energy Features. In Proceedings of the 2022 5th International Conference on Information Communication and Signal Processing, Shenzhen, China, 26–28 November 2022; pp. 86–90. [Google Scholar]
  17. Piczak, K.J. Environmental sound classification with convolutional neural networks. In Proceedings of the 25th International Workshop on Machine Learning Signal Process, Boston, MA, USA, 17–20 September 2015; pp. 1–6. [Google Scholar]
  18. Cui, X.; Su, Z. A new feature extraction method of respiration signal and its application. Chin. J. Med. Phys. 2018, 35, 214–218. [Google Scholar]
  19. Wang, C.; Peng, J.; Song, L.; Zhang, X. Automatic snoring sounds detection from sleep sounds via multi-features analysis. Australas Phys. Eng. Sci. Med. 2017, 40, 127–135. [Google Scholar] [CrossRef] [PubMed]
  20. Zeng, J.; Teng, Z. Spectral Centroid Applications on Power Harmonic Analysis. In Proceedings of the CSEE, New Delhi, India, 23–24 February 2013; Volume 33, pp. 73–80. [Google Scholar]
  21. Kim, H.G.; Moreau, N.; Sikora, T. MPEG-7 Audio and Beyond: Audio Content Indexing and Retrieval; Wiley: West Sussex, UK, 2005. [Google Scholar]
  22. Peeters, G. A large set of audio features for sound description (similarity and classification). Cuid. Proj. Ircam Tech. Rep. 2004, 54, 1–25. [Google Scholar]
  23. Mokhsin, M.B.; Rosli, N.B.; Adnan, W.A.W.; Manaf, N.A. Automatic music emotion classification using artificial neural network based on vocal and instrumental sound timbres. J. Comput. Sci. 2014, 10, 2584–2592. [Google Scholar] [CrossRef]
  24. Shelar, V.S.; Bhalke, D.G. Musical instrument recognition and transcription using neural network. In Proceedings of the Emerging Trends in Electronics and Telecommunication Engineering, Karimnagar, Telangana, India, 13–14 December 2014; pp. 31–36. [Google Scholar]
  25. Misra, H.; Bourlard, H. Spectral entropy feature in full-combination multistream for robust ASR. In Proceedings of the ISCA European Conference on Speech Communication and Technology, Lisbon, Portugal, 4–8 September 2005; pp. 2633–2636. [Google Scholar]
  26. Toh, A.M.; Togneri, R.; Nordholm, S. Spectral entropy as speech features for speech recognition. In Proceedings of PEECS. 2005, pp. 22–25. Available online: https://www.researchgate.net/publication/247612912_Spectral_entropy_as_speech_features_for_speech_recognition (accessed on 28 September 2023).
  27. Luo, Y.; Wu, C.; Zhang, Y.; Li, X. A further speech signal features extraction algorithm based on LPC Mel frequency scale. J. Chongqing Univ. Posts Telecommun. Sci. Ed. 2016, 28, 175–179. [Google Scholar]
  28. Cao, D.; Gao, X.; Gao, L. An Improved Endpoint Detection Algorithm Based on MFCC Cosine Value; Springer Science+Business Media: New York, NY, USA, 2017; pp. 3–4. [Google Scholar]
  29. Kononenko, I. Theoretical and empirical analysis of ReliefF and RReliefF. Mach. Learn. J. 2008, 53, 23–69. [Google Scholar]
  30. Correa, N.; Li, Y.; Adali, T.; Calhoun, V.D. Canonical correlation analysis for feature-based fusion of biomedical imaging modalities and its application to detection of associative networks in schizophrenia. IEEE J. Sel. Top. Signal Process 2008, 2, 998–1007. [Google Scholar] [CrossRef]
  31. Xue, B.; Deng, B.; Hong, H.; Wang, Z.; Zhu, X.; Feng, D.D. Non-Contact Sleep Stage Detection Using Canonical Correlation Analysis of Respiratory Sound. IEEE J. Biomed. Health Inform. 2020, 24, 618–620. [Google Scholar] [CrossRef] [PubMed]
Figure 1. Overall flow chart of this study.
Electronics 12 04148 g001
Figure 2. Sleep data acquisition system.
Electronics 12 04148 g002
Figure 3. Irregular sleep audio for OSAHS patients.
Electronics 12 04148 g003
Figure 4. One hour of snoring detection. (a) time-domain diagram, (b) predictive label diagram.
Electronics 12 04148 g004
Figure 5. Comparative illustration of three snoring types: (a) apnea segments, (b) non-apnea segments of patient data, and (c) normal human respiratory segments. For this study, a dataset comprising 206 instances of PNAS, 206 instances of AS, and 272 instances of SS, yielding a total of 684 snores, was assembled.
Electronics 12 04148 g005
Figure 6. The comparison of snore signal between normal and OSAHS individuals: (a,b) are waveforms in time and frequency domain of normal snoring sounds, (c,d) are waveforms in time and frequency domain of OSAHS snoring sounds.
Electronics 12 04148 g006
Figure 7. Flowchart of snore detection cepstral coefficient extraction.
Electronics 12 04148 g007
Figure 8. Frequency response of the snore detection filter bank.
Electronics 12 04148 g008
Figure 9. Box plot of spectral features for three speech types: (a) spectral entropy, (b) spectral centroid, (c) spectral spread, (d) spectral flatness, (e) spectral roll-off point, (f) spectral skewness, (g) spectral slope, (h) PR800.
Electronics 12 04148 g009
Figure 10. Schematic diagram illustrating feature selection and fusion of LPCC, MFCC, and time-frequency characteristics using Relief-F and CCA.
Electronics 12 04148 g010
Figure 11. Contribution rate of each feature group.
Electronics 12 04148 g011
Figure 12. Confusion matrix and ROC for 30-dimensional feature set (Cubic SVM).
Electronics 12 04148 g012
Figure 13. Confusion matrix and ROC for 26-dimensional feature set (Cubic SVM).
Electronics 12 04148 g013
Figure 14. Confusion matrix and ROC for 26-dimensional feature set (Subspace KNN).
Electronics 12 04148 g014
Figure 15. Accuracy of 26-dimensional features across nine classifiers.
Electronics 12 04148 g015
Figure 16. Predicted snoring proportions for the four subjects.
Electronics 12 04148 g016
Figure 17. Predicted snoring sound counts for the four subjects.
Electronics 12 04148 g017
Table 1. Mixed datasets A1-reference classifier accuracy.
Feature TypeReference Classifier AccuracySensitivitySpecificityAUC
Wavelet Frequency Division (16D)77.5%77.5%77.5%0.81
Mel Frequency Division (16D)71.3%68.8%73.8%0.73
ERB Frequency Division (16D)72.5%78.8%62.5%0.77
SD Frequency Division (16D)80.0%78.8%81.3%0.87
Table 2. Classification results.
DimensionClassifierThree-Way ClassificationSS/OPSPNAS/AS
Acc (%) Sen (%) Spe (%) Sen (%) Spe (%)
6Cubic SVM85.896.097.878.183.7
Subspace KNN85.897.892.283.885.1
26Cubic SVM95.699.699.593.293.6
Subspace KNN97.8100.099.398.196.1
30Cubic SVM94.799.699.591.792.2
Subspace KNN96.199.699.094.195.1
37Cubic SVM93.798.298.891.292.6
Subspace KNN63.779.480.070.264.9
51Cubic SVM93.999.699.591.289.8
Subspace KNN58.672.475.266.964.7
Disclaimer/Publisher’s Note: The statements, opinions and data contained in all publications are solely those of the individual author(s) and contributor(s) and not of MDPI and/or the editor(s). MDPI and/or the editor(s) disclaim responsibility for any injury to people or property resulting from any ideas, methods, instructions or products referred to in the content.

