Article

Large-Scale Service Function Chaining Management and Orchestration in Smart City

1
Department of Software Convergence, Soonchunhyang University, Asan 31538, Republic of Korea
2
Department of Computer Software Engineering, Soonchunhyang University, Asan 31538, Republic of Korea
*
Author to whom correspondence should be addressed.
Electronics 2023, 12(19), 4018; https://doi.org/10.3390/electronics12194018
Submission received: 12 September 2023 / Revised: 22 September 2023 / Accepted: 23 September 2023 / Published: 24 September 2023
(This article belongs to the Special Issue Big Data and Large-Scale Data Processing Applications)

Abstract

:
In the core networking of smart cities, mobile network operators need solutions to reflect service function chaining (SFC) orchestration policies while ensuring efficient resource utilization and preserving quality of service (QoS) in large-scale networking congestion states. To offer this solution, we observe the standardized QoS class identifiers of smart city scenarios. Then, we reflect the service criticalities via cloning virtual network function (VNF) with reserved resources for ensuring effective scheduling of request queue management. We employ graph neural networks (GNN) with a message-passing mechanism to iteratively update hidden states of VNF nodes with the objectives of enhancing allocation of resource blocks, accurate detection of availability statuses, and duplication of heavily congested instances. The deployment properties of smart city use cases are presented along with their intelligent service functions, and we aim to activate a modular architecture with multi-purpose VNFs and chaining isolation for generalizing global instances. Experimental simulation is conducted to illustrate how the proposed scheme performs under different congestion levels of SFC request rates, while capturing the key performance metrics of average delay, acceptance ratios, and completion ratios.

1. Introduction

Smart cities leverage the Internet of Things (IoT) to collect data from various sources and employ data-driven approaches to improve the management, evaluation, and decision-making processes. The quality of life is upgraded for residents, and this makes urban operations more promising. From a core network perspective, service function chaining (SFC) is an enabling paradigm for elastically controlling the massive network services (NS) in smart cities [1,2]. SFC can effectively enforce policies and regulations set by city authorities, including data retention policies, content filtering, compliance checks, etc. Moreover, SFC optimizes service delivery [3], resource efficiency [4], quality of experience (QoE)/quality of service (QoS) [5,6], and service-specific routing [7]. In short, SFC is renowned for constructing a responsive digital infrastructure that supports network softwarization-virtualization and advances the smart city ecosystem.
A one-way procedure flow of executing an SFC request is illustrated in Figure 1. The SFC orchestrator (SFCO) initiates the process by receiving the service request and evaluating policies to define the SFC. Subsequently, the network function virtualization orchestrator (NFVO) selects and places the appropriate virtual network function (VNF) based on resource availability and policies. The VNF manager (VNFM) controls the VNF lifecycle management while ensuring accurate instantiation and operation. The SFCO constructs the logical SFC path, while the software-defined networking (SDN) controller orchestrates traffic steering through flow rule installation [8,9,10]. A sequence of service functions (SFs) is defined in SFCO associated to VNF forwarding graph (VNFFG). The SFCO, VNFM, and SDN controller continually monitor and optimize the SFC for efficient performance [11,12]. Finally, the SFCO manages the termination of the SFC when the service is no longer required, then resources are released for further requests. The management and orchestration (MANO) process ensures that NS are delivered in a well-controlled chain that meets the requirements and policies associated with the SFC request. Edge computing can be leveraged to this orchestration chain to further enhance the edge-based processing and resource allocation, particularly for IoT-aided smart city services [13,14,15,16,17].
In the process flow of handling SFC requests, there are several potential challenges and future directions for researchers and network operators, including resource constraints, VNF failures, SFC provisioning delays, management overhead, integration issues, etc. [18,19,20]. In our study, we specifically emphasize scalability challenges, which are a critical issue for smart city use cases. As cities grow and urbanize, the number of connected IoT devices and applications within the city infrastructure increases exponentially [21,22]. Smart cities deal with a wide range of services, and each service requires distinct SFC that leads to a proliferation of SFC requests.
To tackle large-scale SFC, designing a system architecture with auto-scaling mechanisms is significant in order to adjust the number of SF instances to match with available resources. When traffic increases, new instances can be dynamically created to handle the load, and when traffic decreases, instances can be scaled down to conserve resources. The primary challenges of the system include QoS assurances, cross-domain management, energy/resource efficiency, and IoT interoperability, which have arisen via the diverse integration of IoT taxonomies from multi-vendor standard or proprietary devices.
Within all the challenges, core networking orchestration policies can be enhanced to extract the hidden features of SF or VNF in the chain for proactively preventing the SFC request or execution failure, which leads to better QoS assurances and cross-domain smart city management. Graph neural networks (GNN) are integrated with the controller and orchestrator to activate auto-scaling mechanisms in this study. This paper also considers the current workload or utilization of resources in each SFC, then indicates the VNF instances that are highly congested to decide whether to duplicate the whole instances or re-allocate the resources.
This paper is organized as follows. Section 2 presents the background studies and related works. Section 3 provides the working flow of our system model and illustrates the proposed GNN for large-scale SFC in smart cities. Section 4 explains the performance evaluation. Finally, Section 5 summarizes the conclusion and future works.

2. Background Studies and Related Works

In this section, we provide an extensive overview of the literature related to our study in the field of IoT service composition, QoS class identifier (QCI), and GNN-based optimization in smart city use cases. We aim to draw attention to how service composition groups multiple IoT data sources or services to activate smart systems. We then analyze the upper-bound threshold at which each labeled smart city application should perform for reliable service delivery. Finally, we review state-of-the-art optimization approaches for enhancing the efficiency using GNN in this study domain.

2.1. IoT Service Composition

IoT signifies the advancement of smart cities by offering technical functionalities, such as sensor installation, information exchange protocols, and massive stream data, to enable the integration of smart technologies, industries, and management [23]. On top of these functionalities, IoT service composition in smart cities involves combining multiple services from various data sources to develop impactful policies. The existing service composition mechanisms were initially designed for static enterprise services, which lack the ability to address the scalability challenges posed by IoT system [24].
Semantic web service composition has leveraged semantic descriptions to enhance the efficiency and effectiveness of discovering and composing IoT services, which addressing challenges on heterogeneity and dynamism [25]. Furthermore, machine or deep (reinforcement) learning offers various solutions that can streamline IoT service composition by discovering services from diverse sources, selecting them based on criteria such as functionality and QoS, and automating the composition process (e.g., deep reinforcement learning for moving IoT services [26], genetic algorithms for QoS-based composition [27], and machine learning-driven QoS-aware service composition [28]).
To analyze the QoS factors for the service compositions, key considerations include availability, response time, scalability, cost, and reliability, which ensure that the composed services are responsive, cost-effective, and flexible for end users and urban development initiatives [29].

2.2. QCI for Smart City Applications

QCI is used to define the characteristics and requirements of different traffic types, which ensures that the network controller can effectively prioritize data flows based on specific demands. While there is no specific standard for labeling smart city use cases, certain QCIs from 3GPP TS 23.203 V12.2.0 [30] can be used to represent the relevant example services. Table 1 presents the QCI-index, resource type, priority level, packet delay budget (PDB), and packet error loss rate (PELR) for smart city examples. In terms of resource types, guaranteed bit rate (GBR) assures minimum bandwidth to the end users even if the network is congested. In contrast, non-GBR provides the end users with optimal service, but there is no guarantee that the end user will always get the requested bandwidth. PDB and PELR represent the upper-bound thresholds as maximum tolerable delays and packet loss between end users to the policy and charging enforcement function. Each QCI-index is associated to a smart city use case, and we can describe it with examples as follows:
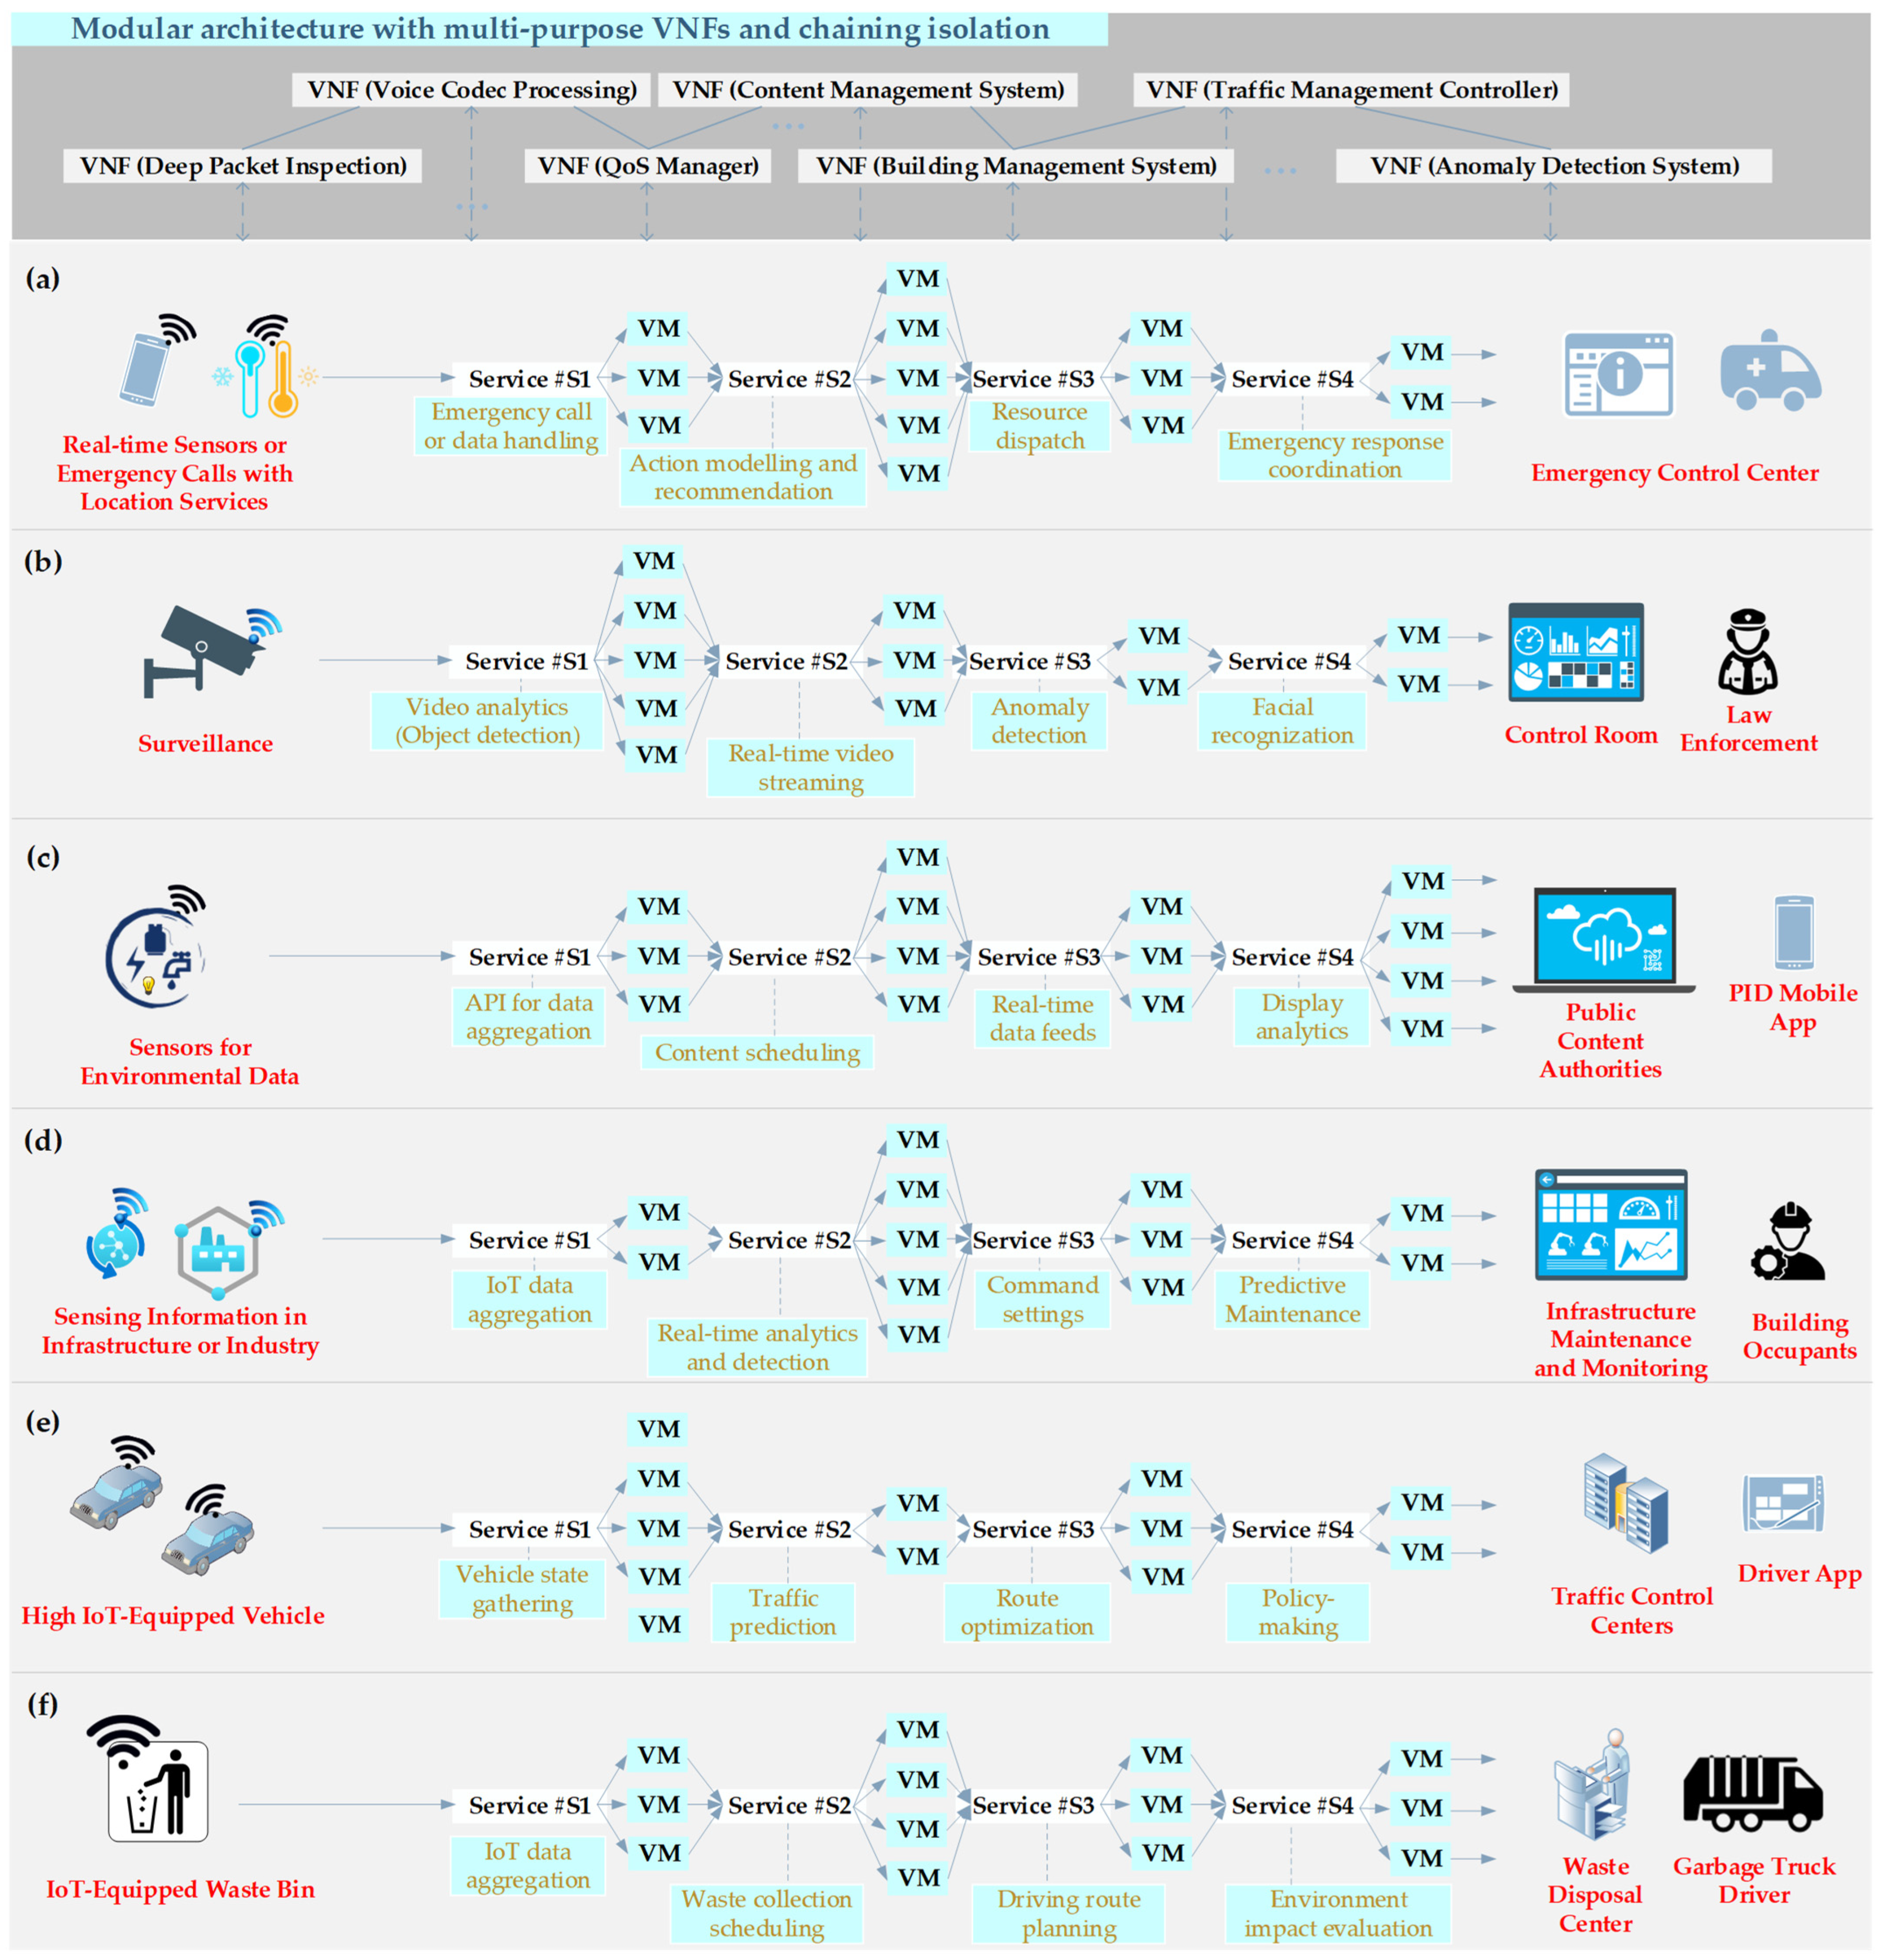
  • QCI 1 (conversational voice) is typically used for voice communication services, including smart emergency services (e.g., emergency response systems, public safety networks, or other government services).
  • QCI 2 (conversational video) is designed for real-time video surveillance systems in traffic monitoring, object detection, facial recognition, or other visual monitoring applications.
  • QCI 4 (buffered streaming) is suitable for smart public information displays (PIDs) such as real-time information and interactive features to engage and inform the public (e.g., digital signage, message boards, or even live event streaming).
  • QCI 70 (mission critical data) is designed for services that require low latency and high reliability, including smart applications to control critical infrastructure in the city (e.g., utility grid management, building automation, or electricity distribution).
  • QCI 79 (V2X messages) is indicated for the components of modern urban mobility by gathering information on vehicles-to-vehicles, vehicles-to-infrastructure, vehicles-to-pedestrians, and vehicle-to-networks to develop a smart transportation system. With guaranteed performance indicators, smart transportation offers traffic flow optimization and safety enhancement in the city.
  • QCI 9 (background) is intended for applications that have lower priority and can tolerate delay, including sensor data collection, environmental monitoring, waste management, or other non-real-time data flows.
Table 1 is organized to provide a background for specifying smart city use cases and their required metrics, in accordance with the standard that network providers and operator policies should be followed. With all these services activated, urban life is enhanced and made more efficient, sustainable, and livable.

2.3. GNN-Based Optimization

Deep learning integration has been used for various aspects of network optimization [31,32] and in the context of large-scale SFC management in smart cities [33,34]. GNN is a class of deep learning models designed for analyzing and extracting hidden features from graph-structured data. GNN operates by propagating information across nodes and edges in a graph, which captures key relationships and dependencies within the data [35,36]. In a networking MANO perspective, GNN can generate representations from graph-based SFC data and predict the chain performance, which can be used for various tasks such as load balancing and congestion control [37].
In [38], a new neural network architecture for SFC based on GNN was proposed. The encoder-decoder architecture indicated representations of network topology and estimated probabilities of neighbor nodes and VNF processing. The GNN-based modeling outperforms the baseline deep neural network model and provides flexibility to topology changes. In [39], a knowledge-defined networking system was proposed to predict the optimal path for SFC deployment and traffic steering using GNN. GNN-based modeling, RouteNet [40], was used to extract hidden information on network topology, routing, and traffic metrics for predicting the delay and loss ratio from source to destination.

3. The Proposed GNN for Large-Scale SFC

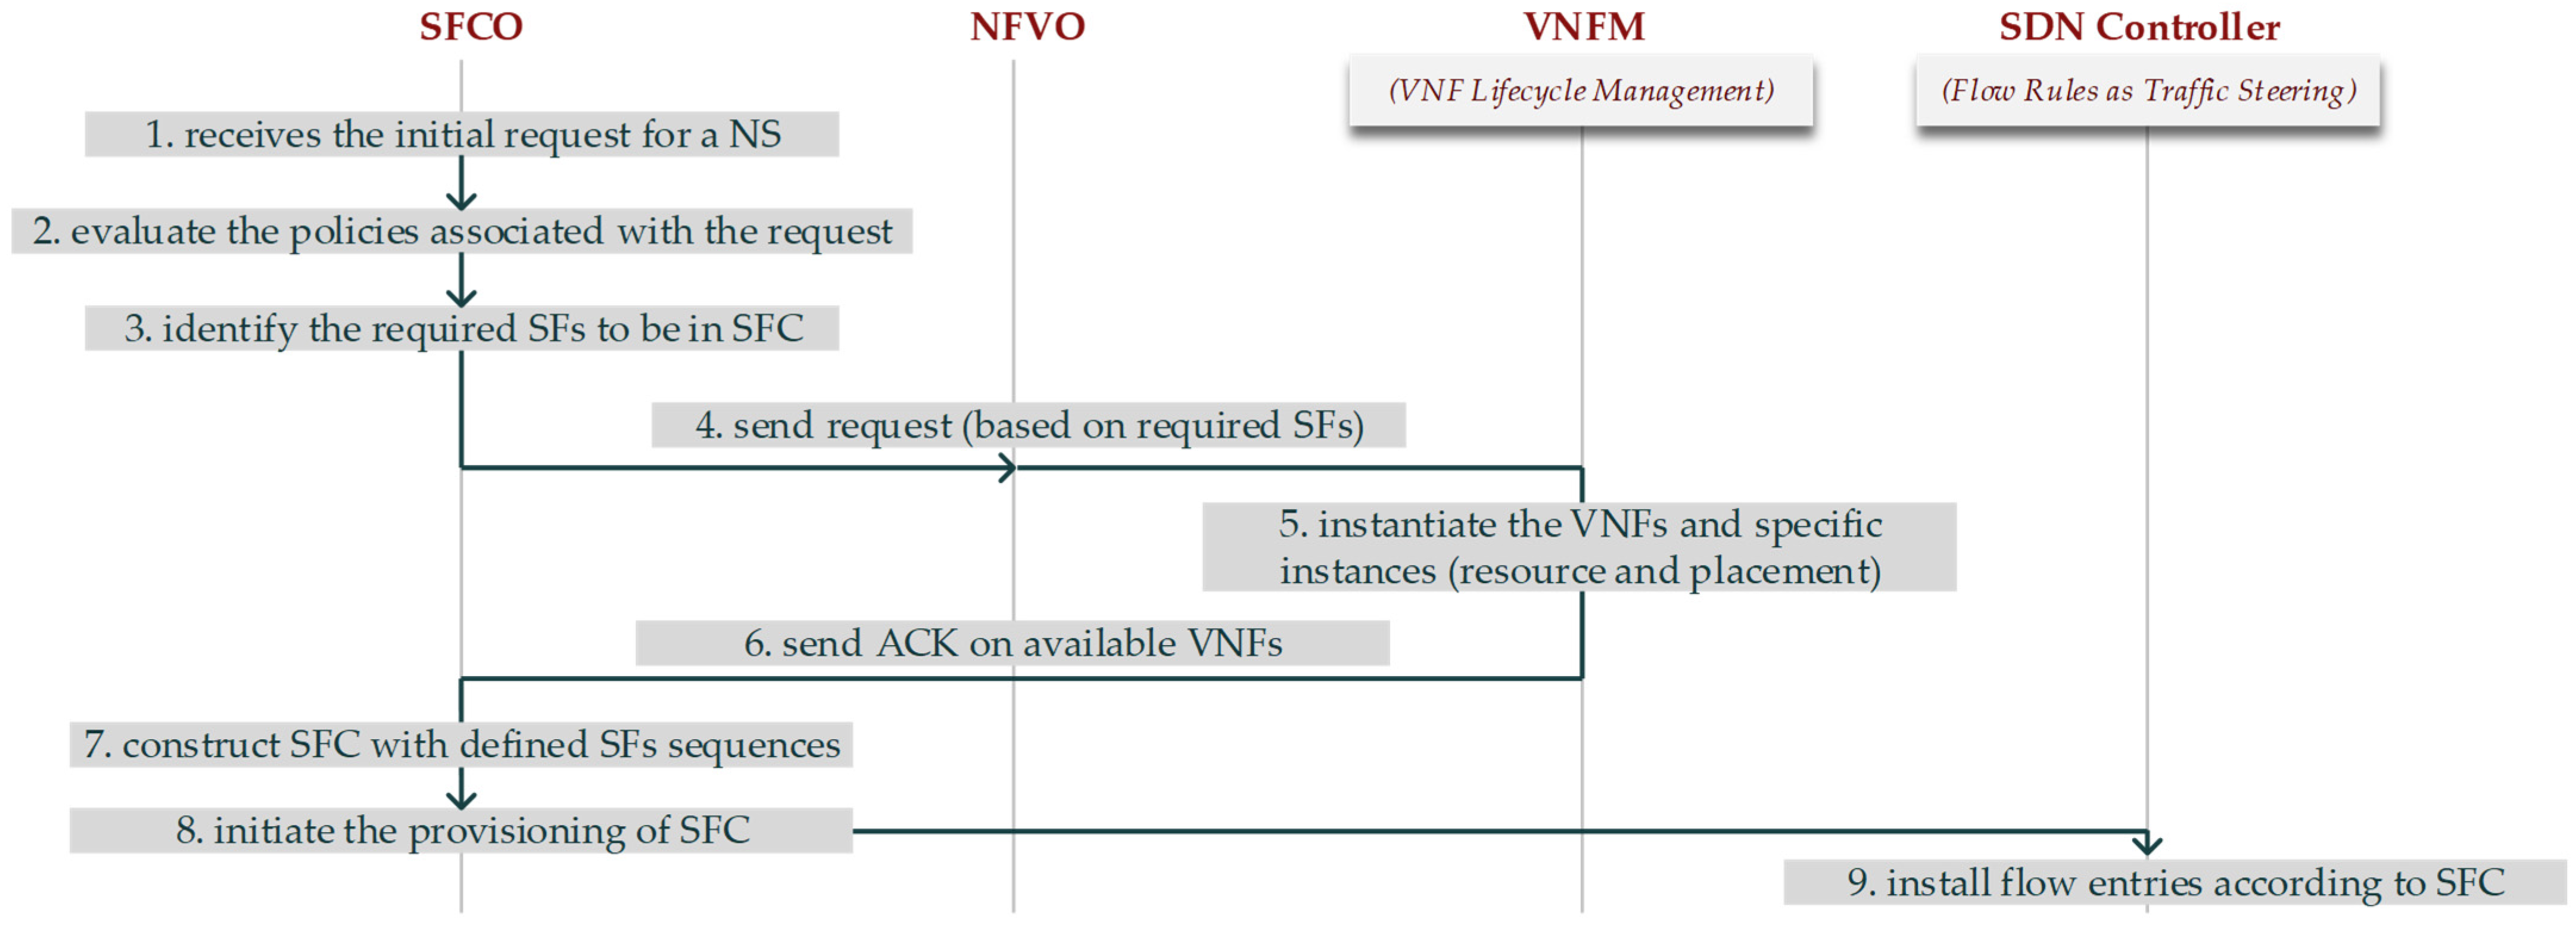
3.1. System Model and Working Flow

A set of smart city services is denoted by s S which requests to a distinct SFC that consists of multiple VNFs forming a sequential forwarding graph. The whole service batch S covers the entire graph G of physical nodes ( v V ), links ( e E ), and VNF instances ( f F ), denoted as G ( V , E , F ) . A physical node can contain a single or multiple VNF instance(s). Each physical node has upper-bound capacities of CPU ( c v m a x ), memory ( m v m a x ), and disk ( d v m a x ). Virtual machine (VM) is split within physical node- v to place the VNF instances. Each allocation is configured in the descriptor from the proposed GNN for large-scale SFC, namely the LS-SFC-GNN controller. a f , v t represents the decision variable to host VNF- f instance in physical node- v at timeslot- t . Later, VNF- f will be executed on VM resource blocks that are configured in the descriptor (using TOSCA written in YAML) with specified allocation of CPU ( c f , v a l l o c ), memory ( m f , v a l l o c ), and disk ( d f , v a l l o c ). We jointly denote the upper-bound and allocated resource capacities of CPU, memory, and disk as r f , v m a x and r f , v a l l o c . The allocation properties necessitate following the constraints of upper-bound capacities as expressed in Equation (1). Table 2 provides the key notations and descriptions.
v V f F a f , v t r f , v a l l o c r v m a x
The flow of a particular service- s is denoted by f w s t that consists of j set of VNFs, represented as f w s t = { f 1 f 2 f j } , where j J . a f j , s t represents the decision variable to place VNF- f j in SFC of service- s . To fully execute the services, each VNF in the forwarding graph has to compute sequentially without failure of any instances or over the upper-bound delays. Therefore, the allocation decision variables require optimization before configuring in the orchestration policy. The required resources of all VNF- f j instances in service- s can be expressed in 4-tuple variables, namely, link bandwidth b s r e q , total CPU j J c f j   r e q , total memory j J m f j   r e q , and total disk j J d f j   r e q . To formulate the computation delay, the joint required and allocated resource capacities are denoted as r f j   r e q and r f j , v a l l o c , respectively, which considers all property metrics (CPU, memory, disk). The delays on link, physical node, and VNF instances are denoted as φ e t , φ v t , and φ f t , respectively. The QoS constraint is indicated as φ s m a x for service- s . For delays on link, the bandwidth is allocated by physical capacities; therefore, virtual links are represented from node- v to the next node- v that consists of the sequential instances. If the next VNF instances in the chain are placed in the same physical node, the status of link delay a v v e returns 0; otherwise, 1.
Beyond QoS objective, our LS-SFC-GNN controller tackles two weight metrics, namely availability and loading congestion statuses of VNF- f j instances that deployed in physical node- v for service- s at timeslot- t , denoted as ω f j , v t and ϑ f j , v t , respectively. Both metrics are obtained from our proposed GNN readout as a proactive approximation, which will be further detailed in the next subsection. ω f j , v t and ϑ f j , v t are ranging values between 0 and 1 to predict the efficiencies of VNF instances in a particular SFC and assist the orchestration policy in deciding whether to duplicate the instances in another physical node or not. LS-SFC-GNN aims to optimize the placement for obtaining value of 1 for both ω f j , v t and ϑ f j , v t , which indicates the full performance of VNF instances without failure.
Our orchestration policy consists of two primary objectives, namely QoS guarantee and efficient VNF backup, for ensuring high availability and fault tolerance in large-scale and high congestion of SFC request rates. The system model prioritizes each smart city service criticality following the upper-bound delay and remaining resources. Equations (2) and (3) presents the total computation delay T s c o m p and communication delay T s c o m m , while Equation (4) reflects with the upper-bound service- s delays.
T s c o m p = v V j J r f j   r e q r f j , v a l l o c a f , v t a f j , s t ω f j , v t   ϑ f j , v t
T s c o m m = e E φ e t a v v e + v V φ v t a f , v t + v V j J φ f t a f j , s t
T s c o m p + T s c o m m   φ s m a x
In this study, we focus on node classification that detects the efficiency of VNF- f instances following service criticality. ω f j , v t and ϑ f j , v t return 0 or 1 as a final node representation to whether duplicate the instances or remain in the same chains. To avoid single-server failure, when duplicating decision is set, LS-SFC-GNN spreads the VM-VNF placement on different physical node- v . Figure 2 illustrates the node-level prediction on congested VNFs and our objectives on duplicating additional VNF instance to serve new SFC requests that require loading into instances with heavy congestion states. We present an example use case involving two SFCs, each consisting of four VNFs in a chain. When using message passing, we observe a greater amount of hidden state information, which is represented by differences in the three colored boxes within each VNF. These differences pertain to resource capacities, traffic load, and performance metrics. The GNN-enhanced approach extracts detailed information about future instance congestion. Consequently, the orchestration policy duplicates additional VNFs to ensure the high availability and fault tolerance of the requested SFC.

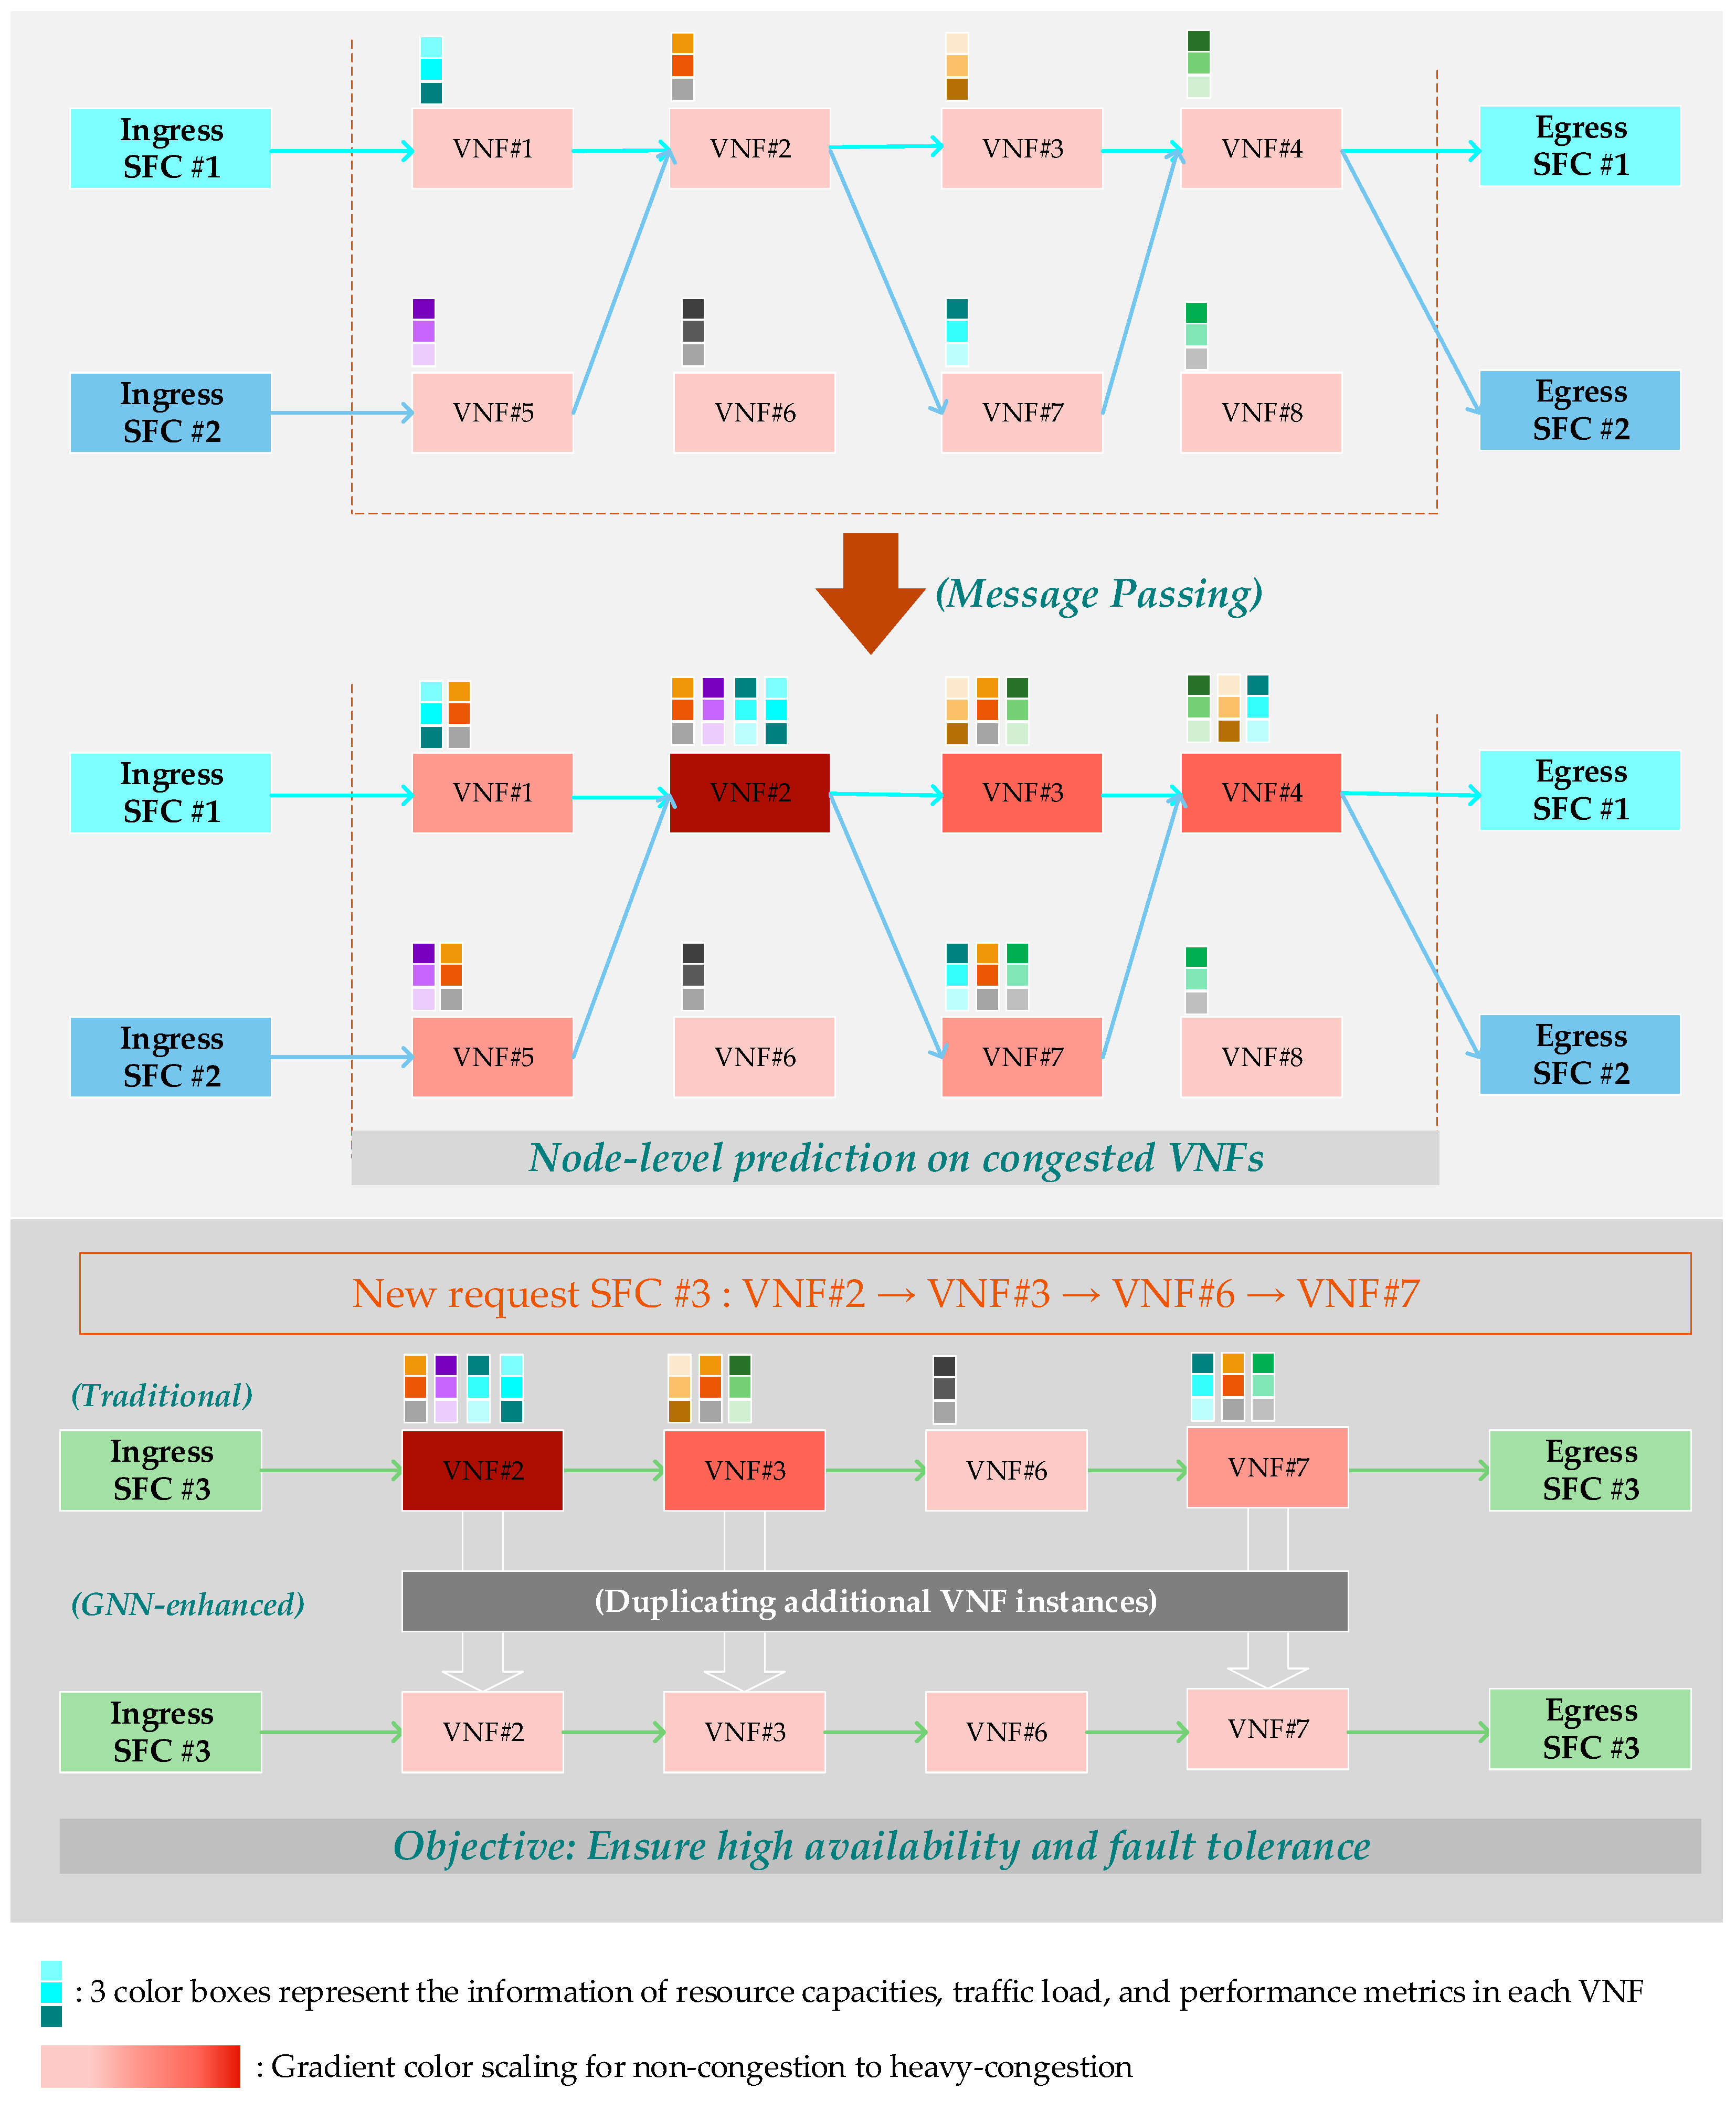
3.2. Algorithm Designs and Orchestration Conditions

In this subsection, we delve into the node classifications using the proposed GNN approach to label ω f j , v t and ϑ f j , v t of each instance. Each node- v with set of VNF- f placement has an assigned feature vector x i . In our use case of large-scale SFC for smart city applications, the features contain 6-tuple information as follows: (1) node indicator ω f j , v t and ϑ f j , v t (output 1 in initial timeslot), (2) resource capacity ( c v m a x , m v m a x , d v m a x ), (3) expected latency T s c o m p and T s c o m m , (4) current loading l f j , v t , (5) operating statues o f j , v t whether VNF node is currently operational or standby, and (6) service- s upper-bound requirement φ s m a x . The input features are used to create feature vectors for each VNF node in the SFC graph.
By obtaining the feature vector x i , message aggregation M is executed as given in (5). For each node- v and VNF- f , messages from the neighboring nodes N ( v ) and sequential instances N ( f ) are jointly denoted as N ( τ ) , where n N ( τ ) . We use three different aggregation methods for the three following conditions: (1) if all neighboring nodes are related to the current service chain; therefore, the proposed system can capture the cumulative impact of neighboring nodes on the feature representation of the central node; (2) if all neighboring nodes are balanced for future duplications; and (3) if there is different link bandwidth capacities that have bias values to guides the next VNF instances for duplicating in a changing physical node. Each condition is expressed in Equations (6)–(8).
m i   M ( { x n , n N ( τ ) }
m i C 1 = n N ( τ ) x n
m i C 2 = 1 | N ( τ ) | n N ( τ ) x n
m i C 3 = n N ( τ ) x n ω i , n
After the aggregated message m i is obtained, the algorithm proceeds the combination with the current feature x i using update function U , as expressed in (9), to get the hidden x i . The update function can be a neural network layer or a sequence of layers as expressed in (10) and (11). ReLU and σ represent the activation functions, while W is the learnable weight matrix and b is bias.
x i = U ( x i , m i )
x i = R e L U ( W · [ x i , m i ] + b )
x i = σ ( n N ( τ ) 1 | N ( τ ) | · | N ( n ) | W x n )
The integrated GNN consists of multiple layers of message passing. In each layer, the nodes exchange information with the neighbors and update the features. Number of layers is reflected to the message aggregation and update. After all layers of message passing, the final feature vectors x i represent the nodes in the graph and capture information from the local and global neighborhoods. Later, we apply a classification head to the final node representations for predicting the class probabilities on ω f j , v t and ϑ f j , v t . The objective is to indicate whether the node requires duplication or is still efficient in the current timeslot. The GNN module is iteratively executed to minimize the loss using backpropagation and gradient descent. We compute the gradients for the model parameters, which can be learned weights in the aggregation and update functions.
After the output of the GNN is obtained, the policy adjusts on managing and orchestrating VNF instances while leveraging SDN flow rule installation. We study large-scale request rates of SFC; therefore, the placement of VNF backup and duplication decisions are emphasized by following the orchestration conditions as follows:
  • If current loading l f j , v t and operating statues o f j , v t weight the class probability on ω f j , v t and ϑ f j , v t to output 0, the orchestration policy duplicates VNF- f j in other physical nodes. Decision variable a f , v t is re-configured to alter the placement, and SDN controller installs the flow rule accordingly.
  • Otherwise, if T s c o m p and T s c o m m approximation from GNN output ( x i ) reflects to output 0, we reconsider the decision variable a f j , s t to check for alternative VNF instances that can be matched.
  • Furthermore, c f , v a l l o c , m f , v a l l o c , and d f , v a l l o c are re-adjusted to ensure that the approximation satisfies the QoS constraints φ s m a x , as given in Equations (2)–(4).

4. Performance Evaluation

4.1. Simulation Environment

This section presents the simulation architecture with multi-purpose VNFs and chaining isolation to support our SFC orchestration policy on offering alternative VNF instances and duplicating on different VM resource blocks. Figure 3 is given to represent the ingress data sources and egress end-user interfaces of each smart city service. We propose intelligent service function (ISF) to perform modern services; however, due to lack of real-world open-source data of smart city SFC, we approximate the executing delays of each ISF by following the maximum thresholds of computing time in each QCI class. Each VM placement is determined based on the criticality and resource consumption of each service, corresponding to the nodes in the experiment.
For example, in the case of smart surveillance, it begins with live video camera streaming to feed service S1, namely video analytics (object detection). In this study, our primary focus is on scaling SFC; therefore, the intelligent model responsible for executing S1 is configured to be well-trained with high accuracy to preemptively address any potential issues. S1 is allocated to five VMs, which is higher than the allocation for other services in the chain, because it demands a significant computational capacity due to early-stage video input and preprocessing requirements. We replicated different VM amounts for various services in the chain to ensure that each service receives the appropriate level of computational resources and can operate optimally. The allocation of VMs and vCPU is based on our model output, specific resource requirements, criticality weights, and resource consumption of each service. However, the allocation of VMs is dynamic in the experiments, which refers to the feasibility of changing replication in case of overloading congestion detected in other services.
Table 3 gives the detailed deployment properties of each use case in our experiment including bandwidth (Mbps), vCPU, RAM, and replication VMs. The modular architecture with multi-purpose VNFs is designed to serve various purposes within the SFC process by globalizing the service objectives and expecting to be chained in a flexible and scalable way (using LS-SFC-GNN output).
The simulation leverages the GNN-based approach by utilizing a set of parameters and specifications as outlined in Table 4. The high-performance hosting infrastructure is used for splitting the computational demands of large-scale smart city simulation as listed in Table 3 (one experiment runtime, one use case). The maximum tolerable delay ranging from 5 ms to 15 ms per ISF (post-train) indicates that the data points flow through a well-trained model with converged accuracies. This assumption follows the real-time data processing and delivery to meet the stringent requirements of 4-VNF per smart city SFC. The simulation models a wide range of SFC request rates, which vary from 100 to 1000 requests per second. The delay on links is constrained to a maximum of 2 ms. Within 2000- t , 5 different congestion levels are configured to input the high rates of requests and generate large-scale congestion to answer our research questions. Pytorch is used for building GNN models, and further hyperparameters of the GNN, such as learning rate, batch size, number of epochs, dropout rate, and activation function, are set to 0.01, 64, 1000, 0.3, and ReLU-Sigmoid, respectively.
Two baseline approaches are operated for comparison including (1) threshold-based approach and (2) load balancing. Each approach is described as follows:
  • Threshold-based SFC is a traditional approach to managing SFC requests in a network that relies on predefined thresholds or limits for resource usage, latency, or traffic volume. When an SFC request is received, the threshold-based system evaluates whether the request meets the predefined criteria. If the request exceeds these thresholds, it will be rejected or placed in a queue until resources become available.
  • Load balancing SFC is an approach that aims to evenly distribute network traffic and service requests across available resources to prevent the overloading of specific network functions or host servers. When an SFC request is received, the load balancing system assesses the current workload on available resources, then directs the request to the least loaded resource or server.

4.2. Result and Discussion

In our experiment, we captured several key performance metrics to assess the effectiveness of our proposed policy in different large-scale congestion levels, compared to baseline approaches. Each metric can be described as follows:
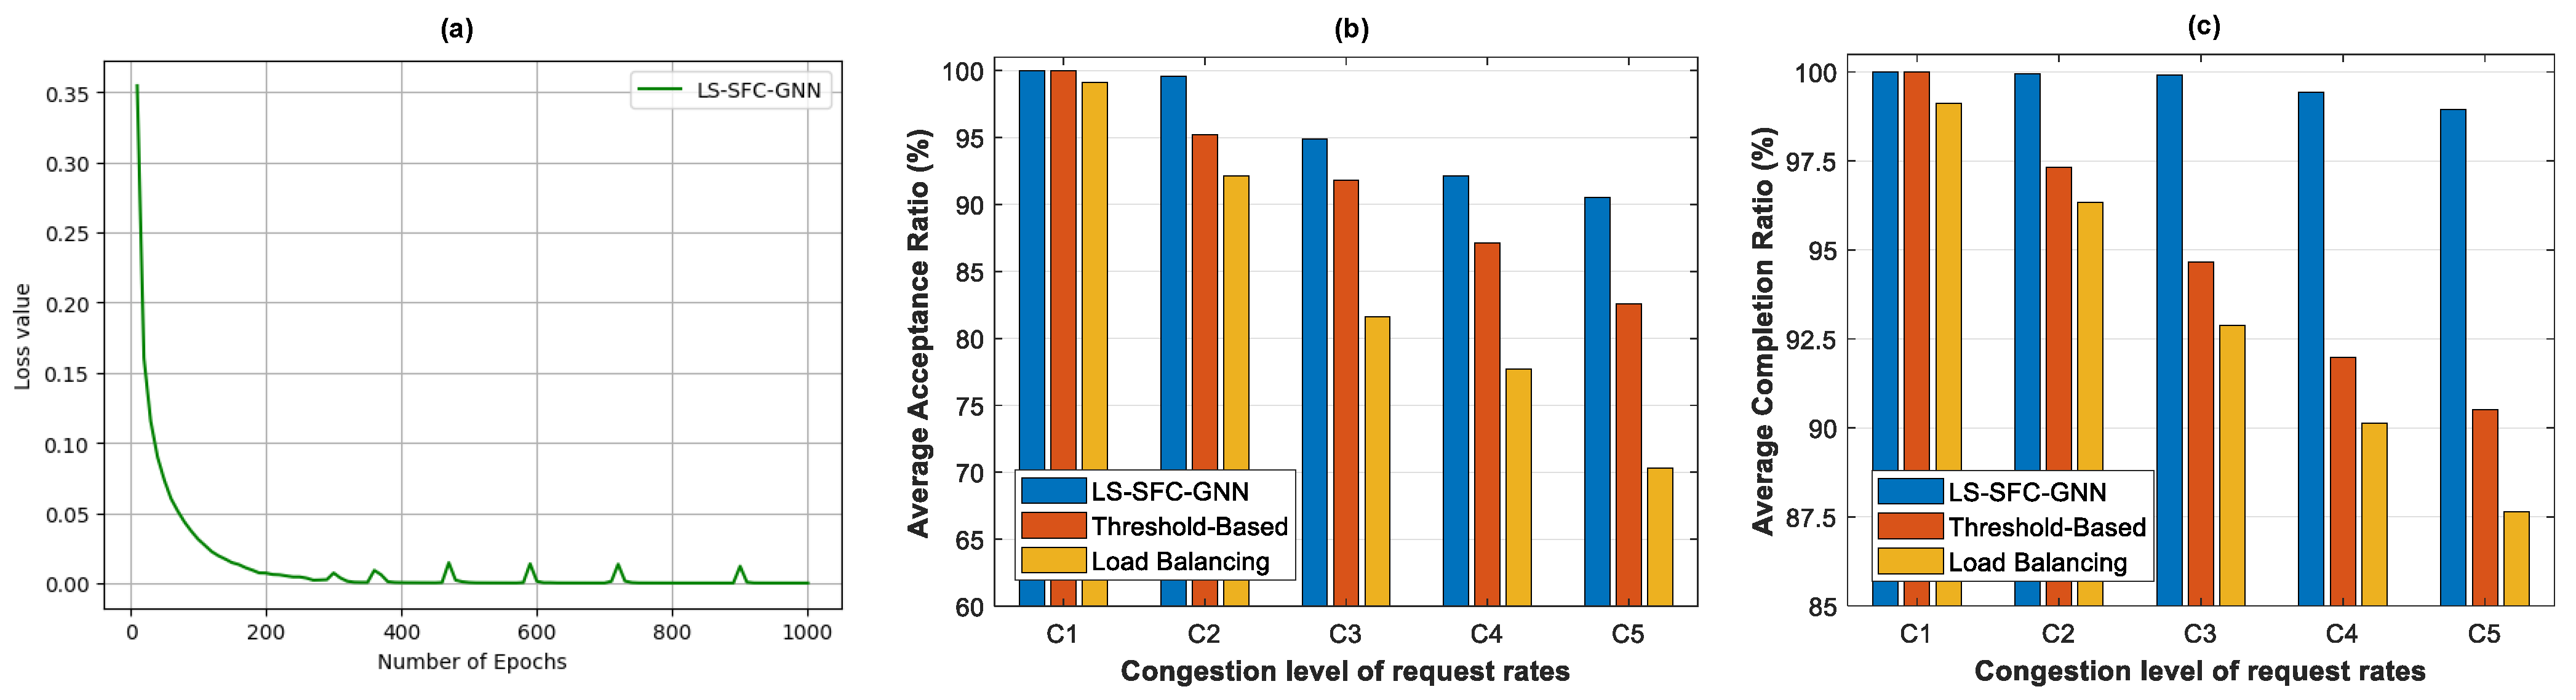
  • Loss values of GNN are a measure of how well the model is learning the relationships between nodes in a graph. During training, the goal is to minimize the loss (error values of ω f j , v t and ϑ f j , v t to indicate whether the node requires duplication or is still efficient in the current timeslot, compared to the actual performances). The purpose of monitoring the loss values of the GNN is to assess the model learning progress and ensure that the model is converging to a better policy in SFC orchestration.
  • The average acceptance ratio is a measure of how well the orchestrator can handle the load of incoming SFC requests by quantifying the proportion of accepted requests over the total number of received requests. The output of this ratio reflects the orchestrator capability to whether can serve the large-scale incoming demand or not.
  • The average completion ratio is a measure of the orchestrator successfully completing SFC requests once they have been accepted. A high average completion ratio indicates that the system not only accepts requests but also effectively delivers the requested services to ensure reliability.
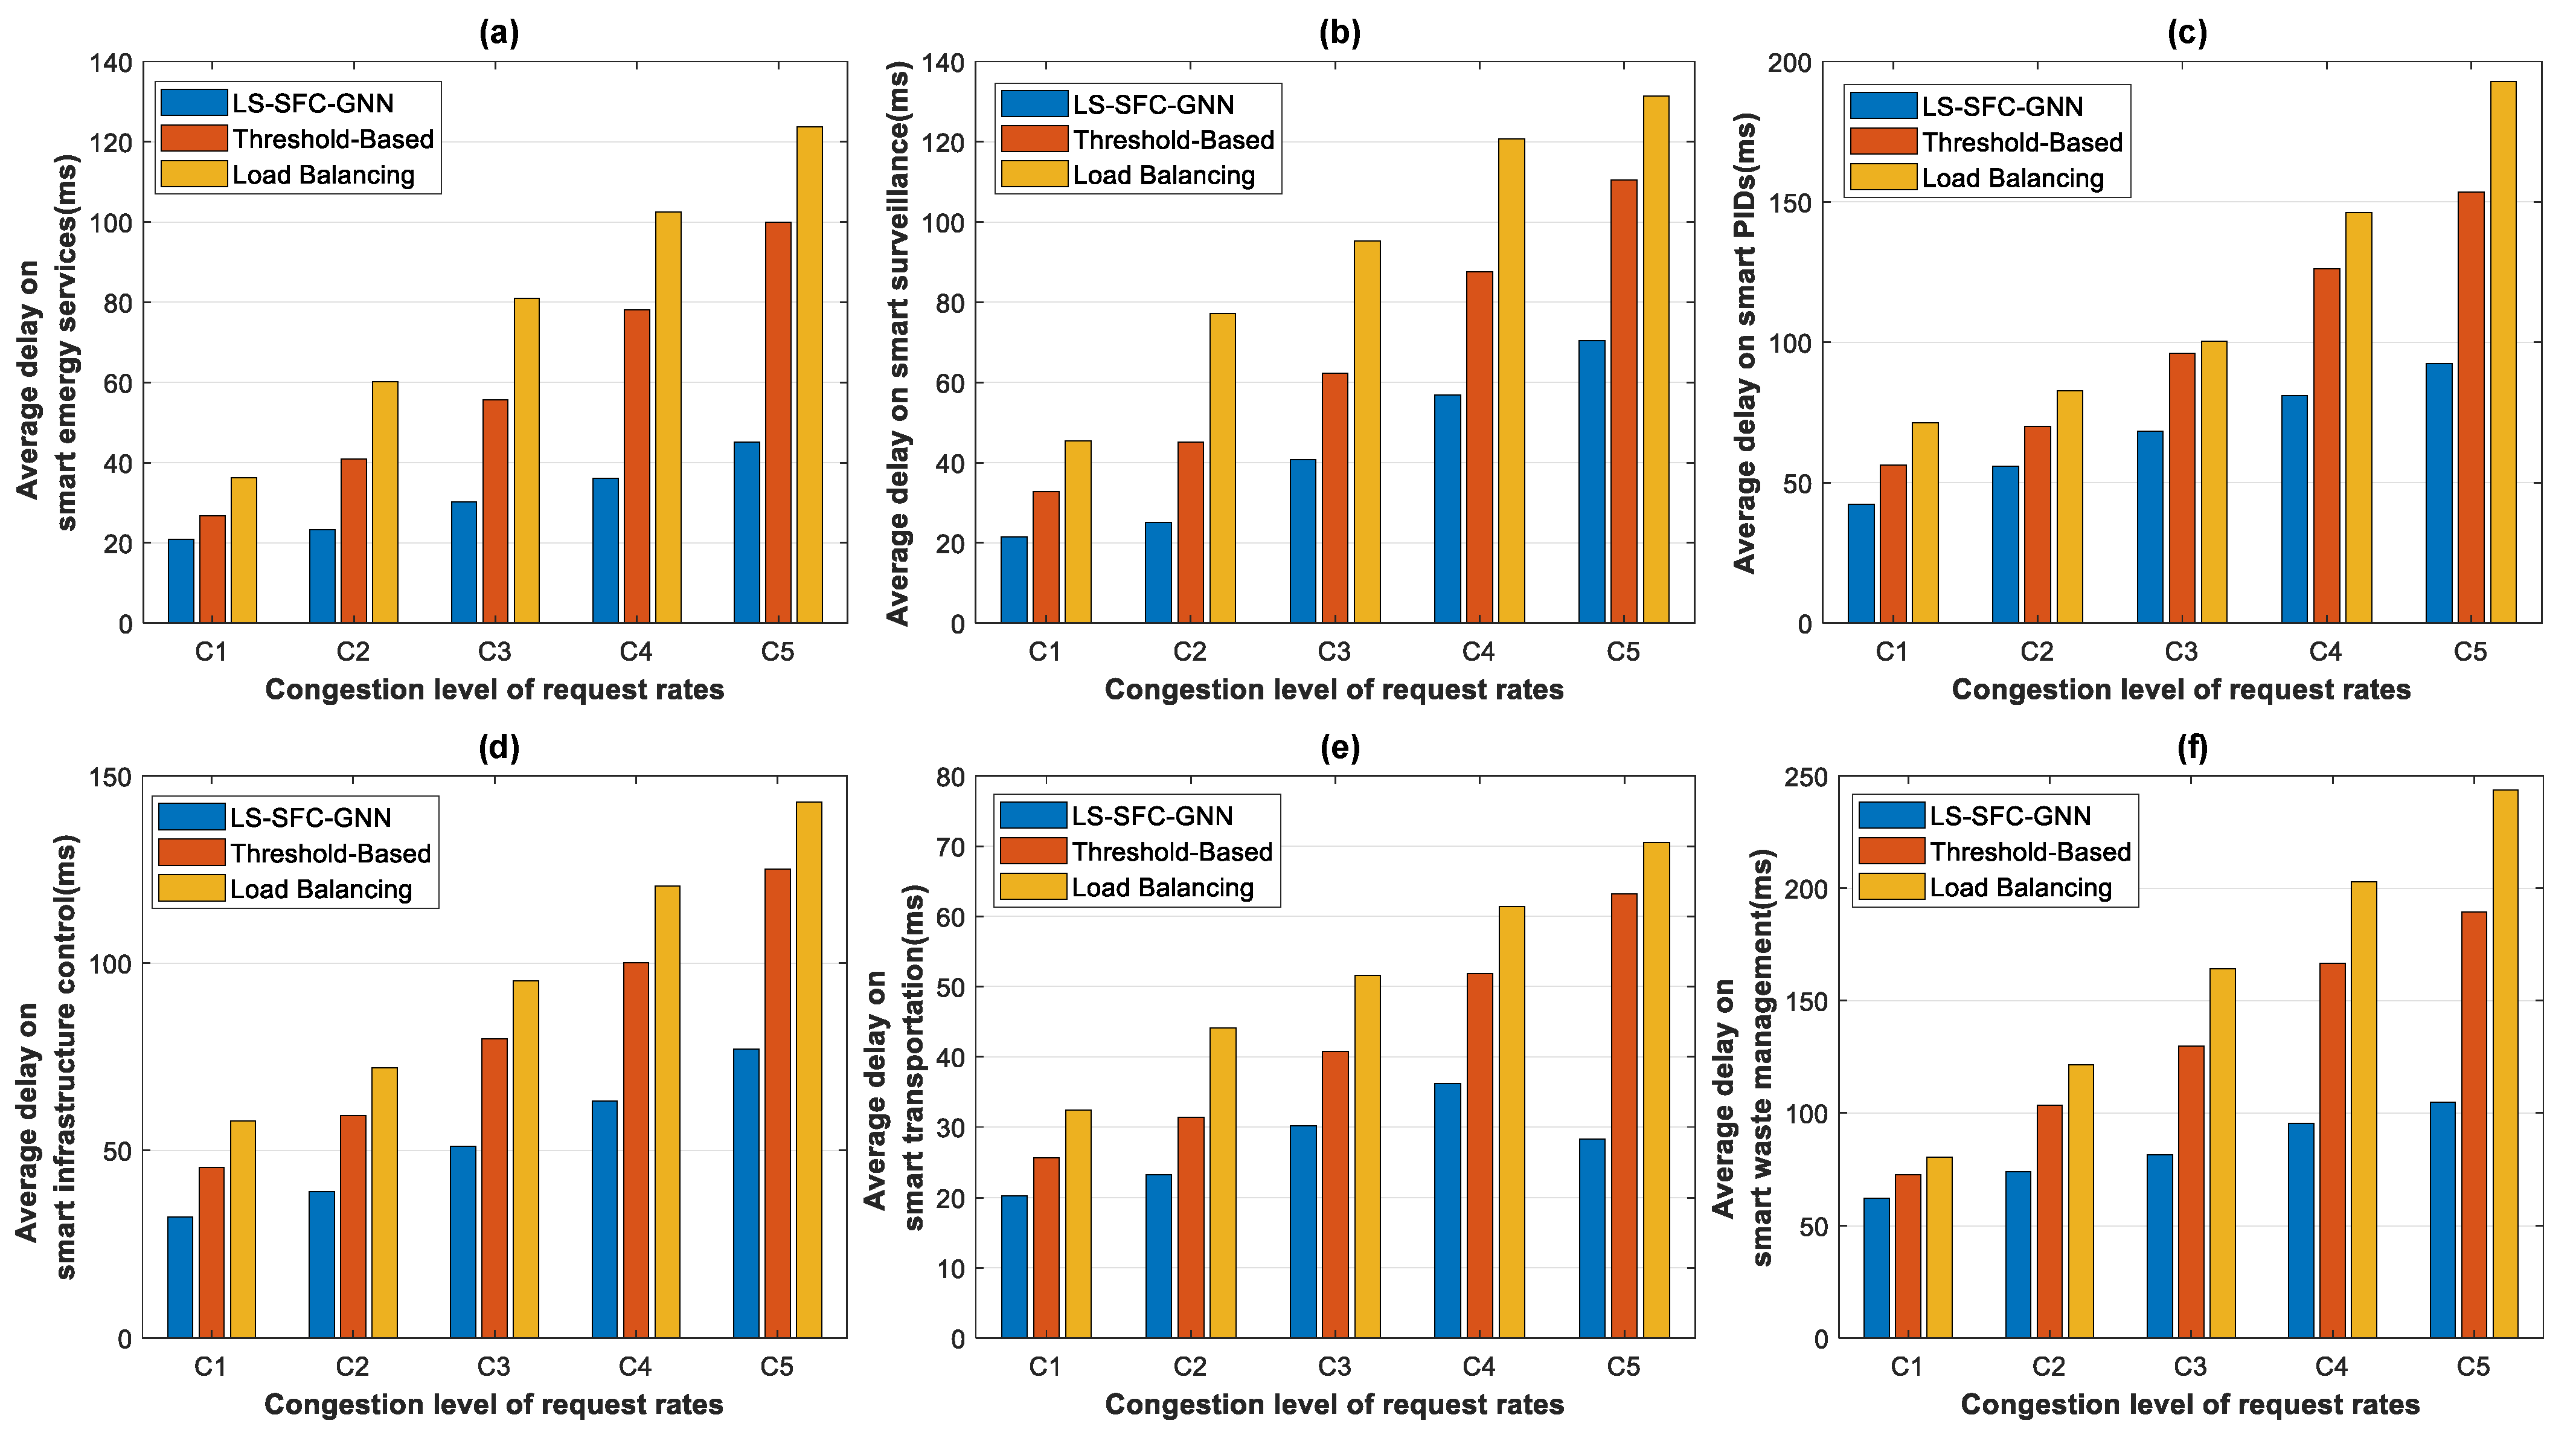
  • The average delays of all smart city applications (as shown in Table 1) are observed during a single experiment runtime for a specific use case. Monitoring average delays helps evaluate the responsiveness of the proposed system on how long it takes for each application to deliver the services, compared to the constraint φ s m a x .
Figure 4a illustrated the loss values of our proposed GNN. The significant reduction in loss values from 0.3547 to 2.4392 × 10⁻⁵ over 1000 epochs indicates the model’s robust learning and convergence capabilities. While this result emphasizes the model’s capability to fit the training SFC topology effectively, it also prompts a further evaluation of potential overfitting and the need to validate its generalization on independent datasets. Beyond loss reduction, the practical implications of this model in SFC use cases are more efficient and scalable SFC provisioning in core planning or orchestrator modeling. In Figure 4b, the average SFC acceptance ratio is given. LS-SFC-GNN consistently achieved high acceptance ratios, even in scenarios of high congestion (C4 and C5). The model’s capability to effectively orchestrate in large-scale traffic of C5 shows that it is adaptable, which is an essential quality for SFC applications in real-world smart cities. In contrast, the threshold-based and load balancing SFC approaches output a steady decline in acceptance ratios as congestion increased, dropping to 82.56% and 70.32% in C5, respectively. While it initially matched LS-SFC-GNN in low congestion scenarios, it struggled to maintain performance as network demands intensified.
After the request is accepted, we still monitor whether the SFC is completely executed or not. Figure 4c showed the average completion ratios, which can be described as follows:
  • At C1: LS-SFC-GNN gained 0.88% higher completion ratios than load balancing.
  • At C2: LS-SFC-GNN achieved 2.63% and 3.62% higher completion than threshold-based and load balancing SFC approaches.
  • At C3: LS-SFC-GNN achieved 99.91%, while threshold-based SFC achieved 94.66%, and load balancing SFC achieved 92.88%.
  • At C4: LS-SFC-GNN remained at 99.43% by adaptively duplicating critical VNF instances and allocating VM resource pools into an efficient utilization.
  • At C5: LS-SFC-GNN outperformed threshold-based and load balancing by 8.43% and 11.29%, respectively.
Beyond SFC performance, we also delve into each use case of smart cities (in term of SFC execution delay). Figure 5 presents the average delays on (a) smart emergency services, (b) smart surveillance, (c) smart PIDs, (d), smart infrastructure control, (e) smart transportation, and (f) smart waste management. Table 5 is given to list the average SFC execution delays in detail. A low average execution delay of each service within a smart city network infrastructure is significant in enhancing the overall effectiveness of urban operations.
During emergencies or natural disasters, the ability to respond to service requests rapidly with energy resources is critical. Low execution delays allow for rapid deployment of backup power systems, while ensuring critical services such as hospitals, emergency shelters, etc. Figure 5a presents the average delay in smart emergency services. The proposed LS-SFC-GNN policy, adapted to different congestion levels (C1 to C5), demonstrated notable performances in terms of SFC execution delays compared to the baseline approaches. At the lowest congestion level (C1), the LS-SFC-GNN policy achieved an average execution delay of 20.92 ms. The threshold-based approach had a significantly higher average delay of 26.78 ms, while the load balancing performed even less efficiently with an average delay of 36.32 ms. As congestion levels increased to C2, C3, C4, and C5, the LS-SFC-GNN policy consistently outperformed both baseline approaches in terms of execution delay, which ensured faster service provisioning during critical situations.
For smart surveillance, the system with reliable delays can provide real-time monitoring and threat detection, which is vital for identifying and responding to security incidents or emergencies promptly. For all congestion levels (C1 to C5), the proposed LS-SFC-GNN achieved delay improvement over threshold-based approach by 34.74%, 44.29%, 34.51%, 35.00%, and 36.26%, respectively (as shown in Figure 5b). If we compared LS-SFC-GNN with load balancing, the improvement over C1 to C5 would be 52.84%, 67.48%, 57.21%, 52.83%, and 46.33%, respectively.
Smart PIDs are designed to provide timely and relevant information to the public, and with short execution latency, we can ensure that updates and notifications are propagated to pedestrians and commuters in a (near)-real-time manner. With a PDB of 300 ms, our experimental method can perform without exceeding the upper-bound delays, which is 92.55 ms in C5 condition, as shown in Figure 5c. This performance is achieved through the integration of post-training ISF and the optimal approximation of VNF instances within each SFC.
In our smart infrastructure control experiment, LS-SFC-GNN consistently outperformed with delays of 32.31 ms (C1) to 77.01 ms (C5), compared to 45.45 ms (C1) to 125.12 ms (C5) and 57.82 ms (C1) to 143.09 ms (C5) for threshold-based and load balancing approaches, respectively. Figure 5d and Table 5 show the detailed results. Lower delays are important in smart infrastructure control for immediate response to issues and efficient maintenance. LS-SFC-GNN aimed to enhance the reliability and longevity of critical infrastructure, benefiting urban environments and infrastructure-dependent services.
In smart transportation, real-time data analysis is fundamental for managing traffic flow, optimizing routes, and responding to road incidents. A system with lower delays provides traffic control centers with more up-to-date information, which enables them to make quicker and more accurate decisions. This, in turn, enhances overall traffic management, reduces congestion, and improves road safety for the smart city environment. As shown in Figure 5e and Table 5, from C1 to C5, LS-SFC-GNN for smart transportation showed significantly improved performance over threshold-based and load balancing, by 30.62% and 45.78%, respectively.
Figure 5f shows the average delay for smart waste management in different congestion scaling levels of SFC request rates. The proposed LS-SFC-GNN approach achieved the average delays of 62.31 ms, 73.74 ms, 81.34 ms, 95.33 ms, and 104.63 ms for congestion levels C1 to C5, respectively. With a PDB of 300 ms, the LS-SFC-GNN approach maintains highly satisfactory performance, which ensures that waste management operations are conducted efficiently in smart urban environments.

5. Conclusions and Future Works

This paper presented a comprehensive approach to address the challenges of large-scale SFC orchestration in smart city use cases. The proposed LS-SFC-GNN leveraged GNN with a message-passing mechanism to iteratively update hidden states of VNF nodes and enhances the decision variable configuration on resource allocation, detecting availability statuses, and duplicating heavily congested instances. We utilized standardized QCI to classify smart city services based on upper-bound criticality. Our GNN-based approach identified the congested VNF instances and suggested either duplicating instances or reallocating resources to ensure efficient utilization and minimize delays. The simulation results demonstrated the effectiveness of LS-SFC-GNN in ensuring high acceptance ratios, completion ratios, and low execution delays for six smart city applications, even under high-congestion levels.
In future studies, we plan to expand the simulation by using multi-cloud services. We recognize the growing importance of multi-cloud environments in modern IT ecosystems; therefore, incorporating with multi-cloud services will allow us to unleash a more diverse representation of the cloud virtualization, also optimizing resource allocation and management across multiple cloud providers. Furthermore, we intend to address solutions for harmonizing IoT interoperability standards in the future, which aims to improve the current system by deepening the integration among various IoT devices for enabling more cohesive and efficient smart city operations.

Author Contributions

Conceptualization, P.T. and S.K. (Seokhoon Kim); methodology, S.K. (Seungwoo Kang) and P.T.; software, P.T. and S.R.; validation, S.K. (Seungwoo Kang), I.S. and S.R.; formal analysis, S.K. (Seungwoo Kang), I.S. and S.R.; investigation, S.K. (Seokhoon Kim); resources, S.K. (Seokhoon Kim); data curation, P.T.; writing—original draft preparation, P.T.; writing—review and editing, I.S. and S.K. (Seokhoon Kim); visualization, S.R.; supervision, S.K. (Seokhoon Kim); project administration, S.K. (Seokhoon Kim); funding acquisition, S.K. (Seokhoon Kim). All authors have read and agreed to the published version of the manuscript.

Funding

This work was supported by Institute of Information & communications Technology Planning & Evaluation (IITP) grant funded by the Korea government(MSIT) (No. RS-2022-00167197, Development of Intelligent 5G/6G Infrastructure Technology for The Smart City), in part by the National Research Foundation of Korea (NRF), Ministry of Education, through Basic Science Research Program under Grant NRF-2020R1I1A3066543, in part by BK21 FOUR (Fostering Outstanding Universities for Research) under Grant 5199990914048, and in part by the Soonchunhyang University Research Fund.

Data Availability Statement

Not applicable.

Conflicts of Interest

The authors declare no conflict of interest.

References

  1. Zhang, Z.; Wu, G.; Ren, H. Multi-Attribute-Based QoS-Aware Virtual Network Function Placement and Service Chaining Algorithms in Smart Cities. Comput. Electr. Eng. 2021, 96, 107465. [Google Scholar] [CrossRef]
  2. Kim, D.-Y.; Park, J.; Kim, S. Data Transmission in Backscatter IoT Networks for Smart City Applications. J. Sens. 2022, 2022, 4973782. [Google Scholar] [CrossRef]
  3. Medhat, A.M.; Taleb, T.; Elmangoush, A.; Carella, G.A.; Covaci, S.; Magedanz, T. Service Function Chaining in Next Generation Networks: State of the Art and Research Challenges. IEEE Commun. Mag. 2017, 55, 216–223. [Google Scholar] [CrossRef]
  4. Sun, G.; Xu, Z.; Yu, H.; Chen, X.; Chang, V.; Vasilakos, A.V. Low-Latency and Resource-Efficient Service Function Chaining Orchestration in Network Function Virtualization. IEEE Internet Things J. 2019, 7, 5760–5772. [Google Scholar] [CrossRef]
  5. Foukalas, F.; Tziouvaras, A. QoE-Aware Edge Computing through Service Function Chaining. IEEE Internet Comput. 2021, 26, 53–60. [Google Scholar] [CrossRef]
  6. Chen, J.; Chen, J.; Zhang, H. DRL-QOR: Deep Reinforcement Learning-Based QoS/QoE-Aware Adaptive Online Orchestration in NFV-Enabled Networks. IEEE Trans. Netw. Serv. Manag. 2021, 18, 1758–1774. [Google Scholar] [CrossRef]
  7. Raza, S.M.; Jeong, H.; Kim, M.; Choo, H. HP-SFC: Hybrid Protection Mechanism Using Source Routing for Service Function Chaining. Appl. Sci. 2021, 11, 5245. [Google Scholar] [CrossRef]
  8. Zhao, Z.; Fan, X.; Xie, X.; Mao, Q.; Zhao, Q. AP-SDN: Action Program Enabled Software-Defined Networking Architecture. KSII Trans. Internet Inf. Syst. 2023, 17, 1894–1915. [Google Scholar]
  9. Song, I.; Tam, P.; Kang, S.; Ros, S.; Kim, S. DRL-Based Backbone SDN Control Methods in UAV-Assisted Networks for Computational Resource Efficiency. Electronics 2023, 12, 2984. [Google Scholar] [CrossRef]
  10. Kim, Y.; Kyung, Y. SWITCH: SDN-WLAN Integrated Handover Scheme for QoS-Guaranteed Mobile Service. KSII Trans. Internet Inf. Syst. 2022, 16, 3680–3693. [Google Scholar]
  11. Tam, P.; Math, S.; Kim, S. Adaptive Partial Task Offloading and Virtual Resource Placement in SDN/NFV-Based Network Softwarization. Comput. Syst. Sci. Eng. 2023, 45, 2141–2154. [Google Scholar] [CrossRef]
  12. Sun, M.; Zhang, L.; Mei, J.; Dong, P. Emotion-Aware Task Scheduling for Autonomous Vehicles in Software-Defined Edge Networks. KSII Trans. Internet Inf. Syst. 2022, 16, 3523–3543. [Google Scholar]
  13. Kim, D.-Y.; Lee, S.; Kim, M.; Kim, S. Edge Cloud Selection in Mobile Edge Computing (MEC)-Aided Applications for Industrial Internet of Things (IIoT) Services. Comput. Syst. Sci. Eng. 2023, 47, 2049–2060. [Google Scholar] [CrossRef]
  14. Khan, M.T.; Barik, L.; Adholiya, A.; Patra, S.S.; Brahma, A.N.; Barik, R.K. Task Offloading Scheme for Latency Sensitive Tasks in 5G IoHT on Fog Assisted Cloud Computing Environment. In Proceedings of the 2022 3rd International Conference for Emerging Technology (INCET), Belgaum, India, 27–29 May 2022. [Google Scholar]
  15. Akter, S.; Kim, D.-Y.; Yoon, S. Task Offloading in Multi-Access Edge Computing Enabled UAV-Aided Emergency Response Operations. IEEE Access 2023, 11, 23167–23188. [Google Scholar] [CrossRef]
  16. Liang, X.; Wu, Y.; Huang, Y.; Ng, D.W.K.; Li, P.; Yao, Y. Performance Optimization and Analysis on P2P Mobile Communication Systems Accelerated by MEC Servers. KSII Trans. Internet Inf. Syst. 2022, 16, 188–210. [Google Scholar]
  17. Almashhadani, H.A.; Deng, X.; Al-Hwaidi, O.R.; Abdul-Samad, S.T.; Ibrahm, M.M.; Latif, S.N.A. Design of a New Algorithm by Using Standard Deviation Techniques in Multi Edge Computing with IoT Application. KSII Trans. Internet Inf. Syst. 2023, 17, 1147–1161. [Google Scholar]
  18. Mechtri, M.; Ghribi, C.; Soualah, O.; Zeghlache, D. NFV Orchestration Framework Addressing SFC Challenges. IEEE Commun. Mag. 2017, 55, 16–23. [Google Scholar] [CrossRef]
  19. Ghaznavi, M.; Shahriar, N.; Kamali, S.; Ahmed, R.; Boutaba, R. Distributed Service Function Chaining. IEEE J. Sel. Areas Commun. 2017, 35, 2479–2489. [Google Scholar] [CrossRef]
  20. Hawilo, H.; Jammal, M.; Shami, A. Network Function Virtualization-Aware Orchestrator for Service Function Chaining Placement in the Cloud. IEEE J. Sel. Areas Commun. 2019, 37, 643–655. [Google Scholar] [CrossRef]
  21. Tu, W. Data-Driven QoS and QoE Management in Smart Cities: A Tutorial Study. IEEE Commun. Mag. 2018, 56, 126–133. [Google Scholar] [CrossRef]
  22. Jin, J.; Gubbi, J.; Luo, T.; Palaniswami, M. Network Architecture and QoS Issues in the Internet of Things for a Smart City. In Proceedings of the 2012 International Symposium on Communications and Information Technologies (ISCIT), Gold Coast, QLD, Australia, 2–5 October 2012. [Google Scholar]
  23. Kim, T.-H.; Ramos, C.; Mohammed, S. Smart City and IoT. Future Gen. Comput. Syst. 2017, 76, 159–162. [Google Scholar] [CrossRef]
  24. Arellanes, D.; Lau, K.-K. Evaluating IoT Service Composition Mechanisms for the Scalability of IoT Systems. Future Gen. Comput. Syst. 2020, 108, 827–848. [Google Scholar] [CrossRef]
  25. Rhayem, A.; Mhiri, M.B.A.; Gargouri, F. Semantic Web Technologies for the Internet of Things: Systematic Literature Review. Internet Things 2020, 11, 100206. [Google Scholar] [CrossRef]
  26. Neiat, A.; Bouguettaya, A.; Bahutair, M. A Deep Reinforcement Learning Approach for Composing Moving IoT Services. IEEE Trans. Serv. Comput. 2022, 15, 2538–2550. [Google Scholar] [CrossRef]
  27. AllamehAmiri, M.; Derhami, V.; Ghasemzadeh, M. QoS-Based Web Service Composition Based on Genetic Algorithm. J. AI Data Min. 2013, 1, 63–73. [Google Scholar]
  28. De Sanctis, M.; Muccini, H.; Vaidhyanathan, K. Data-driven Adaptation in Microservice-based IoT Architectures. In Proceedings of the IEEE International Conference on Software Architecture Companion (ICSA-C) 2020, Salvador, Brazil, 16–20 March 2020; pp. 59–62. [Google Scholar]
  29. Asghari, P.; Amir, M.R.; Hamid, H.S.J. Service Composition Approaches in IoT: A Systematic Review. J. Netw. Comput. Appl. 2018, 120, 61–77. [Google Scholar] [CrossRef]
  30. 3GPP TS 23.203 V17.2.0; Technical Specification Group Services and System Aspects; Policy and Charging Control Architecture. ETSI: Valbonne, France, 2021.
  31. Khan, M.T.; Adholiya, A. Machine Learning-Based Application for Predicting 5G/B5G Service. In Proceedings of the 2023 13th International Conference on Cloud Computing, Data Science & Engineering (Confluence), Noida, India, 19–20 January 2023. [Google Scholar]
  32. Zou, D.; Sun, G.; Li, Z.; Xi, G.; Wang, L. Incremental Strategy-based Residual Regression Networks for Node Localization in Wireless Sensor Networks. KSII Trans. Internet Inf. Syst. 2022, 16, 2627–2647. [Google Scholar]
  33. Zhou, F.; Yu, P.; Feng, L.; Qiu, X.; Wang, Z.; Meng, L.; Kadoch, M.; Gong, L.; Yao, X. Automatic Network Slicing for IoT in Smart City. IEEE Wirel. Commun. 2020, 27, 108–115. [Google Scholar] [CrossRef]
  34. Kirimtat, A.; Krejcar, O.; Kertesz, A.; Tasgetiren, M.F. Future Trends and Current State of Smart City Concepts: A Survey. IEEE Access 2020, 8, 86448–86467. [Google Scholar] [CrossRef]
  35. Kipf, T.N.; Welling, M. Semi-Supervised Classification with Graph Convolutional Networks. arXiv 2017, arXiv:1609.02907. [Google Scholar]
  36. Wu, Z.; Pan, S.; Chen, F.; Long, G.; Zhang, C.; Yu, P.S. A Comprehensive Survey on Graph Neural Networks. IEEE Trans. Neural Netw. Learn. Syst. 2020, 32, 4–24. [Google Scholar] [CrossRef] [PubMed]
  37. Tam, P.; Song, I.; Kang, S.; Ros, S.; Kim, S. Graph Neural Networks for Intelligent Modelling in Network Management and Orchestration: A Survey on Communications. Electronics 2022, 11, 3371. [Google Scholar] [CrossRef]
  38. Heo, D.; Lange, S.; Kim, H.-G.; Choi, H. Graph Neural Network Based Service Function Chaining for Automatic Network Control. In proceeding of the 2020 21st Asia-Pacific Network Operations and Management Symposium (APNOMS), Daegu, Republic of Korea, 22–25 September 2020. [Google Scholar]
  39. Rafiq, A.; Khan, T.A.; Afaq, M.; Song, W.-C. Service Function Chaining and Traffic Steering in SDN Using Graph Neural Network. In Proceedings of the 2020 International Conference on Information and Communication Technology Convergence (ICTC), Jeju, Republic of Korea, 21–23 October 2020. [Google Scholar]
  40. Rusek, K.; Suarez-Varela, J.; Almasan, P.; Barlet-Ros, P.; Cabellos-Aparicio, A. RouteNet: Leveraging Graph Neural Networks for Network Modeling and Optimization in SDN. IEEE J. Sel. Areas Commun. 2020, 38, 2260–2270. [Google Scholar] [CrossRef]
Figure 1. Process flow of SFC request in SDN-NFV architecture.
Electronics 12 04018 g001
Figure 2. GNN-enhanced node-level prediction for ensuring VNF availability of new request.
Electronics 12 04018 g002
Figure 3. Use cases of smart city applications from ingress data sources to the egress end-user interfaces, namely (a) smart emergency services, (b) smart surveillance, (c) smart PIDs, (d) smart infrastructure control, (e) smart transportation, and (f) smart waste management.
Electronics 12 04018 g003
Figure 4. Results on (a) loss values of LS-SFC-GNN, (b) average acceptance ratio (%), and (c) average completion ratio (%) between proposed and reference approaches.
Electronics 12 04018 g004
Figure 5. Average delays on (a) smart emergency services, (b) surveillance, (c) PIDs, (d) infrastructure control, (e) transportation, and (f) waste management.
Electronics 12 04018 g005
Table 1. Background studies on standardized QCI-associated smart city examples.
QCI-IndexResource TypePriority LevelPDBPELRSmart City Examples
QCI 1 (Conversational Voice)GBR2100 ms10−2Smart Emergency Services
QCI 2 (Conversational Video)3150 ms10−3Smart Surveillance
QCI 4 (Buffered Streaming)5300 ms10−6Smart PIDs
QCI 70 (Mission Critical Data)Non-GBR5.5200 ms10−6Smart Infrastructure Control
QCI 79 (V2X messages)6.550 ms10−2Smart Transportation
QCI 9 (Background)9300 ms10−6Smart Waste Management
Table 2. Key notations and descriptions.
NotationDescription
s S A set of smart city services
f w s t = { f 1 f 2 f j } The flow of a particular service- s  that has a VNFFG with j  set of VNFs
G ( V , E , F ) Graph of physical nodes v V , links e E , and VNF instances f F
c v m a x ,  m v m a x ,  d v m a x Upper-bound capacities of physical node- v  (CPU, memory, disk)
c f , v a l l o c ,  m f , v a l l o c ,  d f , v a l l o c Allocated capacities for VNF- f  in node- v  (CPU, memory, disk)
r f , v m a x ,  r f , v a l l o c Upper-bound and allocated resource capacities
c f j   r e q ,  m f j   r e q ,  d f j   r e q Required capacities for VNF- f j  in service- s  (CPU, memory, disk)
r f j   r e q Required resource capacities
a f , v t Decision variable to host VNF- f  instance in physical node- v
a f j , s t Decision variable to place VNF- f j  in SFC of service- s
φ e t ,  φ v t ,  φ f t Delays on link, physical node, and VNF instances
φ s m a x Upper-bound tolerable delays of service- s
ω f j , v t Availability statuses of VNF- f j  instances
ϑ f j , v t Loading congestion statuses of VNF- f j  instances
l f j , v t Current loading status of VNF- f j
o f j , v t Operating status of VNF- f j (whether the instance is currently operational or standby)
b s r e q Link bandwidth requirement for service- s
a v v e Status of link placement between physical nodes
T s c o m p ,  T s c o m m (1) Total computation and (2) communication delays of service- s
Table 3. Deployment properties of each use case with its proposed ISFs.
Use CaseISFBandwidth (Mbps)vCPURAM (GB)Replication VMs
Smart Emergency ServicesEmergency call or data handling100483
Action modeling and recommendation50245
Resource dispatch80363
Emergency response coordination1205102
Smart SurveillanceObject Detection1506125
Video Streaming2008163
Anomaly Detection100482
Facial Recognition80362
Smart PIDsAPI for data aggregation100483
Content scheduling50244
Real-time data feeds1205103
Display analytics80364
Smart Infrastructure ControlAPI for data aggregation1206122
Real-time analytics and detection1506125
Command settings80363
Predictive maintenance1205102
Smart TransportationVehicle state gathering100485
Traffic prediction100482
Route optimization1205103
Policy-making80362
Smart Waste ManagementAPI for data aggregation100483
Waste collection scheduling60364
Driving route planning1005103
Environment impact evaluation70483
Table 4. Key simulation parameters.
ParameterSpecifications
Hosting infrastructureIntel(R) Xeon(R) Silver 4280 CPU @ 2.10 GHz, 128 GB, NVIDIA Quadro RTX 4000 GPU
Maximum tolerable delay per ISF (post-train)5 ms to 15 ms
SFC request rate100/s to 1000/s
Number of VNFs ( j )  in a single chain4
Delay on links≤2 ms
Simulation timeslot2000- t  (5 congestion-level)
GNN platformPython (Pytorch)
Learning Rate0.01
Batch Size64
Number of Epochs1000
Dropout Rate0.3
Activation FunctionReLU and Sigmoid
Table 5. Average SFC delays (ms) in 5-level congestion.
Use CaseCongestion LevelLS-SFC-GNNThreshold-BasedLoad Balancing
Smart Emergency ServicesC120.9226.7836.32
C223.2340.9160.12
C330.1855.7280.91
C436.1778.14102.56
C545.13100.01123.75
Smart SurveillanceC121.4332.8145.45
C225.1245.1277.23
C340.7662.2395.32
C456.9187.55120.66
C570.43110.51131.43
Smart PIDsC142.3156.2371.29
C255.8370.0482.66
C368.4496.03100.43
C481.03126.21146.12
C592.55153.49192.88
Smart
Infrastructure
Control
C132.3145.4557.82
C239.2159.3672.12
C351.0879.8795.32
C463.22100.13120.67
C577.01125.12143.09
Smart
Transportation
C120.2325.6132.43
C223.2331.3444.09
C330.1840.7651.56
C436.1751.8761.44
C528.3163.2170.53
Smart Waste
Management
C162.3172.4380.23
C273.74103.53121.45
C381.34129.84164.32
C495.33166.49202.83
C5104.63189.51243.77
Disclaimer/Publisher’s Note: The statements, opinions and data contained in all publications are solely those of the individual author(s) and contributor(s) and not of MDPI and/or the editor(s). MDPI and/or the editor(s) disclaim responsibility for any injury to people or property resulting from any ideas, methods, instructions or products referred to in the content.

