Article

Research on a Knowledge Graph Embedding Method Based on Improved Convolutional Neural Networks for Hydraulic Engineering

1
Provincial Collaborative Innovation Center for Efficient Utilization of Water Resources in the Yellow River Basin, North China University of Water Resources and Electric Power, Zhengzhou 450046, China
2
School of Information Engineering, North China University of Water Resources and Electric Power, Zhengzhou 450046, China
*
Author to whom correspondence should be addressed.
Electronics 2023, 12(14), 3099; https://doi.org/10.3390/electronics12143099
Submission received: 18 June 2023 / Revised: 6 July 2023 / Accepted: 13 July 2023 / Published: 17 July 2023

Abstract

:
In response to the shortcomings of existing knowledge graph embedding strategies, such as weak feature interaction and latent knowledge representation, a unique hydraulic knowledge graph embedding method is suggested. The proposed method incorporates spatial position features into the entity-relation embedding process, thereby enhancing the representation capability of latent knowledge. Furthermore, it utilizes a multi-layer convolutional neural network to fuse features at different levels, effectively capturing more abundant semantic information. Additionally, the method employs multi-scale dilated convolution kernels to capture rich explicit interaction features across different scales of space. In this study, the effectiveness of the proposed model was validated on the link prediction task. Experimental results demonstrated that, compared to the ConvE model, the proposed model achieved a significant improvement of 14.8% in terms of mean reciprocal rank (MRR) on public datasets. Additionally, the suggested model outperformed the ConvR model on the hydraulic dataset, leading to a 10.1% increase in MRR. The results indicate that the proposed approach exhibits good applicability and performance in the task of hydraulic knowledge graph complementation. This suggests that the method has the potential to offer significant assistance for knowledge discovery and application research in the field of hydraulics.

1. Introduction

The implementation and management of hydraulic engineering and the ecological environment is complex and changeable, there are many risks during the operation of the project, and it is difficult to balance the distribution of water resources. It is important to strengthen the scientific and standardized management of hydraulic engineering. At present, most of the data related to hydraulic engineering are stored in the form of paper text and electronic documents, which have problems such as low efficiency of query and retrieval, weak content association, and insufficient intelligent decision support. Therefore, it is necessary to explore the rapid acquisition, rational organization, information sharing, and scientific utilization of the massive, multi-source, heterogeneous hydraulic engineering knowledge body.
A knowledge graph is a semantic network that represents the relationships between various entities in the real world [1]. In recent years, knowledge graphs have also been applied to the field of hydraulics. By establishing links between entities, relationships and attributes, a knowledge graph can realize the structured and unified management of large amount of multi-source heterogeneous data in the field of hydraulics. Juan D et al. [2] constructed a water quality knowledge graph using water quality data and regulatory data from the Bogota River basin. The knowledge graph was also used to uncover information on water quality violations in the Bogota River basin, providing experts with a connected and interoperable view of the data. J Yan et al. [3] proposed a method to build a knowledge graph for water affairs by integrating structured and unstructured data, aiming to meet the requirements of water information integration. They developed an information recommendation system based on the water affairs knowledge graph, which effectively addressed the needs of water information retrieval and improved water information retrieval capabilities. Duan H et al. [4] achieved a cross-domain query and retrieval of water knowledge by constructing a comprehensive knowledge graph of water resources, which integrates and associates water-related object knowledge and water discipline knowledge, thus improving the efficiency of water knowledge retrieval and the ability of knowledge mining and discovery. In addition to the construction of hydraulic knowledge graphs, many scholars have started to initially explore intelligent applications based on hydraulic knowledge graphs. The research of these applications aims to make full use of the rich information of the hydraulic knowledge graph to improve the efficiency of management and the accuracy of decision making in the field of hydraulics. Liu X et al. [5] used the text data of a water conservancy project inspection to construct the knowledge graph of the water conservancy project emergency plan, and generated the emergency plan intelligently through knowledge retrieval and reasoning, which broke the problems of low digitization, poor knowledge relevance, and insufficient intelligent decision making in the traditional water conservancy project emergency plan. Ye et al. [6] proposed a knowledge-graph-based urban flood resilience service framework to provide accurate and timely flood resilience information as well as efficient flood management solutions by enabling the sharing and intelligent application of knowledge in the flood resilience domain.
Although knowledge graphs are very effective in representing structured data, the basic symbolic nature of triples makes knowledge graphs difficult to manipulate [7]. Also, the complexity of the data’s multi-source heterogeneity and knowledge extraction [8,9,10] processes in knowledge graphs makes them suffer from incomplete information, and this incompleteness seriously affects their effectiveness in practical applications [11]. Knowledge graph embedding (KGE) [7] is a vital approach for addressing the problem of knowledge graph completion. Among the existing knowledge graph embedding models, the models based on translation distance extract the potential semantic information and structural features in the knowledge graph by simple structural or basic matrix operations, and the representative models are TransE [12], TransH [13], TransR [14], and TransD [15]. Bilinear models, such as DisMult [16] and ComplEx [17], use simple multiplicative operators to represent entities and relations and, thus, are able to capture linear associations between entities and relations. However, both types of models have weak expressiveness and an insufficient generalization ability when dealing with complex knowledge graphs. With the continuous development of deep learning technology, neural networks show a powerful nonlinear fitting ability and a good generalization performance. Therefore, the knowledge graph embedding representation model based on the deep structure of neural networks has attracted a lot of attention from researchers. Among them, as the first model to introduce convolutional neural networks to the knowledge graph embedding task, ConvE [18] used a combination of head entity embedding and relational embedding as the input for the convolutional neural network, and extracted the local interaction features between entities and relations using two-dimensional convolution for the first time. However, its standard convolution captures insufficient feature interaction information, and has low feature representation capability. InteractE [19] with improvements to ConvE, using techniques such as feature alignment and circular convolution, further enhances the local interaction of features and improves the knowledge representation. However, its multiple convolutional layer structure can lead to the loss of surface knowledge to some extent. JointE [20] jointly uses 1D convolution and 2D convolution for feature extraction. The interaction between entities and relations is facilitated by 2D convolution to fully capture the latent knowledge; 1D convolution is used to extract explicit knowledge to address the lack of surface semantics. However, the JointE model ignores the spatial location properties of entity and relationship vectors. CapsE [21], on the other hand, takes advantage of the capsule network, and is able to capture deep features of different feature mappings in the same dimension. However, due to the complex structure of the capsule network and the use of dynamic routing algorithms, the training and inference process of the model consumes a lot of computational resources and time. Unlike the aforementioned models, the ConvR [22] model reshapes the embedding parameters of relations into multiple convolutional kernels, enabling relation-specific convolution operations that capture the feature interactions between entities and relations more comprehensively. However, it focuses solely on the feature interaction of a single scale and overlooks the feature interactions across different scales, limiting the expressive power of the model.
Based on the above discussion, this study proposes a knowledge graph embedding method based on convolutional neural networks to address the limitations of feature interaction capabilities and incomplete semantic representations in knowledge graph embeddings.
The main contributions of this work are as follows:
  • The integration of spatial location feature information in the embedding representation of entity relations enhances the representation of water knowledge;
  • It proposed the ConvMVD model, which utilizes multi-scale dilated convolution for high and low level feature interaction, resulting in richer semantic information and more reasonable entity-relationship embedding representation;
  • The ConvMVD model was applied to the hydraulic engineering dataset, and the experimental results showed that the model performed significantly better than other representative baseline methods in the linkage prediction task.
The rest of this paper is organized as follows. Section 2 introduces the techniques related to the knowledge graph embedding model ConvMVD. Section 3 elaborates on the construction process of the ConvMVD model. Section 4 presents the experimental protocol, the experimental results, and the experimental discussion. Section 5 briefly describes the formal methods for verification based on artificial intelligence techniques. Section 6 concludes the paper, and points out future research directions.

2. Related Work

2.1. Convolutional Neural Networks

A convolutional neural network (CNN) is a feedforward neural network capable of extracting features from data with convolutional structures [23]. The basic idea of CNN is to extract local features by convolving the input data with a convolutional layer, then downsampling the extracted features with a pooling layer and, finally, classifying them with a fully connected layer.
The convolutional layer is mainly divided into convolution and activation operations [24]. It is assumed that there are N neurons in a layer, and the convolution operation is performed between the feature map of the previous layer and the convolution kernel, then the new feature matrix is output by a specific activation function [25]. The mathematical expression for the convolution operation is as follows:
X j l = f i 0 , M X i l 1 K j l + b j l        j 0 , N
In the equation, l denotes the layer number, X j l represents the j-th feature matrix of the l-th layer, f(·) represents the activation function, M represents the total number of neurons in the previous layer, X i l 1 represents the i-th feature matrix passed from the previous layer, K j l represents the weight matrix of the corresponding convolutional kernel, and b j l represents the bias matrix.
The pooling layer [26] aims to reduce the dimensionality of the feature maps by performing downsampling on the input feature vectors using pooling kernels. Pooling can be categorized into two types: maximum pooling and average pooling, respectively:
P m a x l i , s = max s 1 W < t < s W a l i , t        s = 1 , 2 , . , q ,  
P a v g l i , s = a v g s 1 W < t < s W a l i , t
In the equations, al(i,t) represents the t-th feature map of the i-th neuron in the l-th layer, W represents the width of the pooling region, s denotes the s-th pooling kernel, and P a v g l i , s represents the output result of pooling.
The role of the fully connected layer [27] is to integrate the relevant information for feature classification from the convolutional and pooling layers. It transforms the feature maps, carrying the relevant information into one-dimensional vectors. The expression for this process is as follows:
h x = f wx + b
In the equation, x represents the input to the fully connected layer, which is the feature matrix passed down from the last convolutional layer, w represents the weight vector, and b represents the bias vector.

2.2. Dilated Convolution

Dilated convolution, also known as atrous convolution or dilated convolution, is a technique in convolutional neural networks [28]. Its main design principle is to insert a certain number of zeros (0 values) between two consecutive filter values in each dimension of the convolutional kernel, thereby increasing the receptive field of the kernel. For a two-dimensional signal X, the output obtained by applying the dilated convolution operator can be represented in the following form:
Y m , n = a = 1 k h b = 1 k w X m + r · a , n + r · b × ω r a , b
In the equation, Y represents the output signal, kh and kw represent the width and height of the convolutional kernel, and r corresponds to the dilation rate of the convolutional kernel ωr used to sample X.

2.3. Knowledge Graph Embedding

The knowledge graph embedding approach is a technique for mapping entities and relations in the knowledge graph to a low-dimensional continuous vector space. These vector representations can capture the semantic associations between entities and relations, and be used for various knowledge-graph-related tasks such as entity relationship prediction, knowledge graph complementation [29], and recommendation. Knowledge graph embedding models can usually be classified as translational distance-based models, bilinear models, and neural network-based models.
  • The model based on translation distance treats the relationship as a translation from the head entity to the tail entity in vector space, which has the features of high computational efficiency and wide application but, compared with the neural network-based and deep learning methods, it still needs to be improved in semantic feature extraction and learning;
  • The bilinear model measures the similarity between entities and relationships by mapping them into a low-dimensional vector space and using bilinear functions. Its simple form is easy to implement, but its weak expressiveness limits its application in modeling complex relationships;
  • The neural network-based model is to use different neural network methods to complete the feature representation of entities and relations, and is then used for inference prediction of the knowledge triad. Due to its greater advantages in semantic feature learning and extraction, it has become the mainstream research direction of current knowledge graph embedding models.

3. Materials and Methods

The process of the proposed ConvMVD model, which is based on an enhanced convolutional neural network for knowledge graph embedding, is depicted in Figure 1. Firstly, the one-dimensional feature vectors of entities and relations are jointly reshaped into two-dimensional feature maps, allowing for the aggregation of feature information from translation and rotation perspectives. Subsequently, feature extraction is performed using two-dimensional convolutional operations, where multi-scale dilated convolutions with dilation rates (1, 2, 3) are employed instead of standard convolutions to expand the receptive field. Finally, the three output feature maps are fused and reshaped into the final predicted one-dimensional feature vector.

3.1. Problem Formulation

In this paper, the knowledge graph is represented as G = h , r , t | h , r , t E × R × E , which is the set of a series of triples, and a single triple can be represented as (h,r,t). Where E represents the set of entities, h,t denote the head entity and tail entity, respectively, h , t E ; and R represents the set of relations, r R . The purpose of knowledge graph embedding is to learn the low-dimensional vector representation h , r ϵ M d of a given entity and relation, where d denotes the dimensionality of the embedding. The link prediction task was performed during our experiments, which refers to using the entities and relations that already exist in the knowledge graph to infer whether there is a relationship missing between a certain two entities. For example, given the head entity and relation, the tail entity is predicted, denoted as (h,r,?). The link prediction problem can be formally defined as learning a scoring function φ: E × R × EM. Given an input triple x = (h,r,t), it is scored using a pre-designed scoring function.

3.2. ConvMVD

This paper proposes an improved convolutional neural network-based knowledge graph embedding model called ConvMVD, as shown in Figure 2. ConvMVD involves embedding representation, feature interaction and fusion, and link prediction.

3.2.1. Embedding Representation

The potential semantic extraction ability of the knowledge graph embedding model is significantly affected by the degree of interaction between entity embedding and relationship embedding. The embedding representation of the ConvMVD model consists of four parts: the two-dimensional feature matrix of entity relationships, the spatial translation of entity relationship vectors, the spatial rotation of entity relationship vectors, and the spatial fusion superposition of entity relationship vectors, i.e., the fusion of spatial translation and rotation. Through the combination of the above four components, the ConvMVD model can synthesize different features between entities and relations to extract potential semantic information in the knowledge graph. This comprehensive embedding representation helps the model better understand and reason about the relationships in the knowledge graph, thus enhancing its potential semantic extraction capability.
(1)
Characteristic matrix
For a knowledge graph, we initialize each head entity as a vector of head entities and each relation as a vector of relations, followed by reshaping each of them into a two-dimensional matrix and performing a join operation to obtain one of the inputs for the convolution operation. The reason for reshaping vectors into matrices is that two-dimensional convolution is superior to one-dimensional convolution in terms of interaction modeling. The process can be expressed as follows:
H ϵ M d h ϵ M a × b R ϵ M d r ϵ M a × b h ^ = c o n c a t h , r ,   h ^ M a × b
where H denotes the head entity vector, h denotes the 2D transformed head entity vector, R denotes the relational vector, r denotes the 2D transformed relational vector, and d denotes the embedding dimension. h ^ denotes the 2D matrix obtained by joining h and r, concat denotes the join operation, and a,b,b′ = b/2, denotes the spatial dimension of the vector;
(2)
Spatial transformation view
Information about the spatial location features of entities and relationships plays an important role in the accuracy of link prediction tasks [30] and, by considering the location features of entities and relationships in space, link relationships in knowledge graphs can be better understood. Combining multiple views can provide a more comprehensive description of knowledge, and the different views have complementary information to each other. By combining different perspectives and features, we can obtain a richer and more diverse representation of knowledge. Therefore, this study constructs different spatial transformation views for entity vectors and relation vectors. The views are represented as V, where the first view, VP, represents the spatial translation view of entity-relation vectors; the second view, VR, represents the spatial rotation view of entity-relation vectors; and the third view, VM, represents the fusion view of spatial translation and rotation. The implementation process is as follows:
First, the head entity h ϵ M a × b and the relation r ϵ M a × b are divided into two parts: h = h 1 , h 2 and r = r 1 , r 2 , where h 1 , h 2 , r 1 , r 2 ϵ M a × b and b = b / 4 . Next, the two sub-entity vectors and the two sub-relation vectors are combined separately to form four combinations of entity-relation vectors: h 1 , r 1 , h 1 , r 2 , h 2 , r 1 ,   h 2 , r 2 . The spatial translation formula for entity-relation vectors is as follows:
V P = h 1 + r 1 a × b ; h 1 + r 2 a × b ; h 2 + r 1 a × b ; h 2 + r 2 a × b a × b
where VP denotes the spatial translation view, (h1 + r1) denotes the spatial translation operation of h1 and r1, h 1 + r 1 ϵ M a × b , and [;] denotes the vectors on both sides of the semicolon to be connected. The spatial rotation formula of the entity relation vector is as follows:
V R = h 1 r 1 a × b ; h 1 r 2 a × b ; h 2 r 1 a × b ; h 2 r 2 a × b a × b
where VR denotes the spatial rotation view, (h1r1) denotes the spatial rotation operation of h1 and r1, h 1 r 1 ϵ M a × b , and [;] denotes the vectors on both sides of the semicolon for concatenation.
Next, the fused view VM is formed by combining the translation vector h + r and the rotation vector hr. This operation can be expressed as:
V M = h + r a × b ; h r a × b a × b
Finally, the two-dimensional feature matrix h ^ , the spatial translation view VP, the spatial rotation view VR, and the fusion view VM are concatenated as the input of the convolution layer. This process can be expressed as E ^ = c o n c a t h ^ ; V P ; V R ; V M , where concat denotes the concatenation operation.

3.2.2. Feature Interaction and Fusion

In the feature interaction module, this model incorporates a multi-scale and multi-level feature interaction structure.
First, by adjusting the dilation rate parameter i, we generate dilated convolution kernels ω i K k h i × k w i with different sizes, where k h i = k h + k h 1 × i 1 and k w i = k w + k w 1 × i 1 . Here, kh and kw represent the width and height of the convolution kernel, respectively. As shown in Figure 2, these dilated convolution kernels include ω 1 K 3 × 3 , ω 2 K 5 × 5 , ω 3 K 7 × 7 , which have different sizes. These kernels are convolved with E ^ to produce interaction features at multiple scales. For the m-th row and n-th column of the feature output Ci obtained by operating E ^ with the convolution kernel ωi, it can be calculated using the following formula:
C i m , n = E ^ ω i = a = 1 k h b = 1 k w E ^ m + i · a , n + i · b × ω i a , b
In the equation, Ci represents the feature output obtained by interacting with the convolutional kernel ωi with a pore size of i, and ∗ denotes the convolution operation.
Shallow features are extracted as features in earlier convolutional layers, and they are very effective for capturing local information. However, shallow features have a small field of perception, and can only focus on local areas of the input data, which may not cover the broader contextual information. As the number of convolutional layers increases, the extraction ability of deep features is enhanced and can capture richer semantic information. Deep features gradually expand the perceptual field by stacking multiple convolutional layers and nonlinear activation functions, which can focus on a larger range of contexts and capture more abstract and high-level semantic features. However, correspondingly, the detailed information of deep features may be reduced [31]. This model uses multilayer convolutional neural networks to extract features at different levels, to fuse features at different levels to take full advantage of their strengths and complementarities. First, the input feature matrix is convolved and, for shallow feature maps, it is used as input to perform more convolutions until three layers of feature maps are obtained, each corresponding to low, medium and high level features. Moreover, each layer’s feature maps represent the interaction features between entities and relations at different scales. These feature maps are aggregated together using element-wise addition. Then, a fully connected layer is applied to fuse these feature maps, resulting in a multi-scale and multi-level feature map. Finally, the feature map is flattened into a feature vector. This process can be represented as follows:
C 1 = E ^ ω 1
C 2 = C 1 ω 2
C 3 = C 2 ω 3
O = v e c a d d C 1 , C 2 , C 3
where vec stands for spread operation and add stands for add-by-element operation.

3.2.3. Scoring Functions

To calculate the score of (h,r,t), we project O onto Md using the fully connected layer, then calculate the similarity of the inner product of this vector with the tail vector to measure the plausibility of the triplet (h,r,t). The scoring function φ(h,r,t) of the model ConvMVD can be expressed as:
φ h , r , t = f O W P T t
where f denotes the nonlinear activation function and WP denotes the characteristic projection matrix.

4. Experiment

In this section, we begin by presenting the experimental setup of our study, including the description of the datasets used, the configuration of hyperparameters, and the evaluation metrics. The experiments are divided into three parts. The first part is the validity and stability of this paper’s model on different data sets and comparison with other KGE models. The second part consists of conducting ablation experiments to verify the superiority of our model by analyzing the impact of various components or techniques used. The third part focuses on hyperparameter optimization experiments to identify the optimal combination of hyperparameters that yield the best performance for our model.

4.1. Experimental Setting

4.1.1. Dataset

In this paper, experiments are conducted on the standard dataset FB15K-237 and the hydraulic engineering dataset Hydraulic_eng.
FB15K-237: FB15K is extracted from Freebase, an extensive knowledge base that includes information about movies, celebrities, sports teams, prizes, and so on. FB15K-237 removes reversible relationships from FB15K. The FB15K-237 dataset contains a total of 14541 entities and 237 relationships.
Hydraulic_eng: The dataset “Hydraulic_eng” is constructed with a collection of data including case studies in hydraulic engineering, fundamental knowledge of hydraulic engineering, and hydrological geographical information. It consists of 6088 entities and 509 relationships.

4.1.2. Hyperparameter Setting

In this paper, we use the grid search method for hyperparameter tuning, using Adam as the optimizer, and iterative training on the public dataset FB15K-237 and the hydrological dataset Hydraulic_eng. The hyperparameters of the grid search range as follows: the range of learning rate is {0.0001, 0.0003, 0.0005, 0.0007, 0.0009, 0.001, 0.002, 0.003, 0.004, 0.005}, the range of batch_size is {32, 48, 64, 80, 96, 112, 128, 144, 160, 176}, and the range of the embedding size is {150, 200, 250, 300, 350, 400}.
The following parameter settings are consistent across all datasets, the number of multiscale branches is set to 3, the hole rate of the i-th branch is set to i, and the standard convolutional kernel size is 3 × 3. The remaining hyperparameters are set as shown in Table 1, where LR is the learning rate, input dropout, feature dropout, and hidden dropout denote the dropout rates of input layer, feature map and hidden layer, respectively.

4.1.3. Evaluation Indicators

This experiment uses the link prediction task to verify the validity of the model. In the link prediction task, the metric mean reciprocal ranking (MRR), Hits@n, is usually used as the final evaluation metric of the model. For a given test triad (h,r,t), we replace the tail entity t with all other entities eE to generate candidate triads, and then score the given triad (h,r,t) and the candidate triads together, and rank the scores from low to high. MRR is the mean reciprocal ranking, which indicates the reciprocal of the average ranking of the real triad in the score ranking list. higher MRR values indicate better model better performance. It is calculated as follows:
M R R = 1 S i = 1 S 1 r a n k i
where S is the set of triples, S is the number of sets of triples, and ranki refers to the link prediction rank of the ith triple.
The indicator Hits@n refers to the proportion of correct triples in the top n rankings, and a larger value of this indicator indicates better model performance, generally with a value of 1, 3 or 10 for n. It is calculated as follows:
H I T S @ n = 1 S i = 1 S II r a n k i n
The above formula involves the same symbols as those involved in the MRR calculation formula and, in addition, II(·) is the indicator function (if the condition is true then the function value is 1, otherwise it is 0). Both MRR and Hits@n fractions range from 0 to 1 [32].

4.2. Experimental Results and Analysis

4.2.1. Link Prediction Experiments

In this paper, TransE, DistMult, ConvE, ConvR, InteractE, and JointE are used as the comparison models and, to ensure a fair comparison, these results are used with exactly the same data preprocessing and measurement methods. The accuracy results of each model on the FB15K-237 dataset and the Hydraulic_eng dataset are shown in Table 2 and Table 3 and Figure 3, respectively. To verify the validity of the model, the experimental results use the average of the results of 500 iterations. The mean statistic reflects the average level of the model prediction, and the higher the mean values of the indicators MRR, Hits@10, Hits@3 and Hits@1, the better the average level of the model prediction. The optimal results are indicated using bold.
From Table 2 and Table 3, it can be observed that deep models have significant advantages over translation-based and bilinear models in handling knowledge graph embedding tasks. Link prediction results on the FB15K-237 dataset demonstrate that ConvMVD consistently achieves the best performance across multiple evaluation metrics. Compared to ConvE, ConvR, InteractE, and JointE models based on convolutional neural networks, ConvMVD shows improvements of 14.8%, 3.7%, 2.8%, and 2% in terms of MRR, and improvements of 35.4%, 25.9%, 22.9%, and 22.5% in terms of Hits@10, and improvements of 20.3%, 9.4%, 7.9%, and 7.1% in terms of Hits@3, respectively. These experimental results collectively indicate that the proposed model performs well in knowledge graph embedding tasks.
To validate the applicability of the ConvMVD model in hydraulic knowledge graph completion tasks, we conducted link prediction experiments on the Hydraulic_eng dataset. The experimental results, as shown in Table 3, demonstrate that ConvMVD achieves the best performance across all four evaluation metrics. Compared to the ConvE and ConvR models, ConvMVD shows improvements of 3.3% and 10.1% in terms of MRR, respectively. The performance difference is relatively small when compared to InteractE and JointE models, with improvements of 2% and 2.3% in MRR, respectively. These experimental findings indicate that the proposed model can be integrated into hydraulic engineering knowledge graph completion tasks, resulting in a more comprehensive and knowledge-rich knowledge graph. This lays the foundation for providing comprehensive and efficient hydraulic knowledge services.
In order to verify the stability of the models, 150 Monte Carlo simulations were conducted for each model to calculate the variance statistics. The variance statistic reflects the degree of deviation of the model prediction, and the lower value of variance indicates the more stable model prediction. The variance of different models is shown in Table 4 and Table 5.
As can be seen from Table 4 and Table 5, where the values of variance statistics for both the shallow models TransE and DistMult are the smallest; however, combined with the results of the linked prediction experiments above, it is clear that the shallow models have the lowest prediction average. Compared with the convolutional neural network-based models ConvE, ConvR, InteractE, and JointE, the variance statistics of each metric of ConvMVD are the lowest.
The above experimental results show that the model in this paper has good effectiveness and stability compared with other benchmark models.

4.2.2. Ablation Experiments

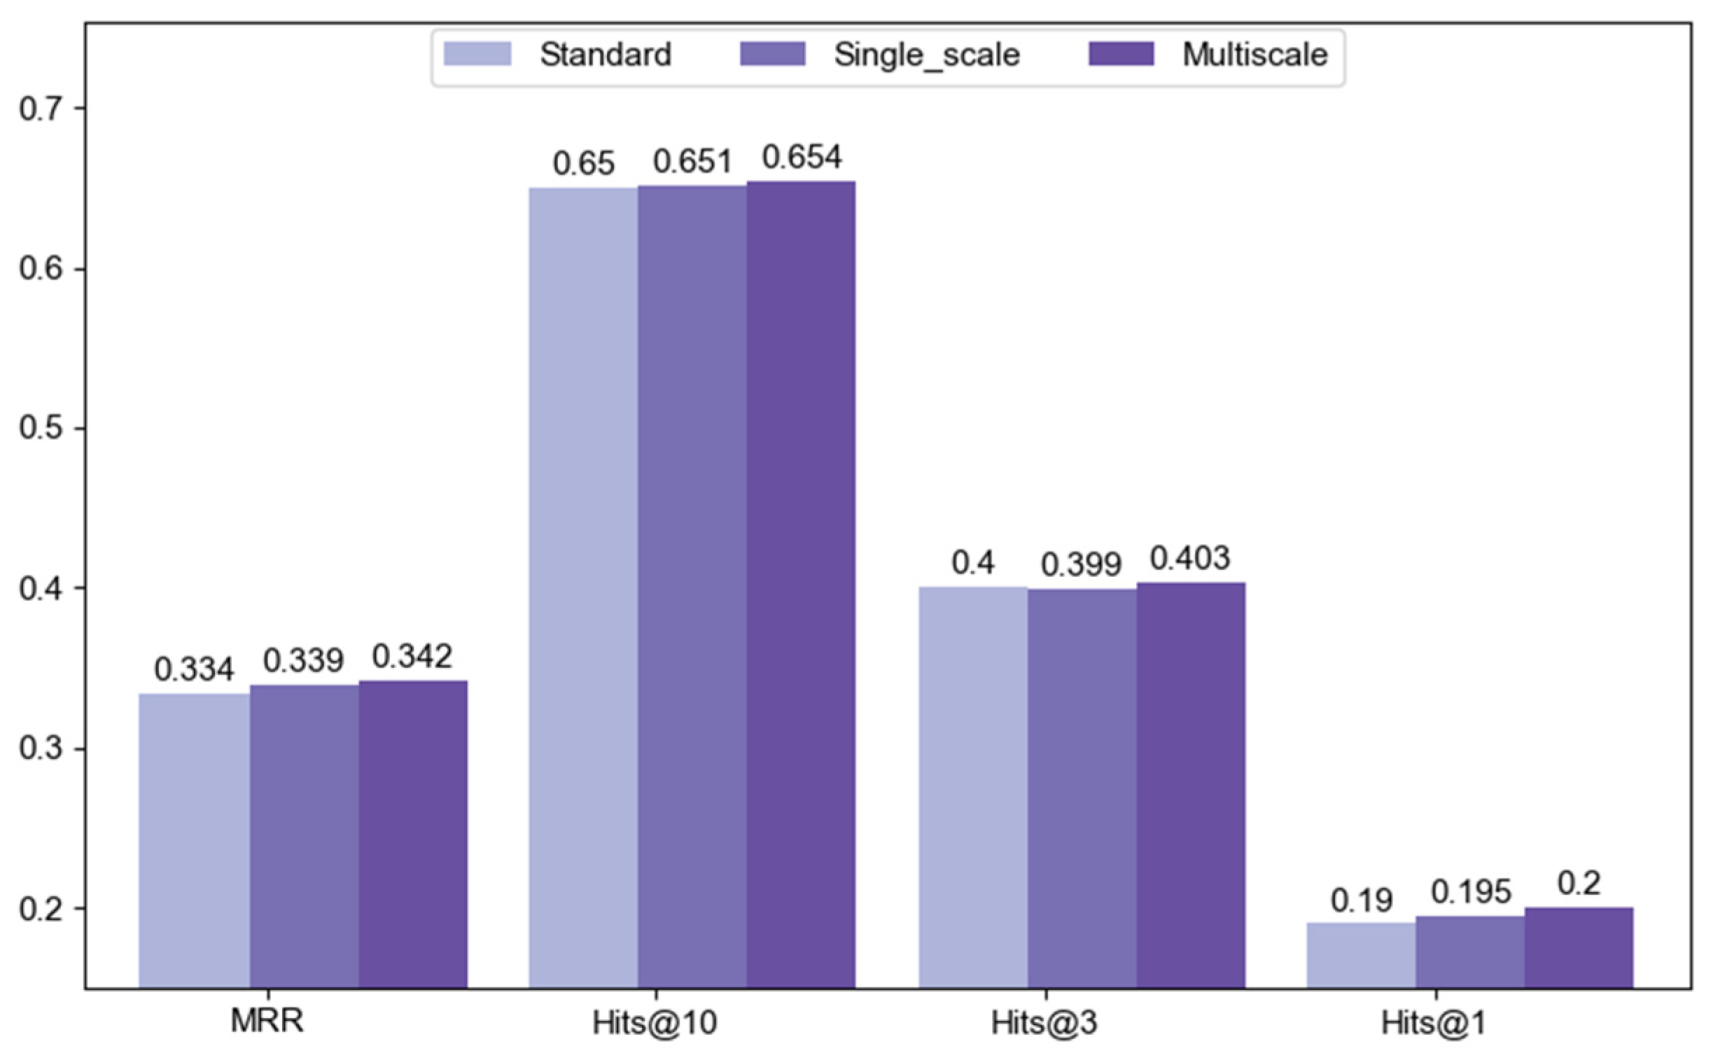
To evaluate the impact of different convolutional approaches on model performance, we conducted an ablation experiment on the Hydraulic_eng dataset. In the ablation experiment, we replaced the multi-scale dilated convolution in the model with standard convolution and single-scale dilated convolution, respectively, for comparative analysis. The experimental results are shown in Figure 4.
In Figure 4, “Standard” represents the experimental results using standard convolution, “Single_scale” represents the experimental results using single-scale dilated convolution with a dilation rate of 2, and “Multiscale” represents the experimental results using multi-scale dilated convolution with dilation rates of [1, 2, 3]. The results demonstrate that, when using standard convolution or single-scale dilated convolution, all four evaluation metrics show varying degrees of decrease. This further validates the importance and effectiveness of mixed dilated convolutions in the model. Through the ablation experiment, we gained a deeper understanding of the impact of different convolutional approaches on model performance, providing valuable experimental evidence for model optimization and further research.

4.2.3. Hyperparameter Optimization Experiment

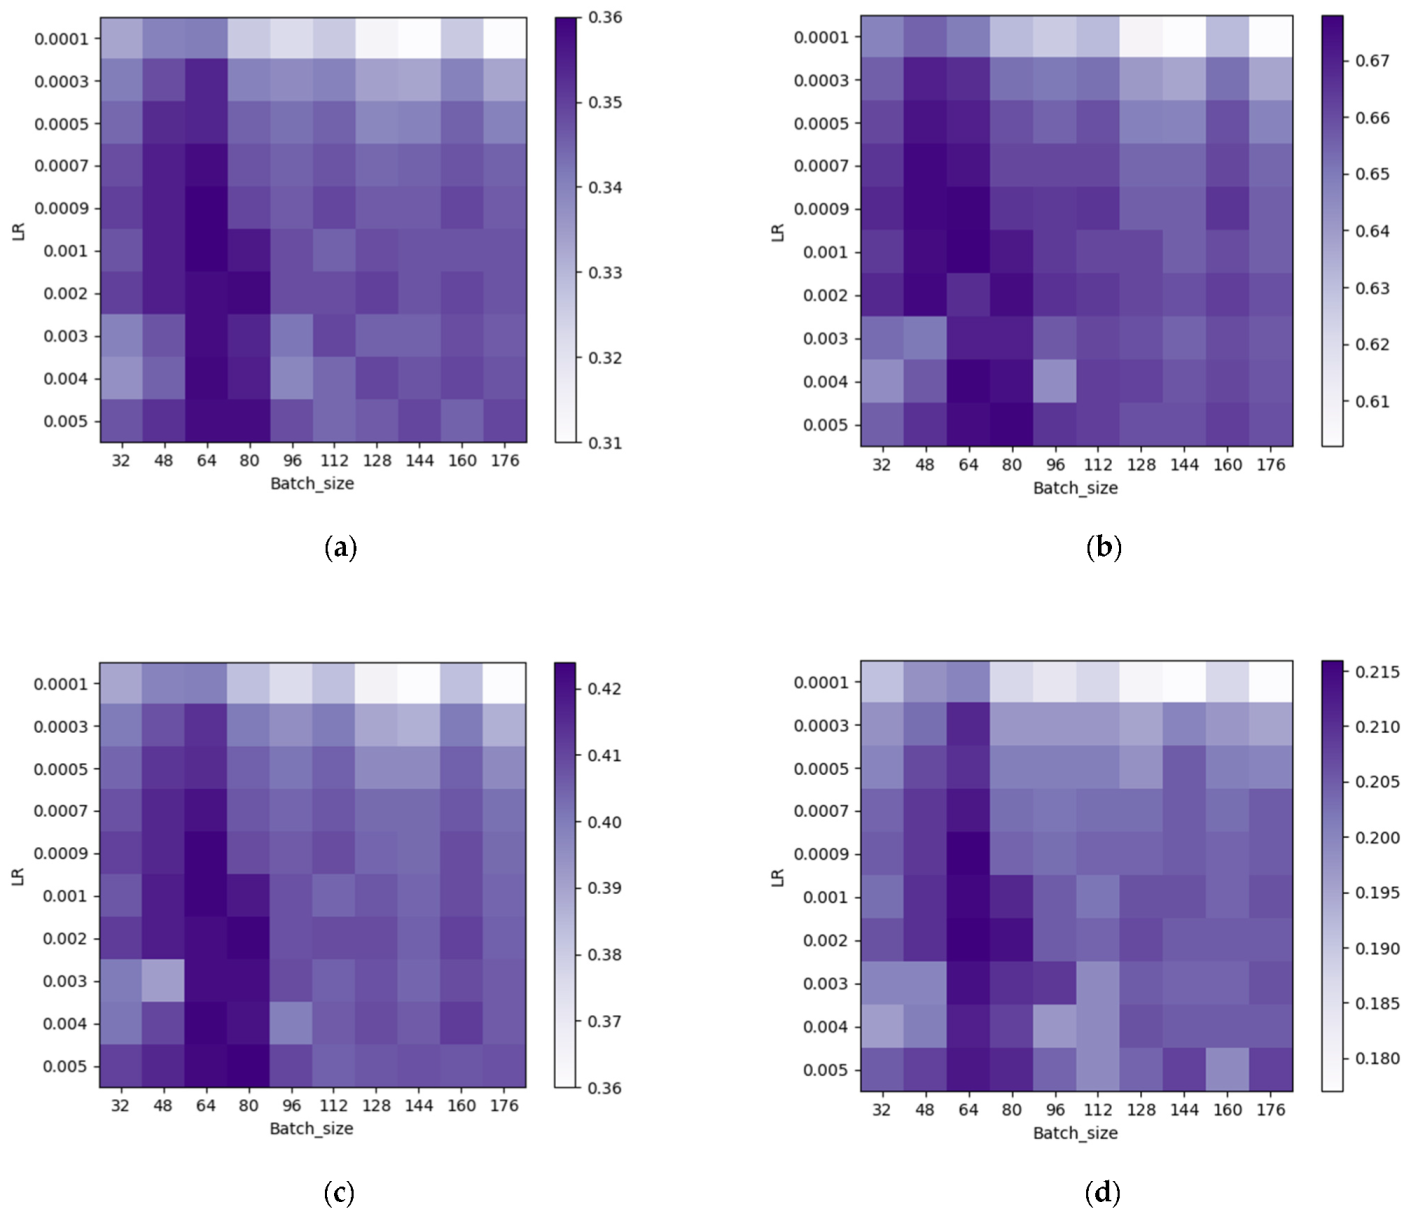
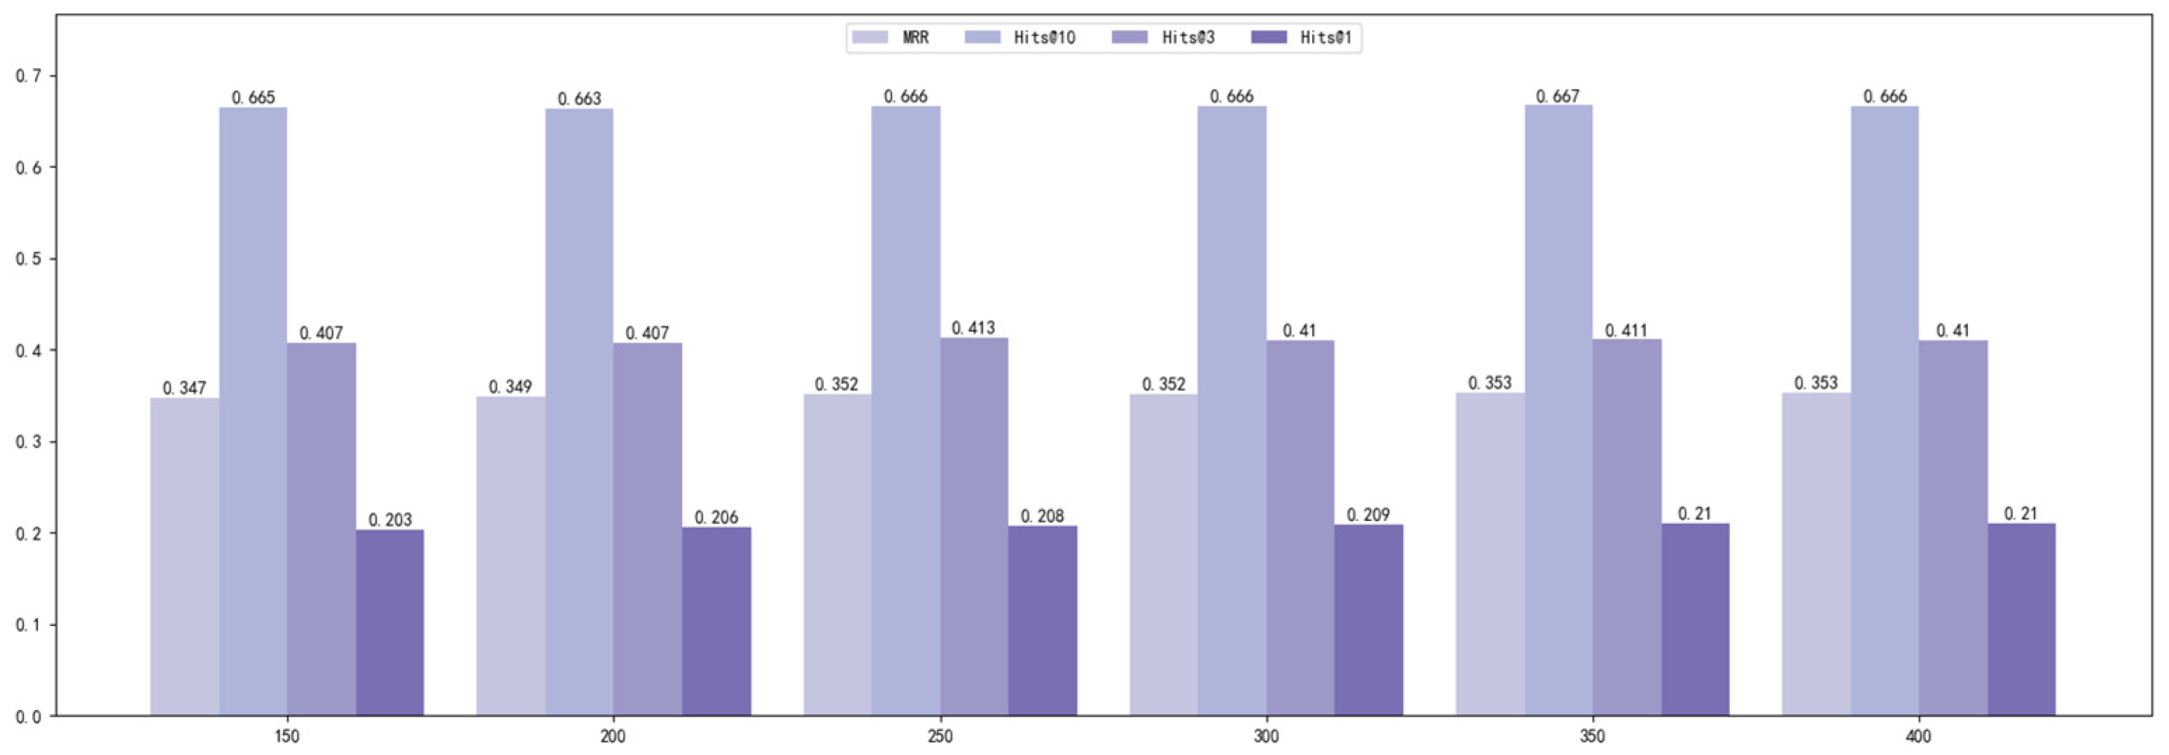
In the hyperparameter optimization experiments, batch_size and learning rate parameter selection experiments, and embedding size selection experiments are conducted, and the results of these experiments provide important guidance to help us choose the appropriate hyperparameter configuration to optimize the performance of the ConvMVD model. The results are shown in Figure 5 and Figure 6, respectively.
The first are the batch size and learning rate parameter optimization experiments, and the experimental results are presented in the heat map in Figure 5. In this figure, the horizontal coordinate indicates the Batch_Size and the vertical coordinate indicates the learning rate (LR), while the shades of the colors reflect the magnitude of the values of the evaluation metrics under the corresponding hyperparameter combinations. Figure 5a–d correspond to the MRR metric level, Hits@10 metric level, Hits@3 metric level and Hits@1 metric level for different hyperparameter combinations, respectively. It should be noted that a darker color in Figure 5 indicates a larger the value of each evaluation indicator under the corresponding hyperparameter combination, which indicates a better model performance. Therefore, we can conclude that the model ConvMVD exhibits optimal performance for each evaluation metric at a learning rate of 0.001 and a batch_size of 64.
Indeed, the embedding dimension can also impact the model’s performance. If it is too small, the model may struggle to fit the data adequately, while if it is too large, the model may overfit. In the embedding dimension selection experiment, we considered sizes of 150, 200, 250, 300, 350, and 400. The results are presented in Figure 6, with the optimal results highlighted in bold. From Figure 6, it can be observed that when the embedding dimension is set to 350, the ConvMVD model achieves optimal performance in most of the evaluation metrics. This suggests that an embedding dimension of 350 leads to the best results for the ConvMVD model.

5. AI-Based Formal Methods for Verification

The combination of formal methods and artificial intelligence techniques, known as AI-based formal methods, is a methodology that integrates formal methods with AI technologies. Formal methods [33] are an approach based on mathematics and logic that provides precise specifications and verifies system behavior. On the other hand, artificial intelligence technologies encompass machine learning, natural language processing, knowledge representation and reasoning, and other techniques [34].
In formal methods, the specifications and properties of a system are typically described using formal languages such as mathematical formulas, logical expressions, or models. However, traditional formal methods often require manual authoring and verification of specifications, which can become challenging and time-consuming for complex systems. Artificial intelligence technologies can assist in automating and simplifying the application and verification process of formal methods. For instance, machine learning can automatically infer and generate new specifications and properties by learning from existing patterns. Natural language processing techniques can aid in understanding and interpreting natural language descriptions of formal specifications and properties. Knowledge representation and reasoning techniques can handle and reason about complex formal specifications and properties.
By combining artificial intelligence techniques with formal methods, more efficient and intelligent solutions can be provided for system verification and specification:
  • Automated specification and property generation: utilizing methods like machine learning, automatic learning and generation of formal specifications and properties can be achieved from existing system behavior data;
  • Intelligent verification tools: developing intelligent verification tools using natural language processing and knowledge representation and reasoning techniques enables non-experts to easily apply formal methods for system verification;
  • Efficient verification algorithms: improving the verification algorithms of formal methods through the application of machine learning and optimization techniques to enhance verification efficiency and accuracy;
  • Reinforcement of formal verification: integrating techniques such as reinforcement learning to automate the formal verification process, enhancing the robustness and adaptability of verification.
However, AI-based formal methods also face certain challenges. For example, the verification process can be influenced by factors such as algorithm selection, data biases, and feature extraction. Additionally, the interpretation and explainability of verification results can be problematic, since AI technologies often operate as black-box models, making it difficult to provide detailed explanations and visualizations.
In conclusion, AI-based formal methods have tremendous potential in verifying complex systems. By combining formal specifications with AI technologies for automated verification, we can effectively analyze and validate system correctness and performance, thereby improving the quality and reliability of system designs.

6. Conclusions

In this paper, we propose a ConvMVD knowledge graph embedding model for the hydraulic knowledge graph complementation task. The experiments are evaluated using a link prediction task, and it is confirmed that most of the metrics of this paper’s model are significantly improved over the baseline models on both public and hydraulic datasets. The experimental results show that the ConvMVD model can effectively improve the feature interaction effect and enhance the knowledge representation of entities and relationships by adding entity-relationship spatial location features, fusing different levels of feature information, and taking advantage of different perceptual fields of convolutional kernels at different scales.
Although ConMVD achieves good results on the KGE tasks, the model in this paper focuses on the extraction of entity relationship feature information inside the triad, and does not consider introducing more external knowledge, such as description information and attribute information of hydraulic engineering objects, into the model. To address this limitation, we will consider incorporating the descriptive text information of the entities themselves and the path information in the knowledge graph in future work to further improve the performance of the model on the task of embedding the knowledge graph of hydraulic engineering. And, formal methods based on verification of artificial intelligence techniques will be considered to validate the robustness, reliability and interpretability of the proposed model.

Author Contributions

Conceptualization, Y.L.; methodology, Y.L.; software, J.T.; validation, Y.L. and J.T.; formal analysis, J.T.; investigation, J.T.; resources, Y.L.; data curation, X.L., T.T. and Z.R.; writing—original draft preparation, Y.L.; writing—review and editing, Y.L.; visualization, J.T.; supervision, Y.L.; project administration, Y.L., X.W. and Y.W.; funding acquisition, X.L. All authors have read and agreed to the published version of the manuscript.

Funding

This research received no external funding.

Data Availability Statement

Our data can be found here: https://github.com/KGE-DATA/data (accessed on 26 June 2023).

Conflicts of Interest

The authors declare no conflict of interest. The funders had no role in the design of the study; in the collection, analyses, or interpretation of data; in the writing of the manuscript; or in the decision to publish the results.

References

  1. Ma, X. Knowledge graph construction and application in geosciences: A review. Comput. Geosci. 2022, 161, 105082. [Google Scholar] [CrossRef]
  2. Rondón Díaz, J.D.; Vilches-Blázquez, L.M. Characterizing water quality datasets through multi-dimensional knowledge graphs: A case study of the Bogota river basin. J. Hydroinform. 2022, 24, 295–314. [Google Scholar] [CrossRef]
  3. Yan, J.; Lv, T.; Yu, Y. Construction and recommendation of a water affair knowledge graph. Sustainability 2018, 10, 3429. [Google Scholar] [CrossRef] [Green Version]
  4. Duan, H.; Han, K.; Zhao, H.; Jiang, Y.; Li, H.; Mao, W. Research on construction of comprehensive knowledge map of water conservancy. J. Hydraul. Eng. 2021, 52, 948–958. [Google Scholar]
  5. Liu, X.; Lu, H.; Li, H. Intelligent generation method of emergency plan for hydraulic engineering based on knowledge graph–take the South-to-North Water Diversion Project as an example. LHB 2022, 108, 2153629. [Google Scholar] [CrossRef]
  6. Ye, X.; Wang, S.; Lu, Z.; Song, Y.; Yu, S. Towards an AI-driven framework for multi-scale urban flood resilience planning and design. Comput. Urban Sci. 2021, 1, 11. [Google Scholar] [CrossRef]
  7. Wang, Q.; Mao, Z.; Wang, B.; Guo, L. Knowledge graph embedding: A survey of approaches and applications. IEEE Trans. Knowl. Data Eng. 2017, 29, 2724–2743. [Google Scholar] [CrossRef]
  8. Yang, S.; Yoo, S.; Jeong, O. DeNERT-KG: Named entity and relation extraction model using DQN, knowledge graph, and BERT. Appl. Sci. 2020, 10, 6429. [Google Scholar] [CrossRef]
  9. Al-Moslmi, T.; Ocaña, M.G.; Opdahl, A.L.; Veres, C. Named entity extraction for knowledge graphs: A literature overview. IEEE Access 2020, 8, 32862–32881. [Google Scholar] [CrossRef]
  10. Geng, Z.; Zhang, Y.; Han, Y. Joint entity and relation extraction model based on rich semantics. Neurocomputing 2021, 429, 132–140. [Google Scholar] [CrossRef]
  11. Shen, T.; Zhang, F.; Cheng, J. A comprehensive overview of knowledge graph completion. Knowl.-Based Syst. 2022, 255, 109597. [Google Scholar] [CrossRef]
  12. Bordes, A.; Usunier, N.; Garcia-Duran, A.; Weston, J.; Yakhnenko, O. Translating embeddings for modeling multi-relational data. Adv. Neural Inf. Process. Syst. 2013, 26, 2787–2795. [Google Scholar]
  13. Wang, Z.; Zhang, J.; Feng, J.; Chen, Z. Knowledge graph embedding by translating on hyperplanes. In Proceedings of the AAAI Conference on Artificial Intelligence, Quebec City, QC, Canada, 27–31 July 2014. [Google Scholar]
  14. Lin, Y.; Liu, Z.; Sun, M.; Liu, Y.; Zhu, X. Learning entity and relation embeddings for knowledge graph completion. In Proceedings of the AAAI Conference on Artificial Intelligence, Austin, TX, USA, 25–30 January 2015. [Google Scholar]
  15. Ji, G.; He, S.; Xu, L.; Liu, K.; Zhao, J. Knowledge graph embedding via dynamic mapping matrix. In Proceedings of the 53rd Annual Meeting of the Association for Computational Linguistics and the 7th International Joint Conference on Natural Language Processing (Volume 1: Long Papers), Beijing, China, 26–31 July 2015. [Google Scholar]
  16. Yang, B.; Yih, W.-T.; He, X.; Gao, J.; Deng, L. Embedding entities and relations for learning and inference in knowledge bases. arXiv 2014, arXiv:1412.6575. [Google Scholar]
  17. Trouillon, T.; Welbl, J.; Riedel, S.; Gaussier, É.; Bouchard, G. Complex embeddings for simple link prediction. In Proceedings of the 33rd International Conference on Machine Learning, New York, NY, USA, 19–24 June 2016. [Google Scholar]
  18. Dettmers, T.; Minervini, P.; Stenetorp, P.; Riedel, S. Convolutional 2d knowledge graph embeddings. In Proceedings of the AAAI Conference on Artificial Intelligence, New Orleans, LA, USA, 2–7 February 2018. [Google Scholar]
  19. Vashishth, S.; Sanyal, S.; Nitin, V.; Agrawal, N.; Talukdar, P. Interacte: Improving convolution-based knowledge graph embeddings by increasing feature interactions. In Proceedings of the AAAI Conference on Artificial Intelligence, New York, NY, USA, 7–12 February 2020. [Google Scholar]
  20. Zhou, Z.; Wang, C.; Feng, Y.; Chen, D. JointE: Jointly utilizing 1D and 2D convolution for knowledge graph embedding. Knowl.-Based Syst. 2022, 240, 108100. [Google Scholar] [CrossRef]
  21. Vu, T.; Nguyen, T.D.; Nguyen, D.Q.; Phung, D. A capsule network-based embedding model for knowledge graph completion and search personalization. In Proceedings of the 2019 Conference of the North American Chapter of the Association for Computational Linguistics: Human Language Technologies, Volume 1 (Long and Short Papers), Minneapolis, MN, USA, 2–7 June 2019. [Google Scholar]
  22. Jiang, X.; Wang, Q.; Wang, B. Adaptive convolution for multi-relational learning. In Proceedings of the 2019 Conference of the North American Chapter of the Association for Computational Linguistics: Human Language Technologies, Volume 1 (Long and Short Papers), Minneapolis, MN, USA, 2–7 June 2019. [Google Scholar]
  23. Li, Z.; Liu, F.; Yang, W.; Peng, S.; Zhou, J. A survey of convolutional neural networks: Analysis, applications, and prospects. IEEE Trans. Neural Netw. Learn. Syst. 2021, 33, 6999–7019. [Google Scholar] [CrossRef]
  24. Verstraete, D.; Ferrada, A.; Droguett, E.L.; Meruane, V.; Modarres, M. Deep learning enabled fault diagnosis using time-frequency image analysis of rolling element bearings. Shock Vib. 2017, 2017, 5067651. [Google Scholar] [CrossRef] [Green Version]
  25. Schmidhuber, J. Deep learning in neural networks: An overview. Neural Netw. 2015, 61, 85–117. [Google Scholar] [CrossRef] [Green Version]
  26. Zafar, A.; Aamir, M.; Mohd Nawi, N.; Arshad, A.; Riaz, S.; Alruban, A.; Dutta, A.K.; Almotairi, S. A Comparison of Pooling Methods for Convolutional Neural Networks. Appl. Sci. 2022, 12, 8643. [Google Scholar] [CrossRef]
  27. Vargas-Hakim, G.-A.; Mezura-Montes, E.; Acosta-Mesa, H.-G. A review on convolutional neural network encodings for neuroevolution. IEEE Trans. Evol. Comput. 2021, 26, 12–27. [Google Scholar] [CrossRef]
  28. Wang, P.; Chen, P.; Yuan, Y.; Liu, D.; Huang, Z.; Hou, X.; Cottrell, G. Understanding convolution for semantic segmentation. In Proceedings of the 2018 IEEE Winter Conference on Applications of Computer Vision (WACV), Lake Tahoe, NV, USA, 12–15 March 2018. [Google Scholar]
  29. Chen, Z.; Wang, Y.; Zhao, B.; Cheng, J.; Zhao, X.; Duan, Z. Knowledge graph completion: A review. IEEE Access 2020, 8, 192435–192456. [Google Scholar] [CrossRef]
  30. Jiang, D.; Wang, R.; Xue, L.; Yang, J. Multiview feature augmented neural network for knowledge graph embedding. Knowl.-Based Syst. 2022, 255, 109721. [Google Scholar] [CrossRef]
  31. Wang, J.; Zhang, Q.; Shi, F.; Li, D.; Cai, Y.; Wang, J.; Li, B.; Wang, X.; Zhang, Z.; Zheng, C. Knowledge graph embedding model with attention-based high-low level features interaction convolutional network. Inf. Process. Manag. 2023, 60, 103350. [Google Scholar] [CrossRef]
  32. Lu, X.; Wang, L.; Jiang, Z.; Liu, S.; Lin, J. MRE: A translational knowledge graph completion model based on multiple relation embedding. Math. Biosci. Eng. 2023, 20, 5881–5900. [Google Scholar] [CrossRef] [PubMed]
  33. Krichen, M.; Mihoub, A.; Alzahrani, M.Y.; Adoni, W.Y.H.; Nahhal, T. Are Formal Methods Applicable to Machine Learning and Artificial Intelligence? In Proceedings of the 2022 2nd International Conference of Smart Systems and Emerging Technologies (SMARTTECH), Riyadh, Saudi Arabia, 9–11 May 2022. [Google Scholar]
  34. Raman, R.; Gupta, N.; Jeppu, Y. Framework for Formal Verification of Machine Learning Based Complex System-of-Systems. Insight 2023, 26, 91–102. [Google Scholar] [CrossRef]
Figure 1. ConvMVD model flowchart.
Electronics 12 03099 g001
Figure 2. ConvMVD model drawing.
Electronics 12 03099 g002
Figure 3. Experimental results of link prediction under different datasets. (a) Experimental results of link prediction for FB15K-237 dataset. (b) Experimental results of link prediction for Hydraulic_eng dataset.
Electronics 12 03099 g003
Figure 4. Comparison of model performance results under different convolution.
Electronics 12 03099 g004
Figure 5. Comparison of model performance levels under different learning rates and batch sizes. (a) MRR index level. (b) Hits@10 index level. (c) Hits@3 index level. (d) Hits@1 index level.
Electronics 12 03099 g005
Figure 6. Effect of different embedding dimensions on Hydraulic_eng dataset.
Electronics 12 03099 g006
Table 1. Experimental hyperparameter setting.
DatasetLRBatch
Size
Embedding SizeInput DropoutFeature DropoutHidden Dropout
FB15K-2370.001643500.20.30.2
Hydraulic_eng0.001643500.20.30.2
Table 2. Experimental results of link prediction for FB15K-237 dataset.
MethodMRRHits@10Hits@3Hits@1
TransE0.2870.4750.3250.192
DistMult0.1780.3520.2040.092
ConvE0.3160.4910.3500.239
ConvR0.3500.5280.3850.261
InteractE0.3530.5410.3900.260
JointE0.3560.5430.3930.262
ConvMVD0.3630.5650.4210.236
Table 3. Experimental results of link prediction for Hydraulic_eng dataset.
MethodMRRHits@10Hits@3Hits@1
TransE0.0820.1670.0860.031
DistMult0.0730.1480.0740.025
ConvE0.3380.6510.3940.196
ConvR0.3170.6180.3730.179
InteractE0.3420.6550.4010.199
JointE0.3410.6550.400.198
ConvMVD0.3490.6650.4110.204
Table 4. Variance statistics of each model indicator for FB15K-237 dataset.
MethodMRRHits@10Hits@3Hits@1
TransE1.41 × 10−52.38 × 10−51.87 × 10−54.51 × 10⁻⁵
DistMult0.98 × 10−51.14 × 10−50.88 × 10−52.23 × 10⁻⁵
ConvE0.00140.00350.00180.0007
ConvR0.00210.01220.00410.0019
InteractE0.00160.00340.0020.0014
JointE0.0010.00520.00350.0023
ConvMVD0.00040.00140.00070.0001
Table 5. Variance statistics of each model indicator for Hydraulic_eng dataset.
MethodMRRHits@10Hits@3Hits@1
TransE0.00020.00090.00023.41 × 10−5
DistMult0.00010.00060.00011.61 × 10−5
ConvE0.00300.00790.00470.0017
ConvR0.00460.01430.00690.0022
InteractE0.00310.00780.00490.0018
JointE0.00360.00890.00560.0020
ConvMVD0.00220.00570.00360.0012
Disclaimer/Publisher’s Note: The statements, opinions and data contained in all publications are solely those of the individual author(s) and contributor(s) and not of MDPI and/or the editor(s). MDPI and/or the editor(s) disclaim responsibility for any injury to people or property resulting from any ideas, methods, instructions or products referred to in the content.