Article

Multi-Beam Luneburg Lens with Reduced Size Patch Antenna

by
Norsaidah Muhamad Nadzir
1,*,
Mohamed Himdi
2,
Mohamad Kamal A. Rahim
1,
Noor Asniza Murad
1,
Osman Ayop
1 and
Olivier Lafond
2
1
Faculty of Electrical Engineering, Universiti Teknologi Malaysia, Johor Bahru 81310, Malaysia
2
Institut d’Electronique et des Technologies du numeRique (IETR), Université de Rennes, 35000 Rennes, France
*
Author to whom correspondence should be addressed.
Electronics 2023, 12(14), 3028; https://doi.org/10.3390/electronics12143028
Submission received: 1 June 2023 / Revised: 3 July 2023 / Accepted: 8 July 2023 / Published: 10 July 2023

Abstract

:
This paper describes the integration of a plate Luneburg lens with a microstrip patch antenna (MPA) with a complementary split ring resonator (CSRR) at 17 GHz frequency. The main advantage of the method is the compact size of the optimized MPA with CSRR such that the radiation pattern of the antennas successfully overlaps at −3 dB. The overlapping is achieved by positioning multiple MPA with CSRR structures around the plate Luneburg lens with 0.408λ distance between the elements. To test the performance of the lens, CST simulations are carried out using a classical WR62 open-ended waveguide to feed the structure, then adding more waveguides rotated at focal points of the lens. After that, the waveguide is substituted with the MPA with CSRR structure. The superiority of the proposed method over the conventional waveguide or regular patch antenna is confirmed by an overlap in radiation pattern at −3 dB with a narrow beamwidth of 10.9°.

1. Introduction

A microstrip patch antenna (MPA) [1,2] is often used in wireless communication systems despite its drawbacks such as narrow bandwidth and low gain. However, it is still one of the popular choices due to its benefits such as lightweight, low profile, and easy to design and fabricate. There are numerous techniques to improve or increase the performance of the antenna by changing the structure in terms of adding parasitic components or removing parts of the antenna with slots [3,4]. By changing the structure of the radiating element, the benefits of utilizing MPA might retain; however, some parameters might suffer such as the efficiency and gain of the antenna. To make up for the drawbacks, patch antennas are also often transformed to or integrated with other structures such as phased arrays or lenses to achieve directivity for beam-scanning and beam-shaping capabilities [5,6,7,8,9,10]. However, these solutions only allow for scanning the beam over a limited angle.
To address this issue, a Luneburg lens is considered. The Luneburg lens is a spherically symmetric gradient-index lens that focuses beams from opposing sources in any direction. Furthermore, it is known to have an infinite focal point, making it easier to steer the beam to any desired direction by moving only the source rather than the entire structure, as is the case with a parabolic dish antenna. Some Luneburg lens work involves the use of waveguides as the feeder for wideband performance [11,12,13]. In addition, the lens’s spherically symmetric structure enables the use of multiple feeds positioned in different directions, as opposed to parabolic reflectors, which only allow for limited feeds within a narrow region of optical axis. Additionally, the lens is typically made of dielectric materials, making it less expensive than lens structures that utilize active elements.
On that note, Luneburg lenses are also used to achieve beamforming. One of the most desirable characteristics of beamforming is that a transmitter and a receiver can communicate directly. In wireless communication, this correlates to greater connection and overall network performance, as measured by more stable and dependable connectivity and faster data transmission. The Luneburg lens can attain these feats by concentrating electromagnetic waves from more than one source in a single beam, hence expanding a signal’s travel potential. Plus, beamforming decreases frequency interferences from surrounding electromagnetic radiation from other sources because the transmissions are directed toward a defined and targeted location. Consequently, beamforming structures using a Luneburg lens are becoming popular due to their low fabrication cost, simple structure, and wide-angle beam maneuverability. Previous works [13,14,15] demonstrate that by concurrently feeding the lens with many sources, there is a chance to overlap the beams, making it wider and possibly shaping the beam to a desired beam width. To utilize the Luneburg lens efficiently, however, the feeding antenna needs to be small enough to have a good beam recovery [16,17,18,19,20].
In this paper, a plate Luneburg lens based on [8] is designed to achieve a narrow beam (10°) in H-plane and a wide beam (30°) in E-plane at 17 GHz. The first part describes the theory and design of the Luneburg lens. The simulation of the lens fed by a WR62 waveguide is presented. Next, the design and characteristics of the MPA with CSRR structure is explained. Finally, the measurement results of the lens fed by the MPA with CSRR structure are compared with the simulation results.

2. Antenna Developments

2.1. Luneburg Lens

The Luneburg lens is one of the inhomogeneous lenses which are based on a specific gradient index law [21]. The lens has a refractive index which follows the equation where ε r   stands for the permittivity and r stands for the radius of the lens:
n r = ε r = 2 r 2 ,
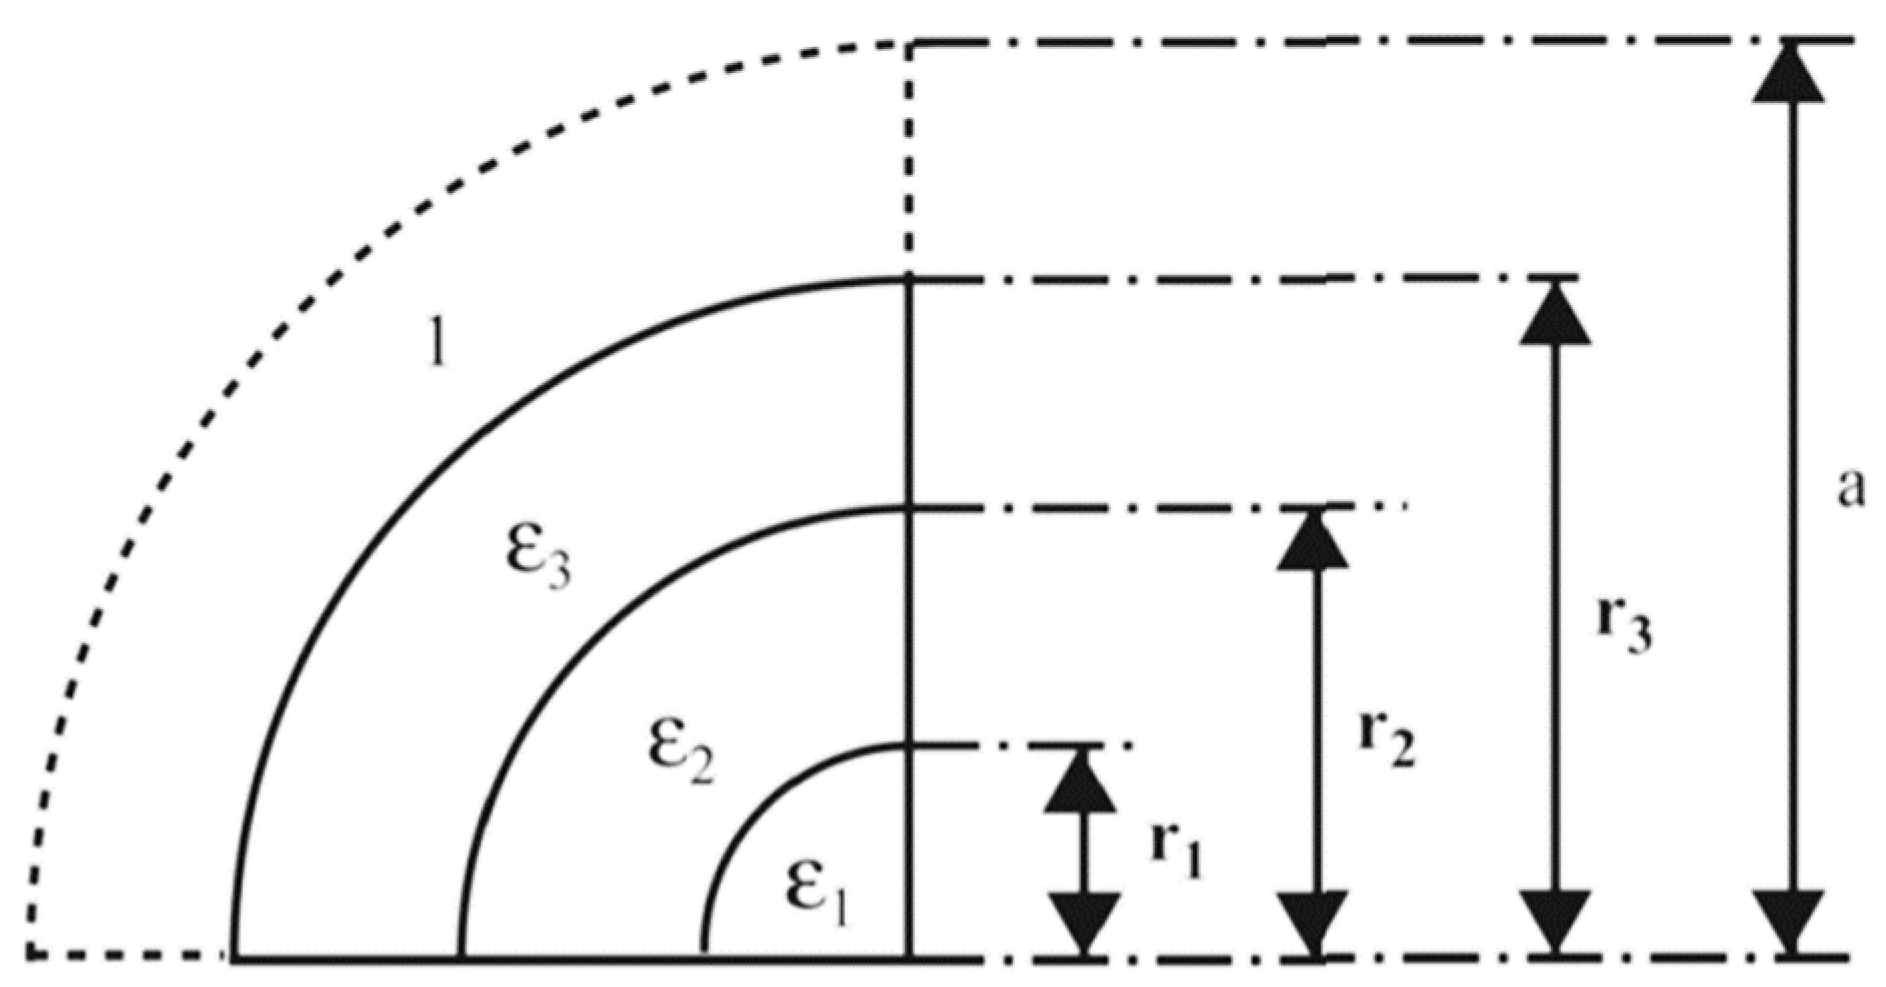
This law causes a particular ray tracing into the lens as shown in Figure 1. With the specific gradient index law, a focused beam can be obtained by controlling the phase passing through the lens. This lens is more commonly used compared to the other inhomogeneous lenses including Maxwell’s fish-eye lens and the Mikaelian lens due to its infinite focal points which offer an opportunity to achieve wide beam-scanning antenna. To develop a lens that closely follows the refractive index law, the lens is considered to have multiple different crowns with specific dielectric constant and radius as described in [17] and presented in Figure 2.
The radius and permittivity of the crowns can be obtained using the formula obtained from [10] below where N is the number of crowns:
M = 1 2 × N + 1 ,
ε i = 2 2 i 1 M ,
r i = 2 ε i + M
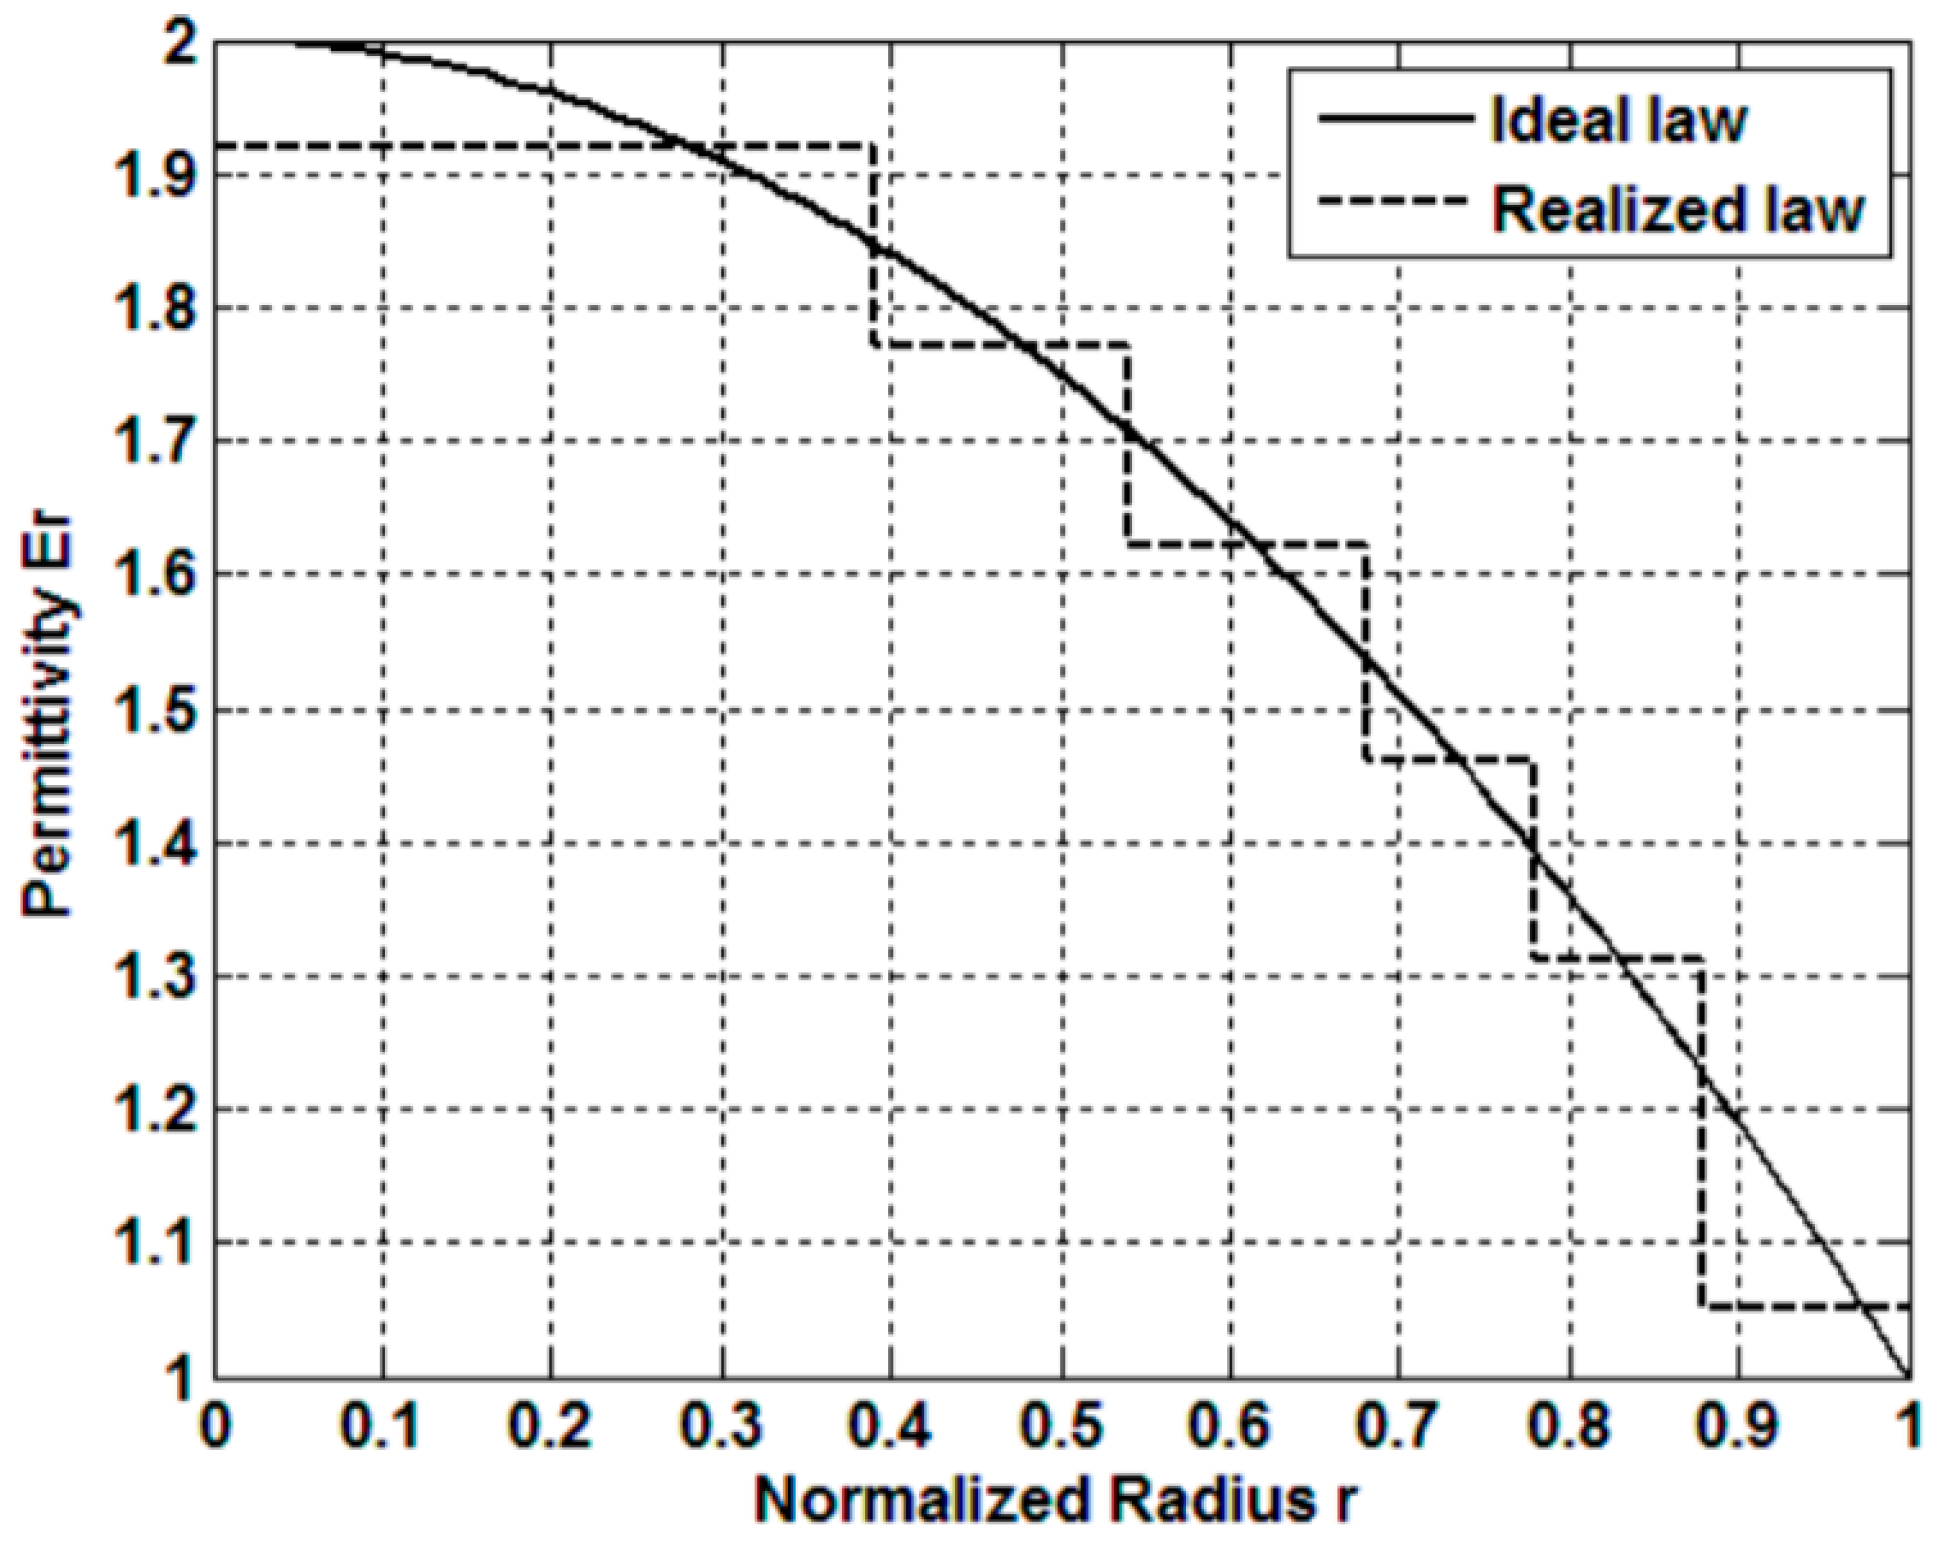
By following this equation, the theoretical and reconstructed index law inside the lens is shown in Figure 3 for the case of six crowns.
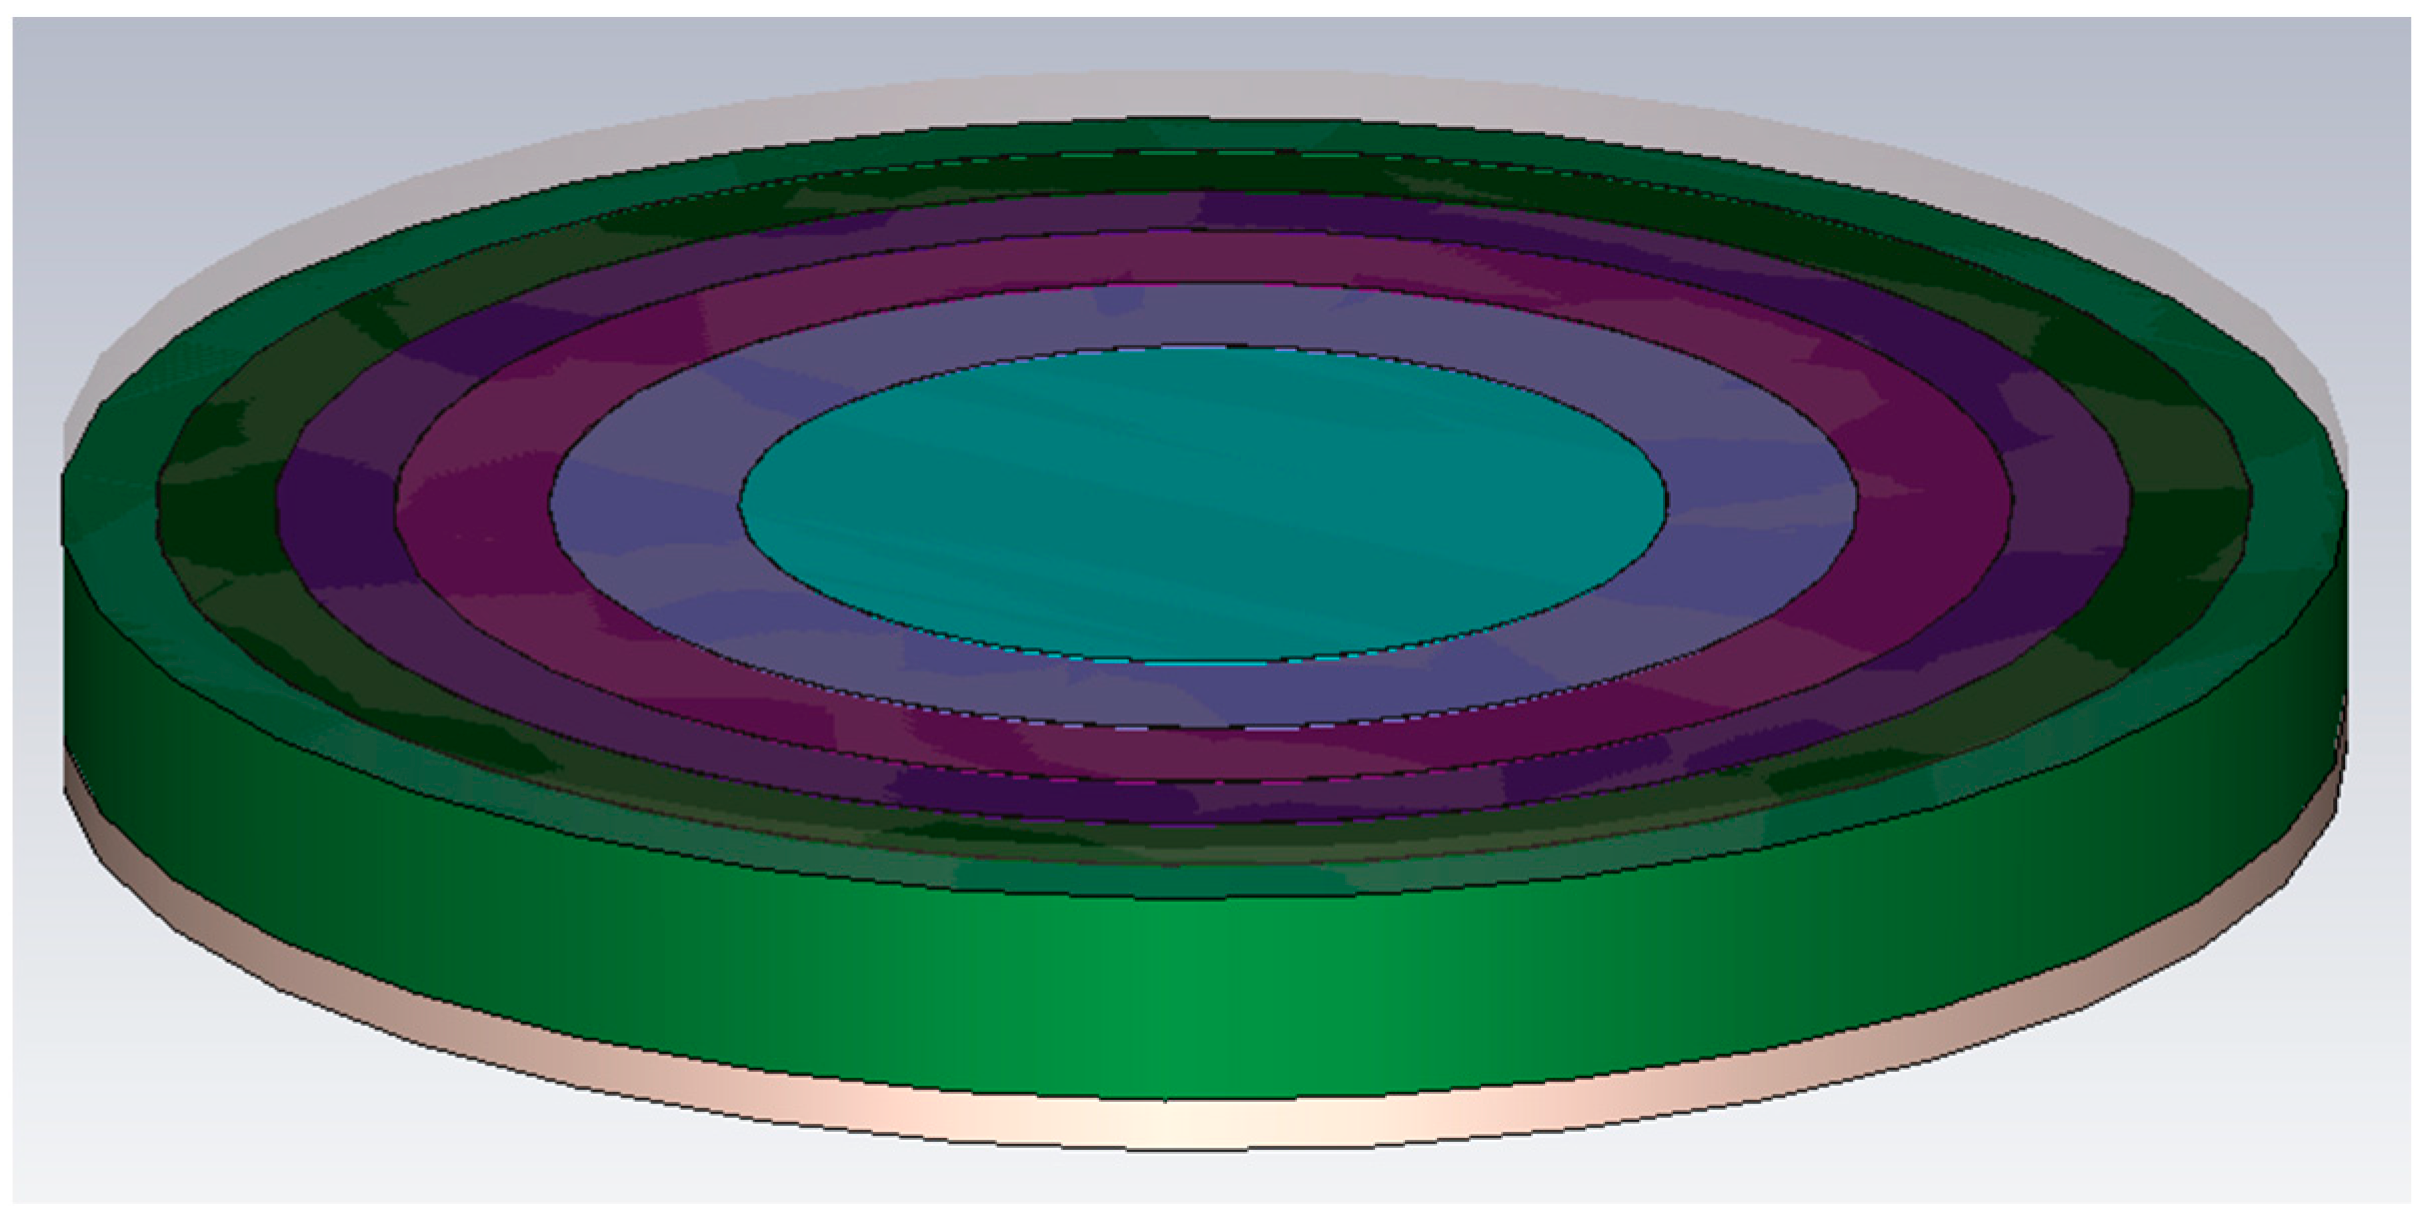
In this paper, the lens is designed to achieve a narrow beamwidth in H-plane (10°) at 17 GHz. The plate Luneburg lens is optimized with six crowns with a diameter of 90 mm and a thickness of 8 mm. The value of the permittivity of each layer is deduced from the realized law shown previously in Figure 3. Next, Figure 4 shows the simulation model of the plate Luneburg lens using CST software. The lens is placed between two metallic plates with a height of 2 mm each.

2.2. Luneburg Lens with WR62 Waveguide

A Luneburg lens has an infinite number of focal points which offer the opportunity for a wide range of beam scanning by feeding the lens sequentially via several feeders. Plus, it is also possible to achieve a beamforming feature by feeding the lens simultaneously [18].
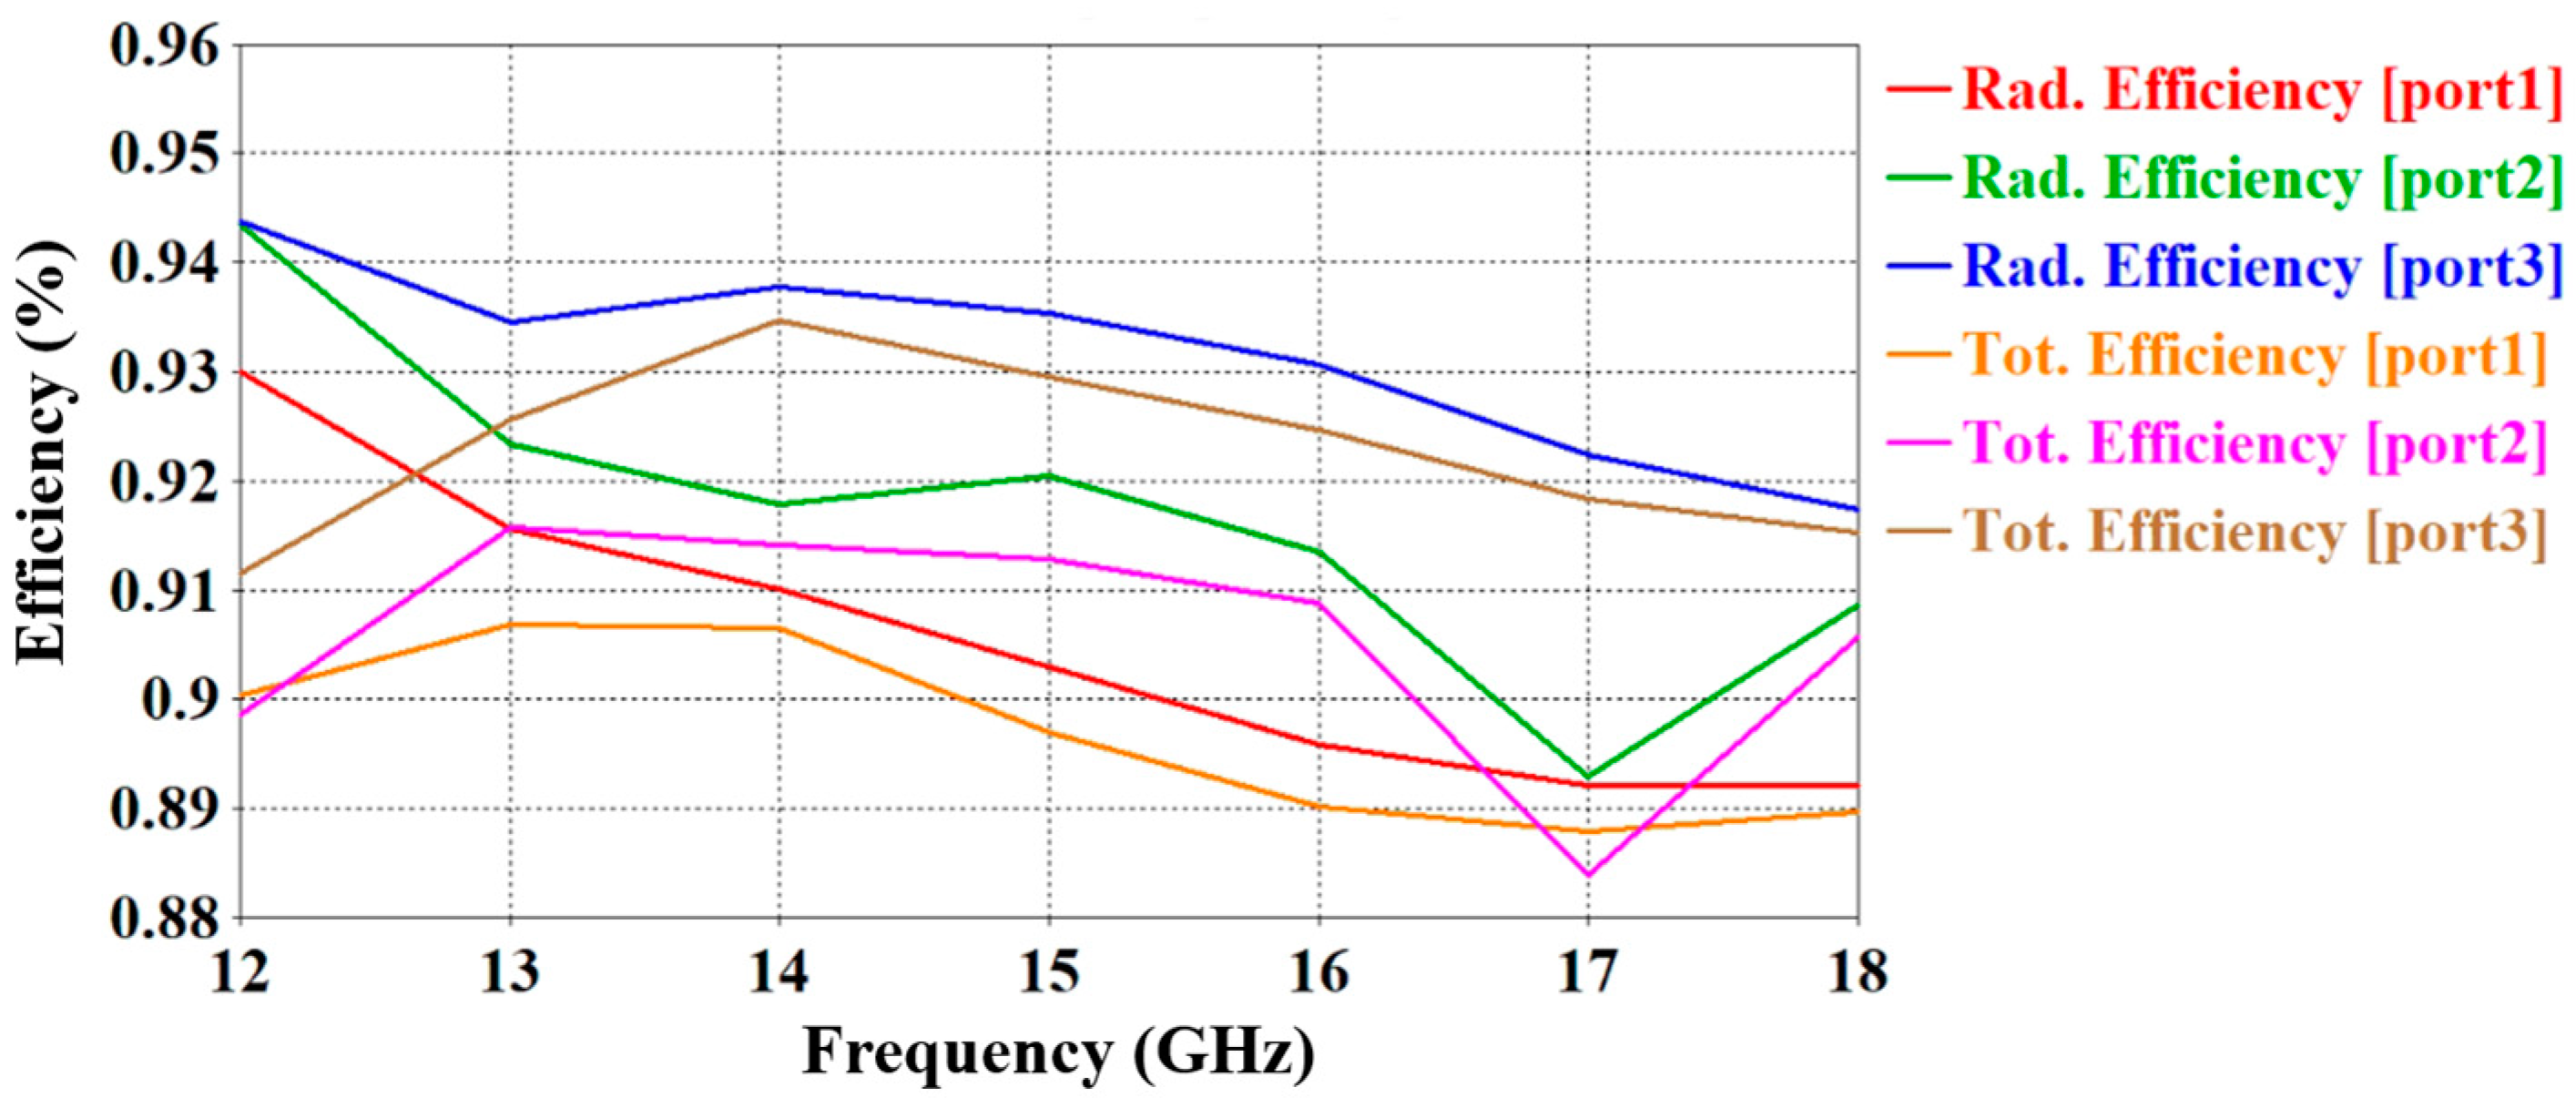
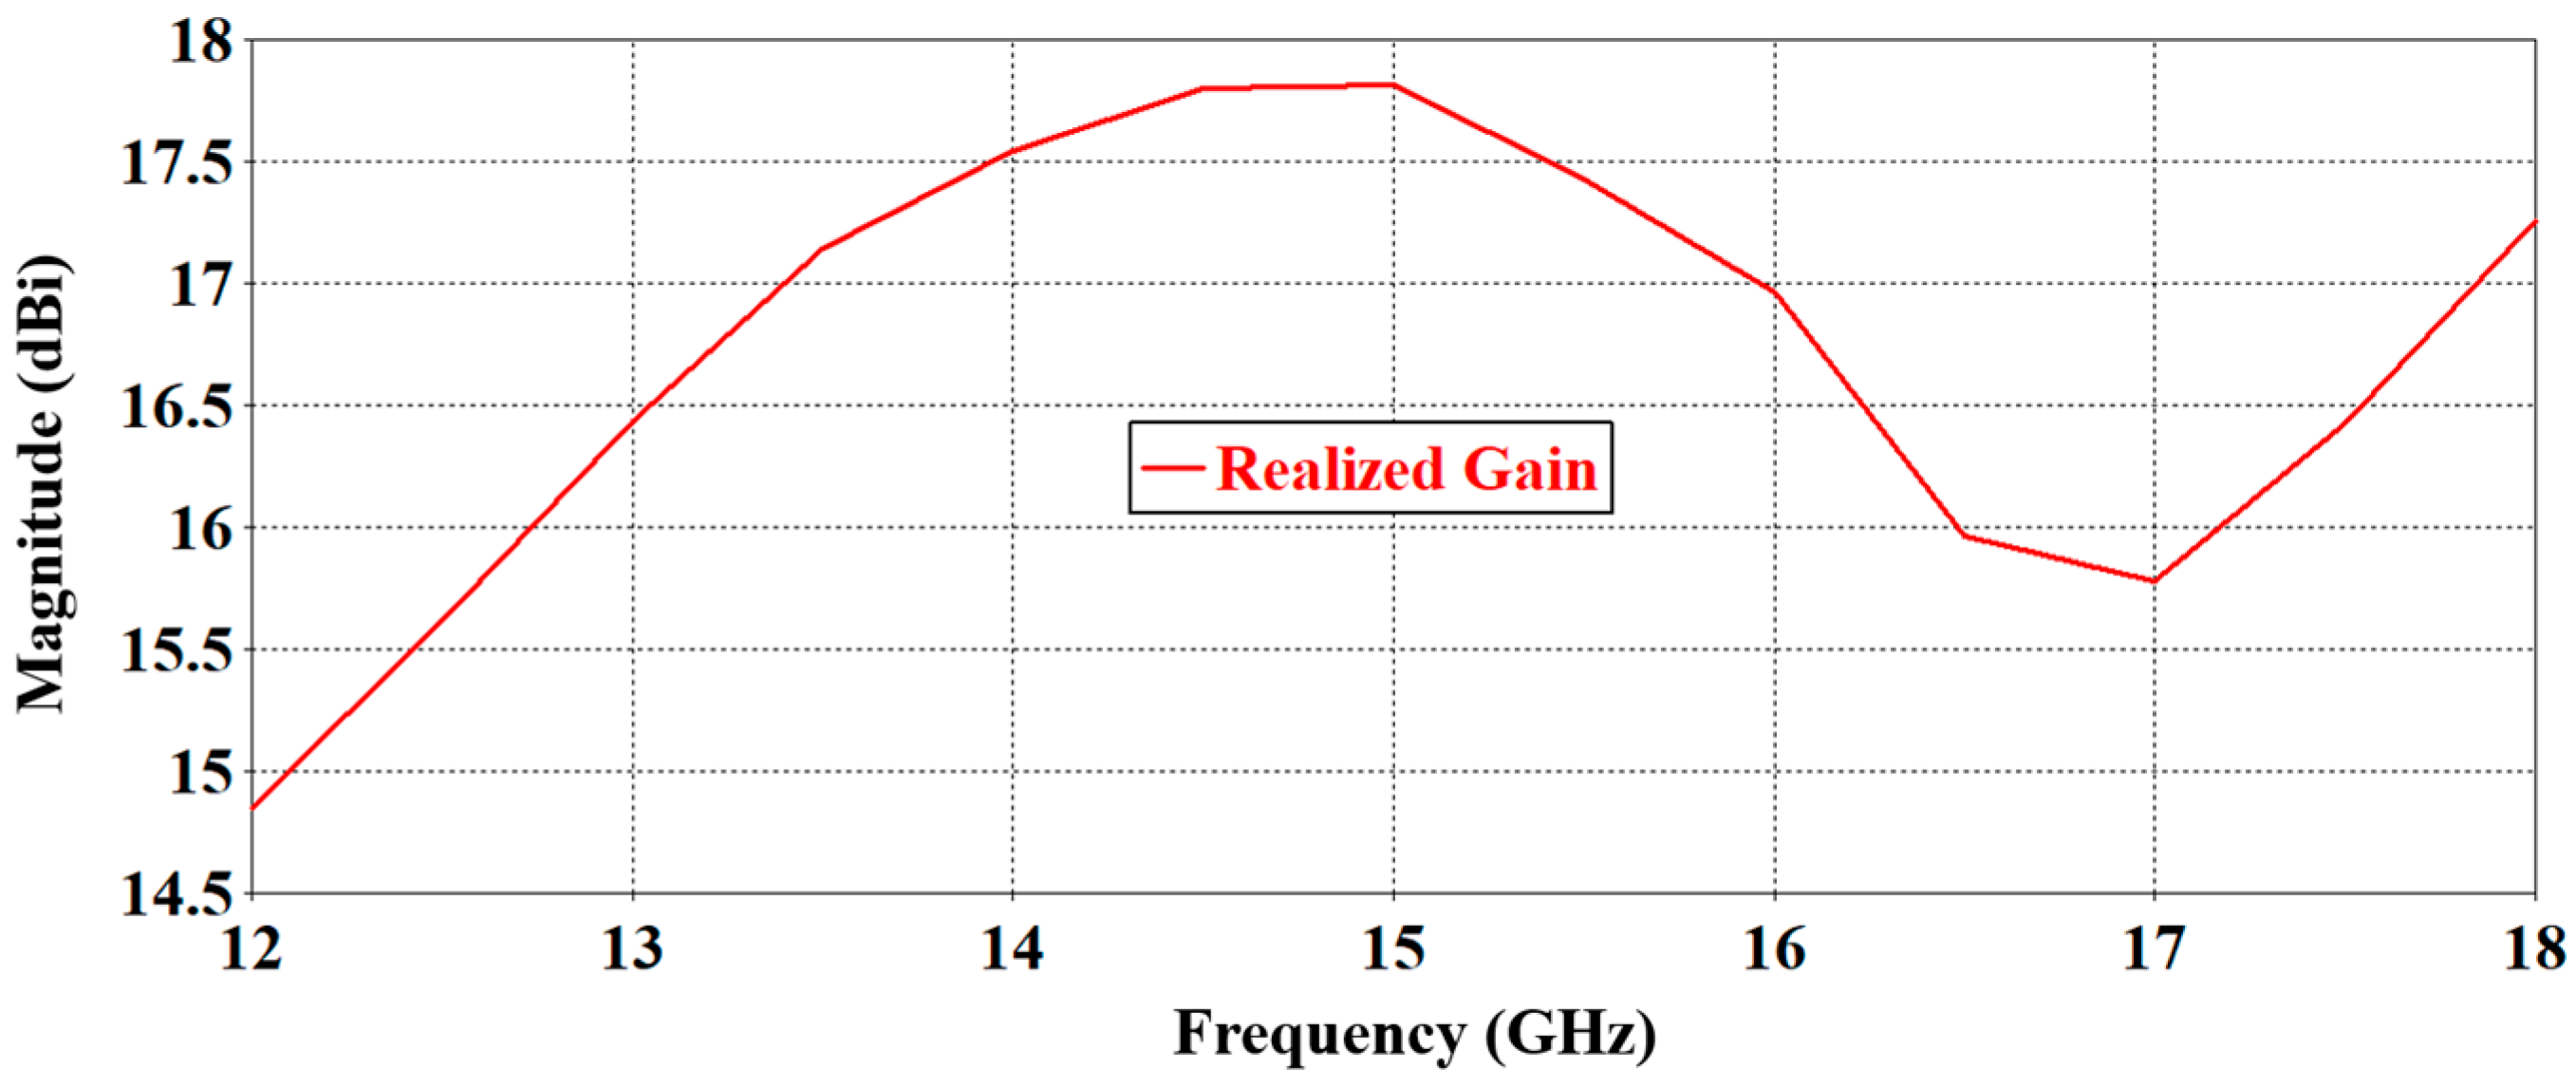
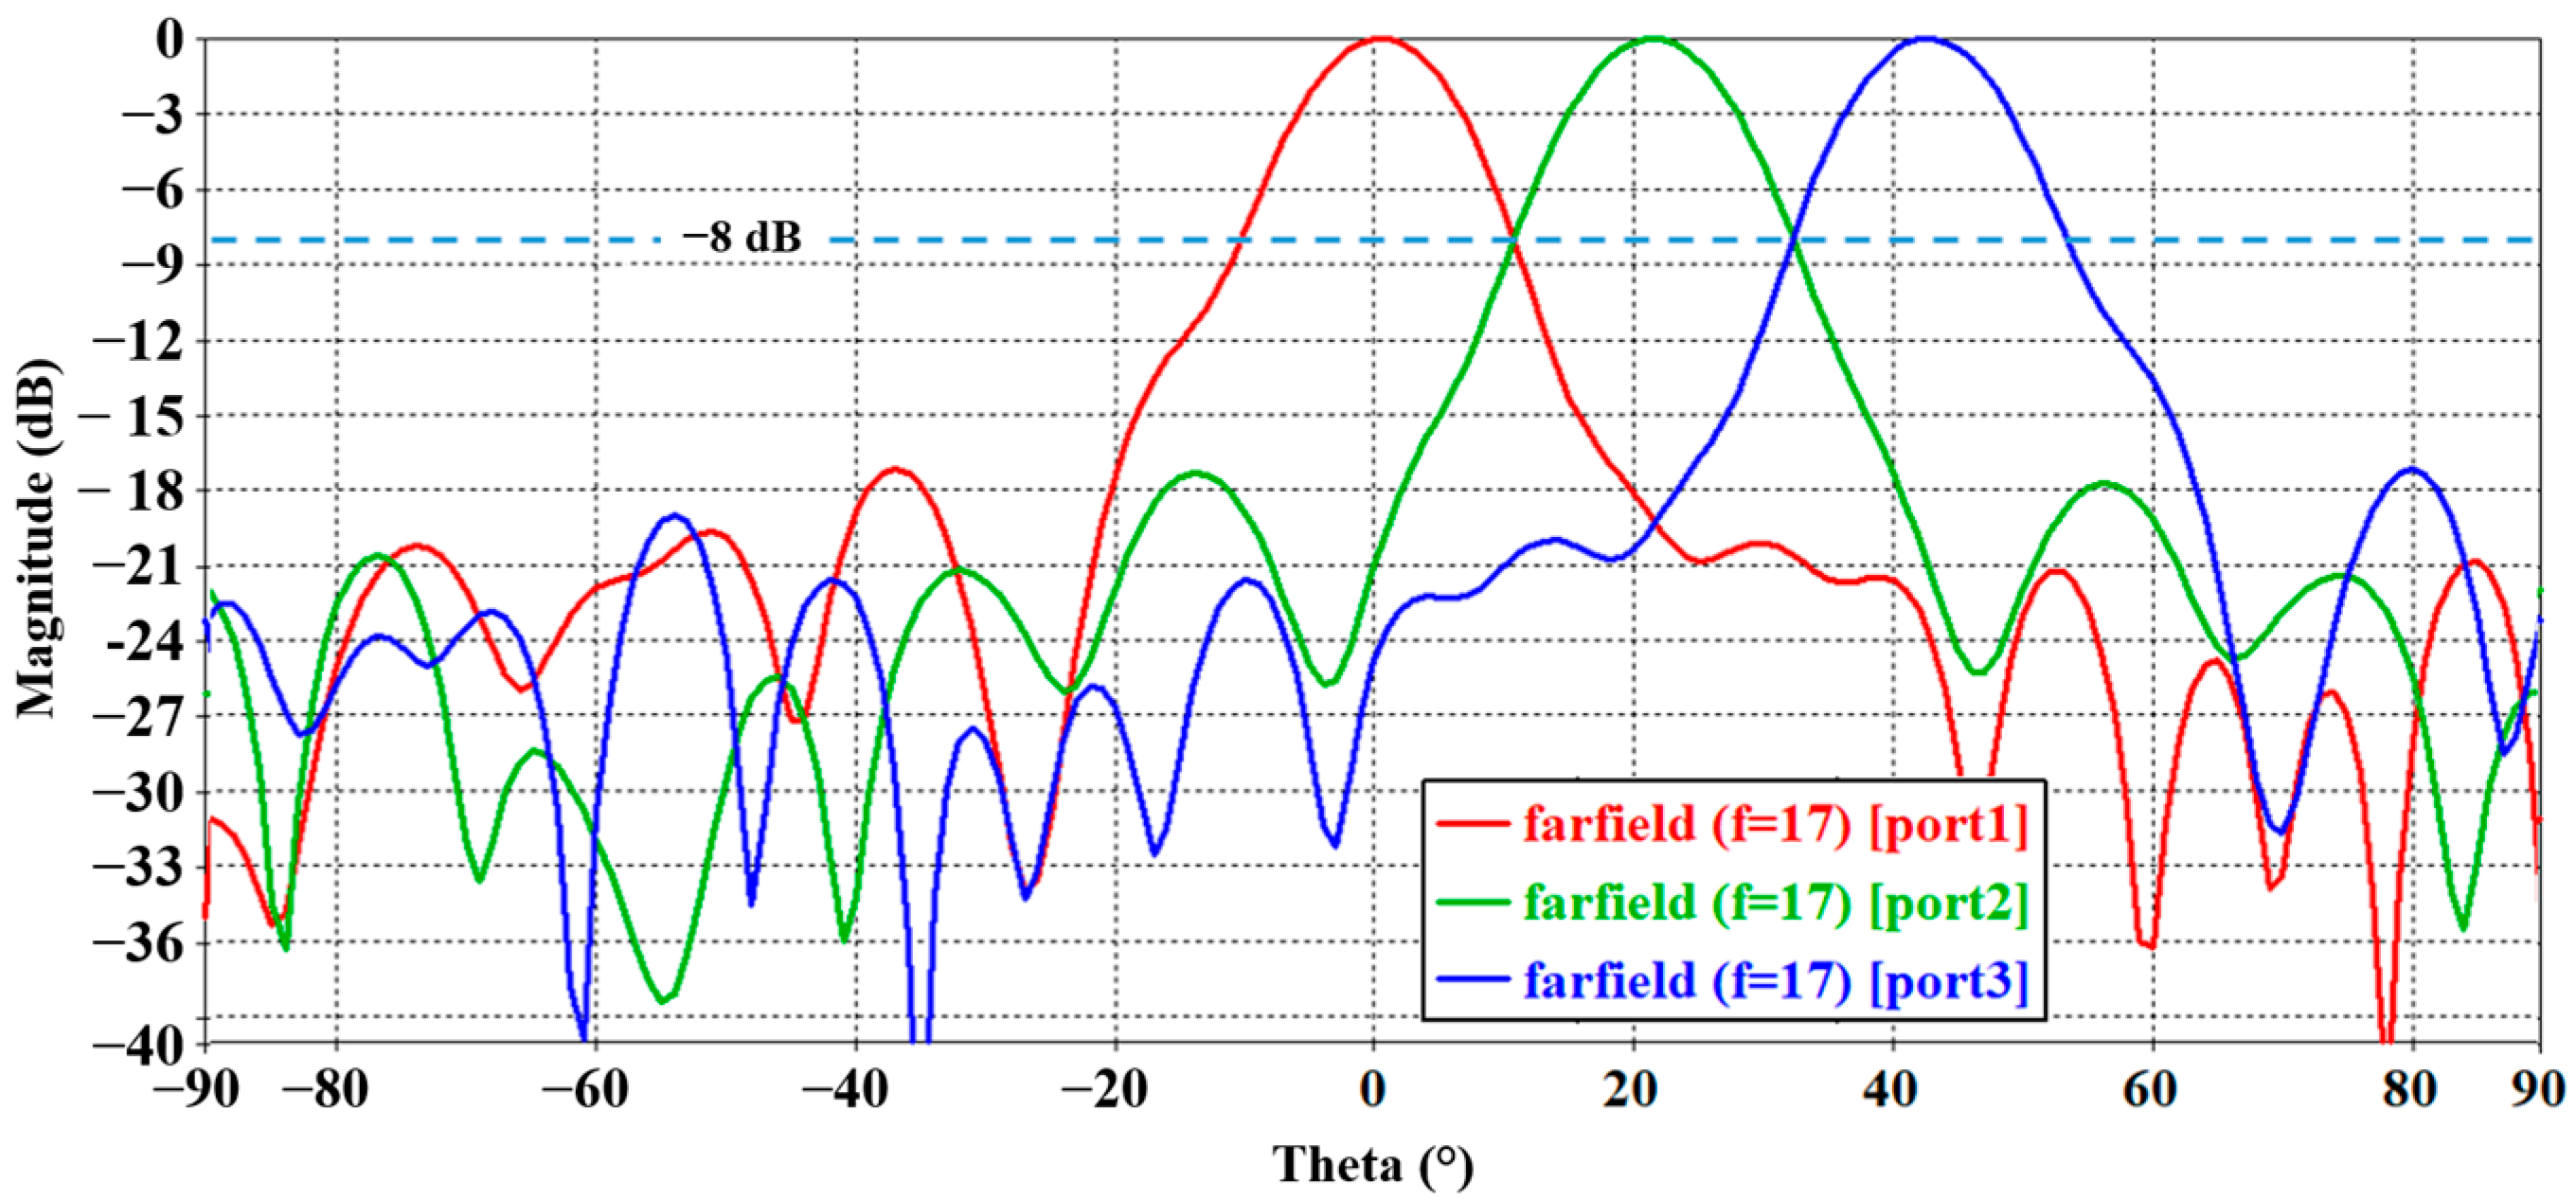
To start, the Luneburg lens is fed by a classical open-ended WR62 waveguide with the size of 16 mm × 8 mm. To attempt beam recovery, the number of open-ended waveguides is increased to three and their position is set so that they are next to each other and rotated around the y-axis, perpendicular to the center of the lens. Figure 5 shows the simulation model of the lens fed by three waveguides in CST software. From the simulation, the structure achieved 16.56 dB directivity, 16.67 dB gain, and >80% total efficiency, as shown in Figure 6 and Figure 7. The radiation pattern of the Luneburg lens fed by three WR62 waveguide structures at 17 GHz is shown in Figure 8. From the graph, the beams only manage to overlap at −8 dB at H-plane. The highest side lobe level is at −17 dB, indicating that no other beam was produced from coupling or another parasitic element.
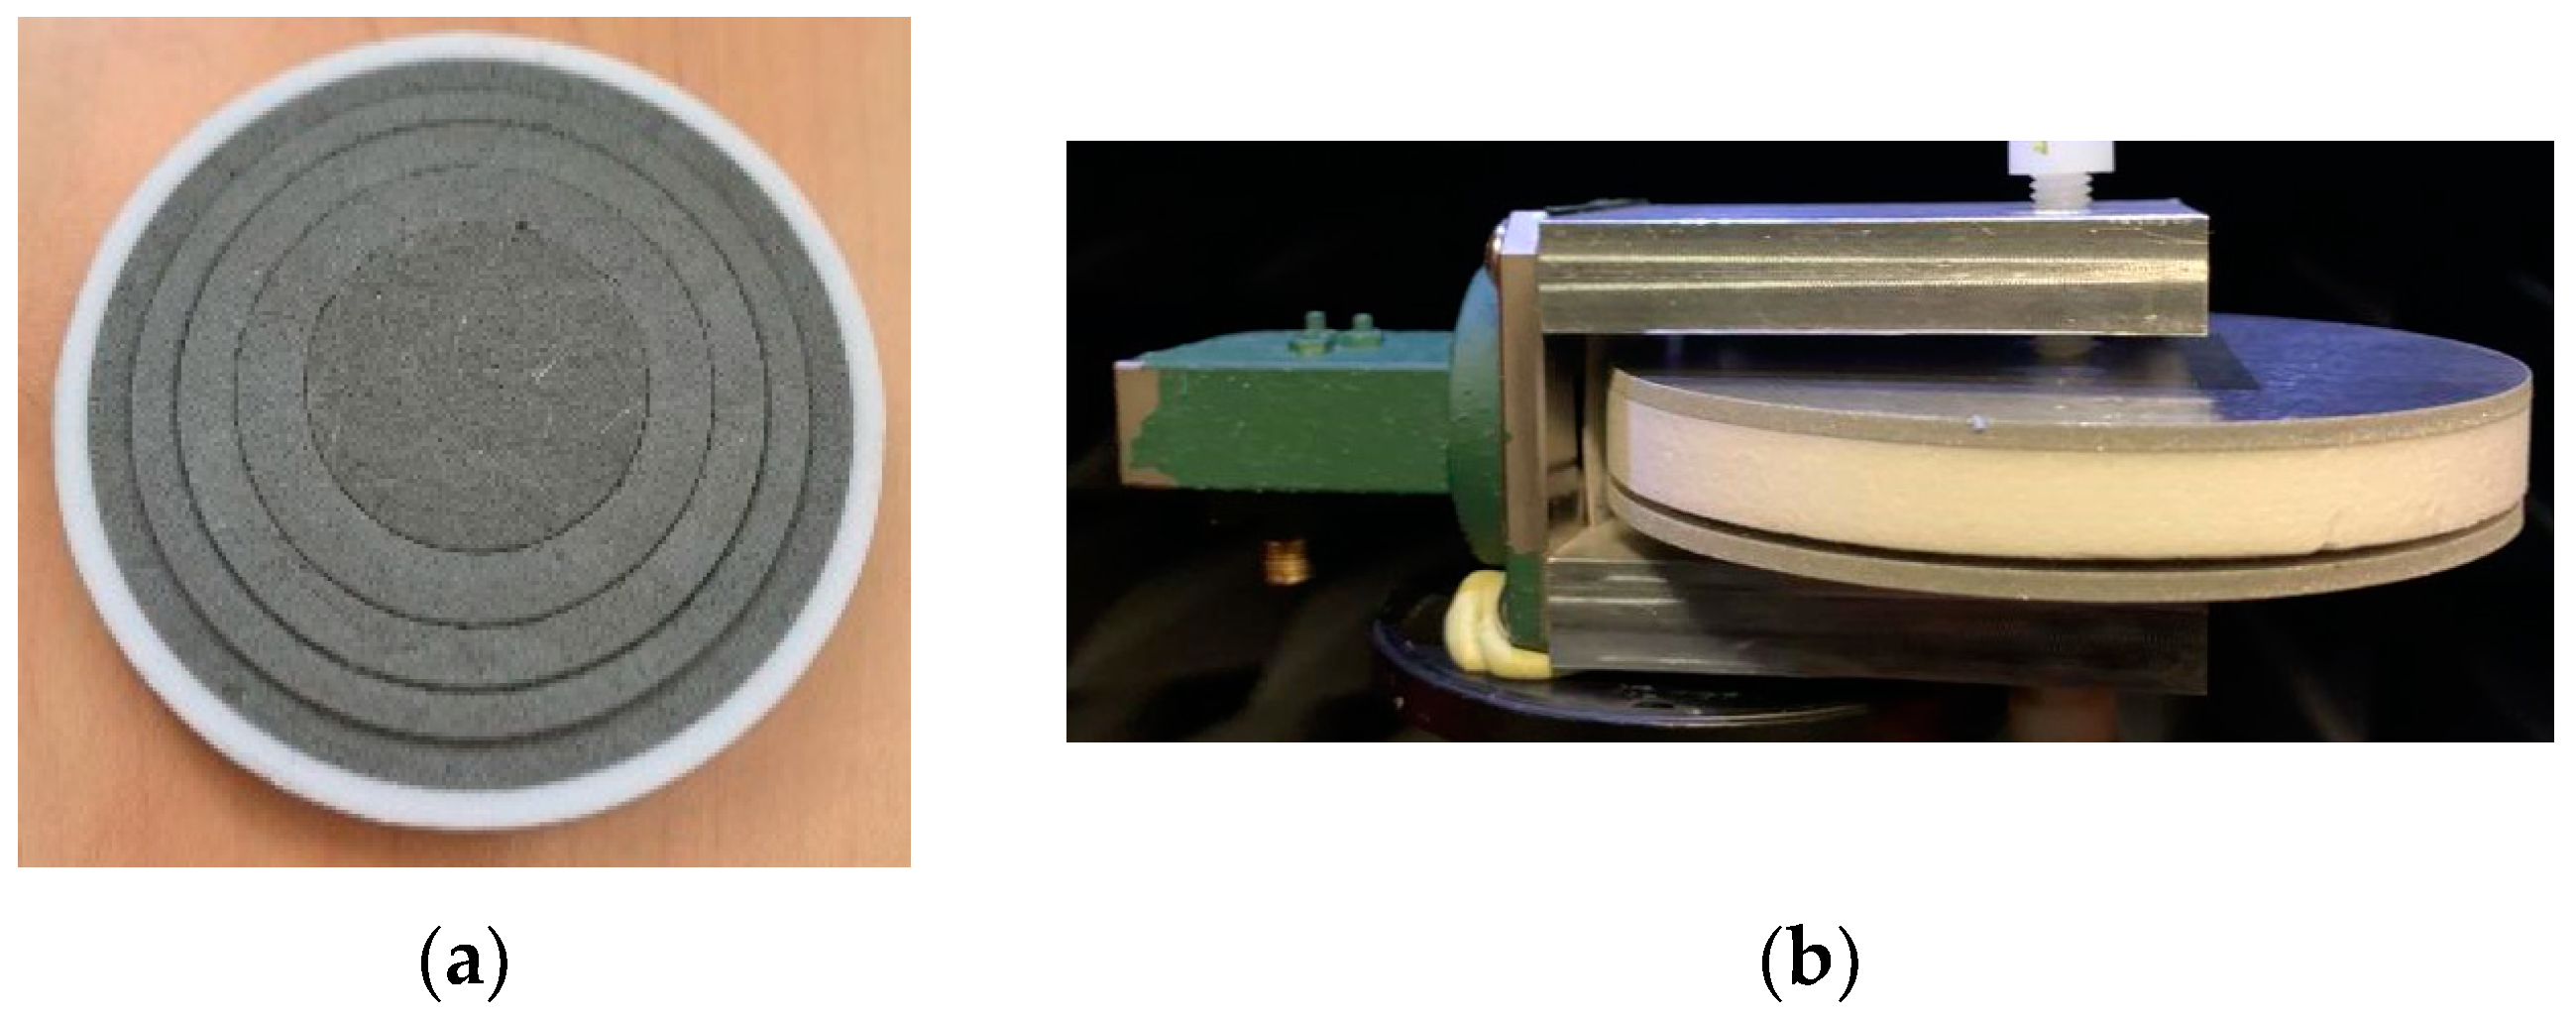
To prove the concept, the Luneburg lens is fabricated as shown in Figure 9, with an innovative technological process detailed in [11]. The Luneburg lens is placed in between two metal plates and fed by a waveguide with the size of 16 mm × 8 mm. The measurement process is performed using a StarLab reverberation chamber.
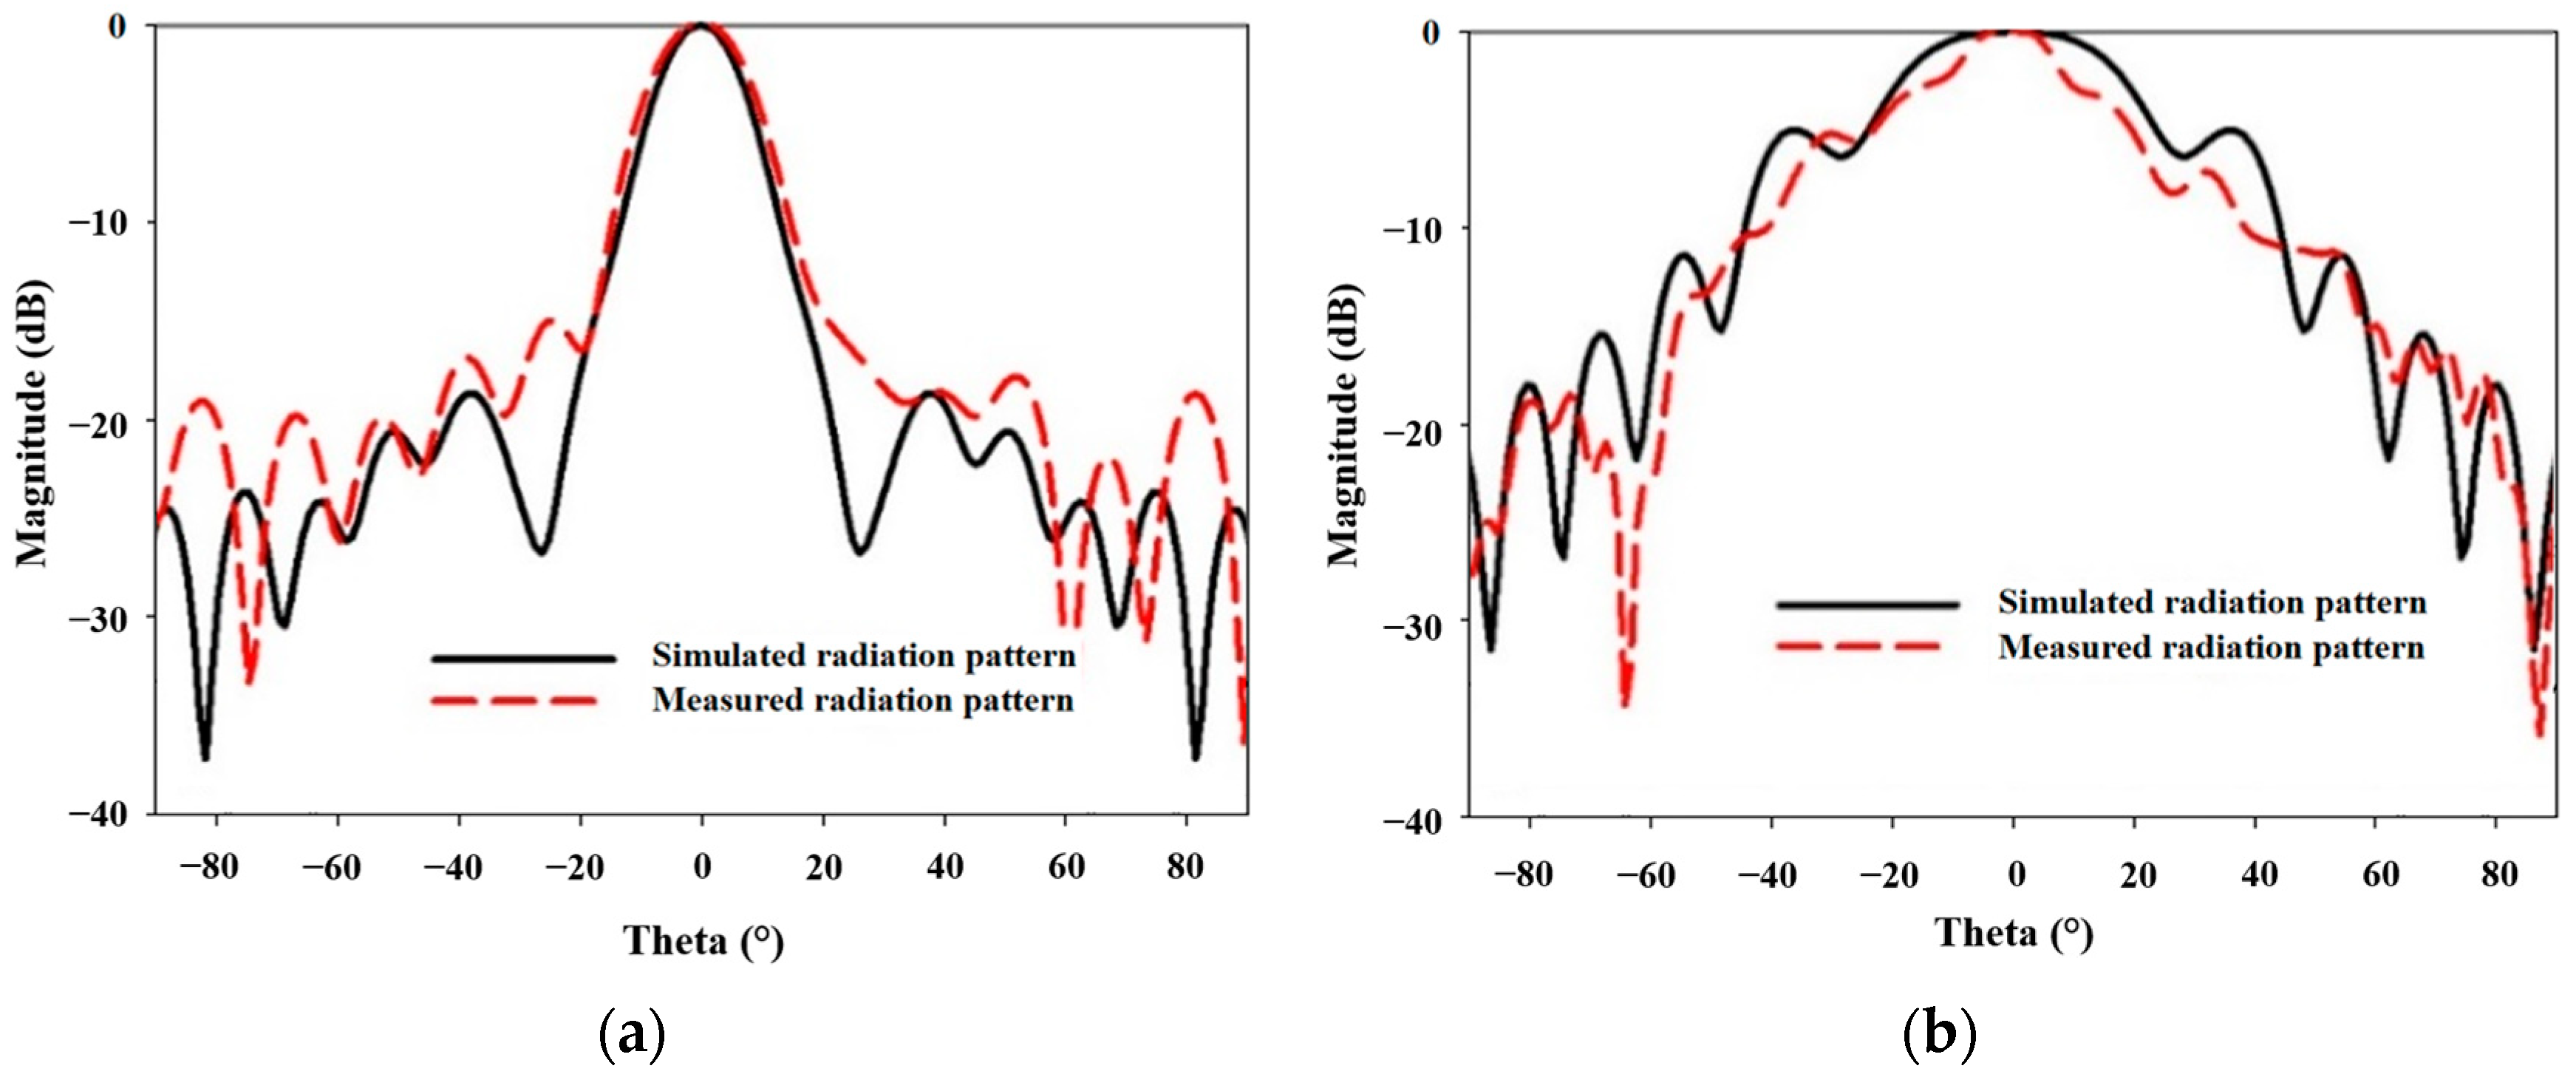
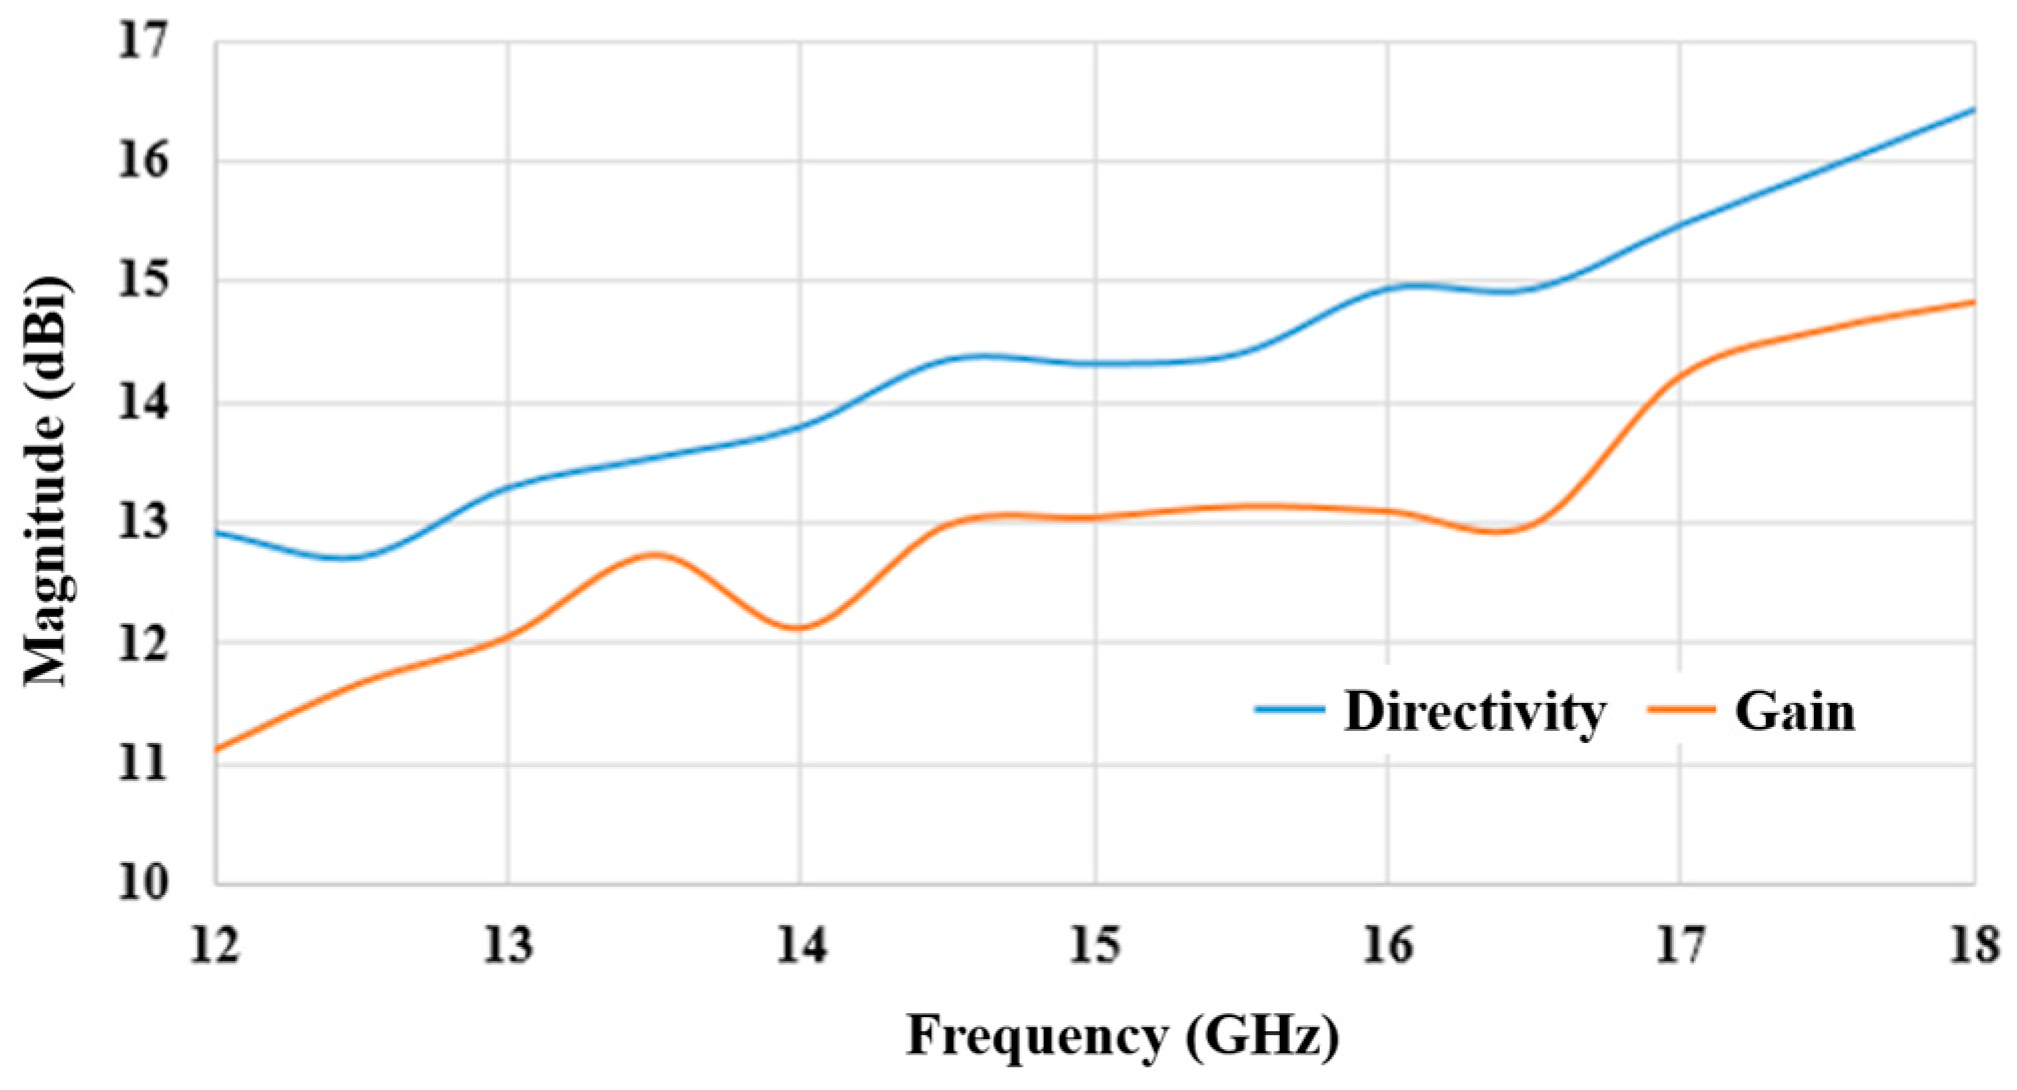
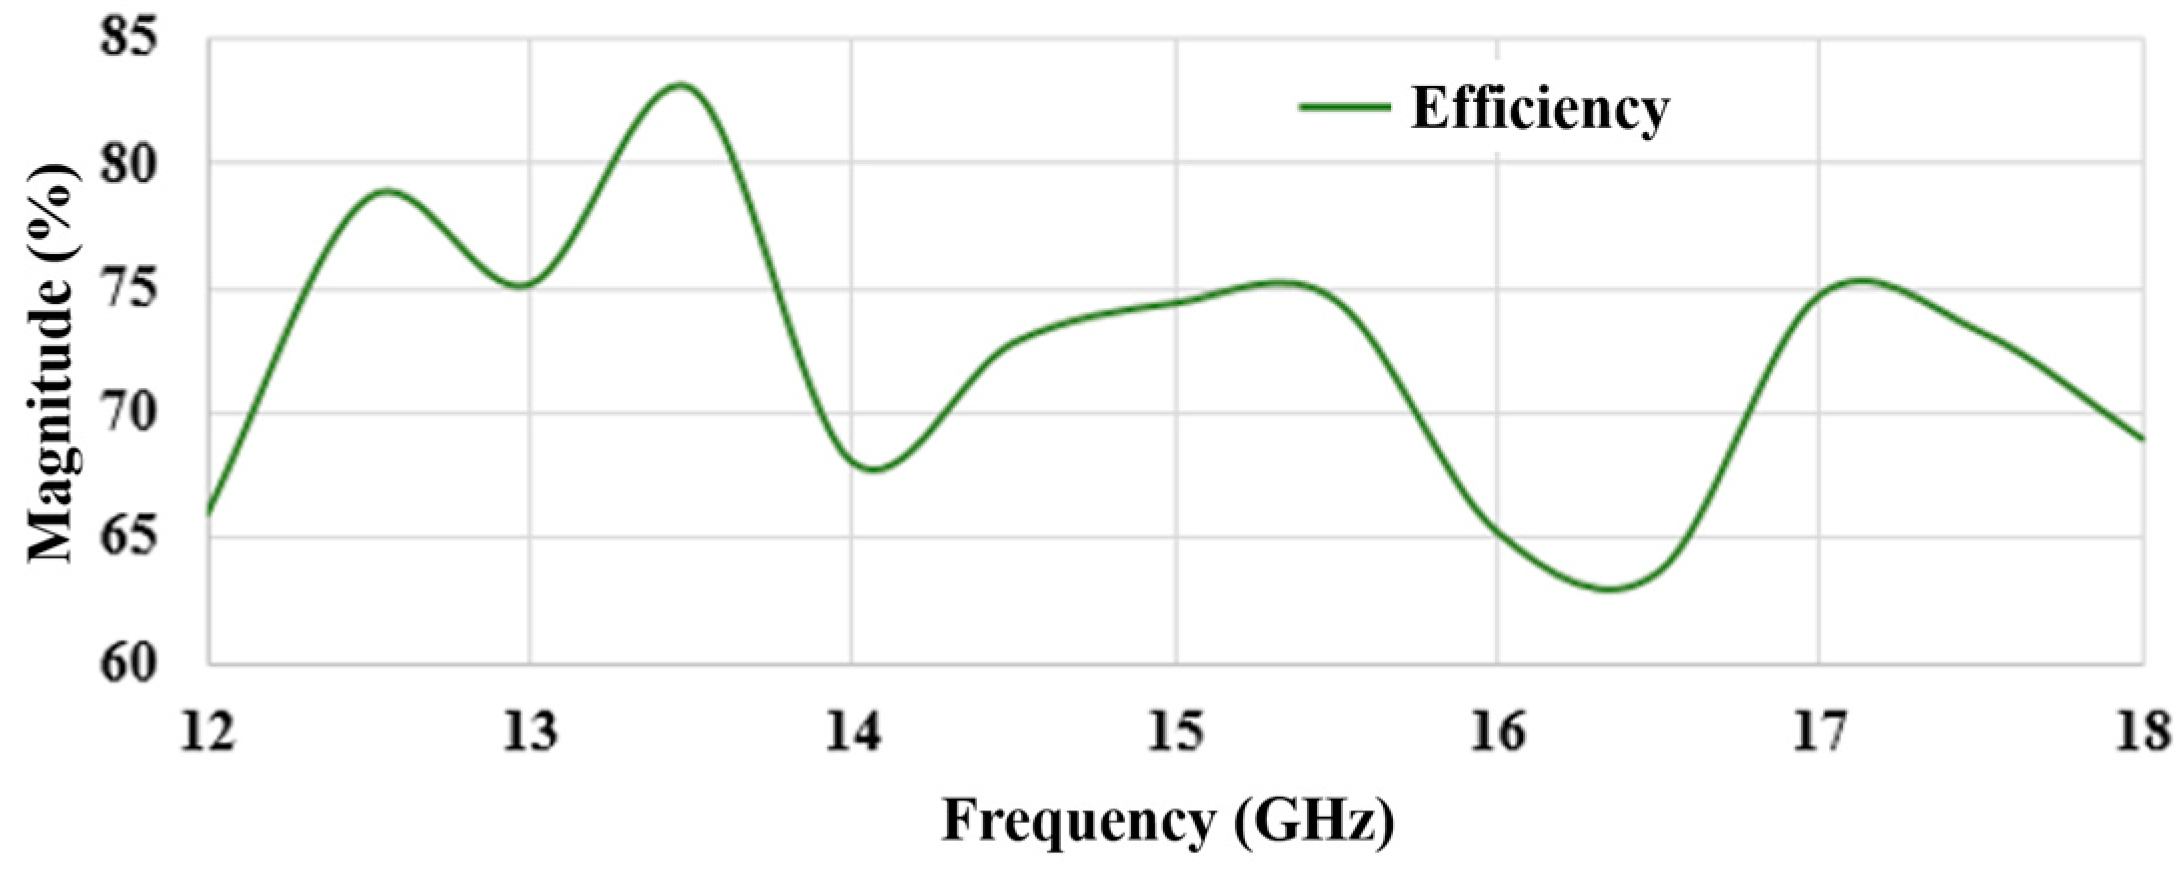
The comparison between the simulated and measured radiation pattern at H-plane for 17 GHz frequency is shown in Figure 10a. The black solid line represents the simulated result, and the red dashed line represents the measured result. From the graph, the result shows good agreement with 4° difference between the simulated and measured beam width at −3 dB at H-plane. Figure 10b shows the comparison between the simulated and measured radiation pattern at E-plane at 17 GHz. The measured result shows that the structure achieved 15.47 dB directivity, 14.2 dB gain, and 75% efficiency. The comparison between simulated and measured gain and efficiency is shown in Figure 11 and Figure 12.
Even though beam recovery at 17 GHz is impossible by feeding the developed plate Luneburg lens with a WR62 waveguide, the lens successfully focused the beam, ensuring the desired beamwidth was achieved.

2.3. Equation for Beam Overlap in Plate Luneburg Lens

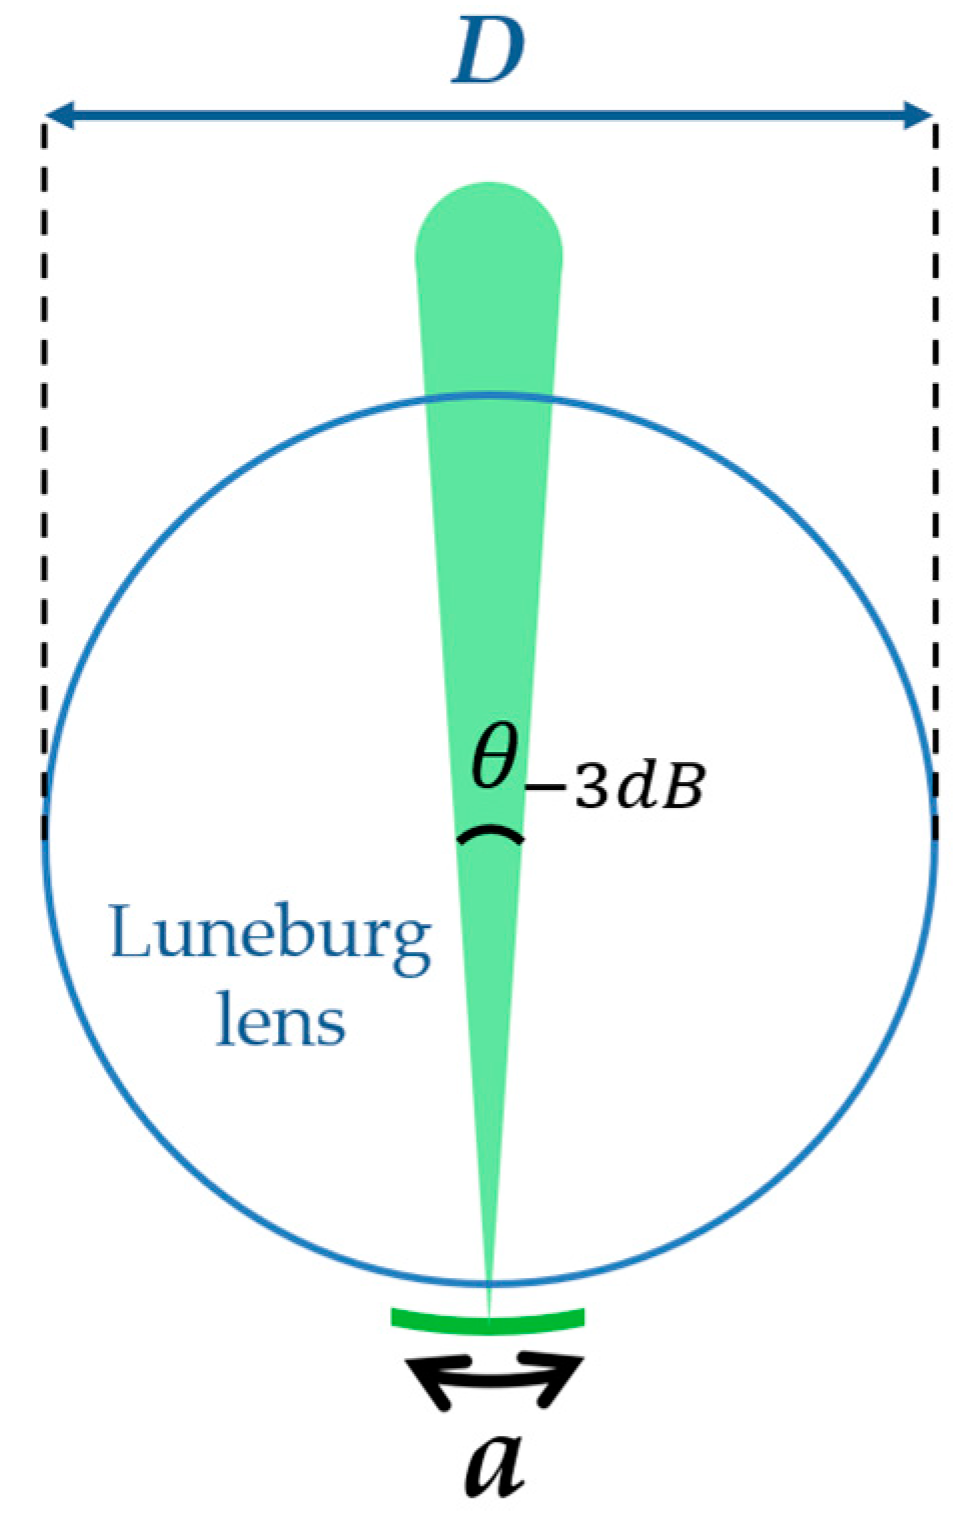
To attain −3 dB beam overlap, the width of the source antenna feeding the Luneburg lens is crucial; thus, in this part, the justification on the size of the feeder antenna is discussed. First, Figure 13 shows the top view of a plate Luneburg lens with diameter, D , being fed by a feeder antenna with width, a , and the desired output beamwidth, θ 3 d B . The desired 3 dB beamwidth can be calculated approximately using this formula obtained from [20]:
θ 3 d B 50 λ D
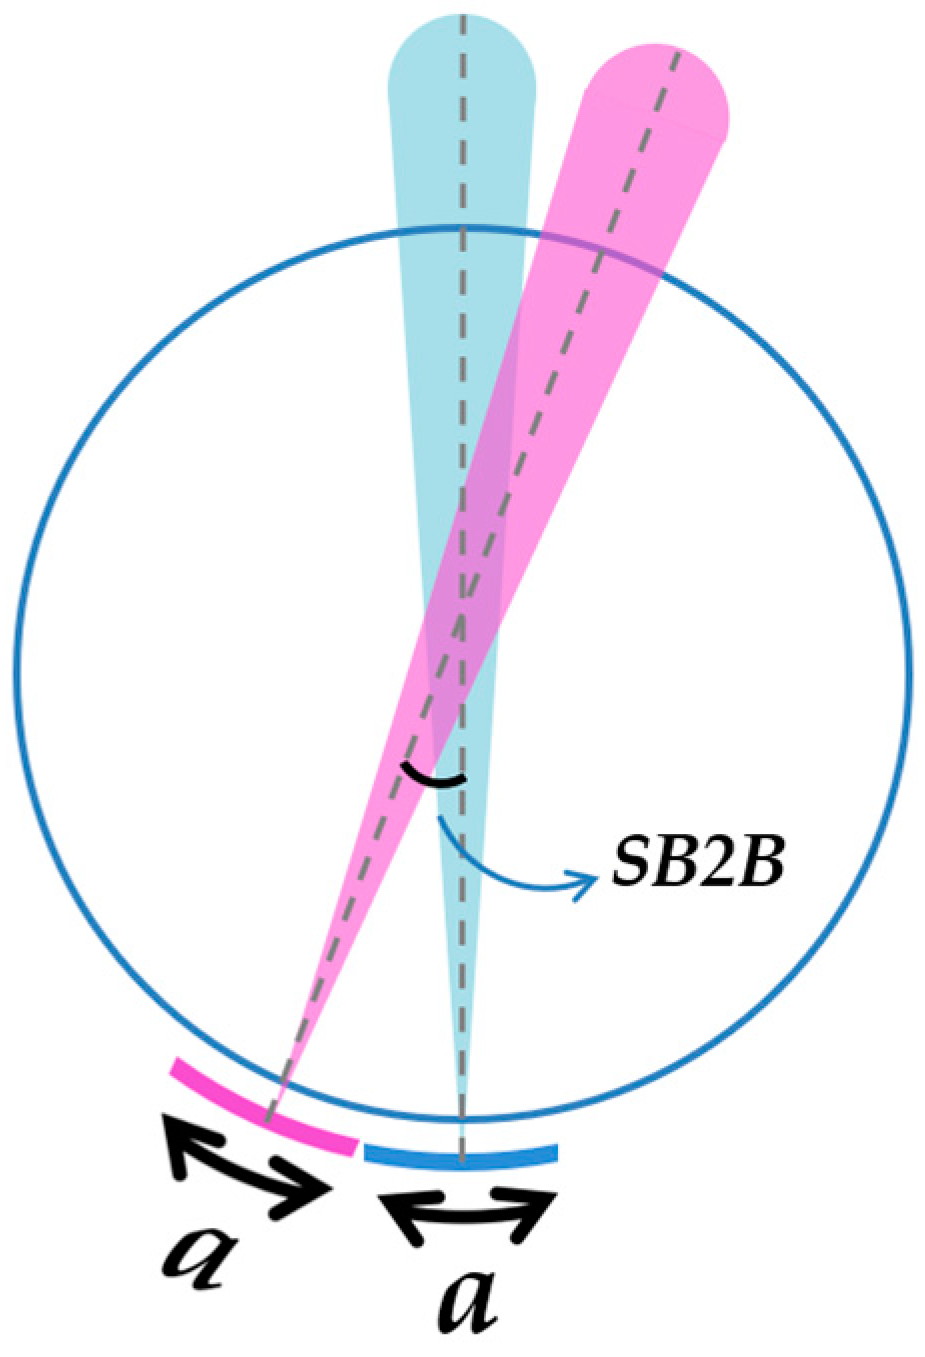
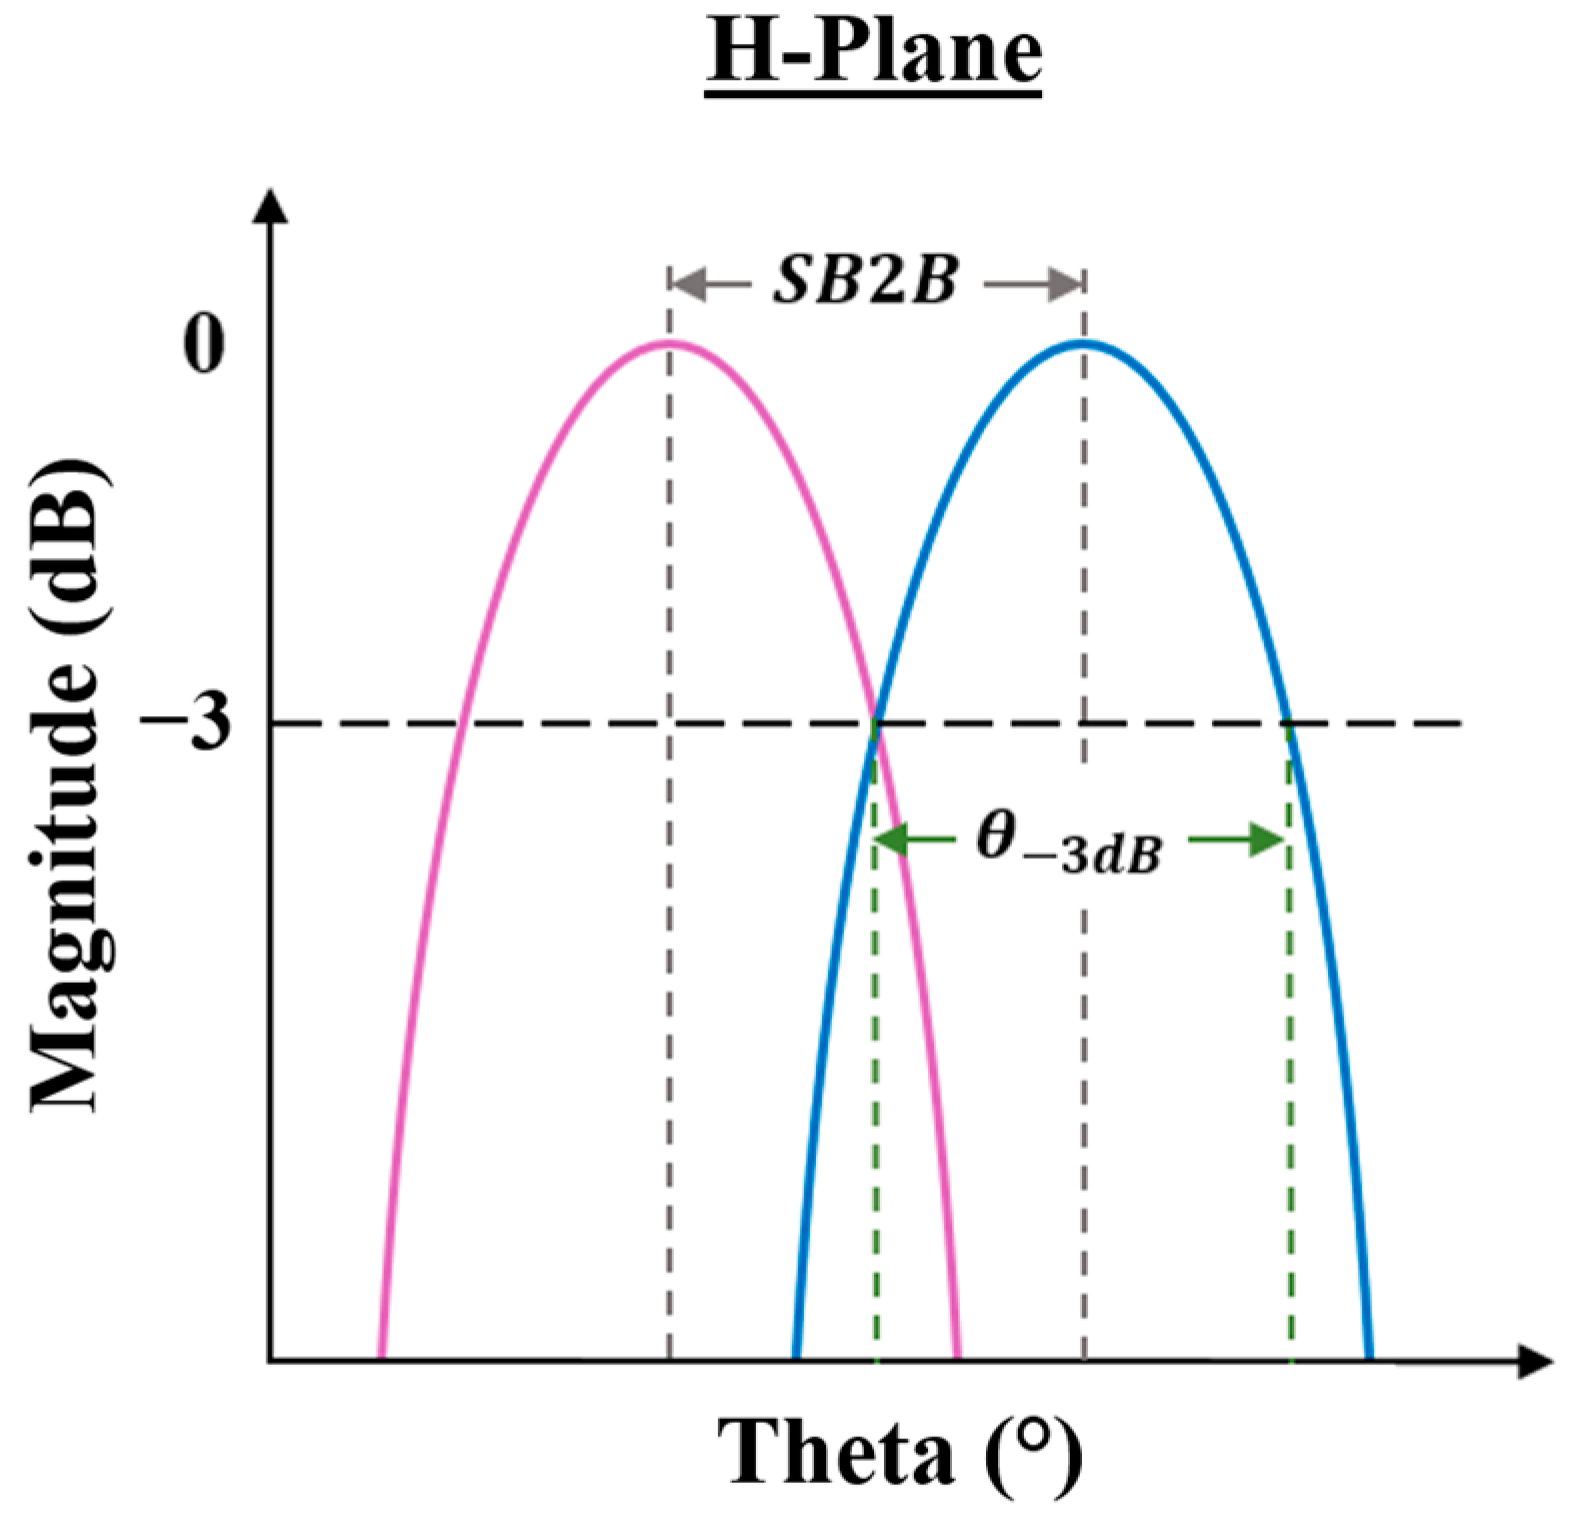
By defining the desired beamwidth, the value of D is deduced. Next, Figure 14 shows the Luneburg lens fed by two antennas rotated to the center point of the lens. To achieve beam overlap, the second feeder antenna needs to be rotated to a minimum angle so that the distance between the two structures is touching but not intersecting with each other. This angle between the feeder structures with width, a, is denoted as the separation between two beams ( S B 2 B ).
Geometrically, the maximum number of antennas, N m a x , with width, a, feeding the lens is equal to the circumference of the lens:
N m a x a = π D
N m a x could also be denoted with the angle of a full circle with diameter, D, divided by the desired beamwidth, θ 3 d B :
N m a x = 360 ° θ 3 d B
From (6) and (7),
360 ° θ 3 d B = π D a
θ 3 d B = a × 360 ° π D
Now, if the overlap of beam at −3 dB at H-plane is desired, the value of S B 2 B must be less or equal to the value of θ 3 d B as depicted in Figure 15.
To achieve overlapping beam at −3 dB, assume S B 2 B = θ 3 d B   and the maximum value of the width of the antenna, a m a x , is deduced as follows:
a m a x = θ 3 d B × π D 360 °  
Substituting Equation (5) into Equation (10):
a m a x π × 50 × λ 360 °
Formula (11) is tested by feeding a 17 GHz Luneburg lens with a compact microstrip patch antenna. The simulation process and result of the development of the beam-focusing structure are described in the next part.

2.4. Luneburg Lens with MPA with CSRR

To successfully have the radiation pattern overlap at −3 dB at 17 GHz frequency, a compact microstrip patch antenna is designed with CST software to feed the developed Luneburg lens. The antennas are designed using substrate RT5880 with permittivity, ε r = 2.2, dissipation factor of tan σ = 0.0009, and thickness of h = 0.508 mm.
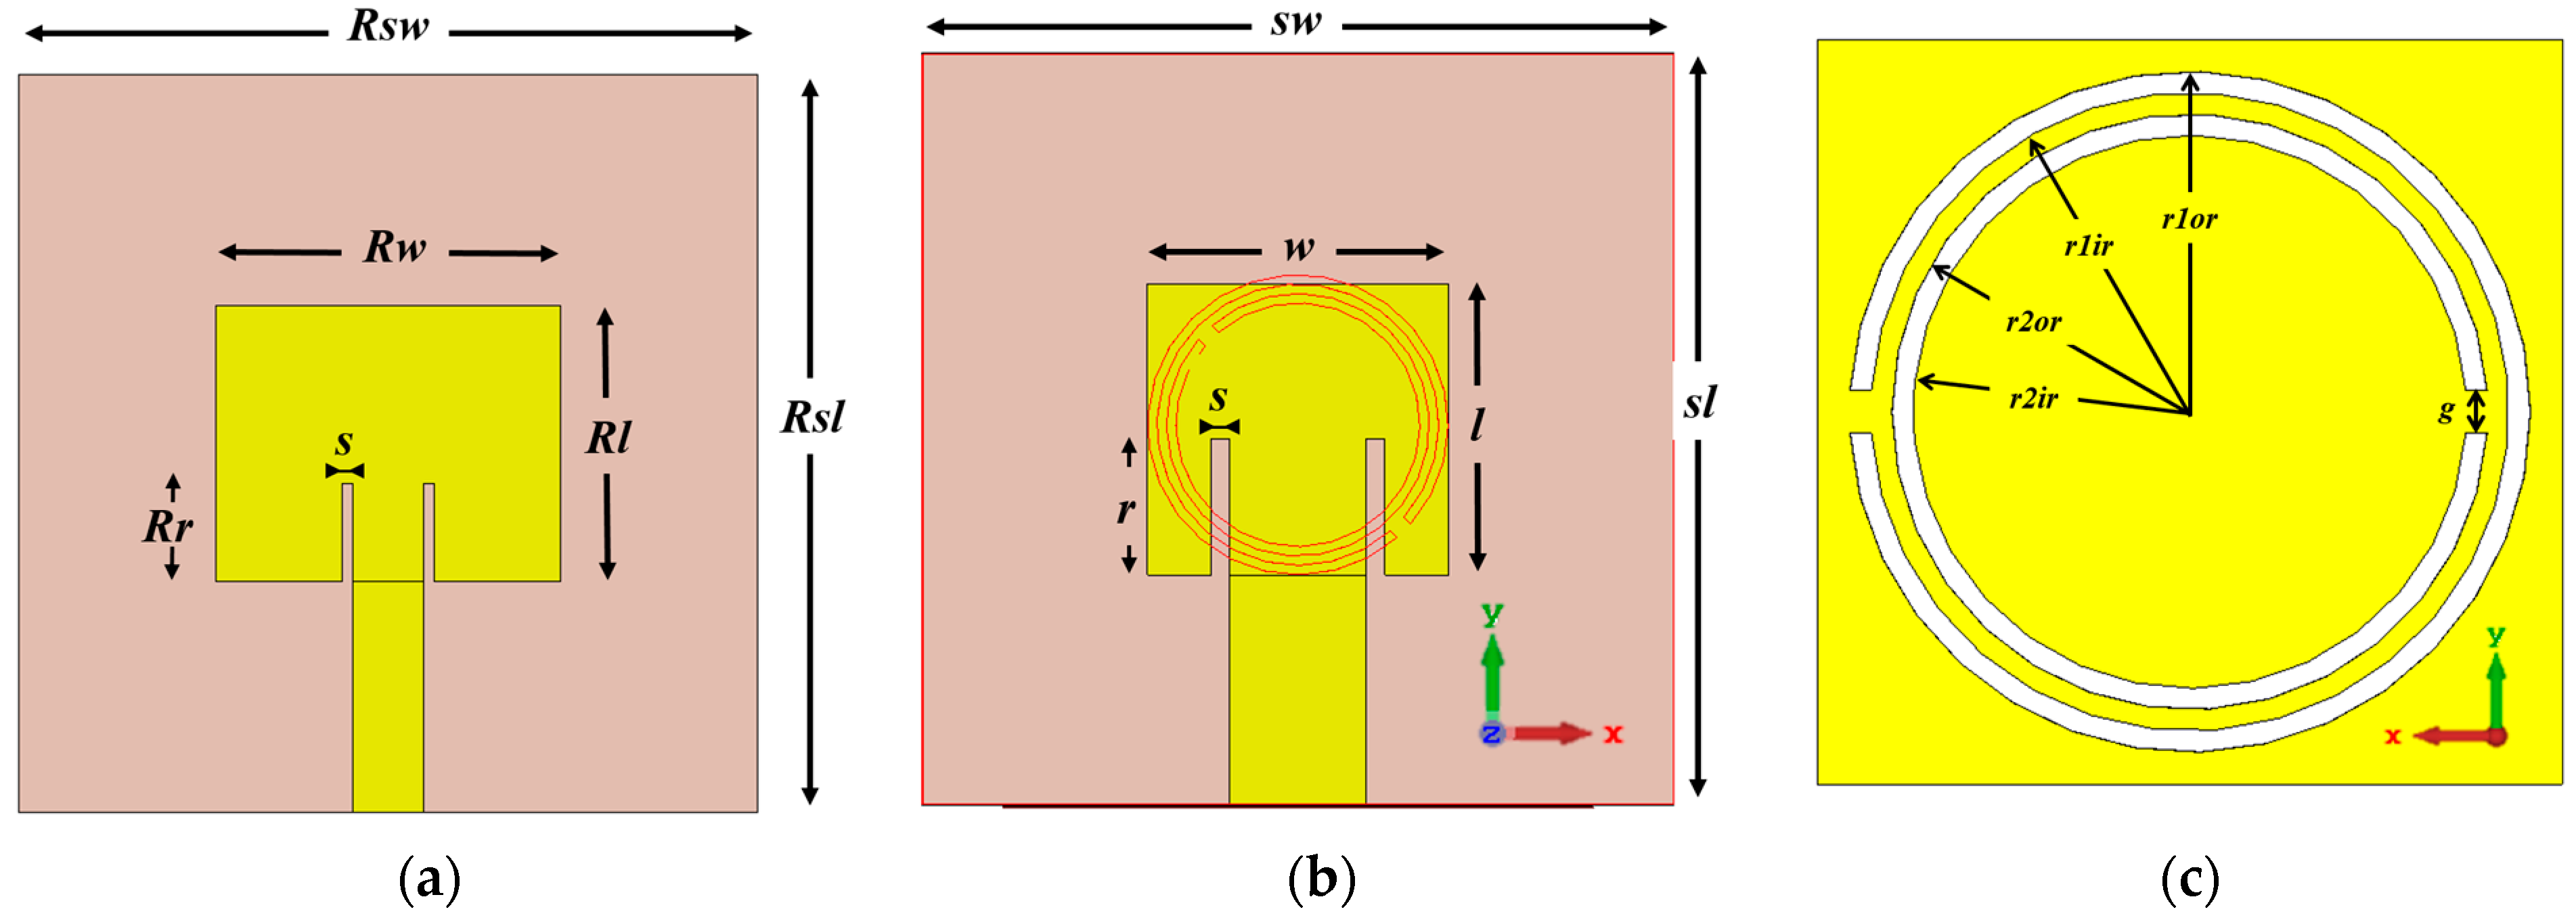
Figure 16a shows the patch antenna designed at 17 GHz with a full ground plane. This antenna will be denoted as the regular MPA. To reduce the overall size of the patch antenna, a CSRR structure rotated to 45° is placed at the ground plane of the antenna [22]. This antenna will be denoted as the reduced size MPA with CSRR and Figure 16b,c shows the parameter of the patch and the ground plane of the antenna, respectively. Additionally, the parameters of the antennas and their values in λ and in mm following optimization are listed in Table 1 below.
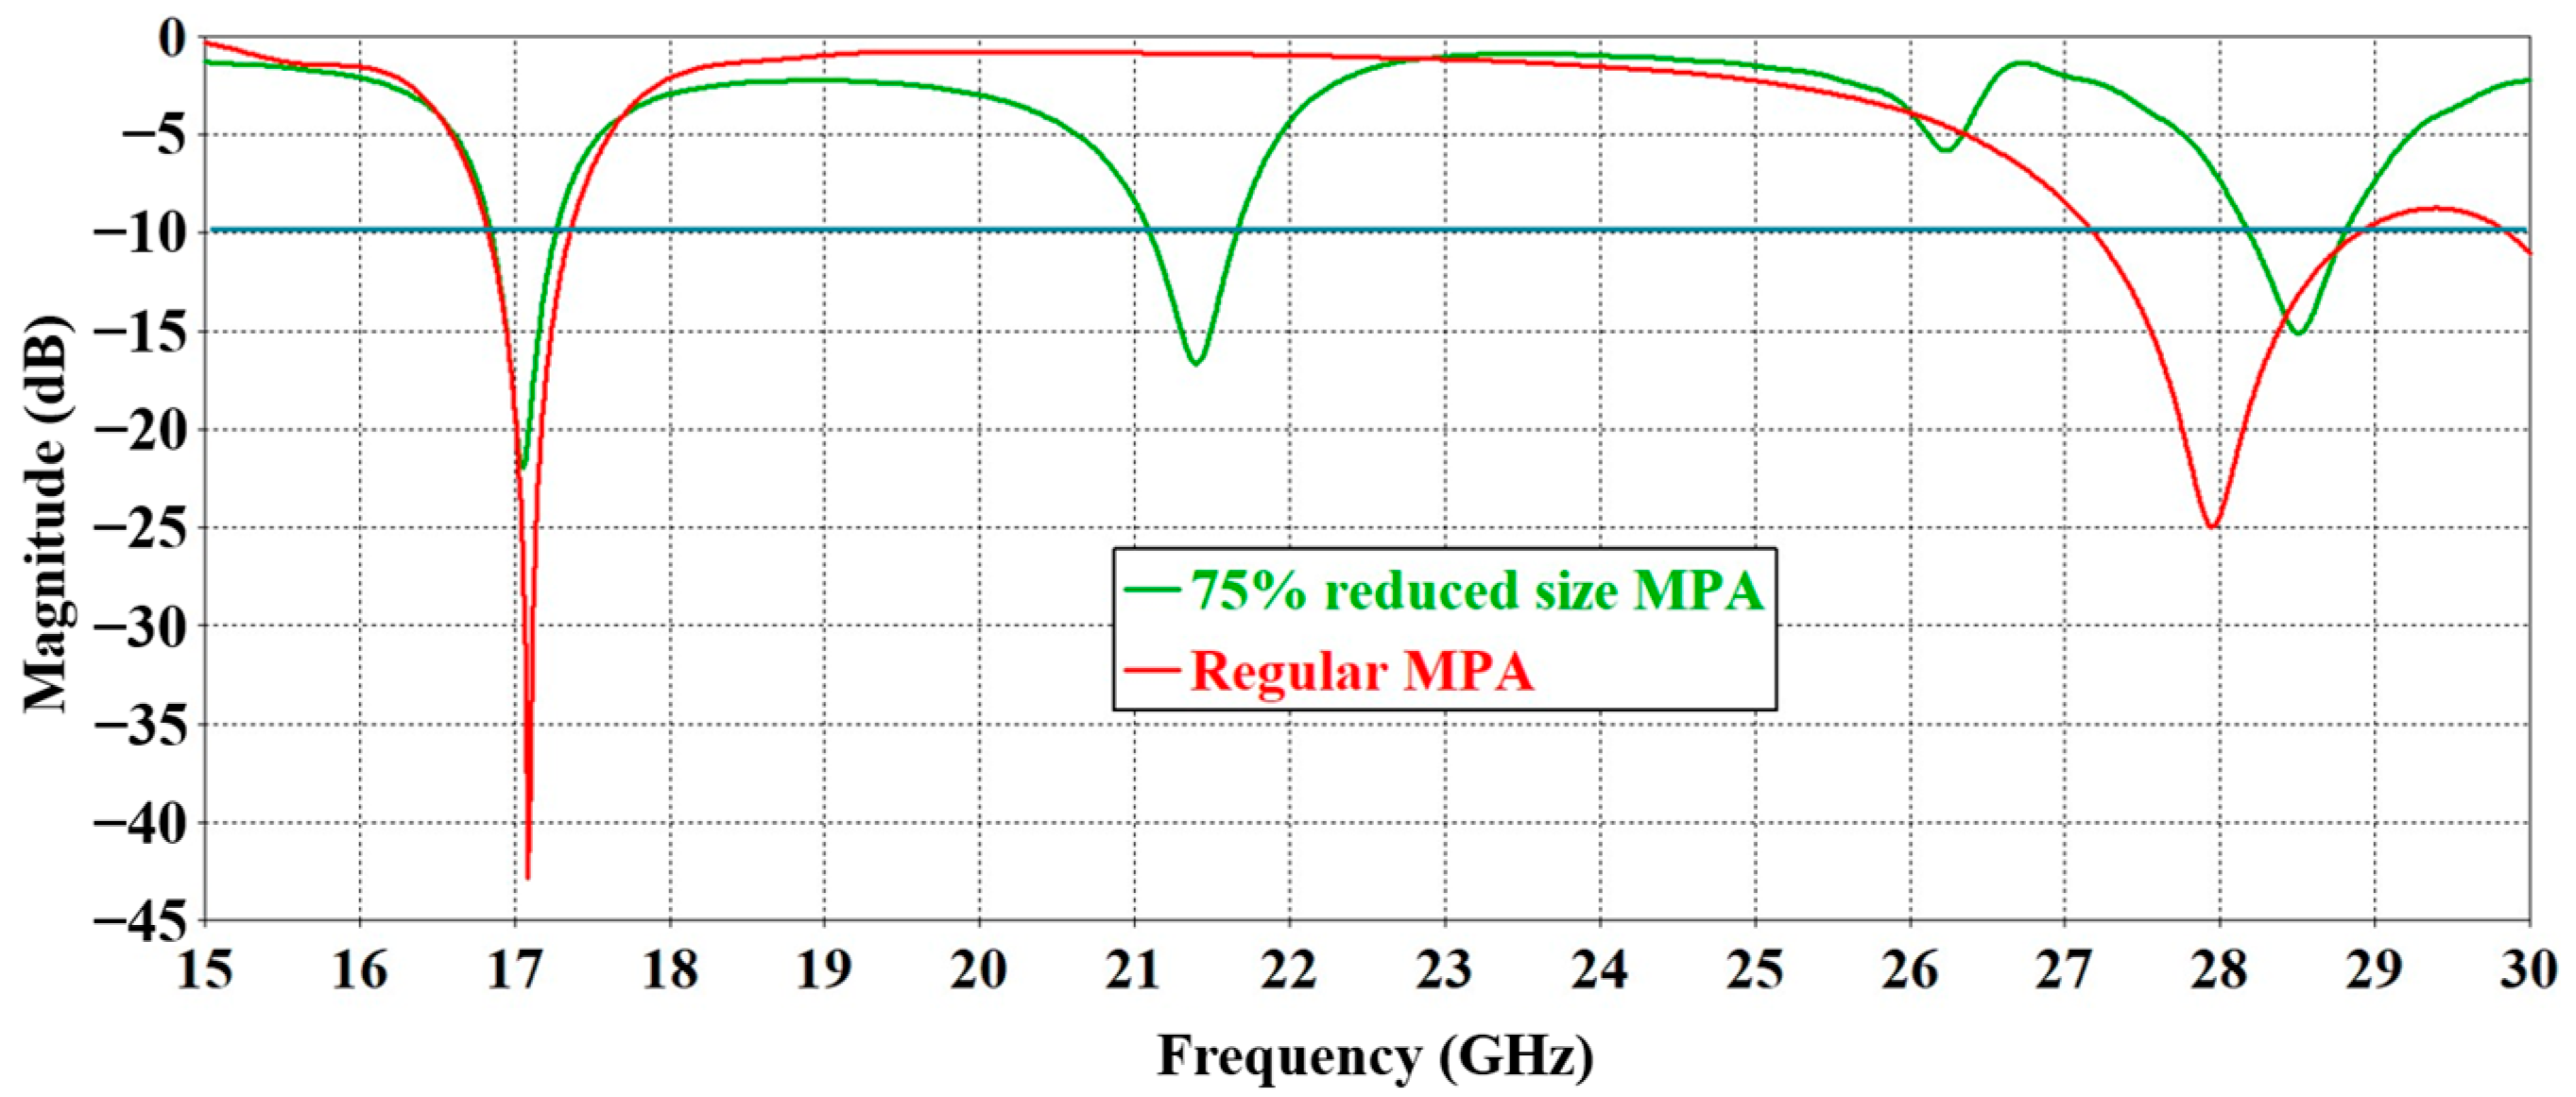
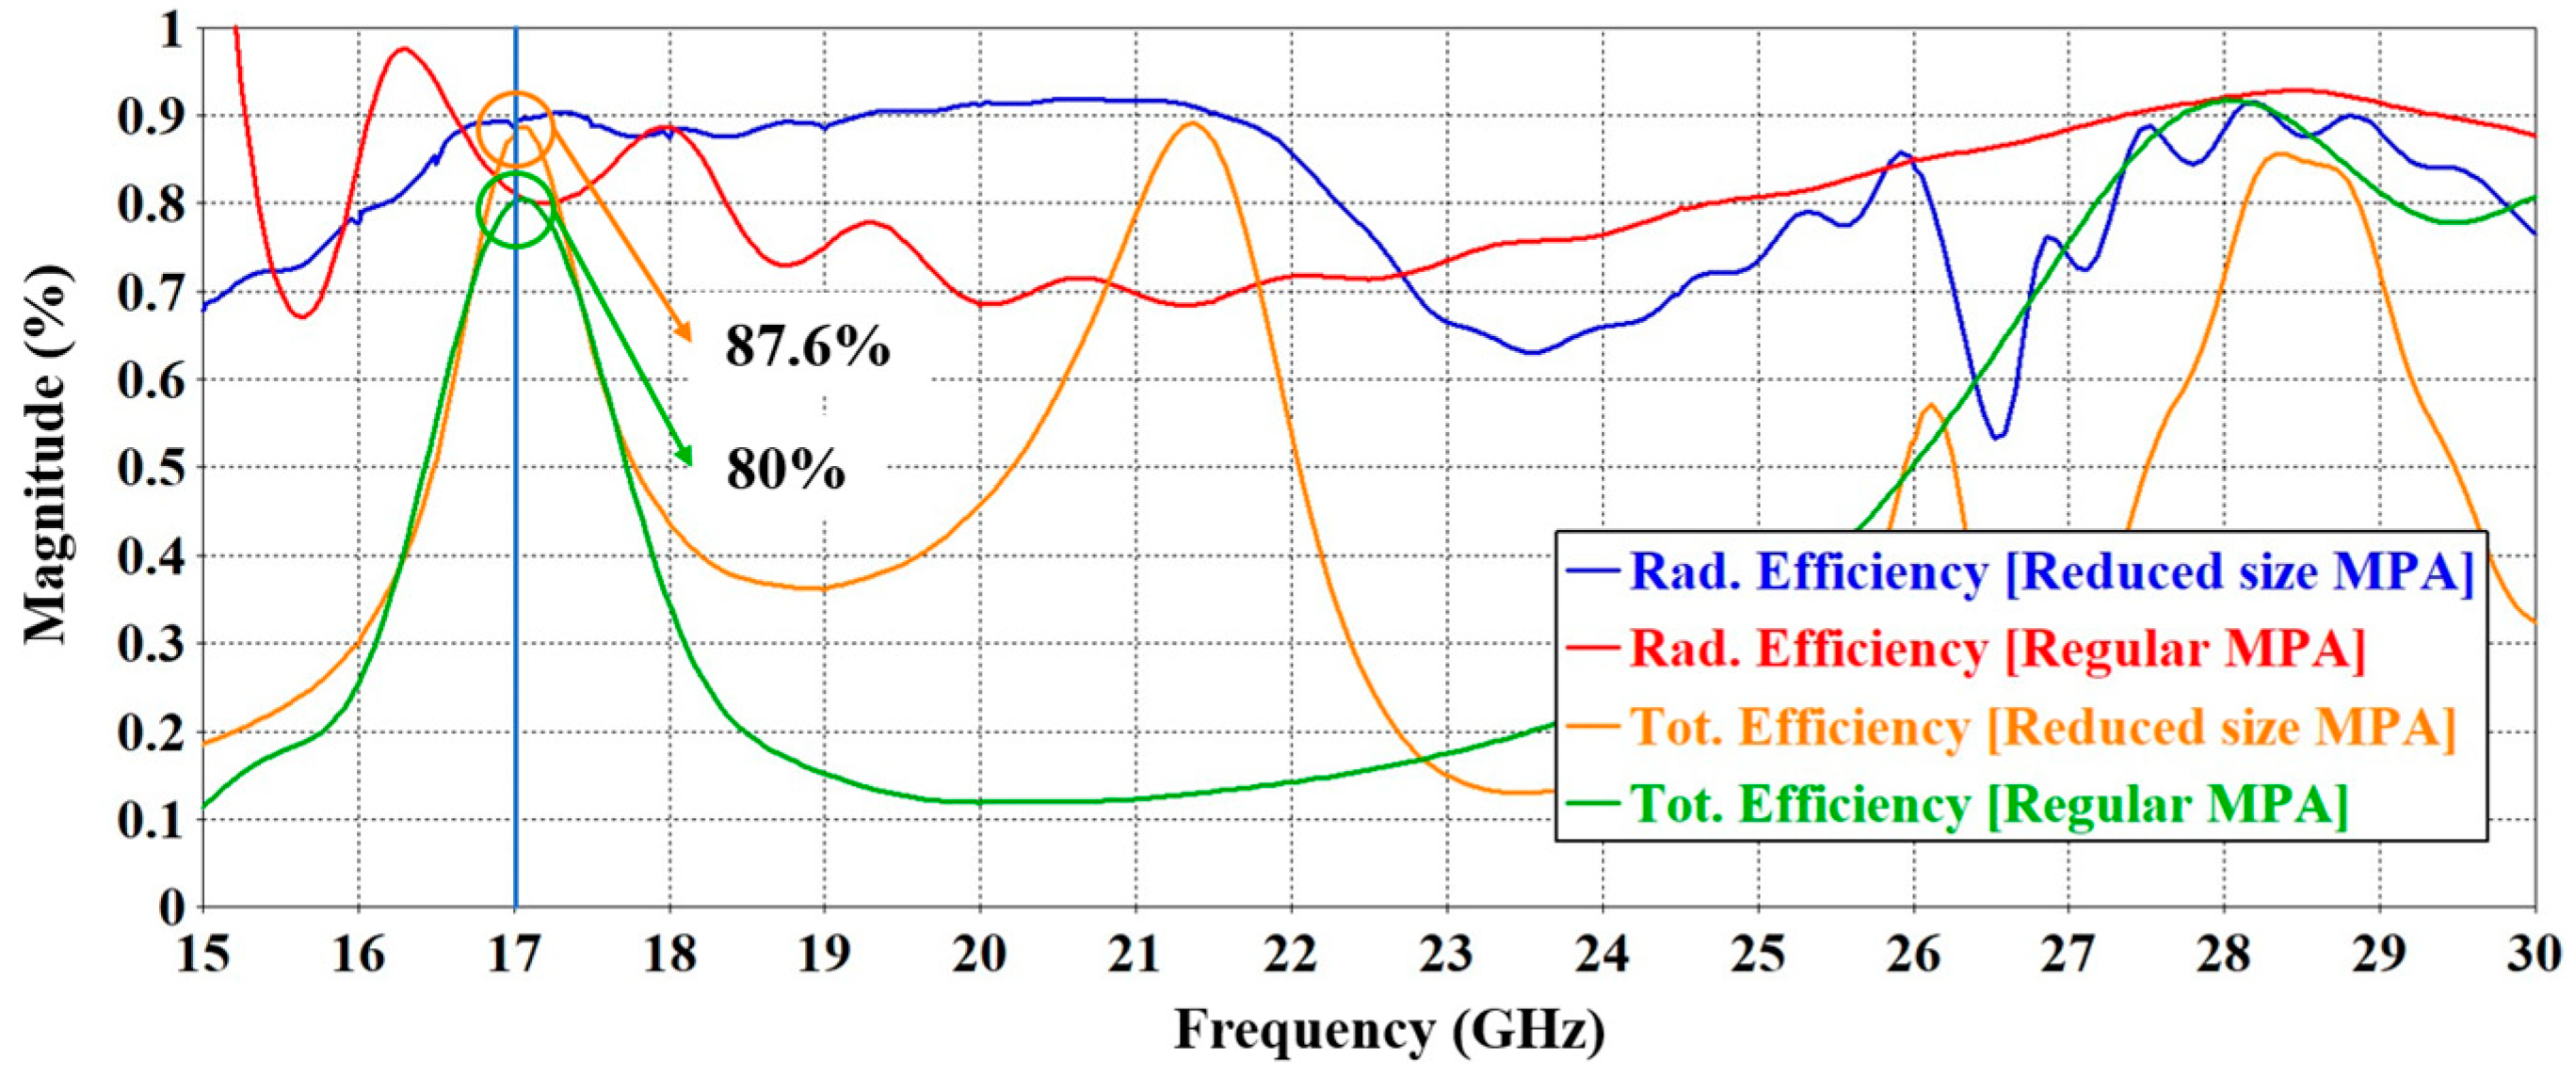
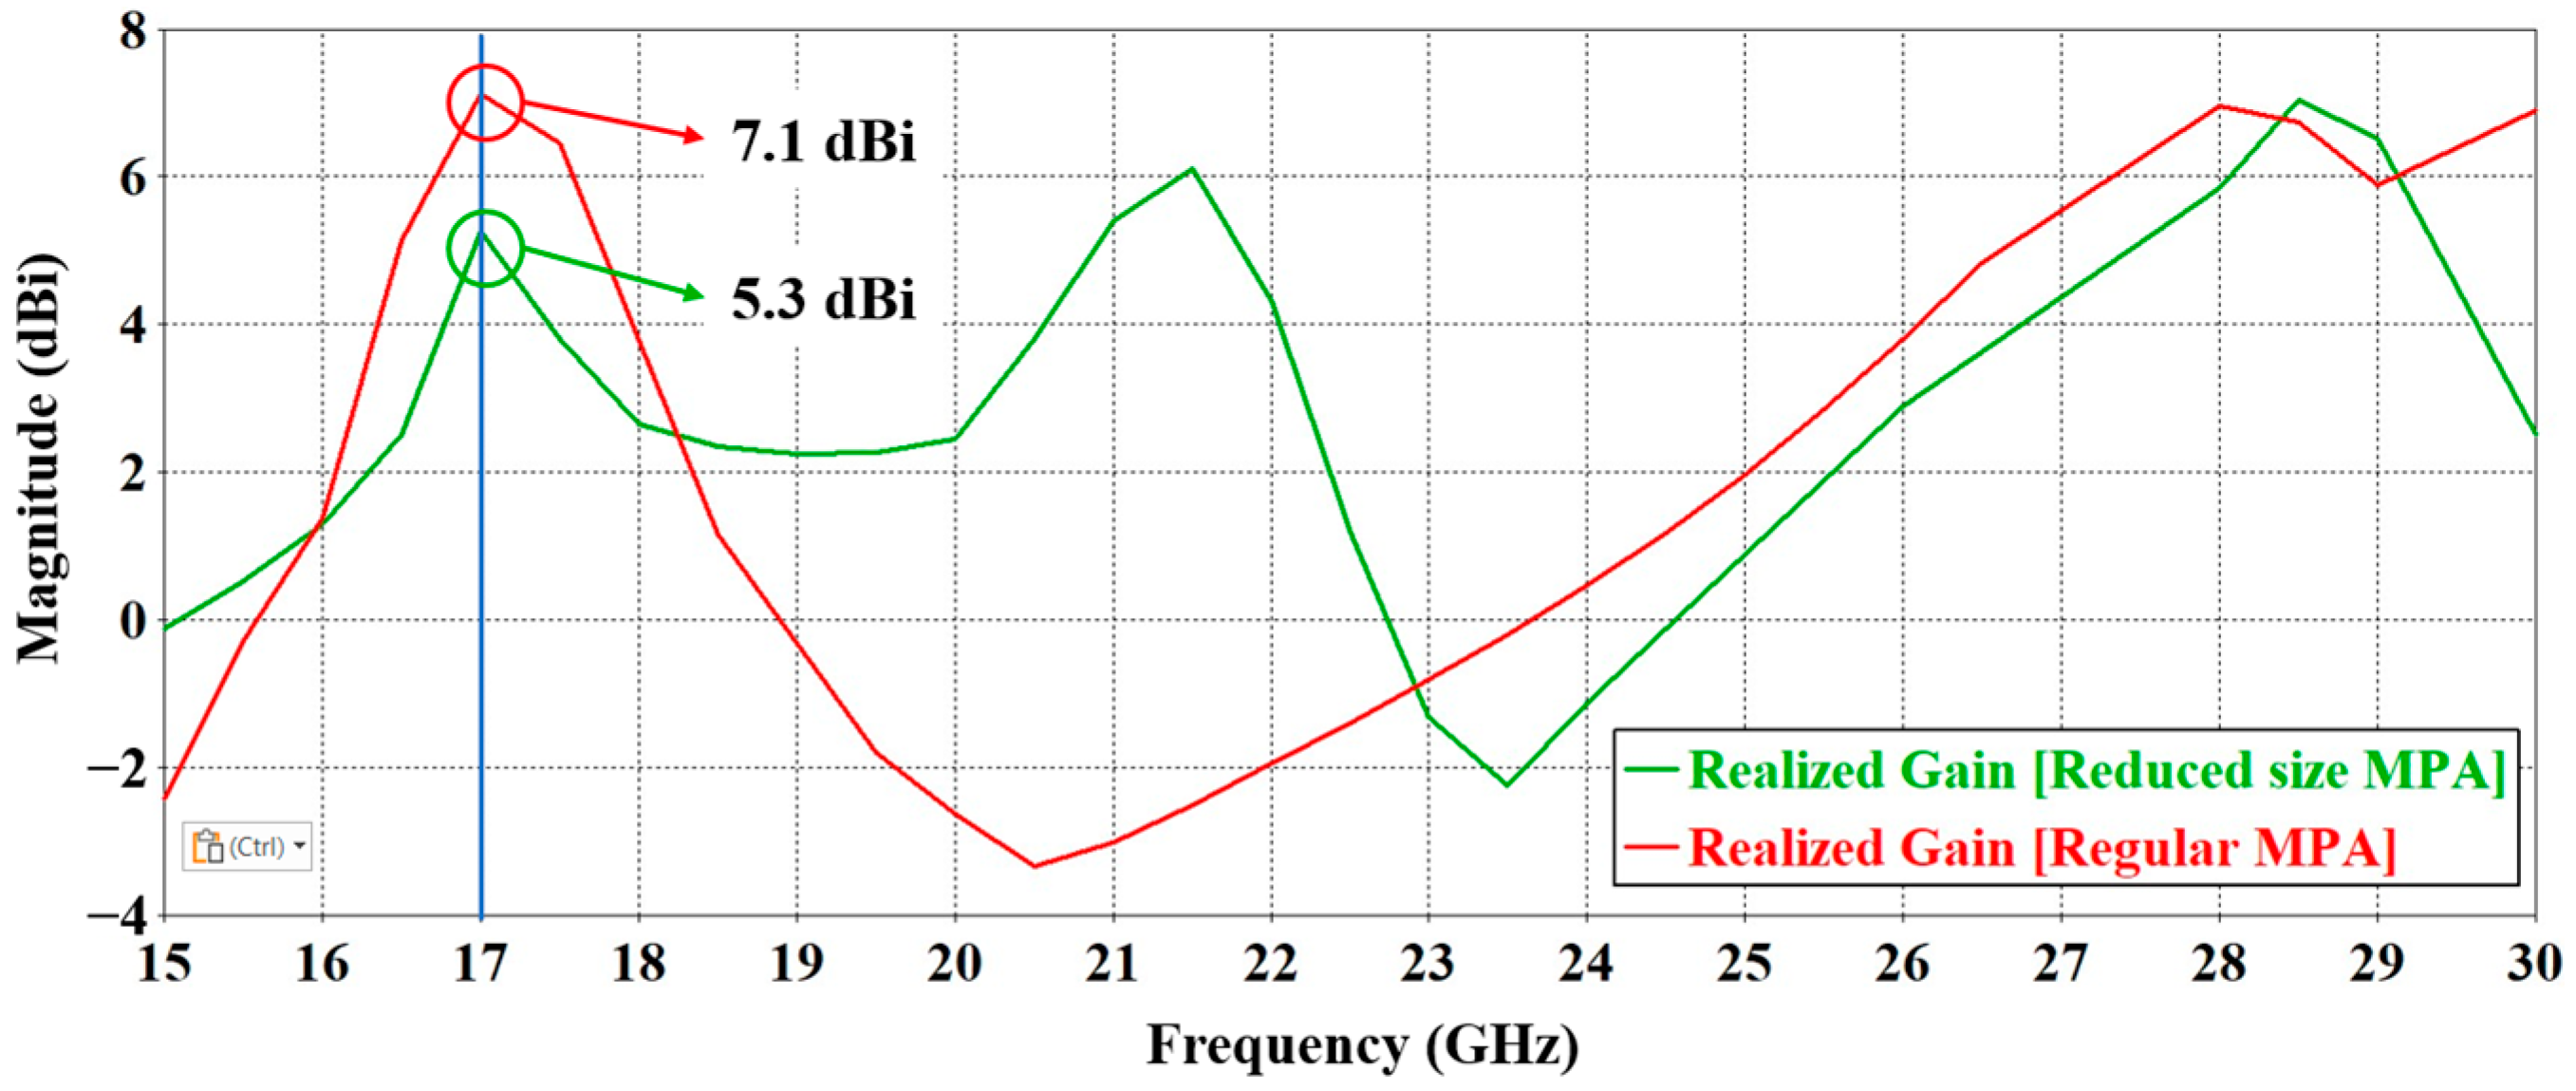
The comparison between the simulated reflection coefficients, S11, of both antennas are shown in Figure 17. From the graph, it can be inferred that at 17 GHz, the MPA with CSRR achieved 75% size reduction compared to the patch antenna with a full ground plane. Figure 18 shows that the reduced size MPA has 87.6% antenna efficiency which is quite higher compared to the efficiency of the regular MPA at 80%. However, the reduced size MPA has a lower gain compared to the regular MPA, as shown in Figure 19. This is mainly due to the 75% size reduction of the patch antenna, as well as the introduction of CSRR on the ground plane of the antenna.
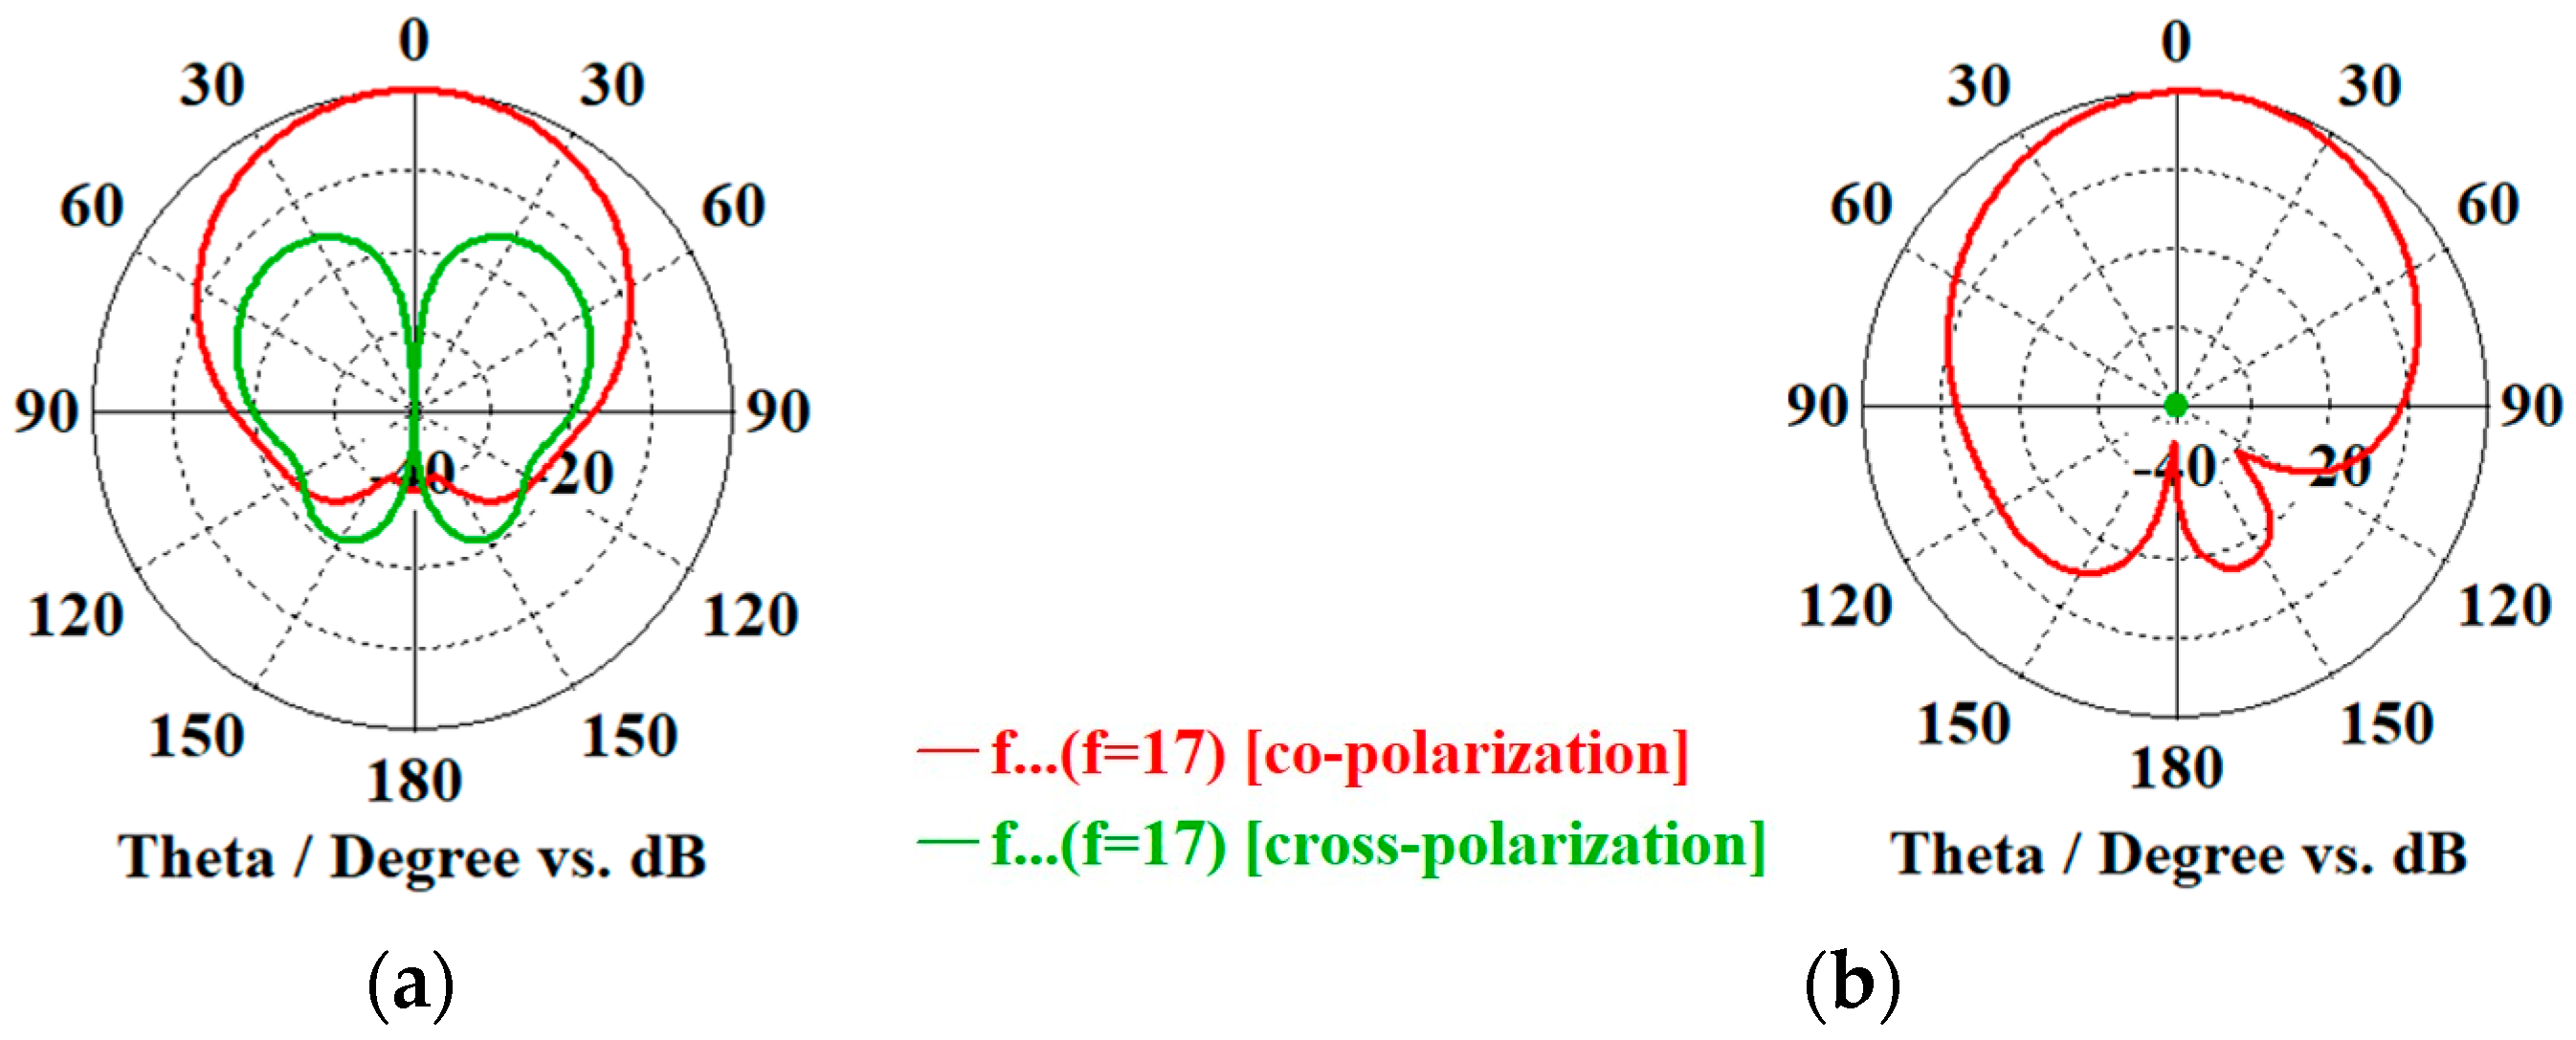
Next, the simulated radiation pattern of the regular MPA is shown in Figure 16. The result shows classical observation where at H-plane (φ = 0°), Eφ = co-polarization pattern (red line) has a higher value than the Eθ = cross-polarization pattern (green line), as shown in Figure 20a. Figure 20b shows the E-plane (φ = 90°), where Eθ = co-polarization pattern (red line) and Eφ = cross-polarization pattern (green line). From the graph, a typical vertically polarized radiation pattern of a microstrip patch antenna is shown.
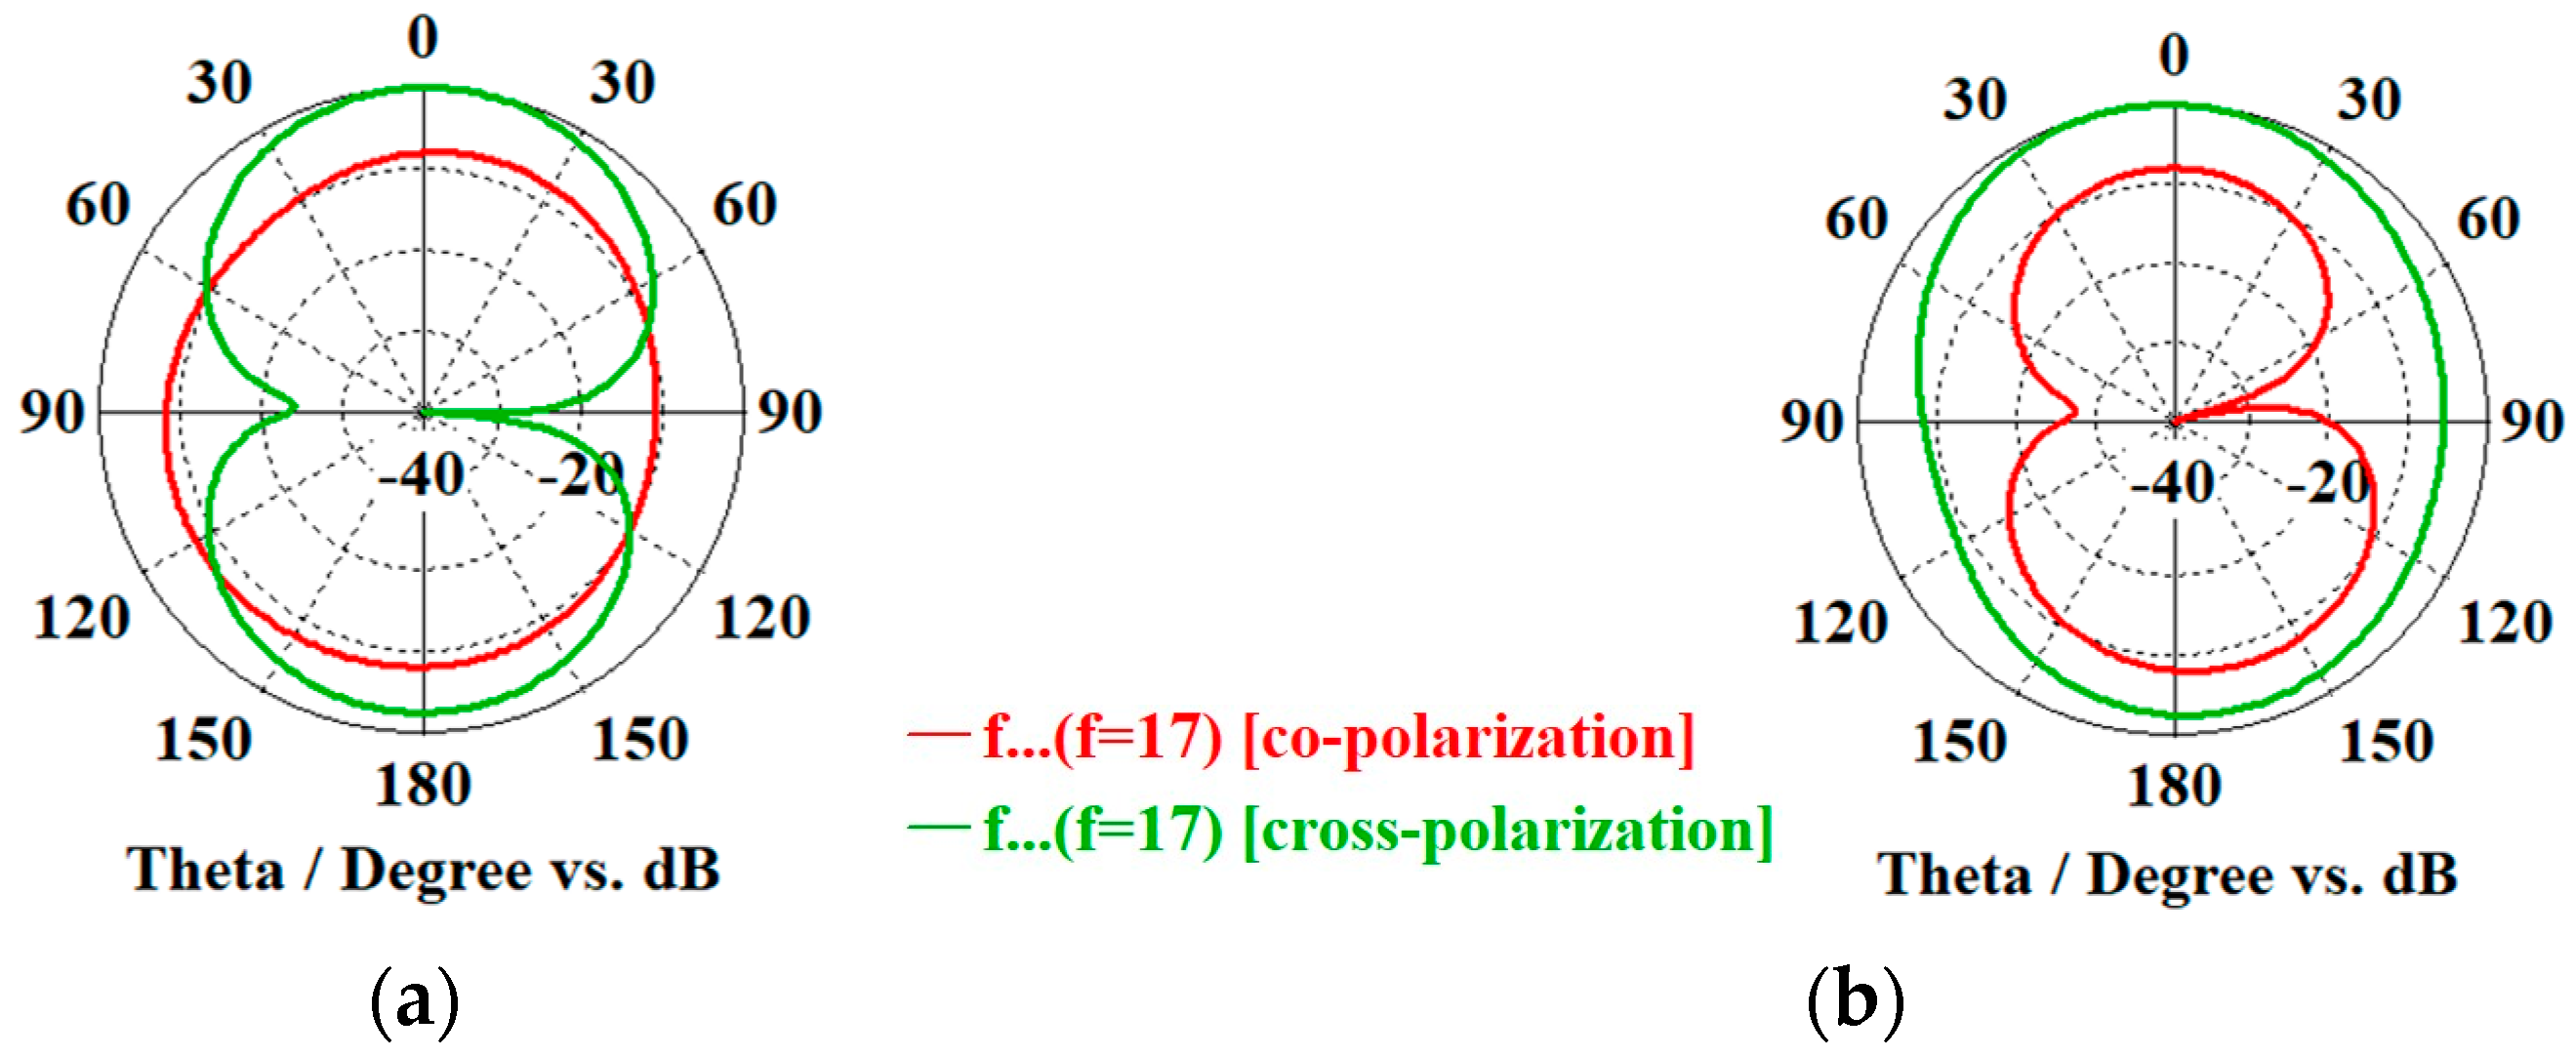
For the reduced size MPA with CSRR, the radiation pattern obtained shows a different case. Figure 21a shows the radiation at H-plane (φ = 0°), Eφ = co-polarization pattern (red line) obtained −3.47 dBi magnitude and Eθ = cross-polarization pattern (green line) obtained 4.2 dBi magnitude. The E-plane (φ = 90°), the Eθ = co-polarization pattern (red line) obtained −3.74 dBi magnitude and Eφ = cross-polarization pattern (green line) obtained a 4.23 dBi magnitude as shown in Figure 21b. This indicates that at 17 GHz frequency, the antenna is horizontally polarized, unlike the regular MPA which is vertically polarized.
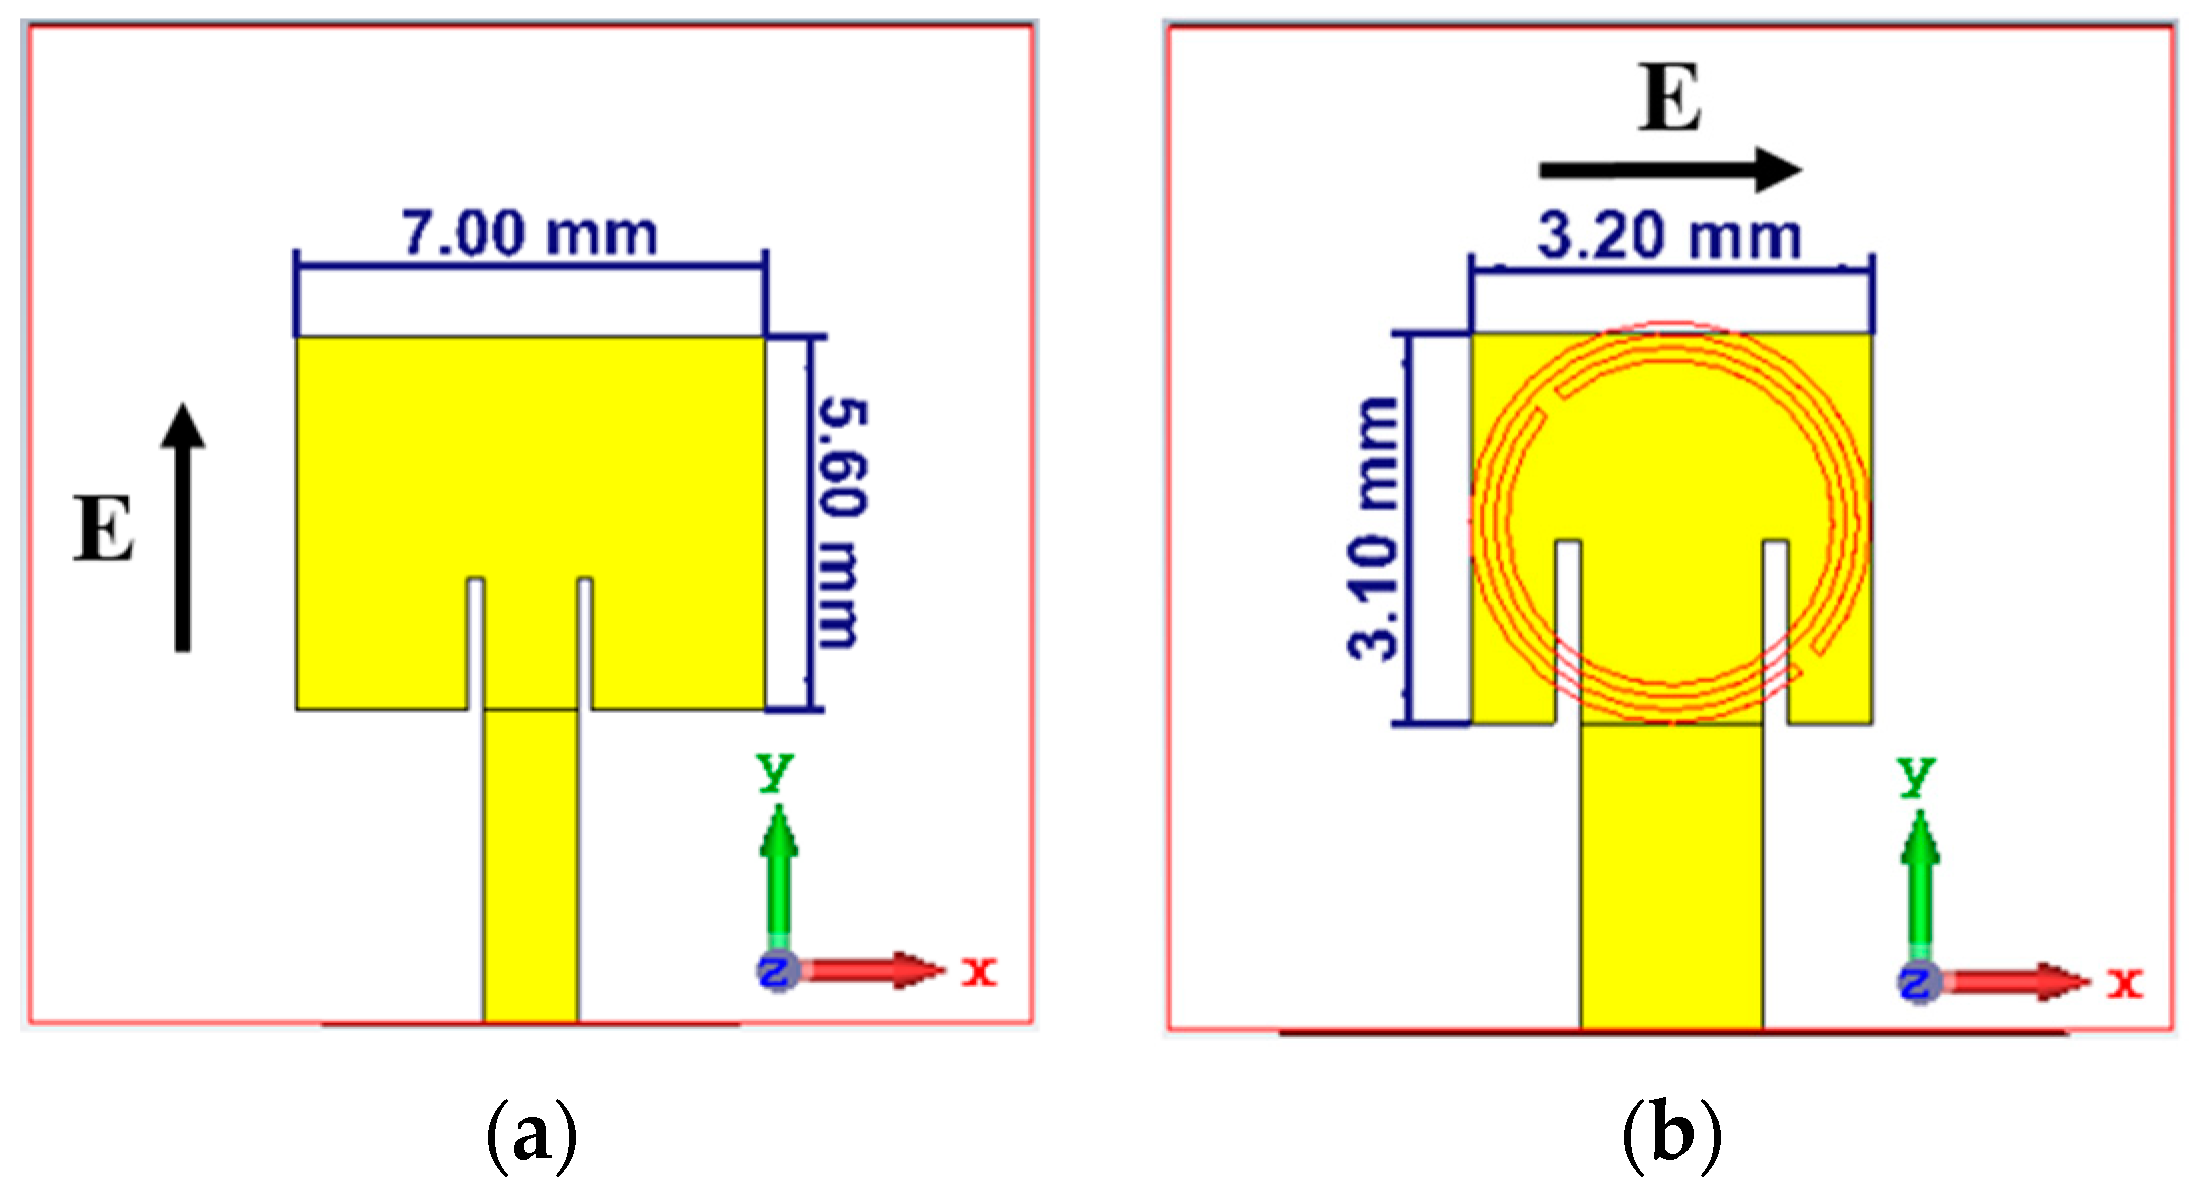
In short, the polarization (denoted as E) of both patch antenna structures is as described in Figure 22.
Since the Luneburg lens is in between two metal plates, the direction of the electrical field of the antenna must be vertical to excite the lens. Since the reduced size MPA with CSRR is horizontally polarized, it must be rotated to 90° at z-axis to feed the lens.
Referring to Formula (11) with SB2B equal to 10°, the width of the substrate of the patch antenna should be less or equal to 8 mm to have an overlapping between adjacent beams at –3 dB. Fortunately, the reduced size MPA with CSRR at 17 GHz achieved 75% size reduction with the width of the substrate size equal to 8 mm.
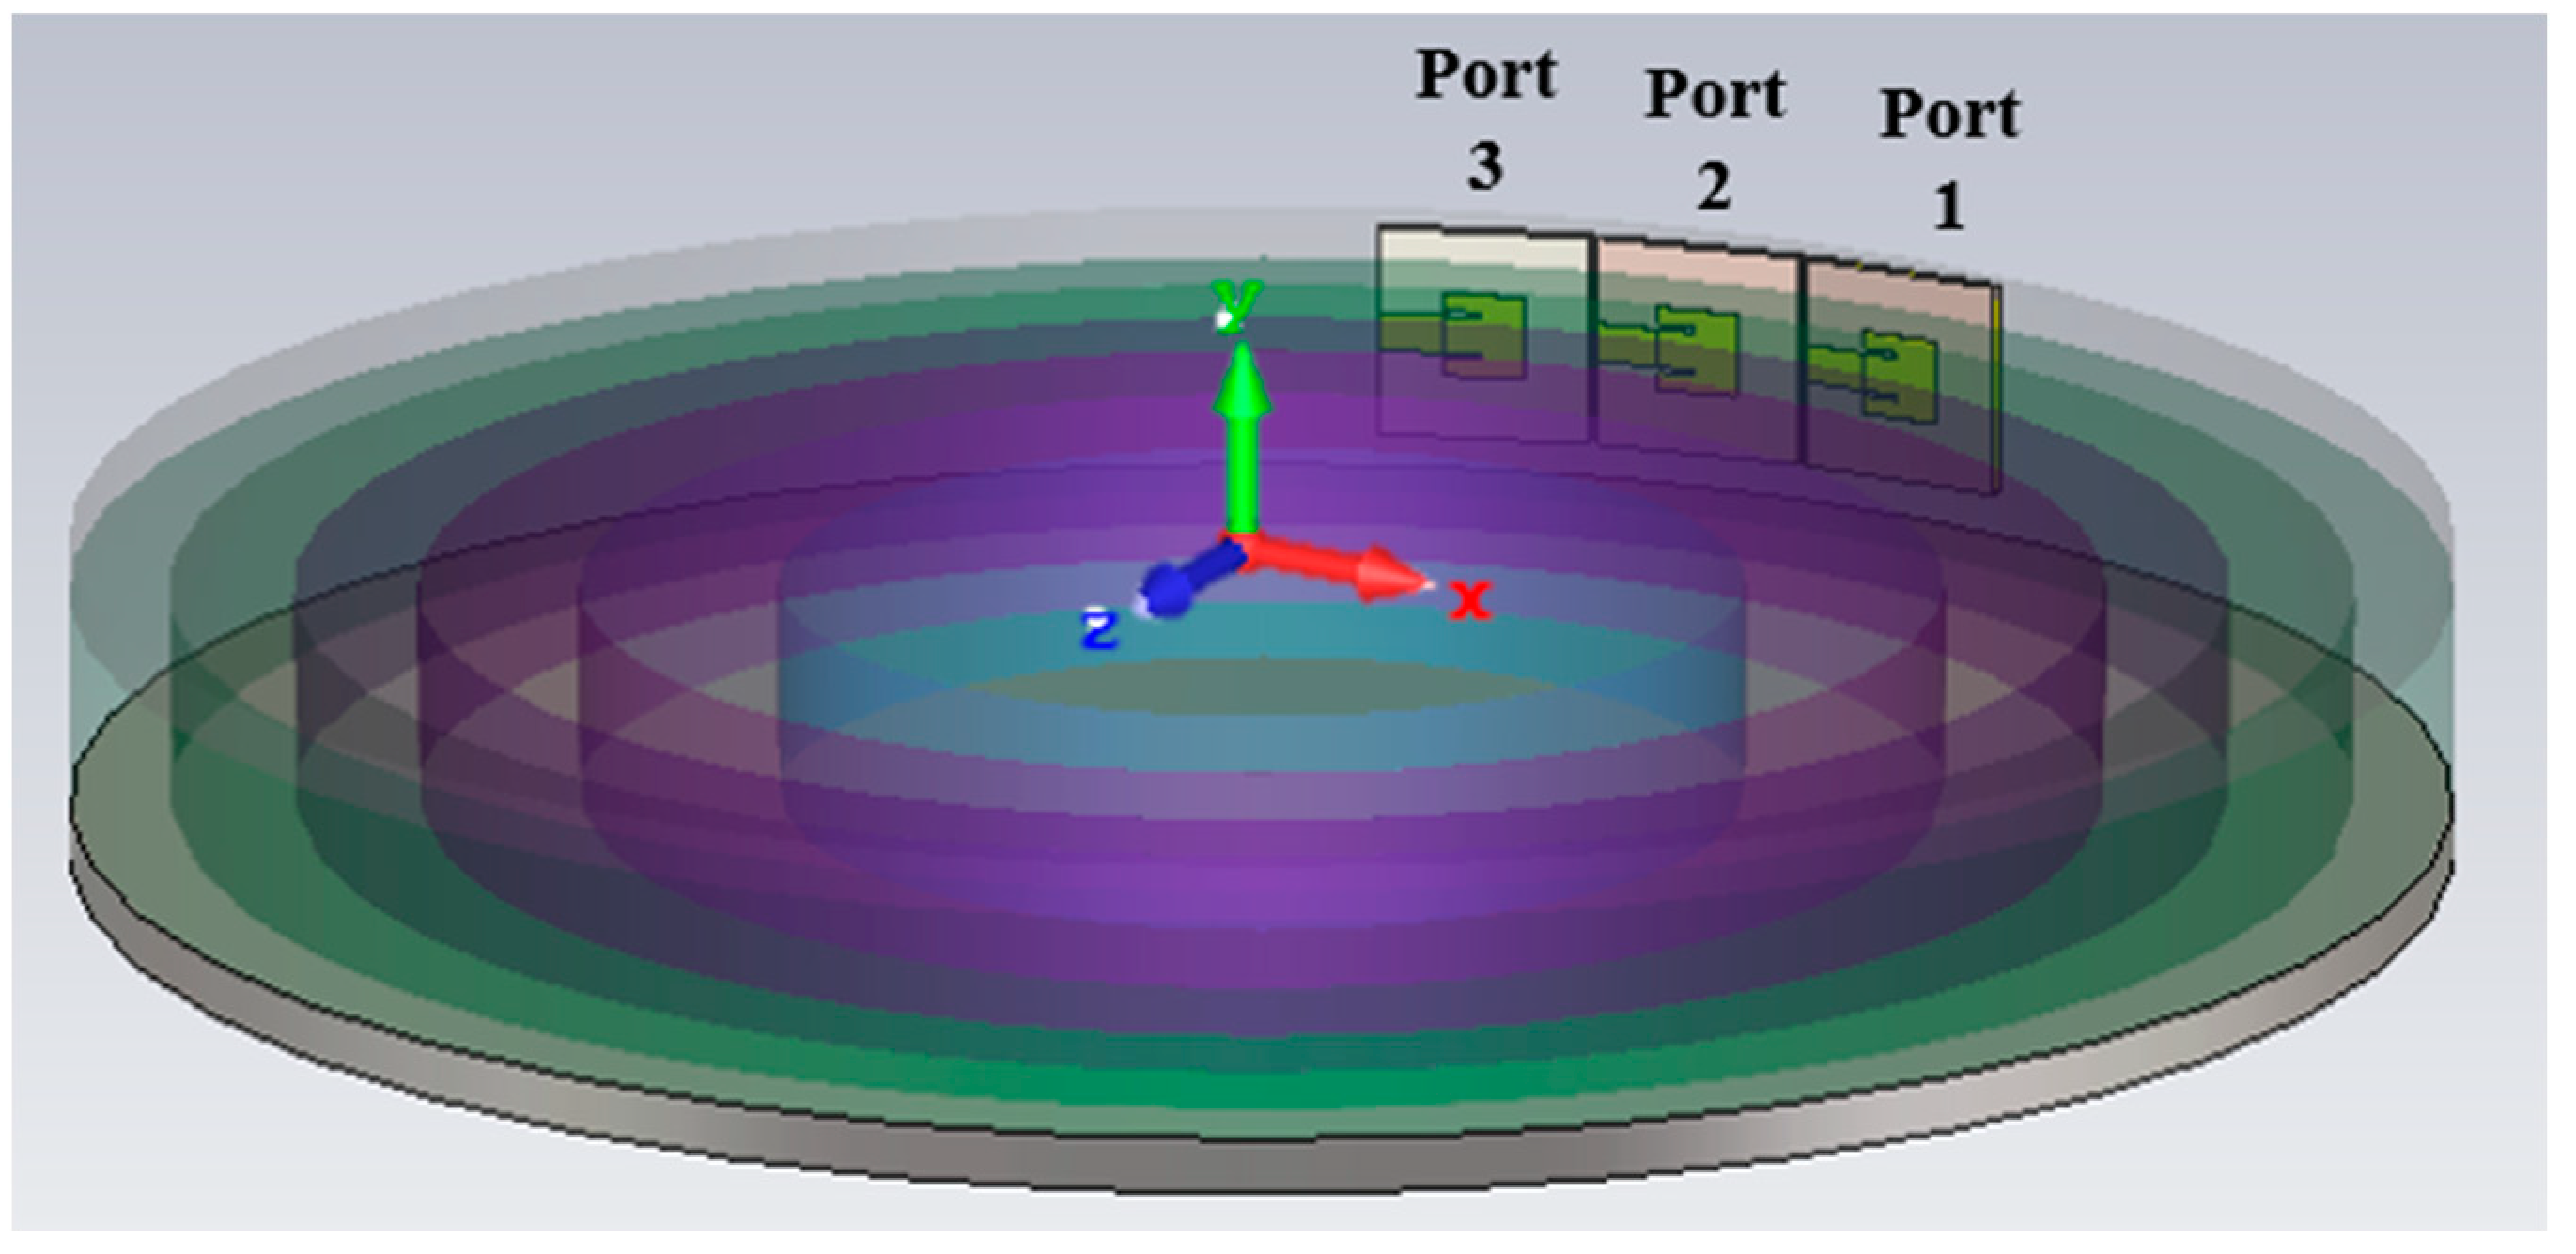
This means it is now possible to feed the Luneburg lens using the reduced size antenna, so the number of patch antennas is increased to observe if the theory is correct. Figure 23 shows the simulation model of the plate Luneburg lens fed by three reduced size MPA with CSRR structures rotated to 90° at z-axis.
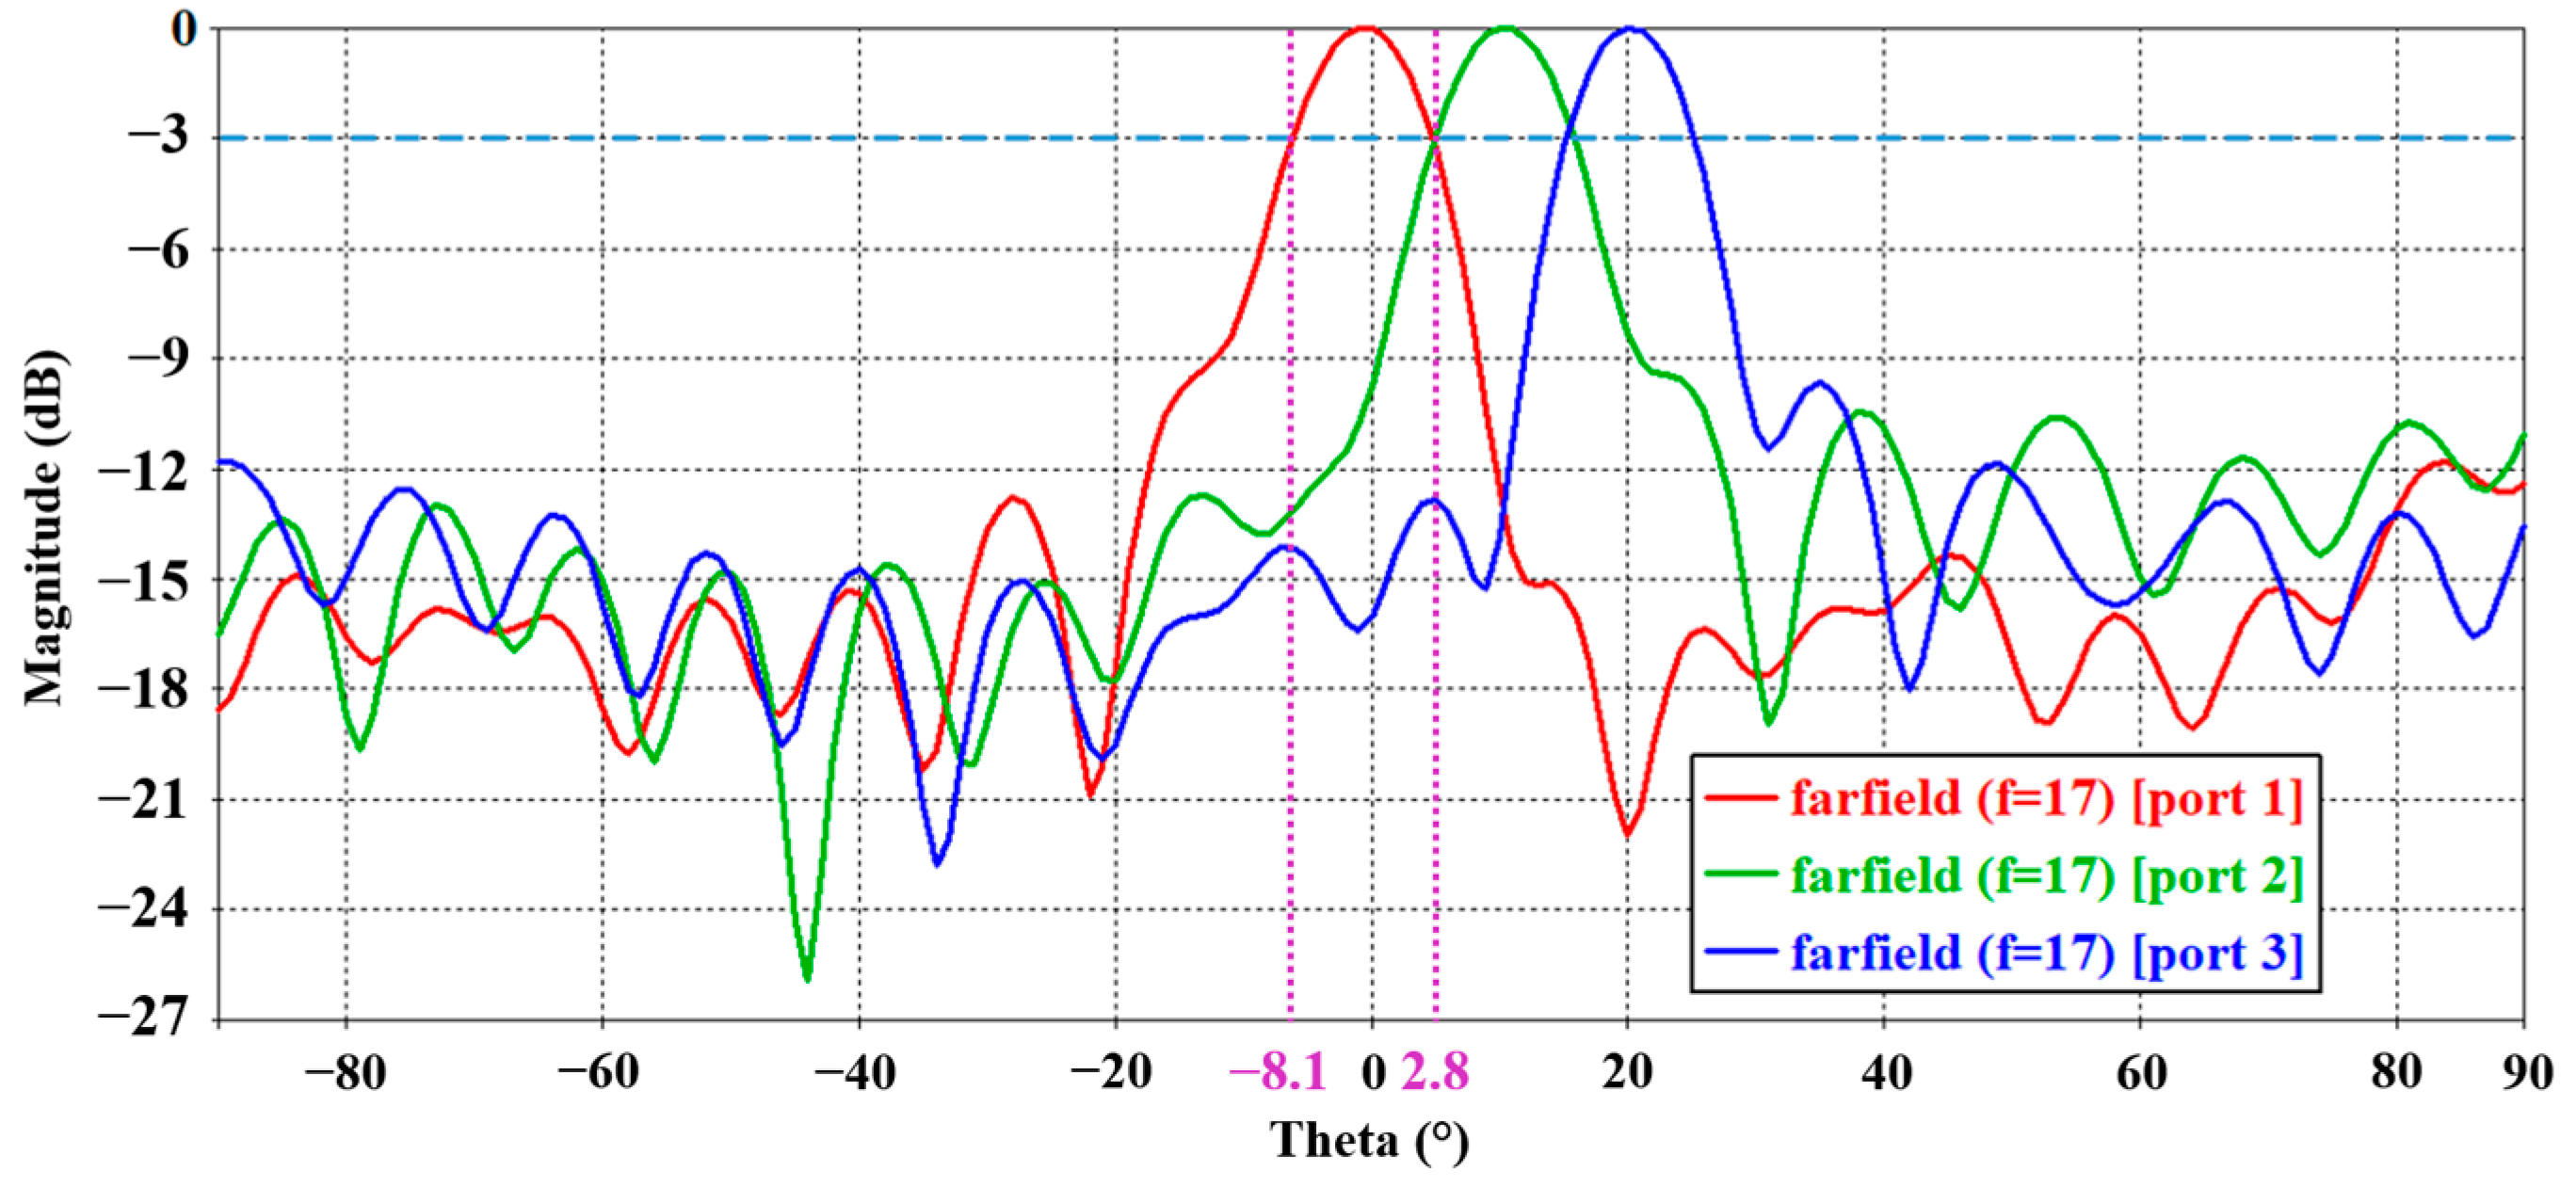
The simulated radiation pattern of the structure at 17 GHz for H-plane is shown in Figure 24. The beamwidth for this frequency is 10.9° at H-plane with antenna directivity obtained at 12 dBi. The simulated radiation pattern for the antennas successfully shows beam overlap at −3 dB, which is beneficial in beam-scanning application.
Since it is impossible to fit a connector to the small patches while retaining the 0.408λ distance with each other, the transmission line is tilted downwards, and to minimize a coupling effect, the transmission line is replaced with a quarter-wave line. On that note, to achieve an overlapping beam at −3 dB by placing the patch antenna side by side, mutual coupling between the structures is inevitable. Mutual coupling occurs between at least two parallel transmission lines or antenna elements with a certain distance between them due to magnetic fields surrounding the components [23,24]. Simply put, it is an electromagnetic interaction between the elements in an antenna array. In most cases, mutual coupling could energize the neighboring source and cause it to excite and produce other beams.
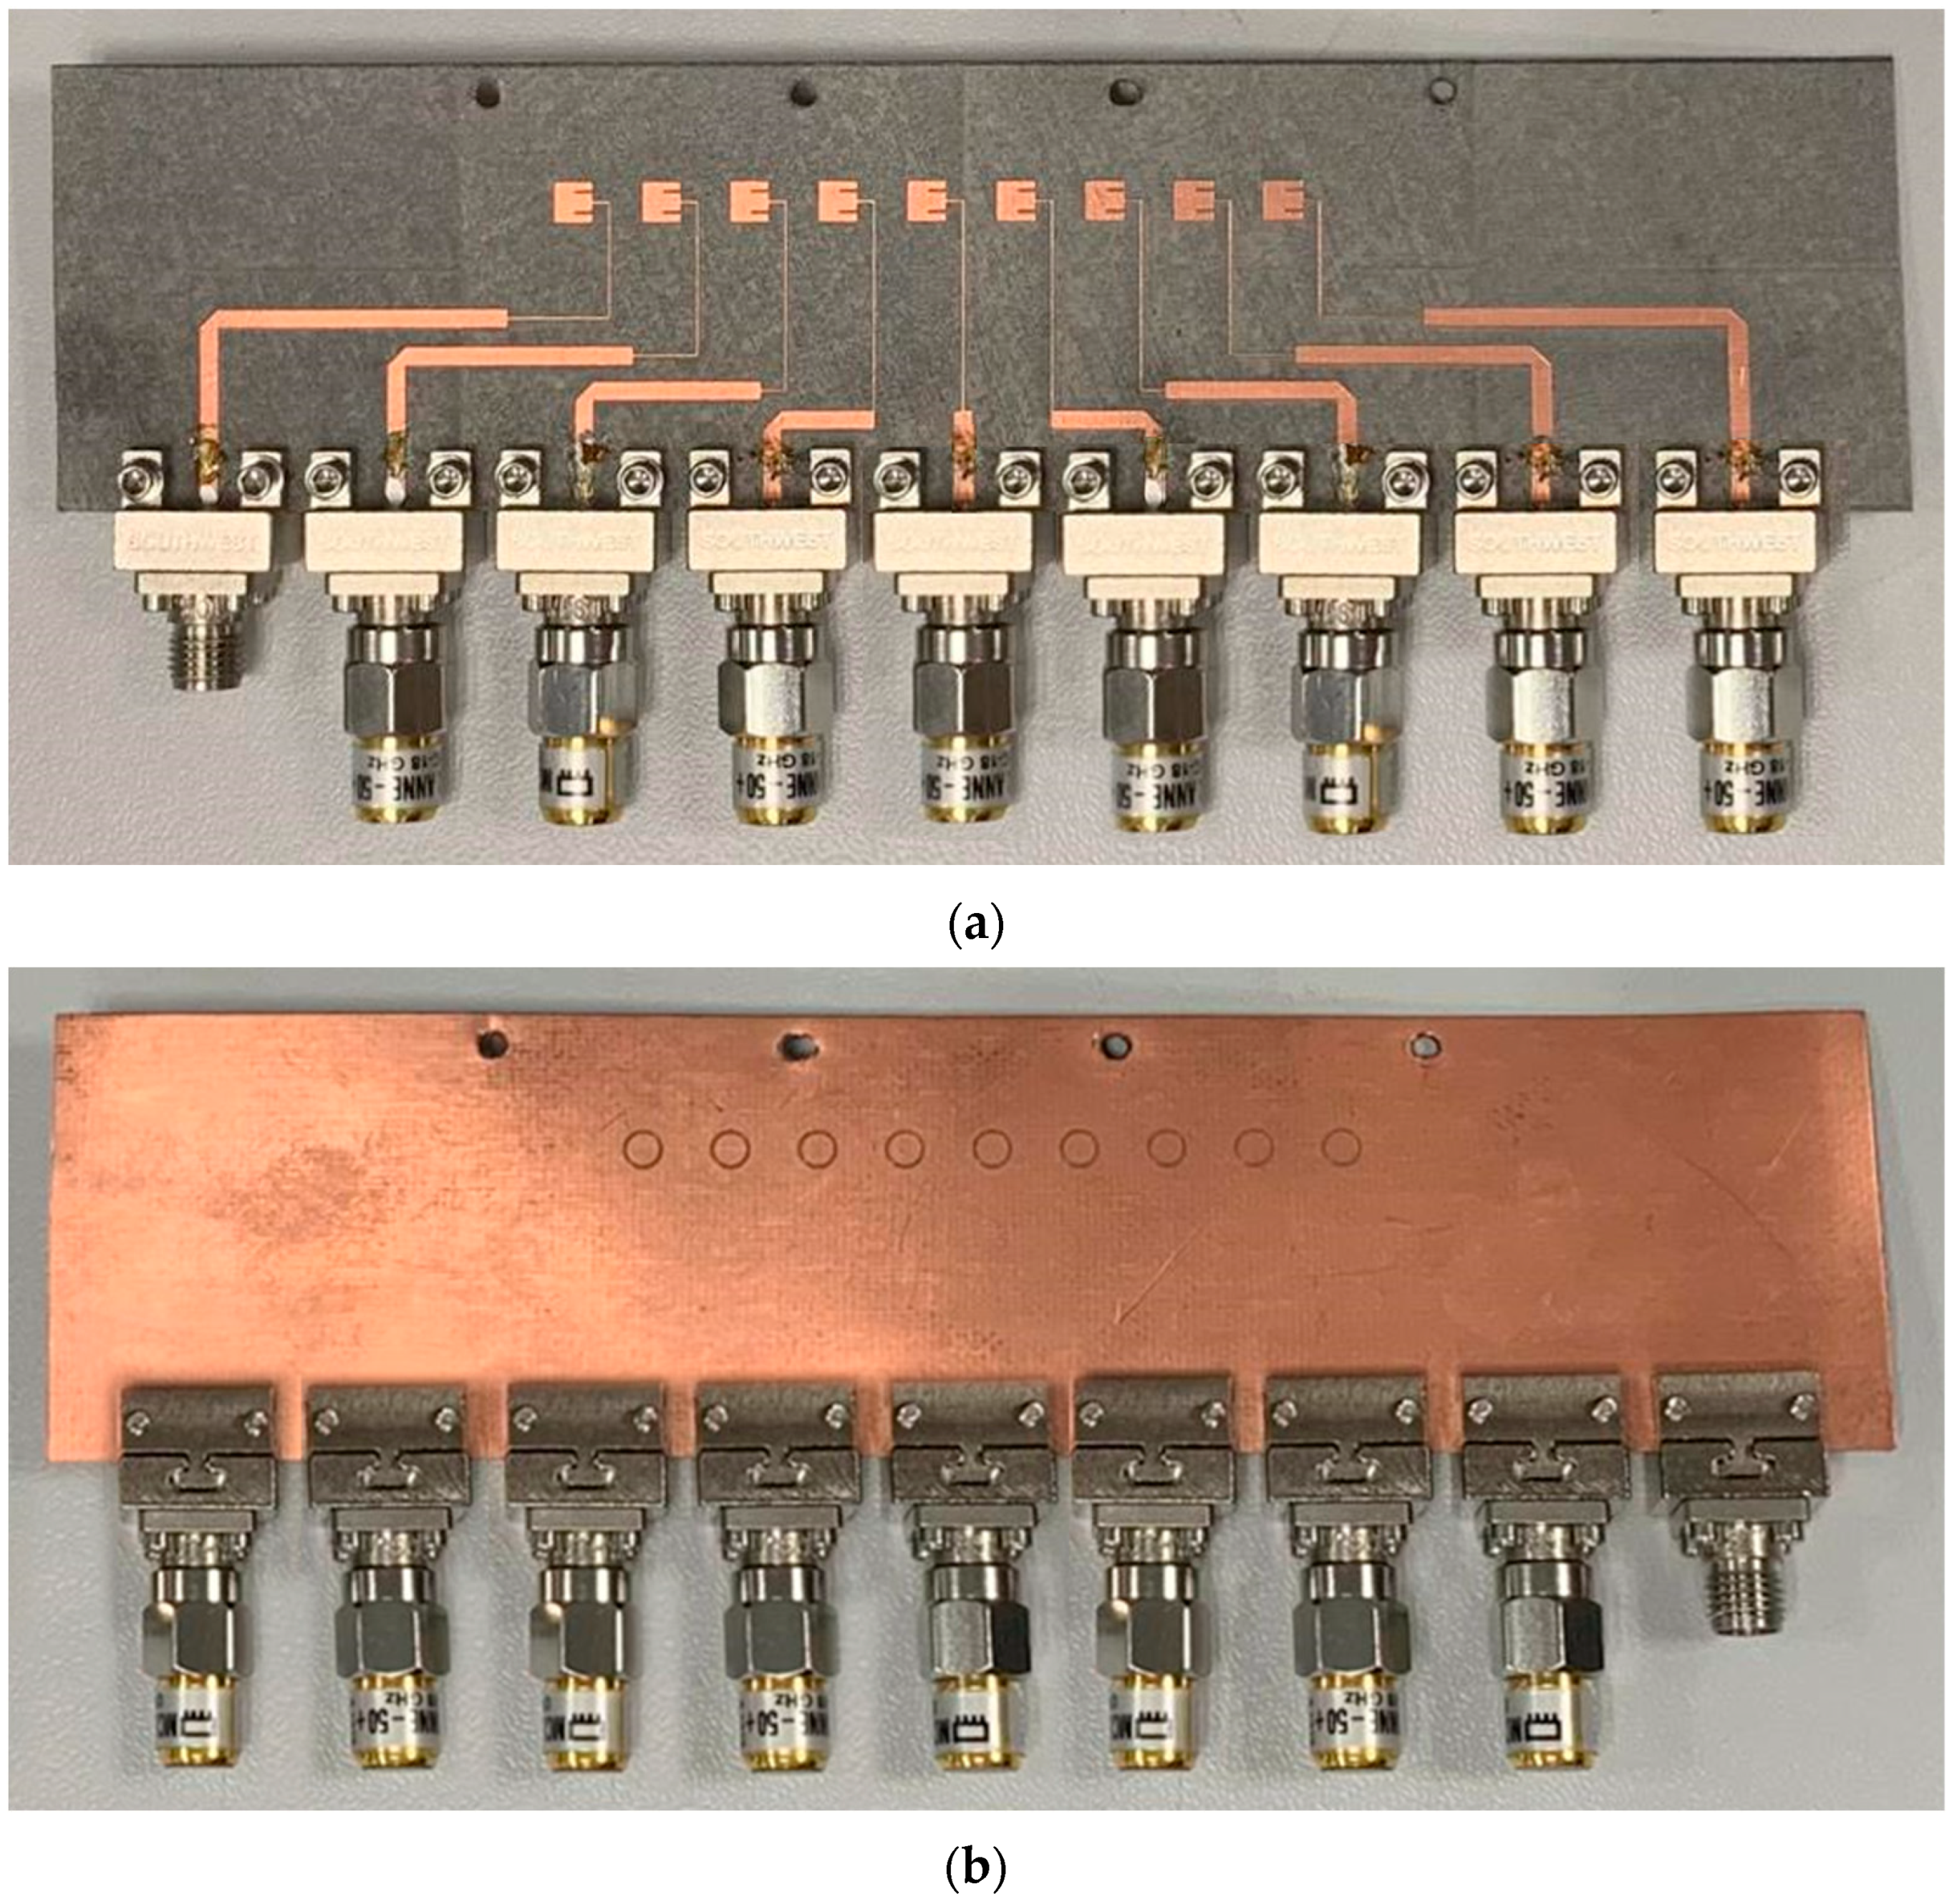
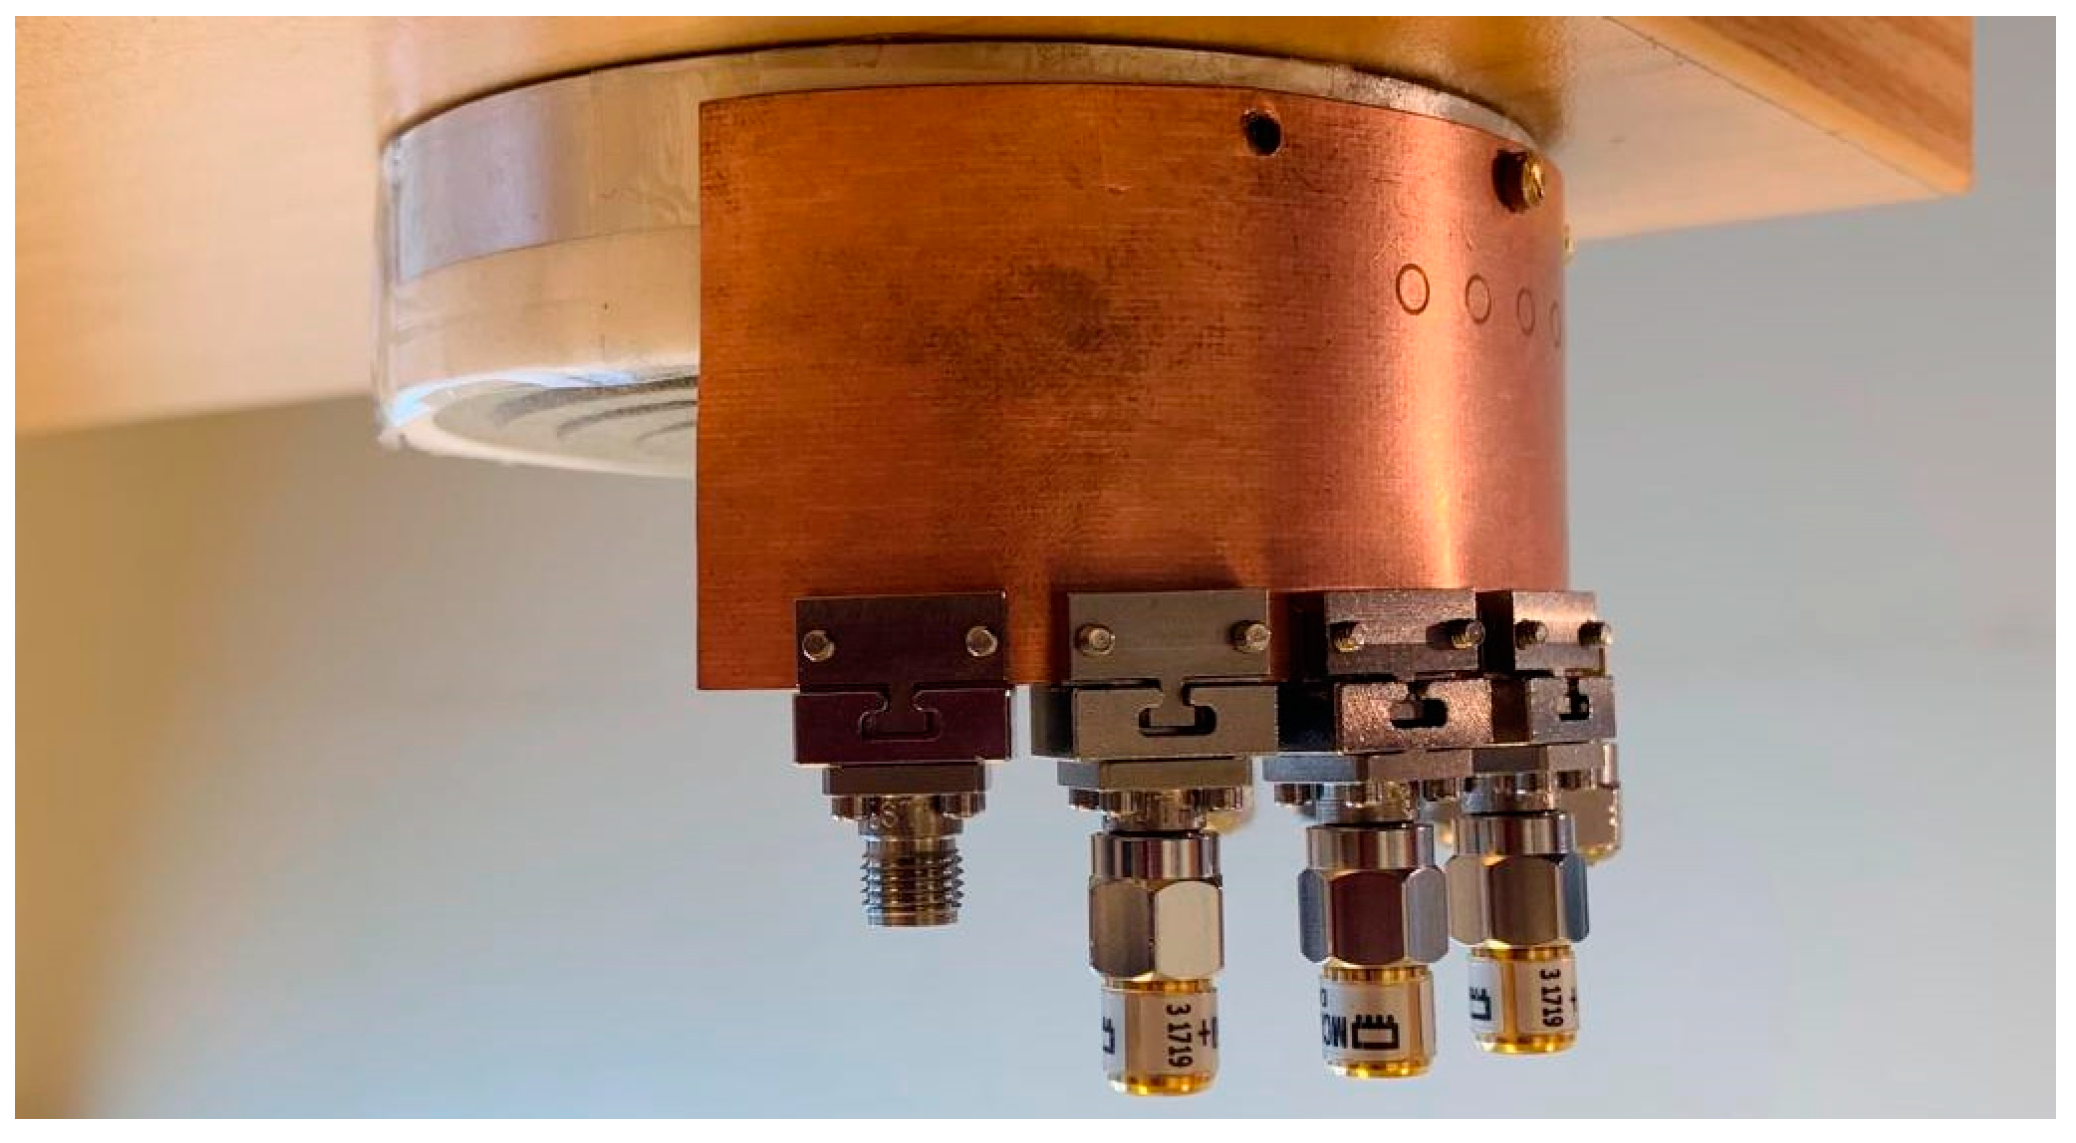
The number of patch antennas is then increased to nine: the simulation model is as shown in Figure 25 and the fabricated model is as shown in Figure 26. In practice, the antenna is fed by a much smaller connector; therefore, the transmission lines in this configuration are used solely to confirm beam overlap by measuring its radiation pattern.
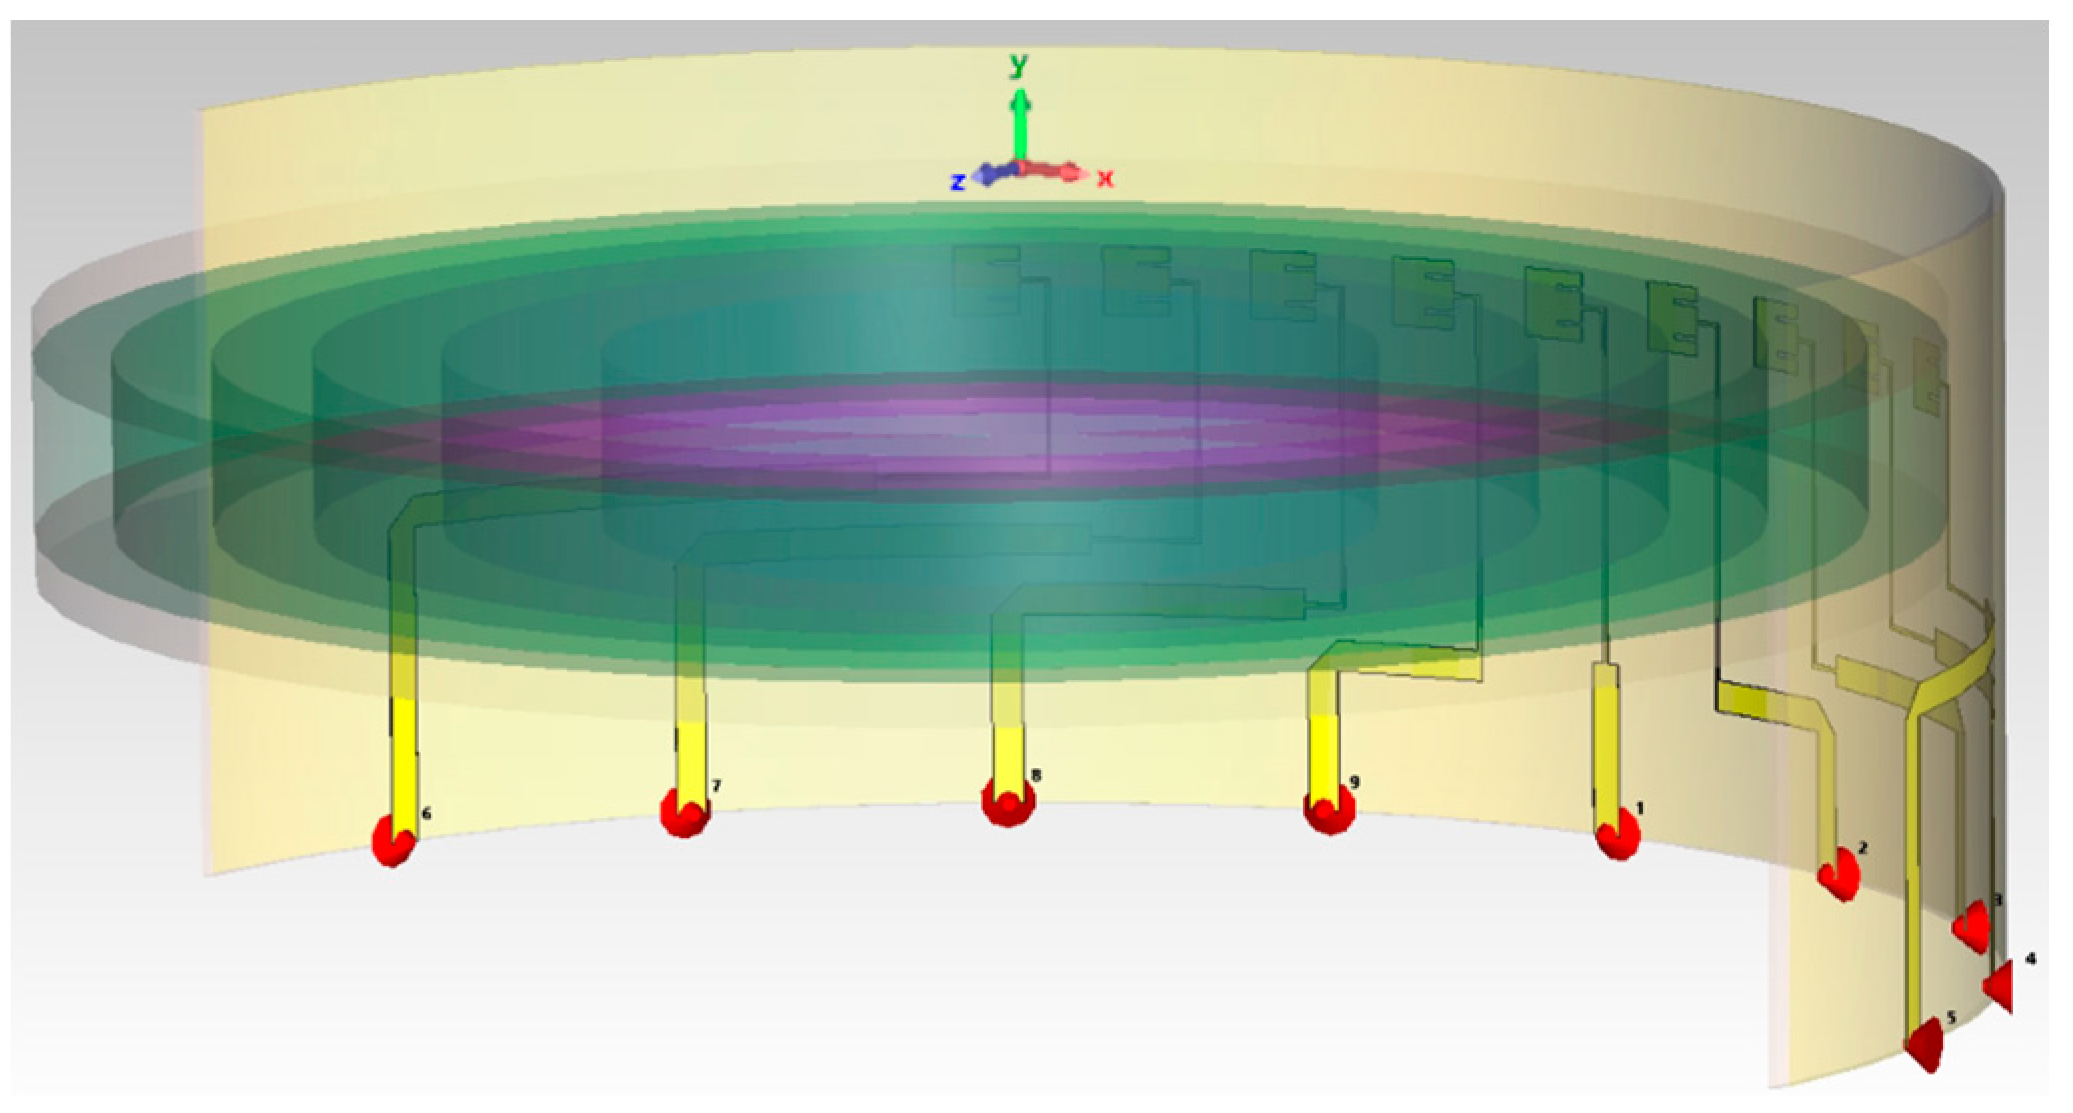
Next, the simulation model of the nine-element patch antenna feeding the Luneburg lens is as shown in Figure 27. The antenna structure is bent according to the curve of the lens to ensure that each patch antenna is perpendicular to the center of the lens. Figure 28 shows the patch antenna fixed to the metal plate of the Luneburg lens. This is completed so that the position of the patch antenna will not shift during the measurement process.
For clarity, only the S-parameters of the center patch and the patches on the right side of the structure are measured and shown. This is because the antenna structure is near symmetrical and the difference between the right patches and the left patches are negligible. To get the measured performance pattern of the nine-element MPA, every element is excited individually while the rest of the elements are terminated using 50 Ω load termination.
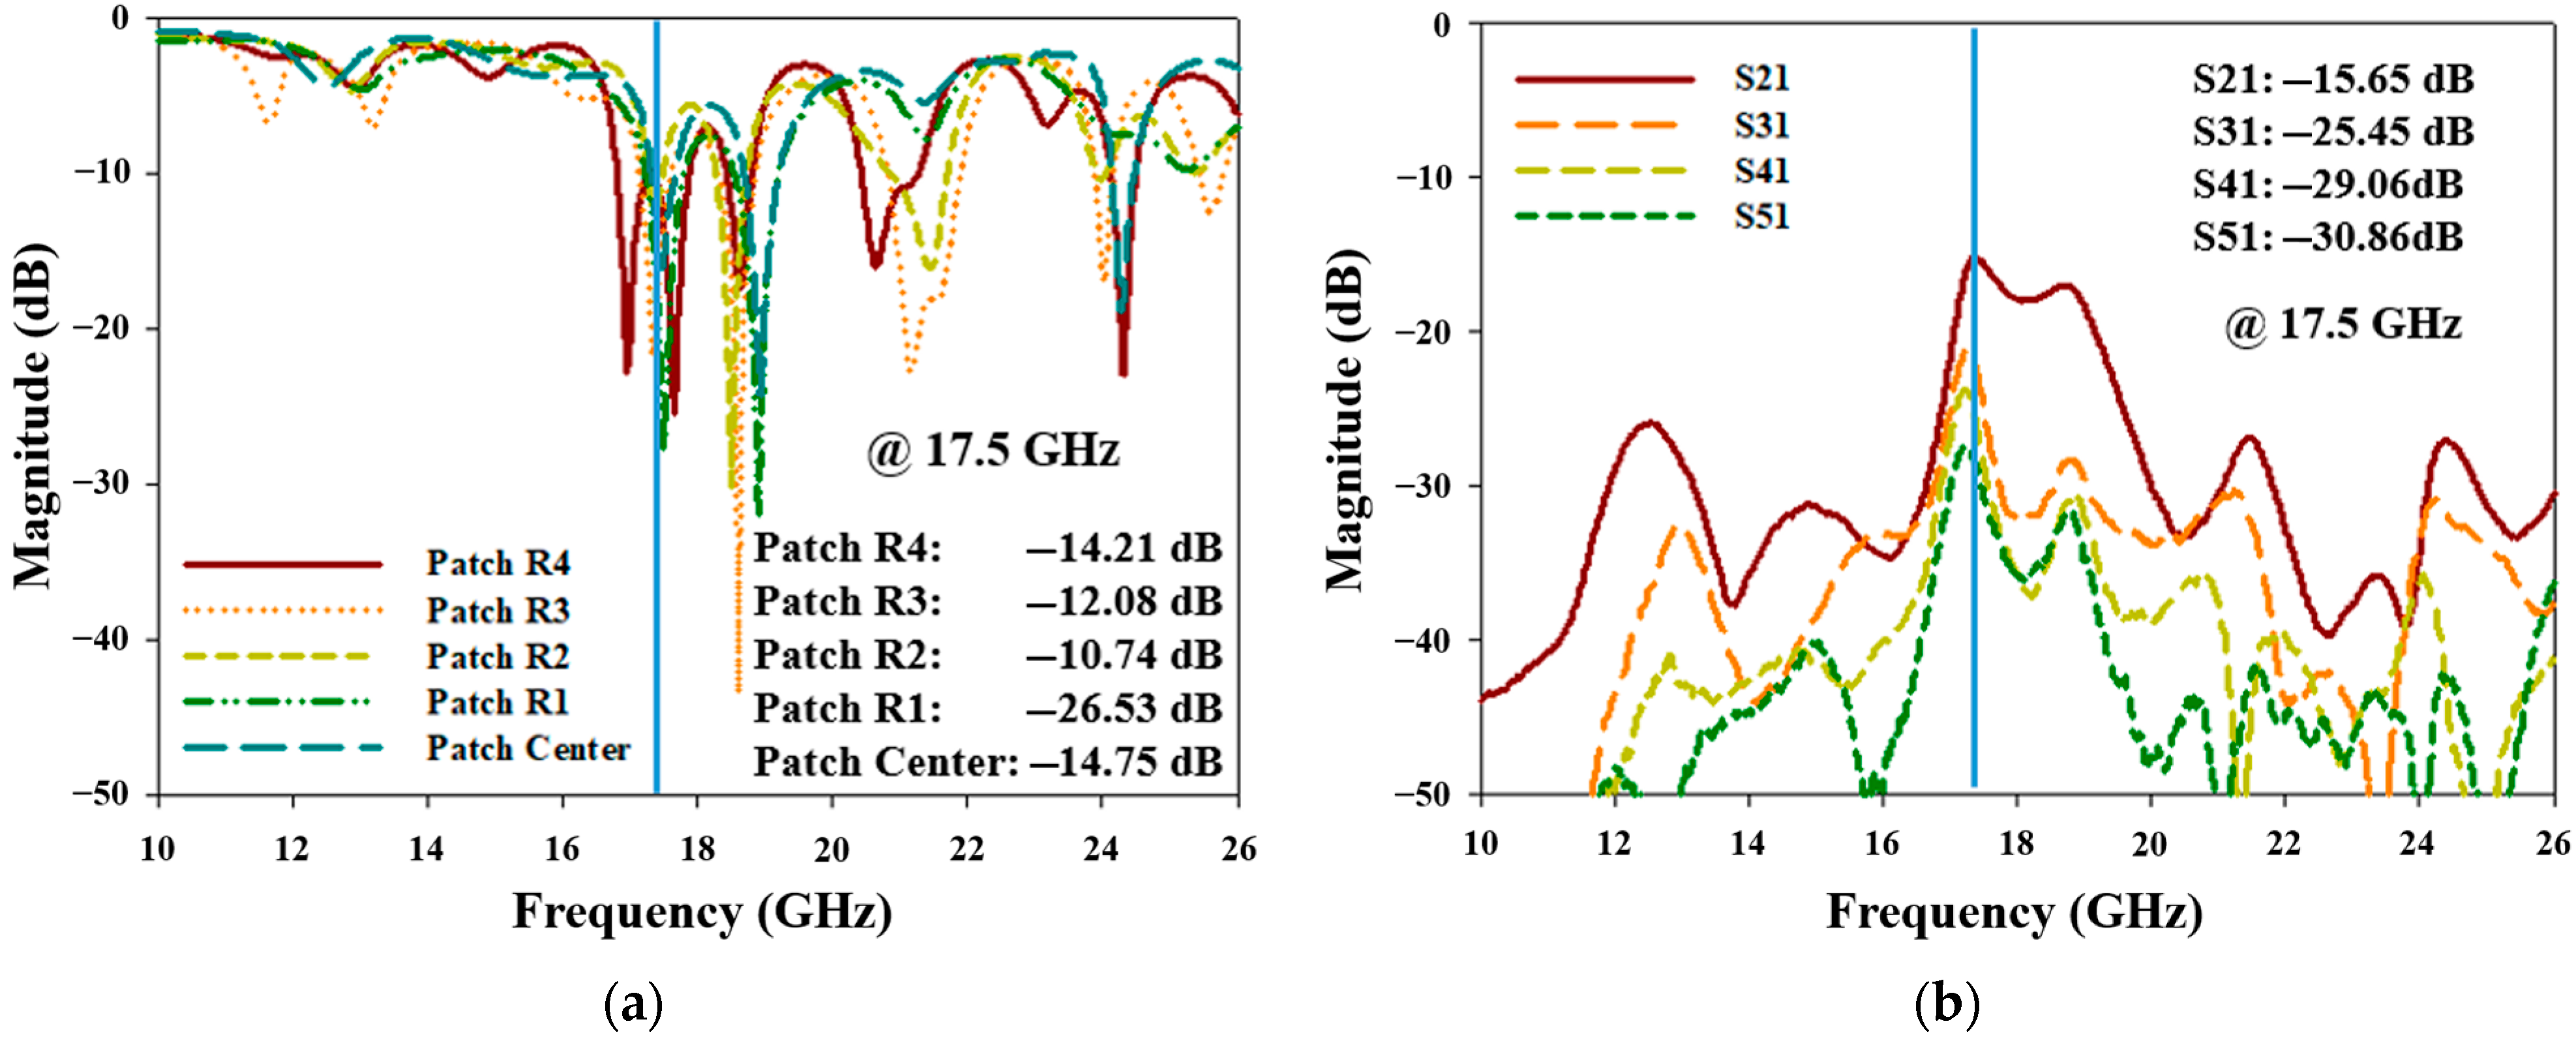
The performance of the antenna is measured on two conditions: on its own and attached to the Luneburg lens. The measured reflection coefficient of the right side of the structure on its own is as shown in Figure 29a and the transmission coefficient of the structure is as shown in Figure 29b. The center patch is denoted as port 1, patch R1 is port 2, patch R2 is port 3, patch R3 is port 4, and finally patch R4 is port 5. For the transmission coefficient graph, only the coupling between the elements on the right with the center patch are shown because the structure has the highest coupling on the center patch, and the element with the lowest coupling is the leftmost element and the rightmost element. From the graph, it is assumed that the elements on the left will have similar behavior where the coupling between the center patch and Patch L1 would be higher compared to the coupling between the center patch and Patch L4.
From the reflection coefficient graph, the antenna shows a +0.5 GHz shift, which could be due to simulation accuracy (huge memory needed to simulate nine ports at the same time) or fabrication error. At 17.5 GHz, it can be concluded that the coupling between the neighboring patches can be considered low at maximum value of −15.65 dB.
Next, the patch is fixed on the fabricated Luneburg lens structure and the S-parameter of the antenna is as shown in Figure 30. From the graph, the reflection coefficient shown in Figure 30a depicts a narrower bandwidth; however, it still succeeds to resonate at 17.5 GHz frequency. The slight change might be due to the position and condition of the patch antenna that has been curved to follow the shape of the Luneburg lens. On the other hand, the transmission coefficient as shown in Figure 30b shows a slightly better coupling effect compared to when measured on its own at maximum value of −16.21 dB.
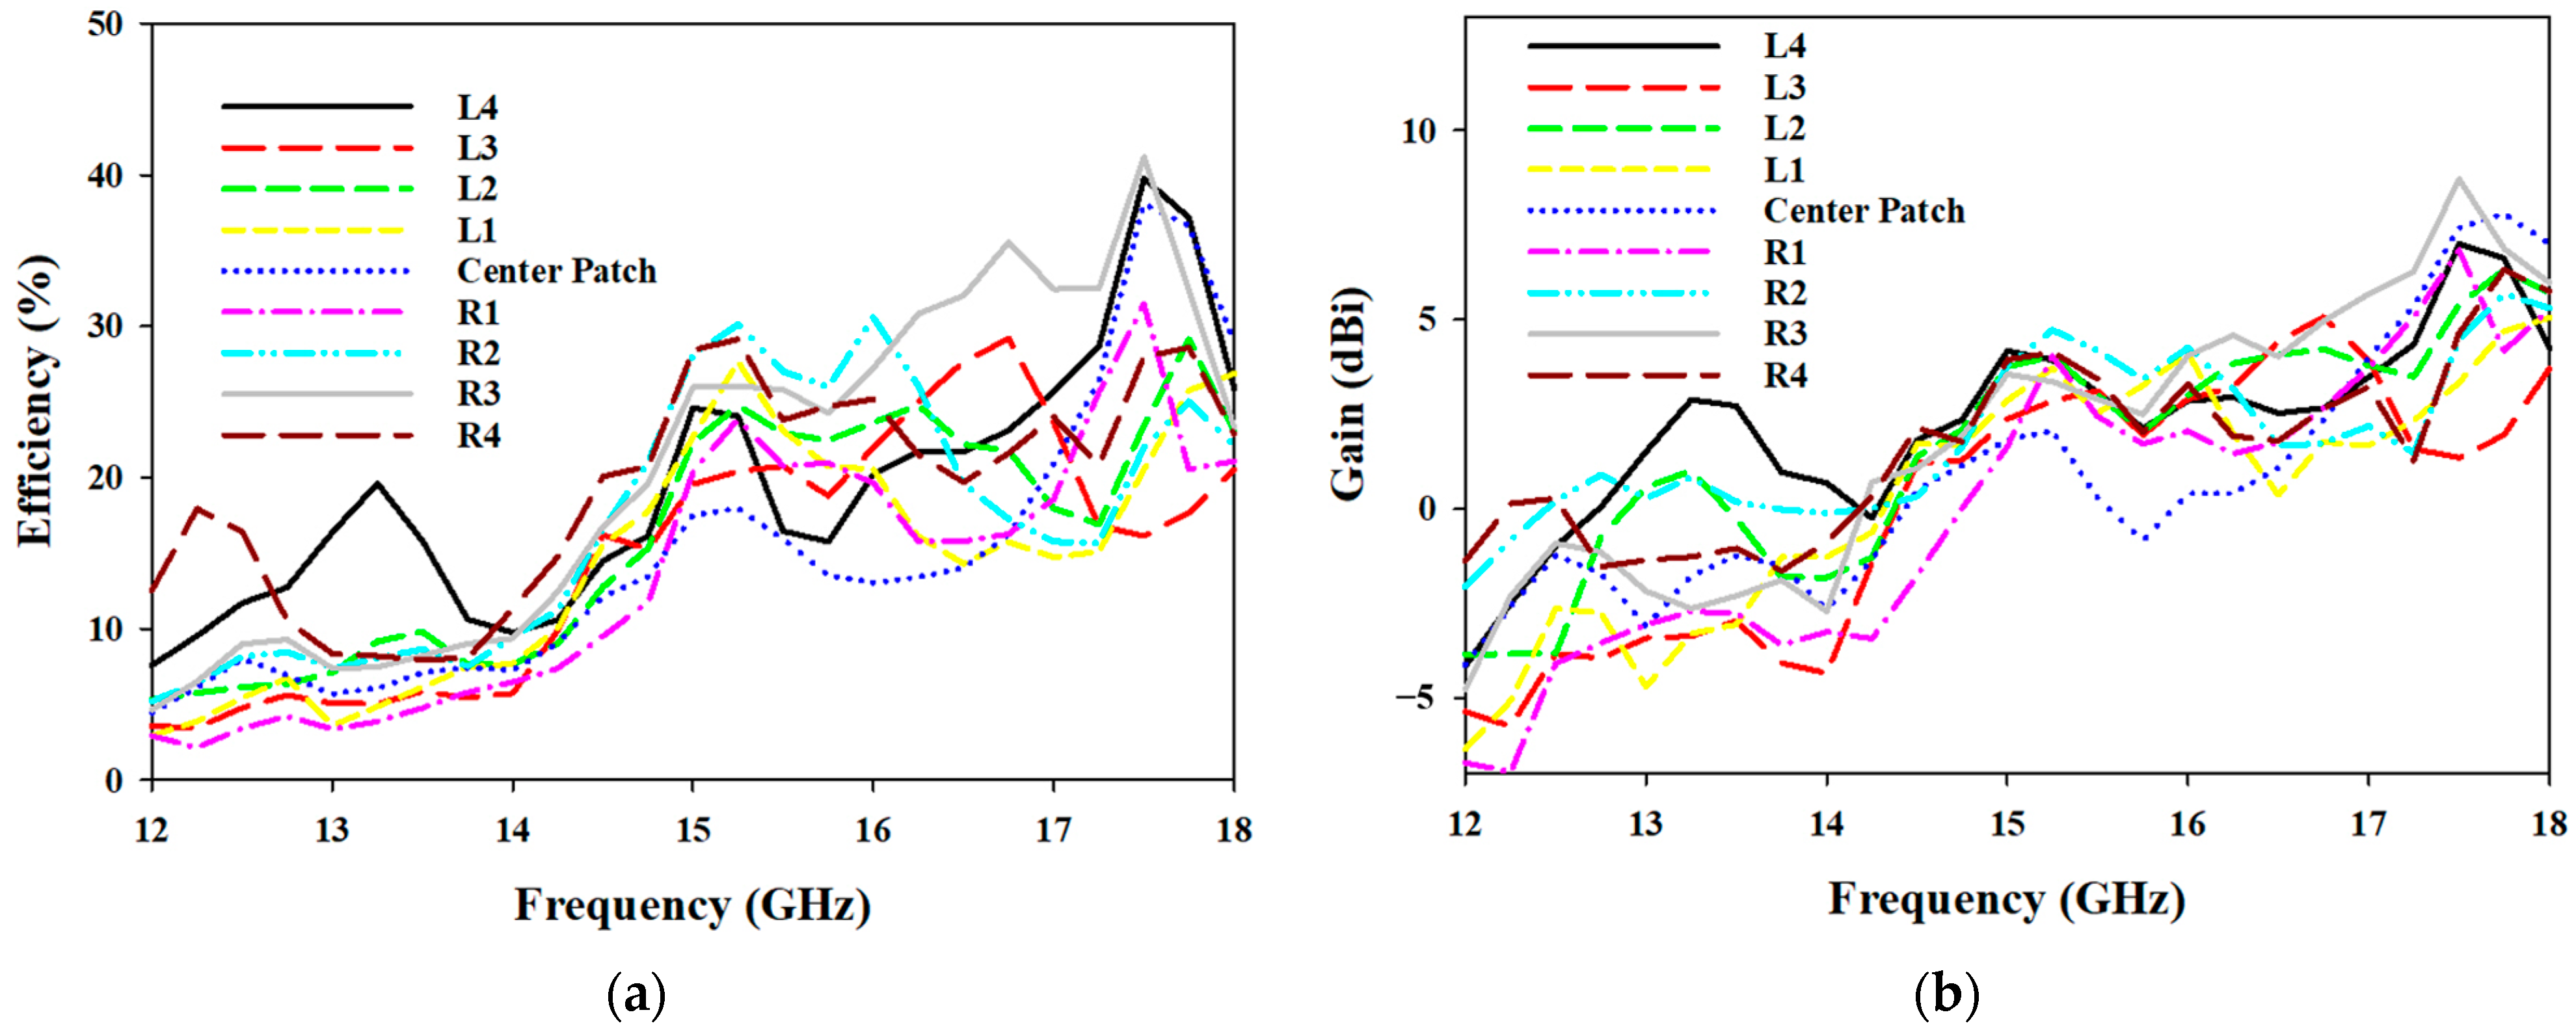
Unlike the S-parameter measurement process, the measurement of the radiation pattern of the structure is completed for every patch to determine and confirm the beam angle for each patch. This is performed because the radiation patterns of individual elements in small arrays vary greatly. Thus, the radiation pattern of all the elements in the small array are calculated and measured separately. The radiation pattern measurement process is performed using the StarLab reverberation chamber and Figure 31 shows the measured gain and efficiency of the elements. From the graphs, taking the center patch for example, at 17.5 GHz frequency, the structure achieved a measured gain of 7 dBi with 38% efficiency compared to the simulated gain of 10 dBi with 63% efficiency. The 3 dB gain loss is due to the long transmission lines, accumulative coupling between patch elements, and possible radiation from the large connectors. This loss can be reduced by removing the large transmission lines and exciting the patch antennas with an active solution using switches placed near the patch elements. With this solution, which is a work in progress, the number of parasitic elements is minimized, and the measured efficiency of the antenna will increase.
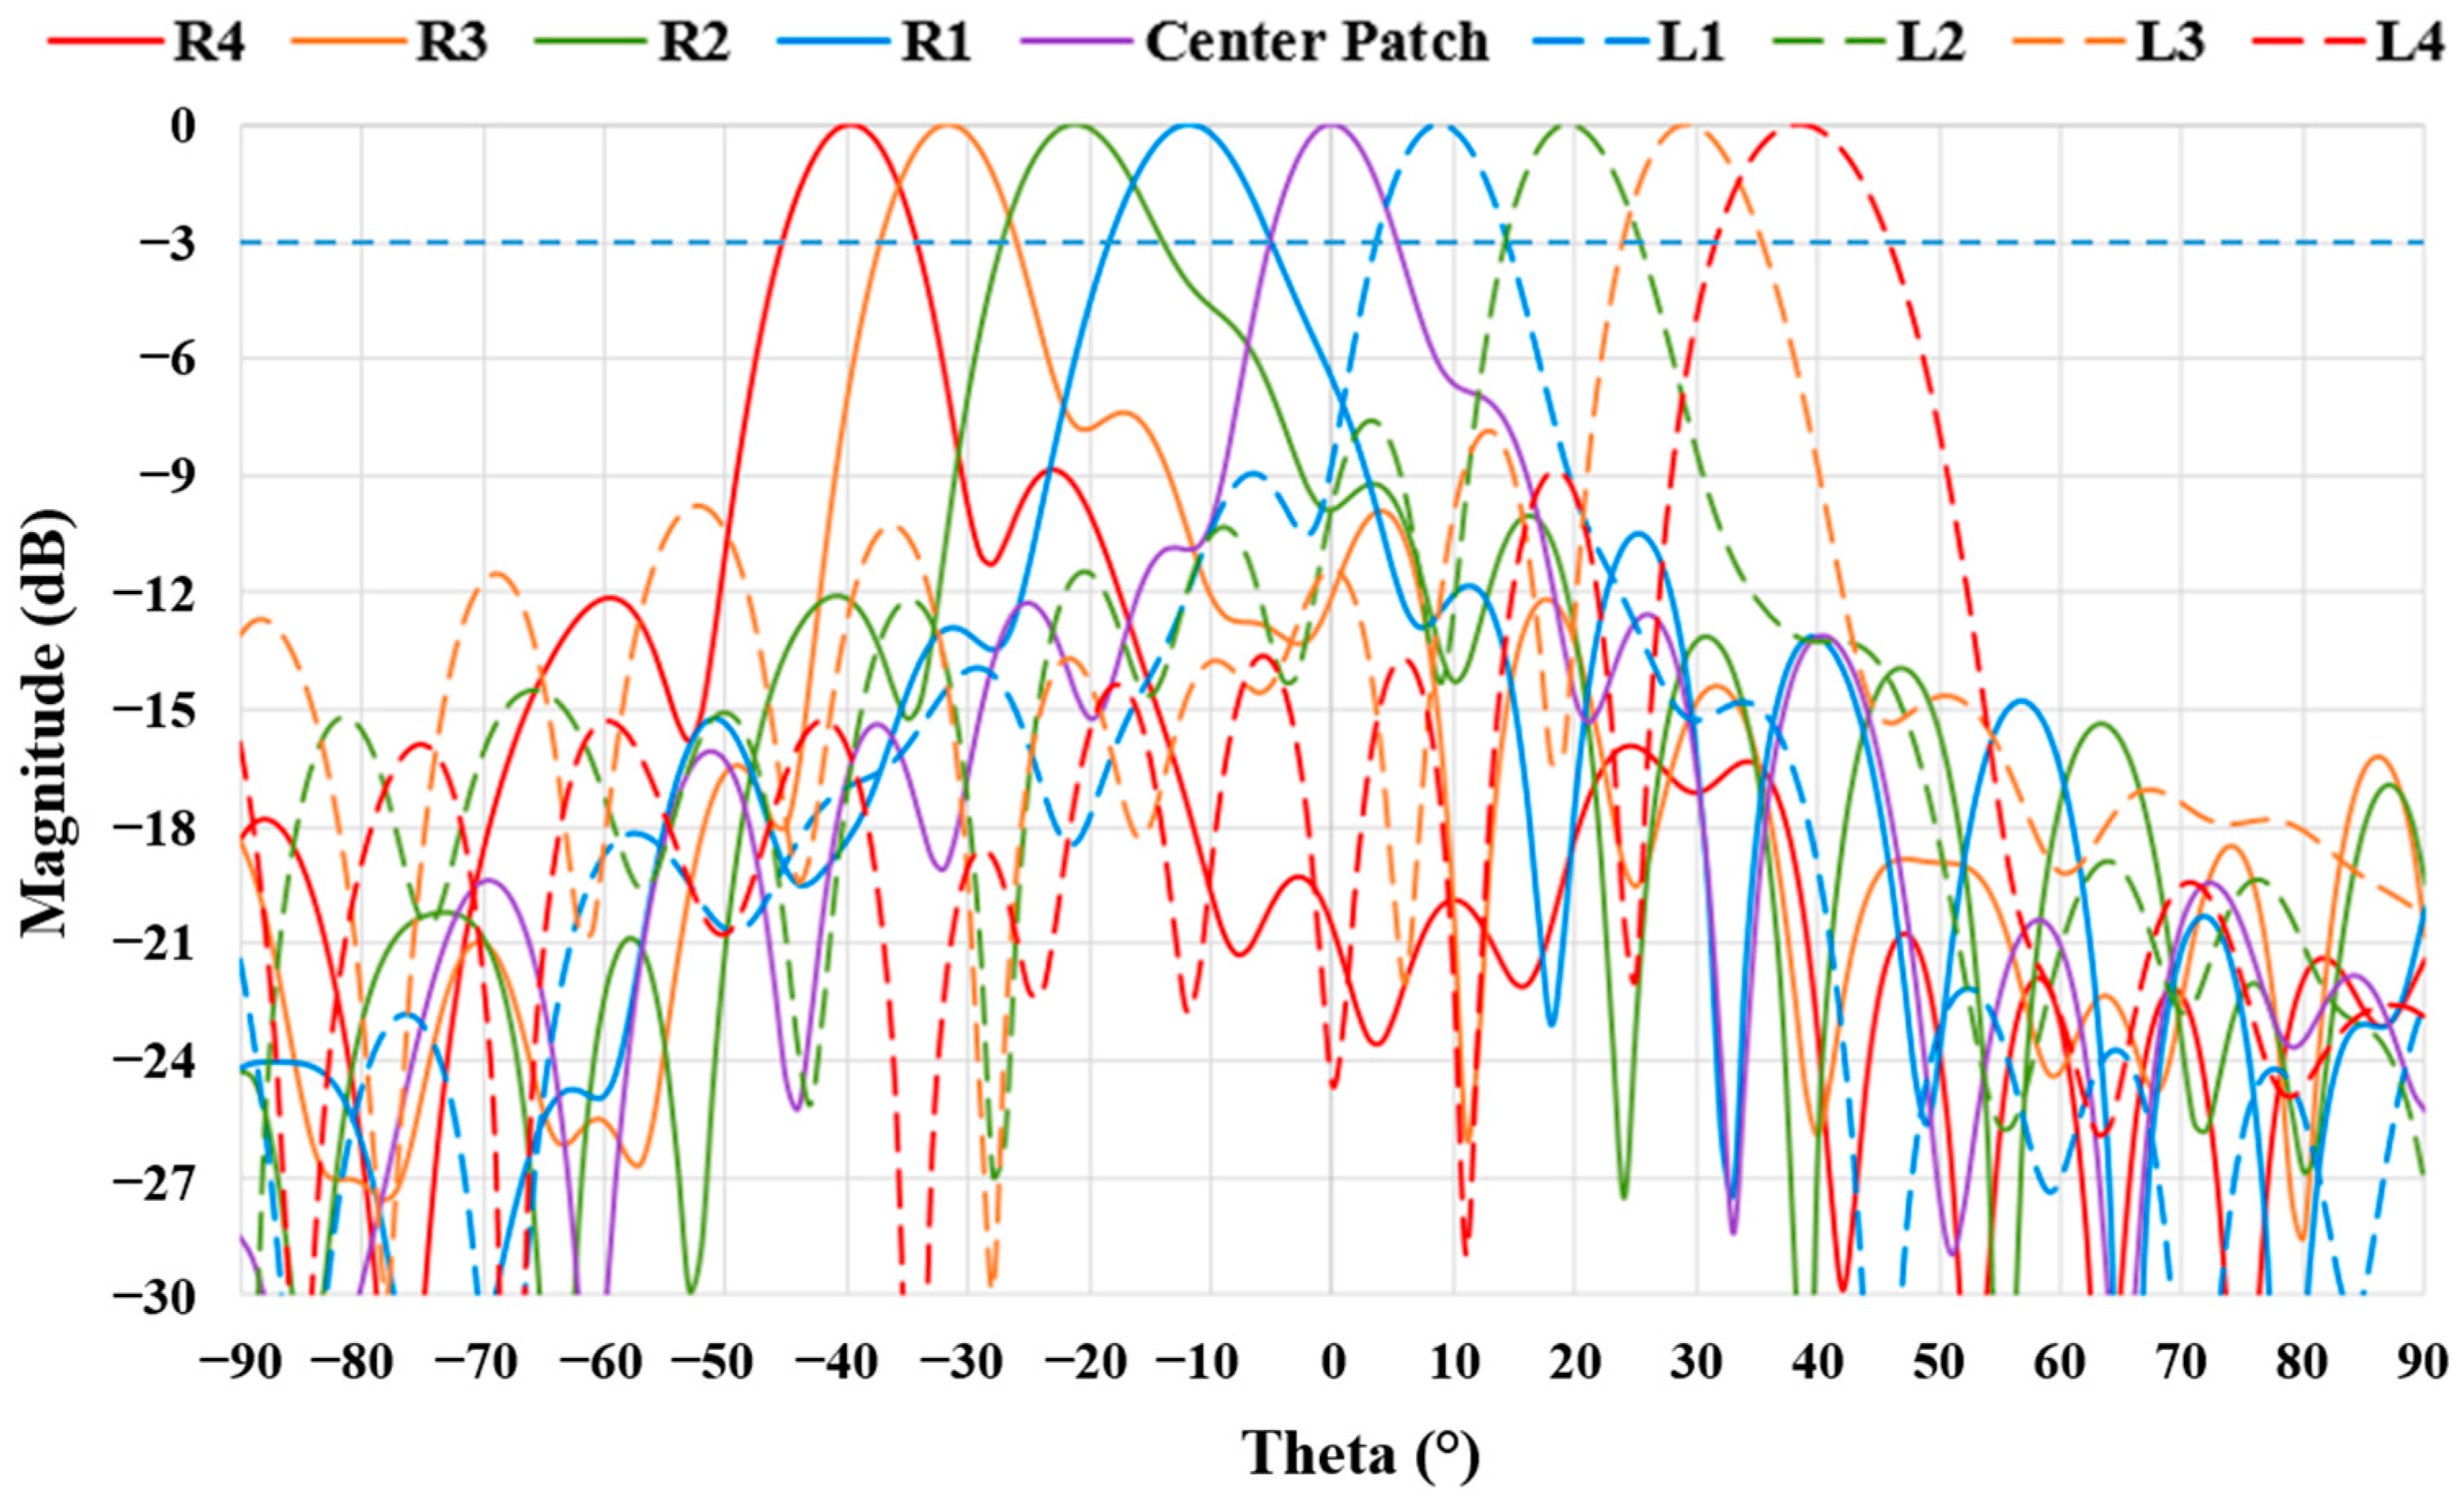
The radiation pattern of the nine-element patch antenna feeding the Luneburg lens is as shown in Figure 32. From the graph, the beam overlaps at −3 dB is apparent at 17.5 GHz frequency with maximum side lobe level at −7 dB. The measured radiation pattern shows better performance compared to the simulated radiation pattern with the best beam overlap at −1.5 dB for elements R4 with R3 and elements L3 with L4. At worst, the structure attained beam overlap at −3 dB for elements R1 and the center patch. The beam overlapped at −1.5 dB instead of the calculated −3 dB is due to the radiation from parasitic elements such as the long microstrip transmission line, large connector components, and even from neighboring patches due to coupling. On the other hand, this proves that with the developed compact patch antenna feeding the Luneburg lens, beam overlap at −3 dB, is achieved.
The summary of the performance of the antenna is listed in Table 2 below.

3. Conclusions

This paper presents a plate Luneburg lens designed to achieve a narrow beam (10°) for H-plane and a wide beam (30°) for E-plane. To prove this, the lens is fed by a standard waveguide WR62, and the result shows a beamwidth of 12.4° at 17 GHz. Then, a formula to achieve beamforming or beam-scanning characteristics is proposed. To ensure that the calculation is right, the number of waveguides to feed the lens increased and the beam failed to overlap as expected. On the other hand, a compact microstrip patch antenna with CSRR is developed to feed the lens. The reduced size MPA with CSRR has horizontal polarization at 17 GHz frequency. To feed the Luneburg lens, the antenna is rotated to 90° at z-axis. To achieve beamforming and beam-scanning capability, the number of elements of the antenna is increased to nine with 0.408λ distance between the patches. From the radiation pattern results, the antennas achieved a 10.9° beamwidth and confirmed to overlap at −3 dB with a gain of 12 dBi. The small size of the patch antenna makes it possible to have good beam overlap while placing the structures next to each other with a maximum angle of rotation tangential to the focal point of the lens.

Author Contributions

Conceptualization, N.M.N., M.H. and M.K.A.R.; validation, M.H., M.K.A.R., N.A.M., O.A. and O.L.; investigation, N.M.N.; writing—original draft preparation, N.M.N.; writing—review and editing, M.H., M.K.A.R., N.A.M., O.A. and O.L.; supervision, M.H., M.K.A.R., N.A.M. and O.A. All authors have read and agreed to the published version of the manuscript.

Funding

This research received no external funding.

Data Availability Statement

Not applicable.

Acknowledgments

This work was supported by the Mobility Grant from Rennes Metropole, the European Union through the European Regional Development Fund, the French Ministry of Higher Education and Research, the Region Bretagne, the CPER Project 2015–2020 SOPHIE/STIC, and partly by Ondes. The authors would also like to thank the Malaysian Ministry of Higher Education, Universiti Teknologi Malaysia, Research Management Centre, and Faculty of Electrical Engineering for the support of the research under Grant No. 09G19 and FRGS/1/2021/TKO/UTM/01/7.

Conflicts of Interest

The authors declare no conflict of interest.

References

  1. Lee, K.F.; Tong, K.-F. Microstrip Patch Antennas. In Handbook of Antenna Technologies; Springer: Singapore, 2016; pp. 787–852. [Google Scholar]
  2. Christina, G. A Review on Novel Microstrip Patch Antenna Designs and Feeding Techniques. IRO J. Sustain. Wirel. Syst. 2022, 4, 110–120. [Google Scholar] [CrossRef]
  3. Chen, Z.N.; Qing, X. Slotted microstrip antennas for circular polarization with compact size. IEEE Antennas Propag. Mag. 2013, 55, 124–137. [Google Scholar]
  4. Islam, M.T.; Shakib, M.N.; Misran, N.; Yatim, B. Analysis of broadband slotted microstrip patch antenna. In Proceedings of the 2008 11th International Conference on Computer and Information Technology, Khulna, Bangladesh, 24–27 December 2008; IEEE: Piscataway, NJ, USA, 2008; pp. 758–761. [Google Scholar]
  5. Li, S.J.; Han, B.W.; Li, Z.Y.; Liu, X.B.; Huang, G.S.; Li, R.Q.; Cao, X.Y. Transmissive coding metasurface with dual-circularly polarized multi-beam. Opt. Express 2022, 30, 26362–26376. [Google Scholar] [CrossRef]
  6. Li, S.; Li, Z.; Liu, X.; He, C.; Huang, G.; Li, R.; Cao, X. Transmissive digital coding metasurfaces for polarization-dependent dual-mode quad orbital angular momentum beams. ACS Appl. Mater. Interfaces 2023, 15, 23690–23700. [Google Scholar] [CrossRef] [PubMed]
  7. Atanasov, A.N.; Alink, M.S.; Van Vliet, F.E. A figure of merit for simultaneous-multi-beam transmit antenna arrays. IEEE Trans. Radar Syst. 2023, 1, 60–68. [Google Scholar] [CrossRef]
  8. Adane, A.; Gallée, F.; Person, C.; Puyal, V.; Villeneuve, C.; Dragomirescu, D. Implementation of broadband microstrip-U coupled patch array on Si/BCB membrane for beamforming applications at 60 GHz. In Proceedings of the 5th European Conference on Antennas and Propagation (EUCAP), Rome, Italy, 11–15 April 2011; IEEE: Piscataway, NJ, USA, 2011; pp. 1263–1267. [Google Scholar]
  9. Schulwitz, L.; Mortazawi, A. A new low loss Rotman lens design using a graded dielectric substrate. IEEE Trans. Microw. Theory Tech. 2008, 56, 2734–2741. [Google Scholar] [CrossRef]
  10. Bor, J.; Lafond, O.; Merlet, H.; Le Bars, P.; Himdi, M. Technological process to control the foam dielectric constant application to microwave components and antennas. IEEE Trans. Compon. Packag. Manuf. Technol. 2014, 4, 938–942. [Google Scholar] [CrossRef] [Green Version]
  11. Lafond, O.; Himdi, M.; Bor, J.; Jouadé, A. Inhomogeneous Lens Antenna using Pressed Foam Technological Process in MM Wave Range. In Proceedings of the 2018 IEEE Conference on Antenna Measurements & Applications (CAMA), Västerås, Sweden, 3–6 September 2018; IEEE: Piscataway, NJ, USA, 2018; pp. 1–4. [Google Scholar]
  12. Chen, J.; Chu, H.; Huang, Y.; Lai, Y.; Chen, M. Ultra-wideband Luneburg lens with high performance based on gradient metamaterials. J. Phys. D Appl. Phys. 2022, 55, 355109. [Google Scholar] [CrossRef]
  13. Chang, S.C.; Chou, H.T.; Huang, H.J. 2-D Luneburg lens beamforming network for planar phased array of antennas to radiate near-field focused multibeams. IEEE Trans. Antennas Propag. 2020, 68, 5904–5915. [Google Scholar] [CrossRef]
  14. Zetterstrom, O.; Fonseca, N.J.; Quevedo-Teruel, O. Compact half-Luneburg lens antenna based on a glide-symmetric dielectric structure. IEEE Antennas Wirel. Propag. Lett. 2022, 21, 2283–2287. [Google Scholar] [CrossRef]
  15. Mahmoud, A.; Ruiz-García, J.; de Sagazan, O.; Ettorre, M.; Sauleau, R.; González-Ovejero, D. Low-Cost and Low-Profile Sub-Terahertz Luneburg Lens Beamformer on Polymer. IEEE Antennas Wirel. Propag. Lett. 2023, 22, 1411–1415. [Google Scholar] [CrossRef]
  16. Emerson, A.J.; Cuming, A.J. Stepped-index Lüneberg lenses: Antennas and reflective devices. Electron. Des. 1960, 8, 86–89. [Google Scholar]
  17. Fuchs, B.; Le Coq, L.; Lafond, O.; Rondineau, S.; Himdi, M. Design optimization of multishell Luneburg lenses. IEEE Trans. Antennas Propag. 2007, 55, 283–289. [Google Scholar] [CrossRef]
  18. Hu, B.; Wu, T.; Cai, Y.; Zhang, W.; Zhang, B.L. A novel metamaterial-based planar integrated luneburg lens antenna with wide bandwidth and high gain. IEEE Access 2019, 8, 4708–4713. [Google Scholar] [CrossRef]
  19. Lafond, O.; Himdi, M.; Merlet, H.; Lebars, P. An active reconfigurable antenna at 60 GHz based on plate inhomogeneous lens and feeders. IEEE Trans. Antennas Propag. 2012, 61, 1672–1678. [Google Scholar] [CrossRef]
  20. Brookner, E. (Ed.) Practical Phased-Array Antenna Systems; Artech House: Norwood, MA, USA, 1991. [Google Scholar]
  21. Luneburg, R. Mathematical Theory of Optics; University of California Press: Berkeley, CA, USA, 1966. [Google Scholar]
  22. Nadzir, N.M.; Rahim, M.K.A.; Murad, N.A.; Himdi, M.; Ayop, O. Circular Complementary Split Ring Resonator Rotation for Linear Array Millimeter Wave Microstrip Patch Antenna. ELEKTRIKA-J. Electr. Eng. 2021, 20, 43–47. [Google Scholar] [CrossRef]
  23. Roshani, S.; Shahveisi, H. Mutual Coupling Reduction in Microstrip Patch Antenna Arrays Using Simple Microstrip Resonator. Wirel. Pers. Commun. 2022, 126, 1665–1677. [Google Scholar] [CrossRef]
  24. Dewan, R.; Rahim, M.K.; Hamid, M.R.; Jalil, M.E.; Majid, H.A. Mutual Coupling Reduction in Antenna Using EBG on Double Substrate. TELKOMNIKA Telecommun. Comput. Electron. Control 2017, 15, 799–804. [Google Scholar]
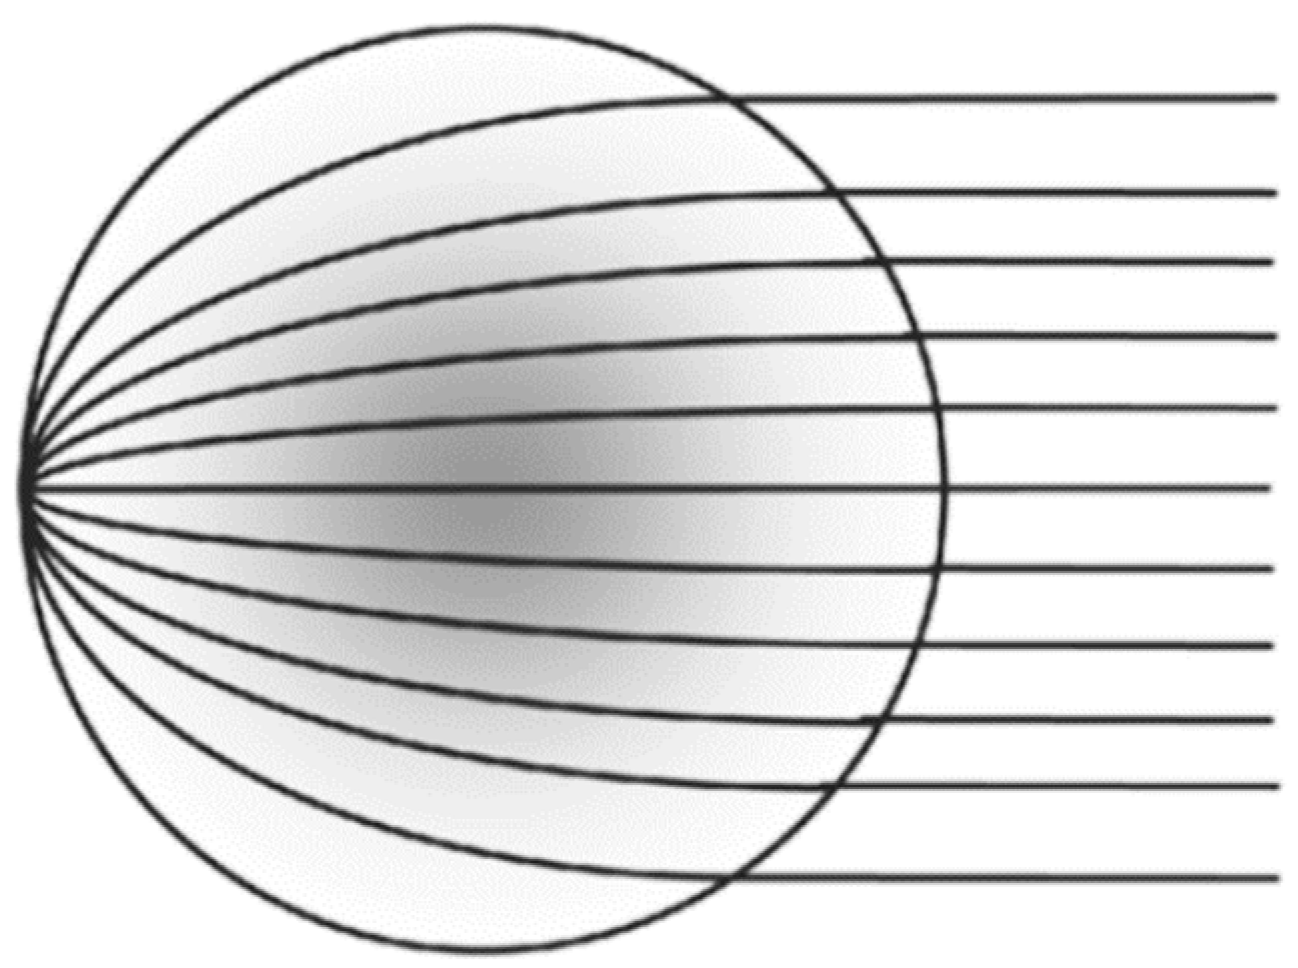
Figure 1. Ray tracing inside a Luneburg lens [10].
Electronics 12 03028 g001
Figure 2. A cross-section of lens with multiple shells [10].
Electronics 12 03028 g002
Figure 3. Permittivity inside lens vs. normalized radius for ideal law (bold line) and realized law (dashed line) [10].
Electronics 12 03028 g003
Figure 4. Simulation model of the plate Luneburg lens.
Electronics 12 03028 g004
Figure 5. Simulation model of the plate Luneburg lens fed by three WR62 waveguides.
Electronics 12 03028 g005
Figure 6. Simulated efficiencies of the lens fed by three WR62 waveguides.
Electronics 12 03028 g006
Figure 7. Simulated gain of the lens fed by three WR62 waveguides.
Electronics 12 03028 g007
Figure 8. Simulated radiation pattern at H-plane (φ = 0°, Eφ) of the lens fed by three WR62 waveguides at 17 GHz.
Electronics 12 03028 g008
Figure 9. (a) Fabricated plate Luneburg lens and (b) the lens in between two metal plates ready to be measured.
Electronics 12 03028 g009
Figure 10. Comparison between the simulated and measured (a) H-plane and (b) E-plane at 17 GHz of the developed Luneburg lens fed by a waveguide.
Electronics 12 03028 g010
Figure 11. Measured directivity and gain of the Luneburg lens fed by a WR62 waveguide.
Electronics 12 03028 g011
Figure 12. Measured efficiency of the Luneburg lens fed by a WR62 waveguide.
Electronics 12 03028 g012
Figure 13. The Luneburg lens with one feeder antenna.
Electronics 12 03028 g013
Figure 14. The Luneburg lens with two feeder antennas.
Electronics 12 03028 g014
Figure 15. A Cartesian plot of two beams overlapping at −3 dB at H-plane.
Electronics 12 03028 g015
Figure 16. (a) Regular MPA at 17 GHz with full ground plane, (b) reduced size MPA with CSRR, and (c) ground plane of the reduced size MPA with CSRR.
Electronics 12 03028 g016
Figure 17. The comparison between the reflection coefficients, S11, of the regular MPA and the reduced size MPA with CSRR.
Electronics 12 03028 g017
Figure 18. The comparison between the simulated efficiency of the regular MPA and the reduced size MPA with CSRR.
Electronics 12 03028 g018
Figure 19. The comparison between the simulated gain of the regular MPA and the reduced size MPA with CSRR.
Electronics 12 03028 g019
Figure 20. The polar plot of the regular MPA at 17 GHz at (a) H-plane (φ = 0°, Eφ = co, Eθ = cross) and at (b) E-plane (φ = 90°, Eφ = cross, Eθ = co).
Electronics 12 03028 g020
Figure 21. The polar plot of the reduced size MPA with CSRR at 17 GHz at (a) H-plane (φ = 0°, Eφ = co, Eθ = cross) and at (b) E-plane (φ = 90°, Eφ = cross, Eθ = co).
Electronics 12 03028 g021
Figure 22. The polarization of (a) the regular MPA and (b) the reduced size MPA with CSRR.
Electronics 12 03028 g022
Figure 23. The simulation model of the plate Luneburg lens fed by three reduced size MPA with CSRR rotated to 90° at z-axis.
Electronics 12 03028 g023
Figure 24. Simulated radiation pattern in H-plane (φ = 0°, Eφ) of the plate Luneburg lens fed by three reduced size MPA with CSRR at 17 GHz.
Electronics 12 03028 g024
Figure 25. (a) Simulation model of a nine-element MPA with CSRR and (b) the ground plane.
Electronics 12 03028 g025
Figure 26. (a) Fabricated nine-element MPA with CSRR and (b) the ground plane.
Electronics 12 03028 g026
Figure 27. Simulation model of a nine-element MPA with CSRR feeding the Luneburg lens.
Electronics 12 03028 g027
Figure 28. Patch antenna feeding the Luneburg lens.
Electronics 12 03028 g028
Figure 29. The measured (a) reflection coefficient and (b) coupling between ports of the nine-element MPA with CSRR on its own.
Electronics 12 03028 g029
Figure 30. The measured (a) reflection coefficient and (b) coupling between ports of the nine-element MPA with CSRR feeding the Luneburg lens.
Electronics 12 03028 g030
Figure 31. The measured (a) antenna efficiency and (b) gain of the nine-element MPA with CSRR feeding the Luneburg lens.
Electronics 12 03028 g031
Figure 32. Measured radiation pattern of the nine-element MPA with CSRR feeding the Luneburg lens at 17.5 GHz.
Electronics 12 03028 g032
Table 1. The parameters of the regular MPA and the reduced size MPA at 17 GHz.
ParameterValue (λ)Value (mm)
Rsw0.85λ15
Rsl0.85λ15
Rw0.4λ7
Rl0.3λ5.6
Rr-2
s-0.2
sw0.45λ8
sl0.45λ8
w0.18λ3.2
l0.18λ3.1
r-1.45
r1or-1.6
r1ir-1.5
r2or-1.4
r2ir-1.3
g-0.2
Table 2. Summary of the performance of the antenna at 17 GHz.
AntennaOperating Frequency (GHz)Efficiency (%)Gain (dB)Beamwidth (°)
Regular MPA17807.1575.3
Reduced Size MPA17, 21.5, 2887.64.1289.2
Waveguide with Luneburg lens12–187515.7812.4
Reduced size MPA with Luneburg lens17, 21.5, 286310.8710.9
Disclaimer/Publisher’s Note: The statements, opinions and data contained in all publications are solely those of the individual author(s) and contributor(s) and not of MDPI and/or the editor(s). MDPI and/or the editor(s) disclaim responsibility for any injury to people or property resulting from any ideas, methods, instructions or products referred to in the content.