
Wavelet Threshold Ultrasound Echo Signal Denoising Algorithm Based on CEEMDAN


Abstract
1. Introduction
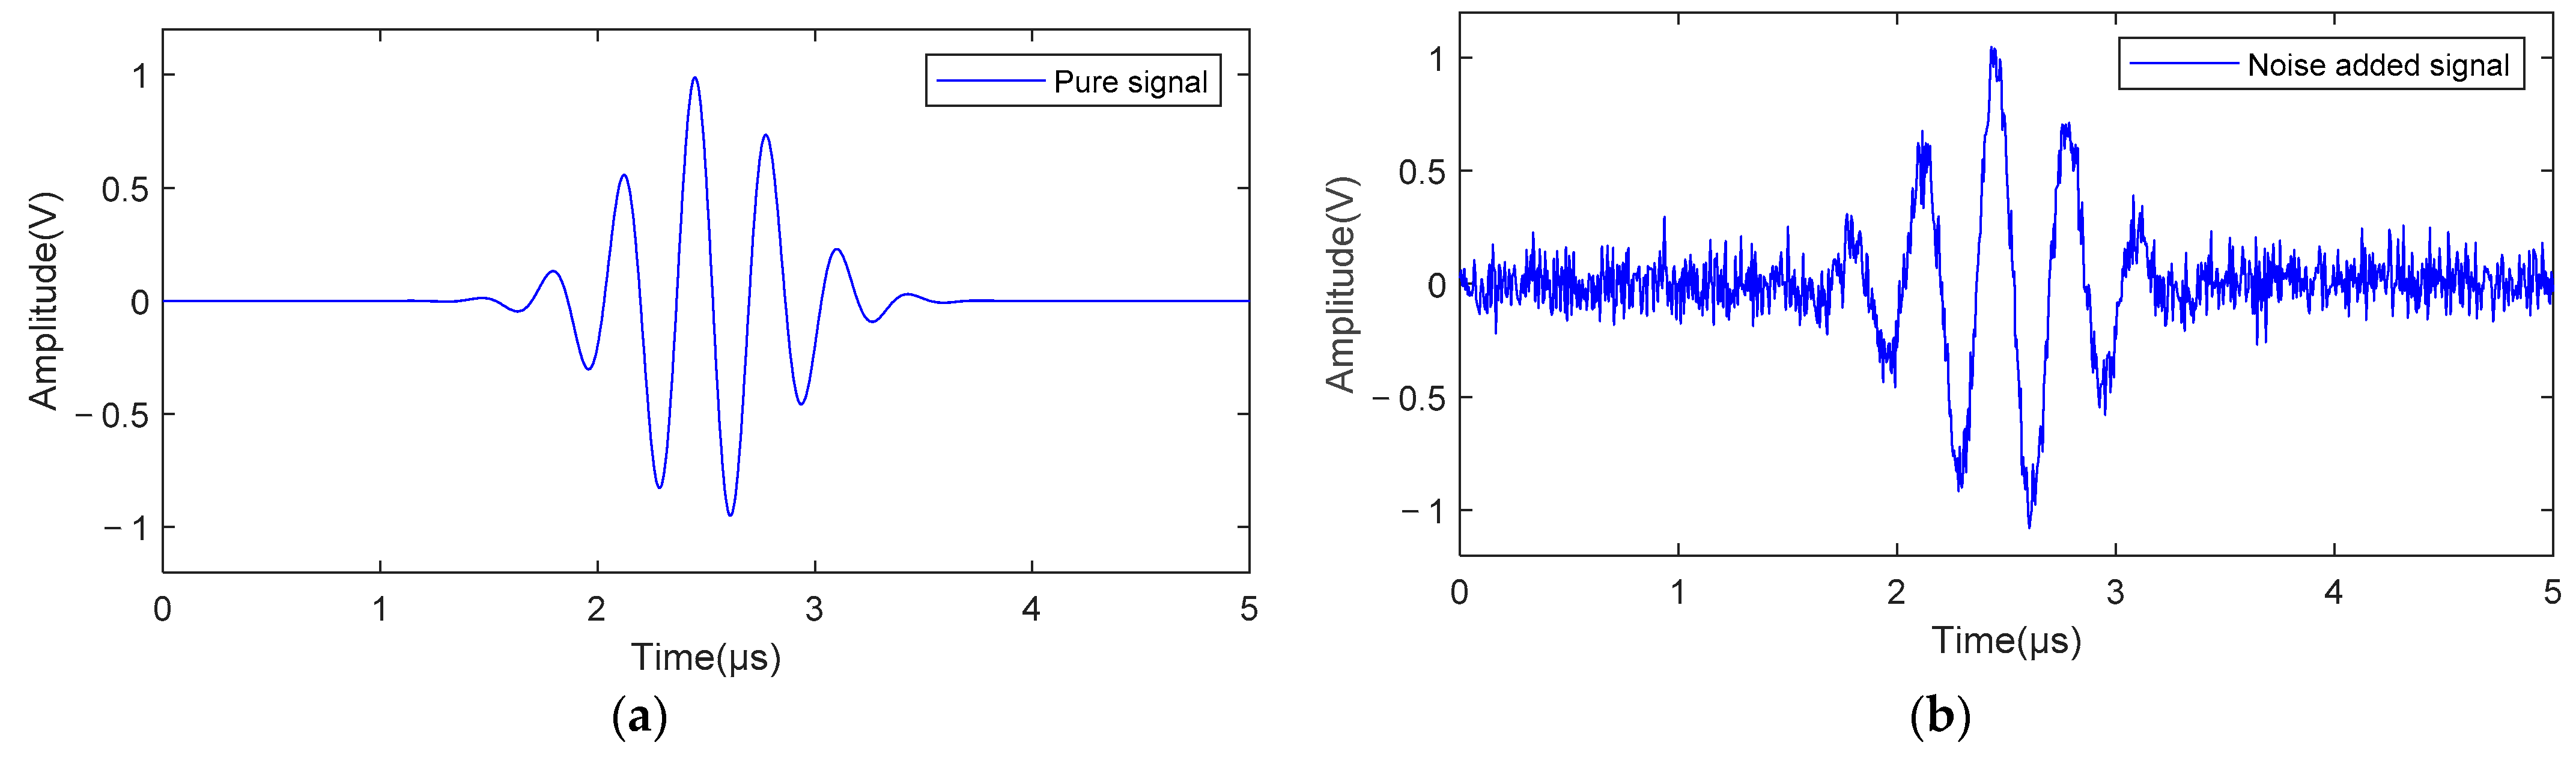
2. Establishing Ultrasonic Echo Signal Model
3. Method for Analysis of Echo Signals
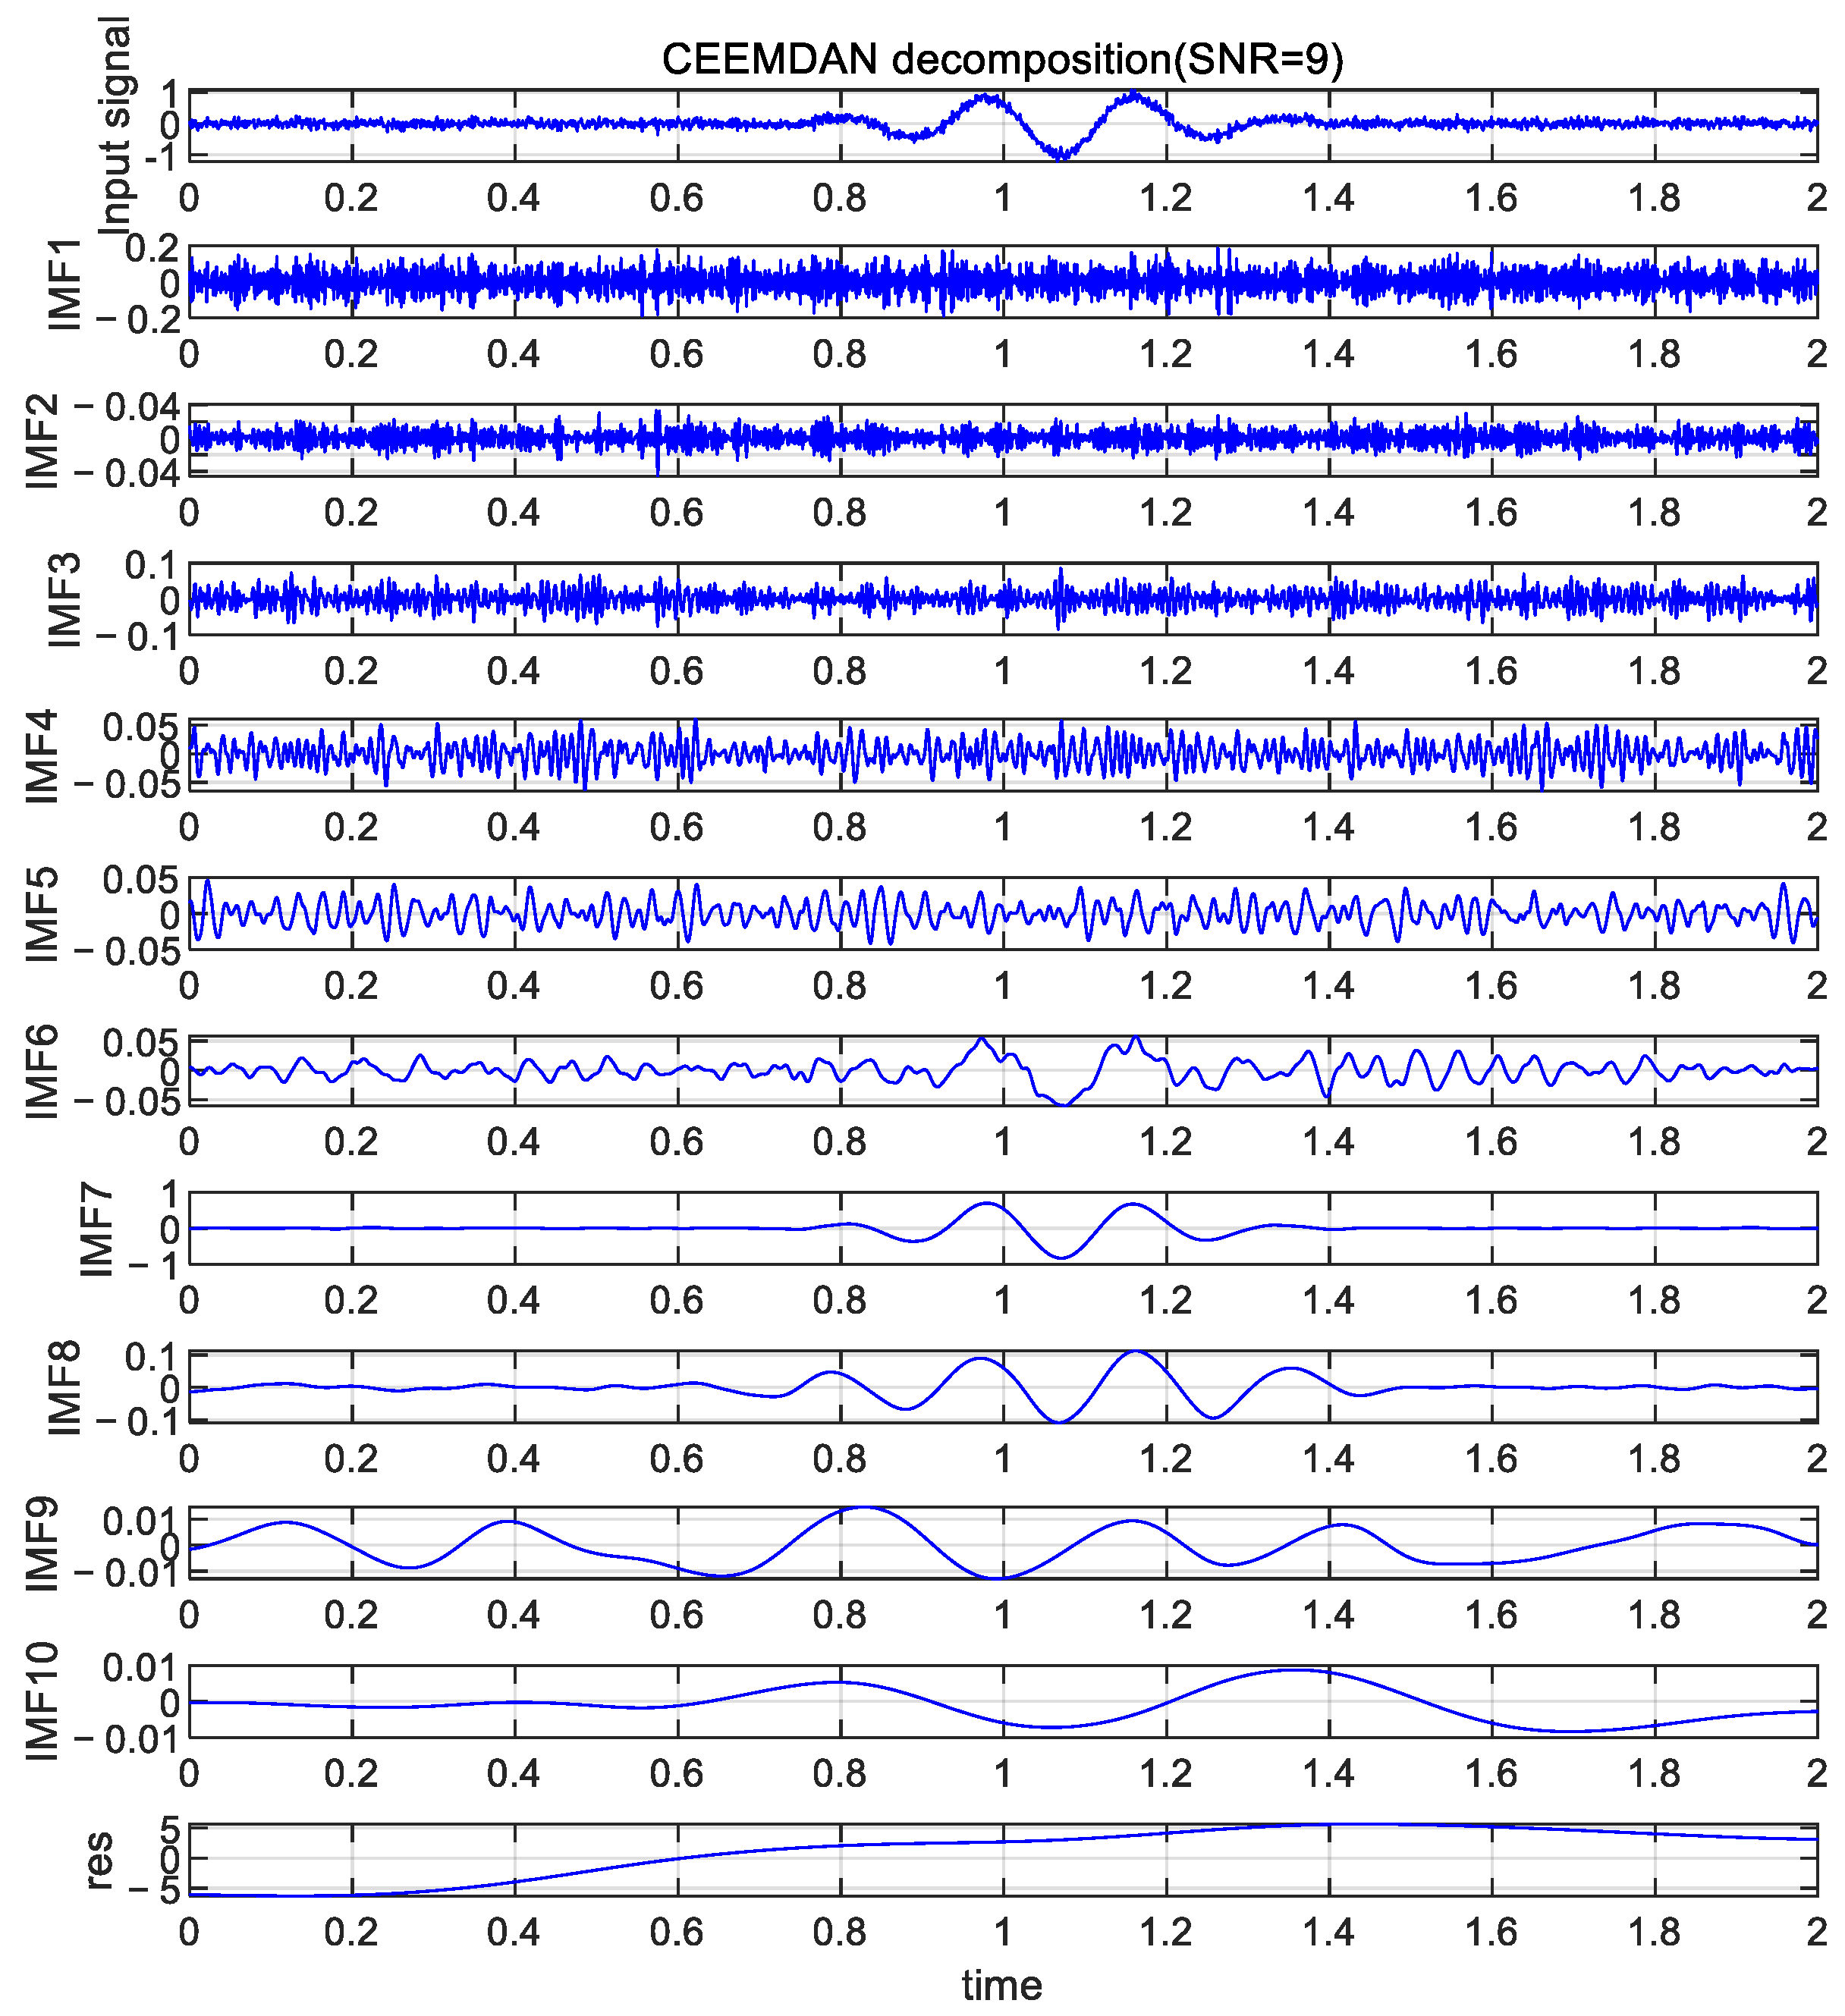
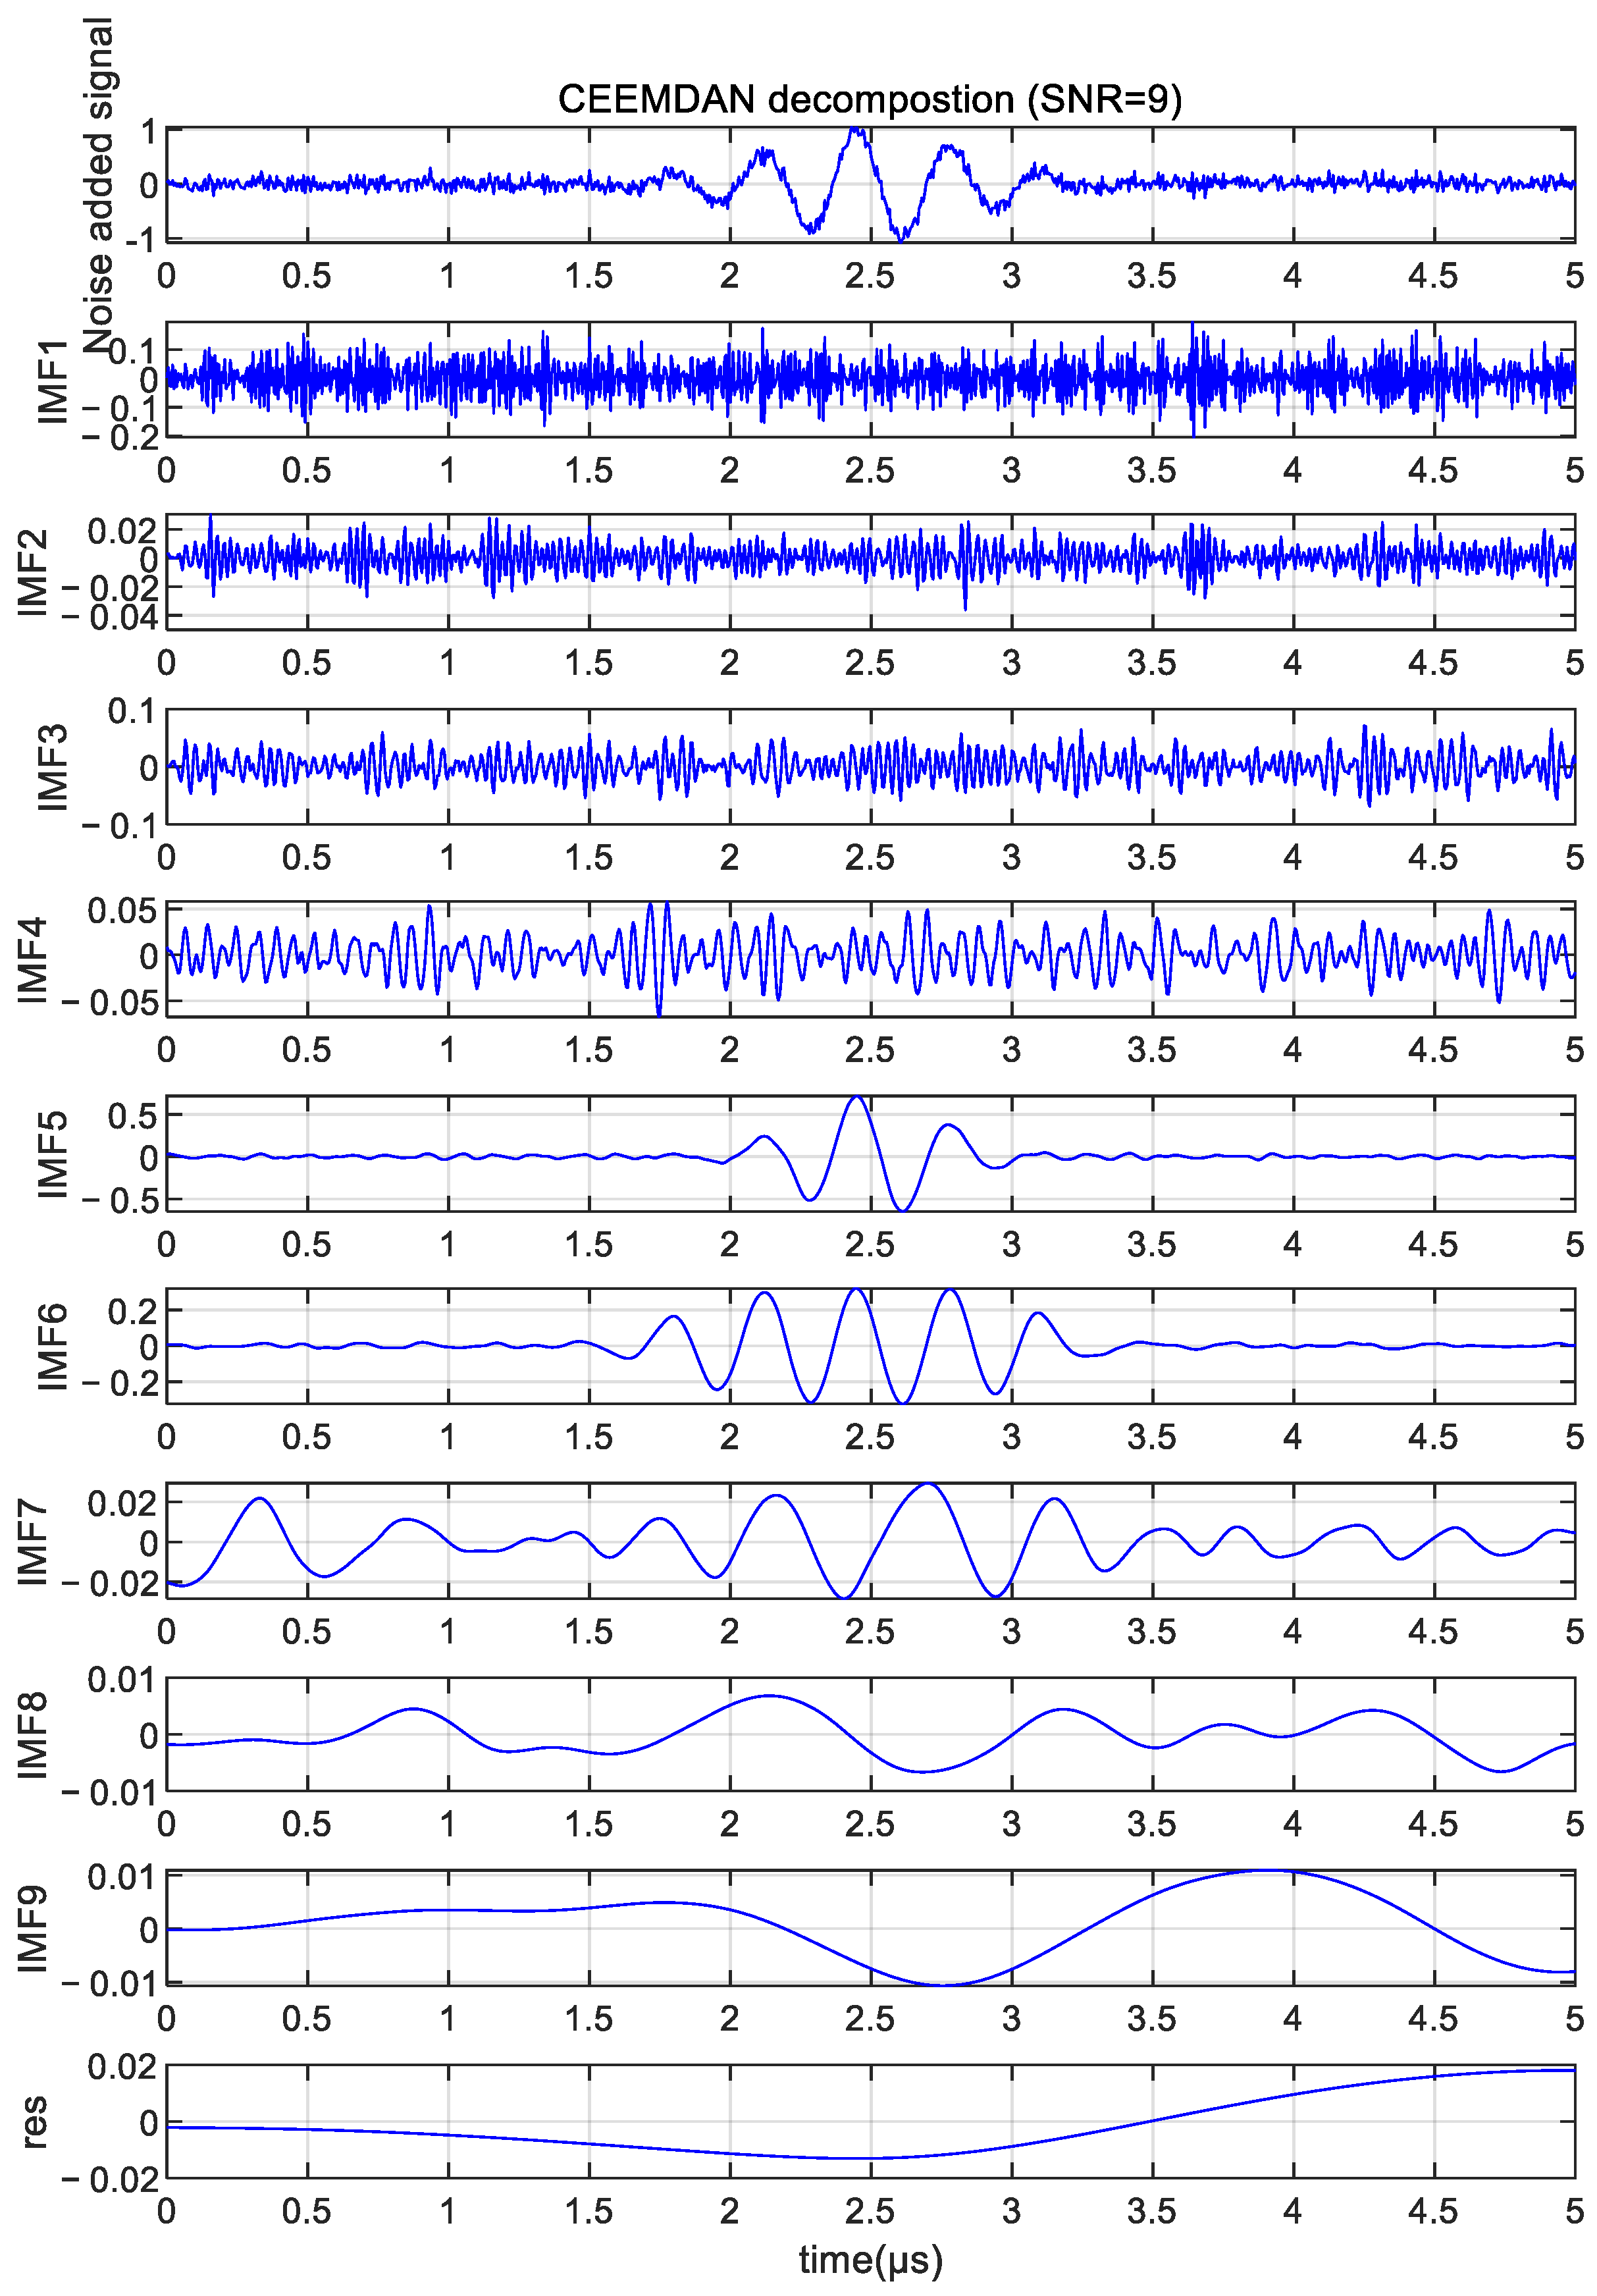
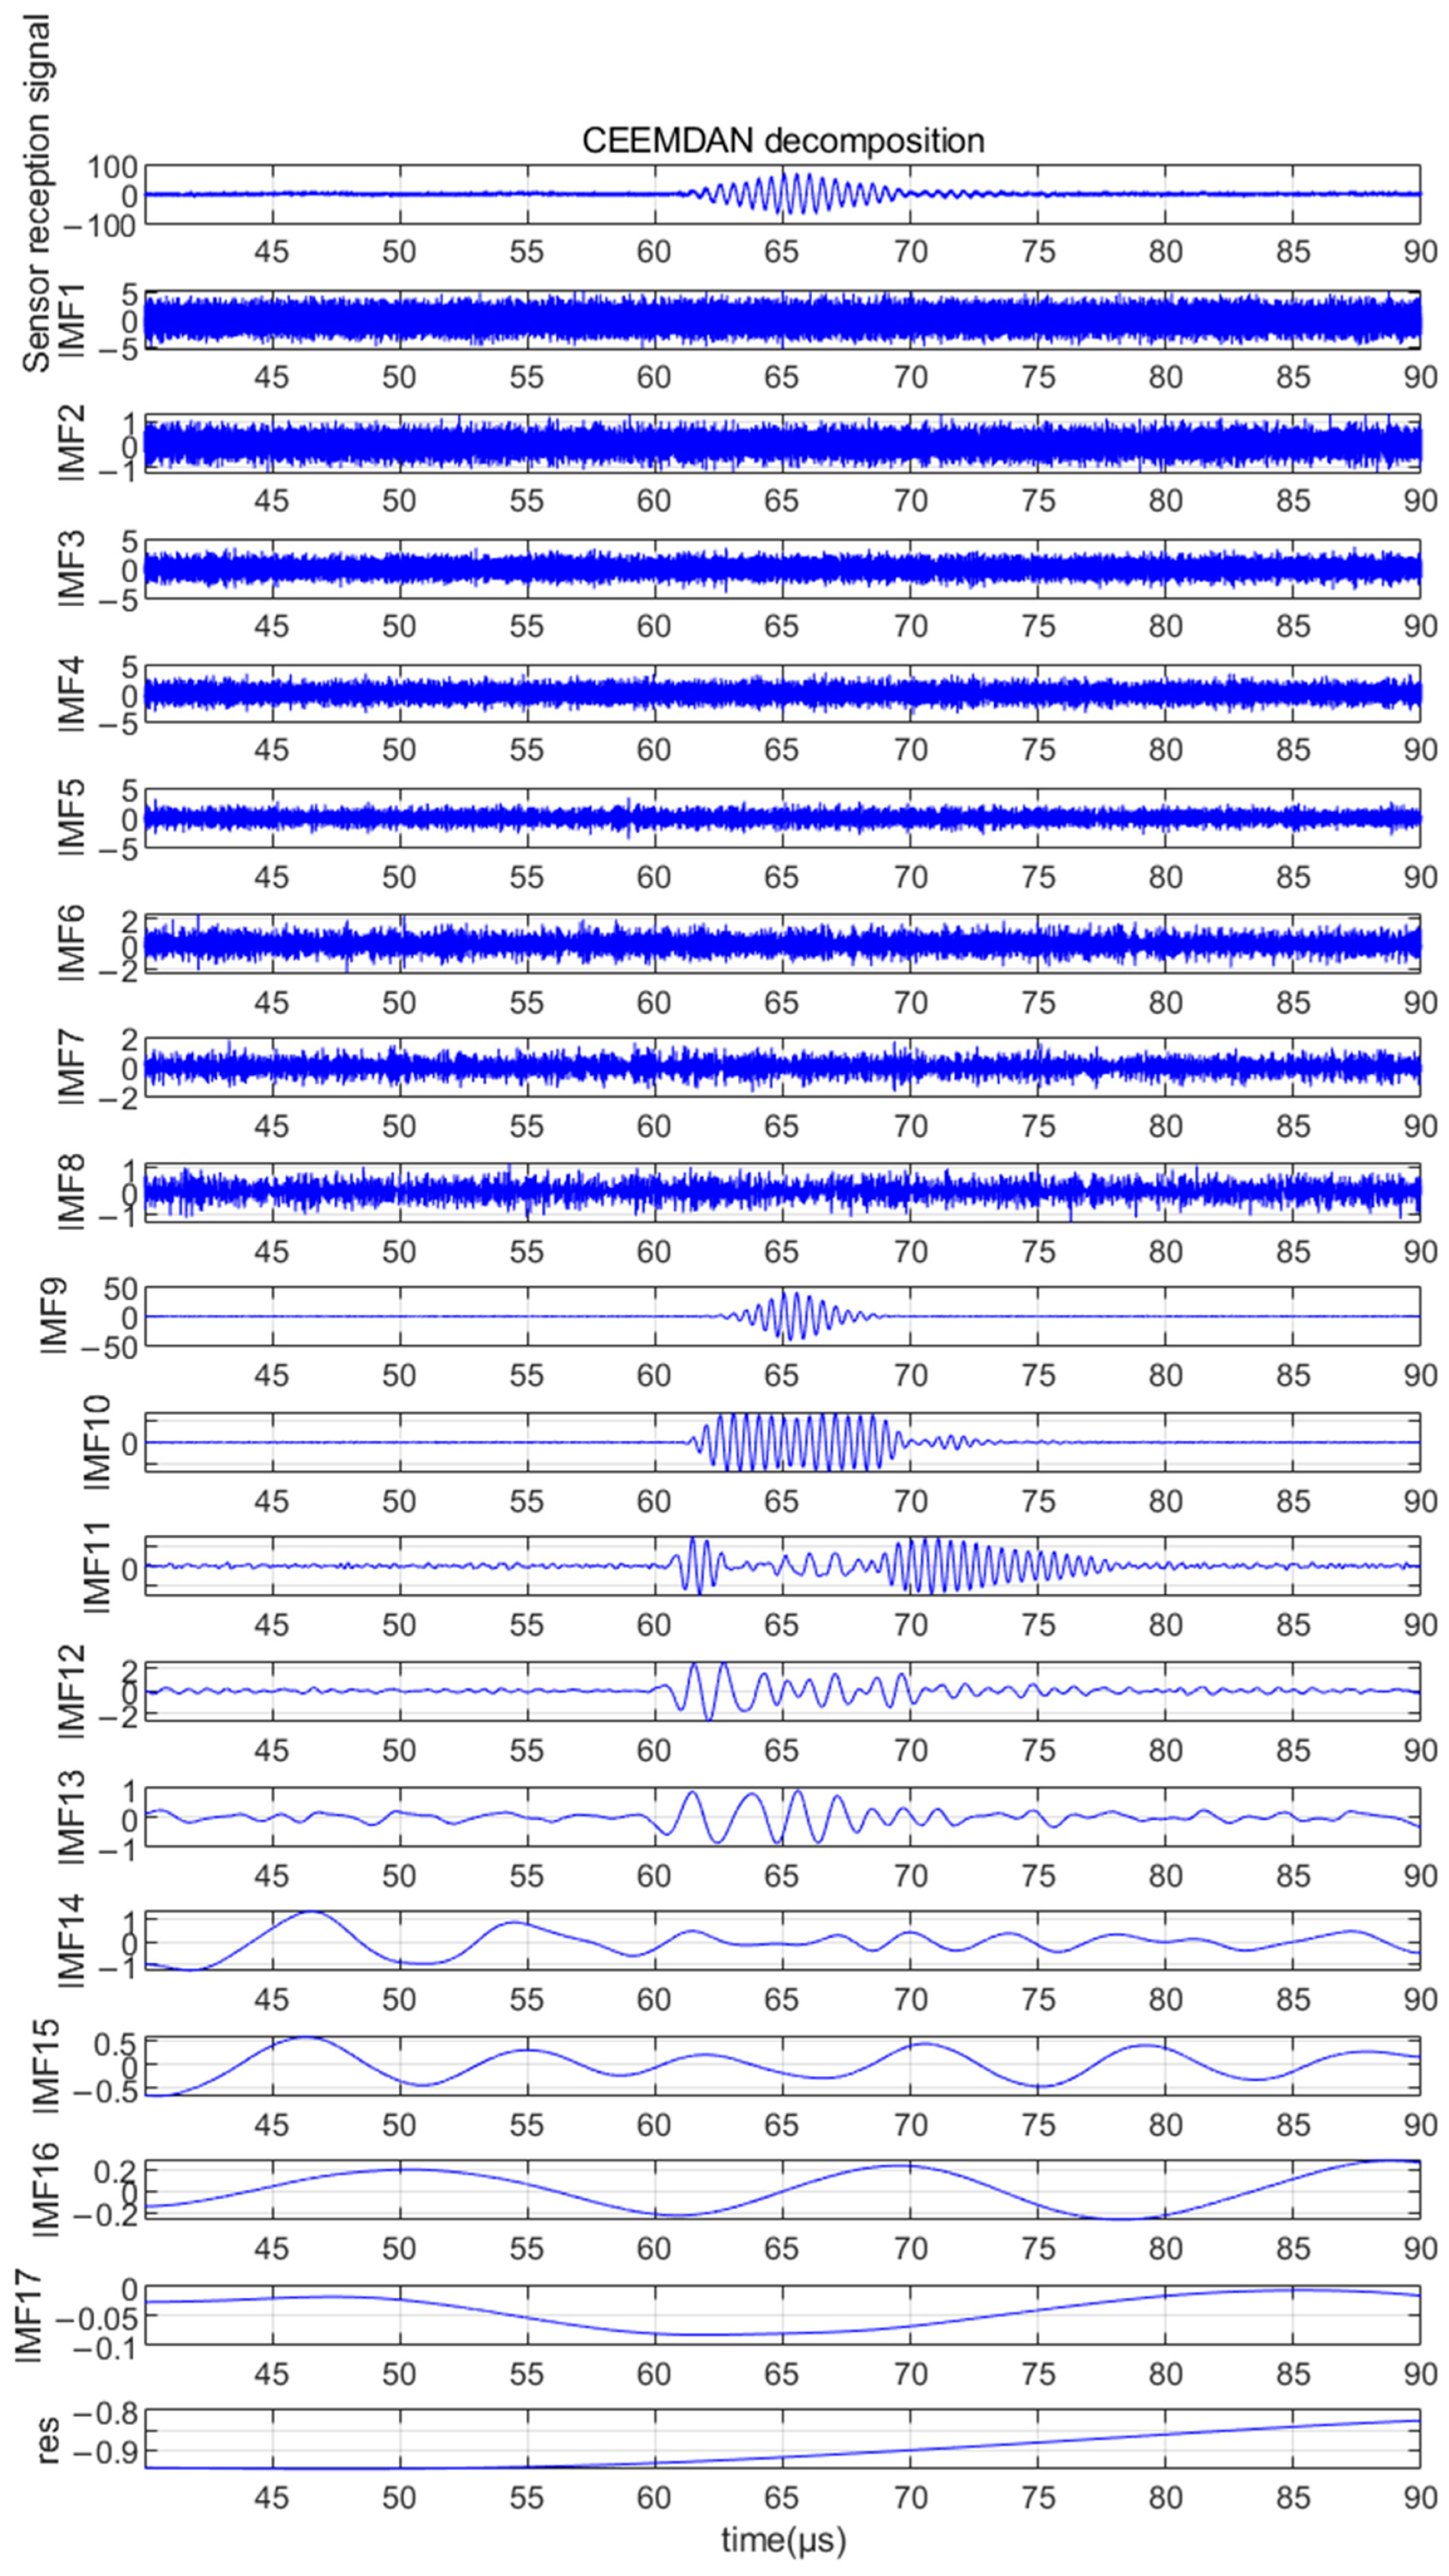
3.1. CEEMDAN
3.2. Mutual Information Entropy
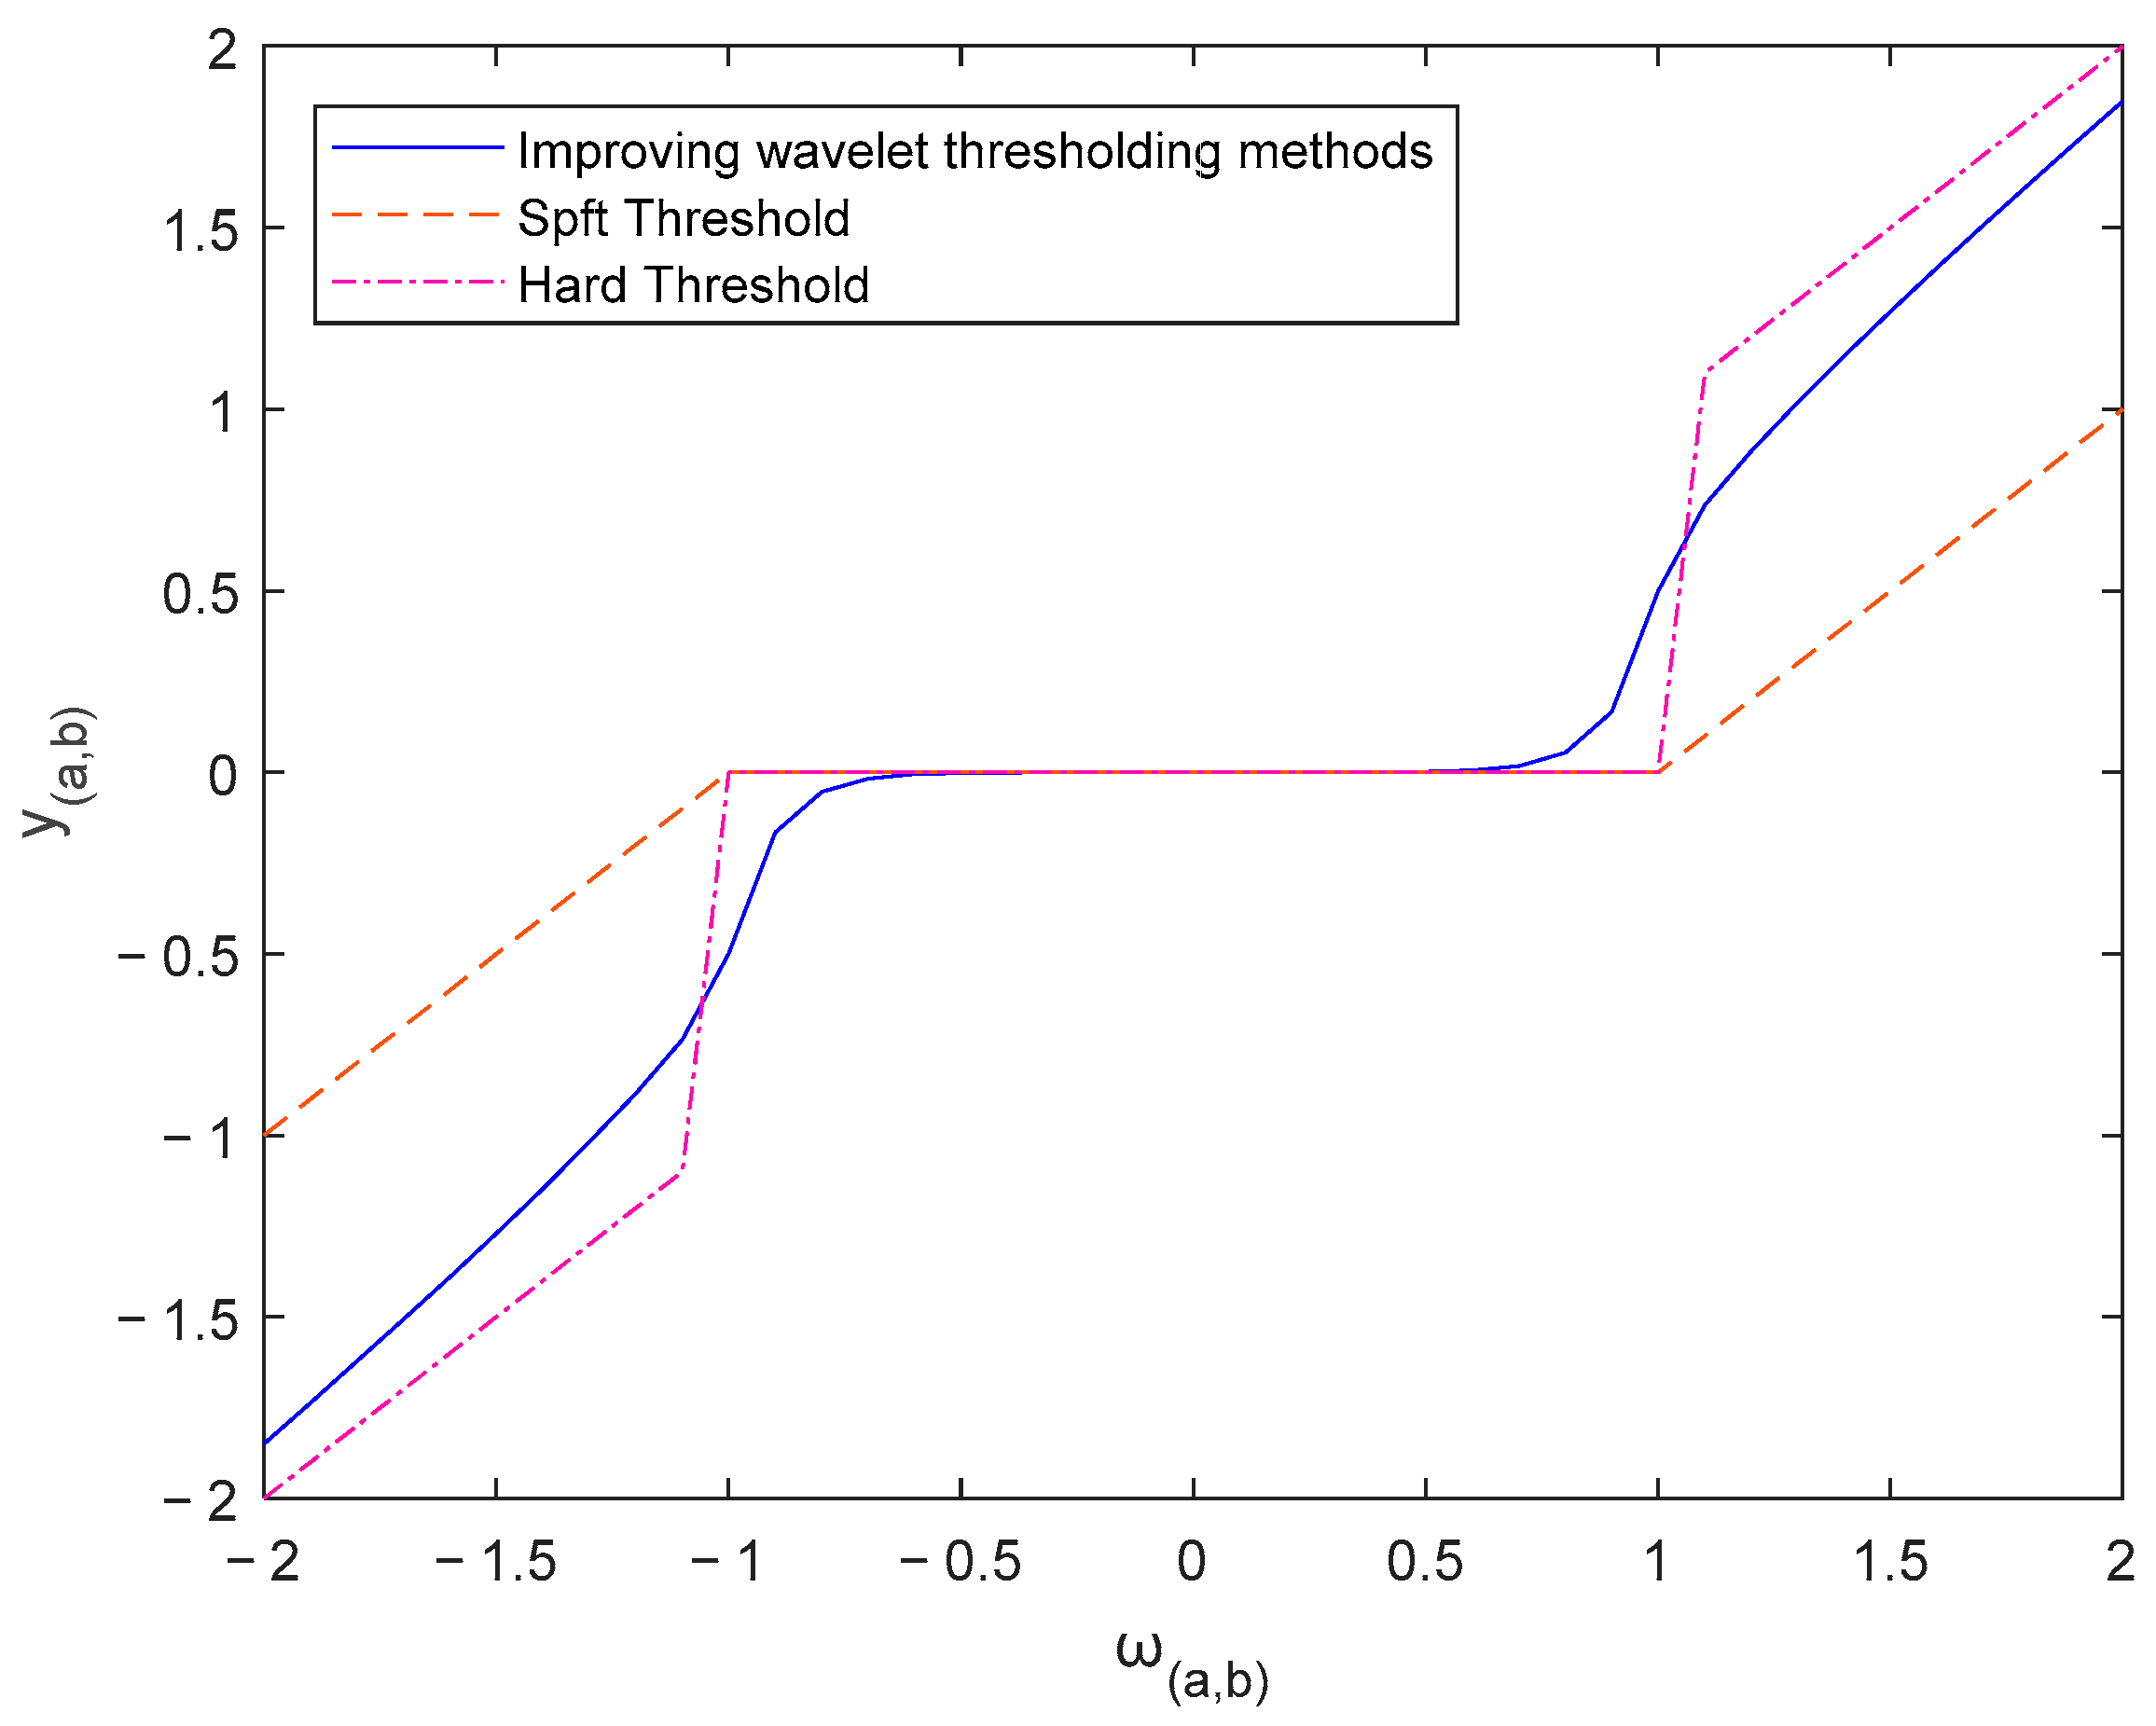
3.3. Wavelet Thresholding Denoising Method
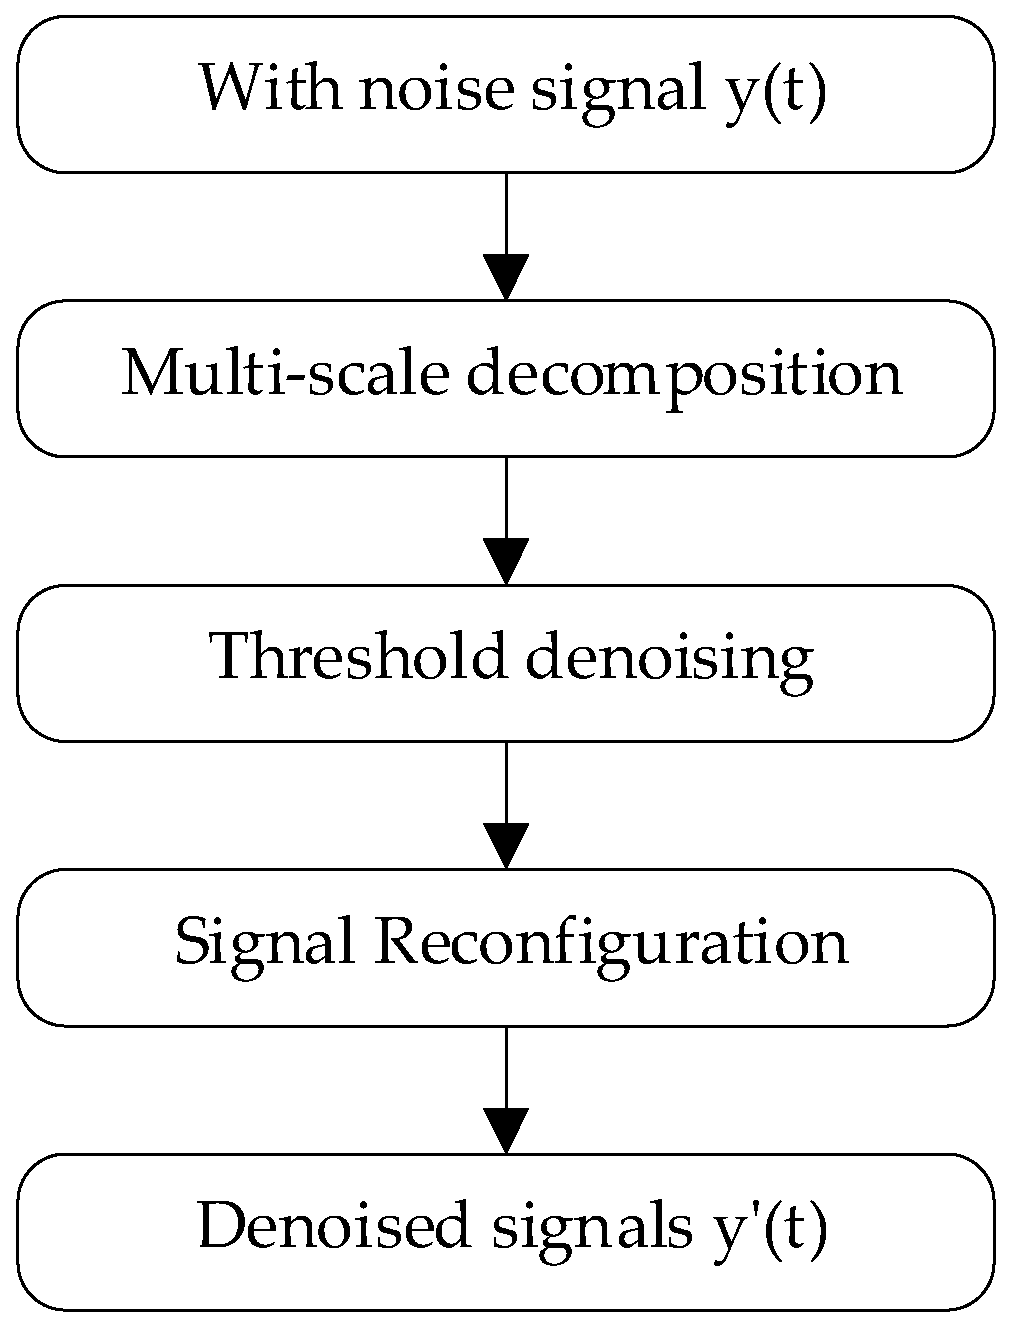
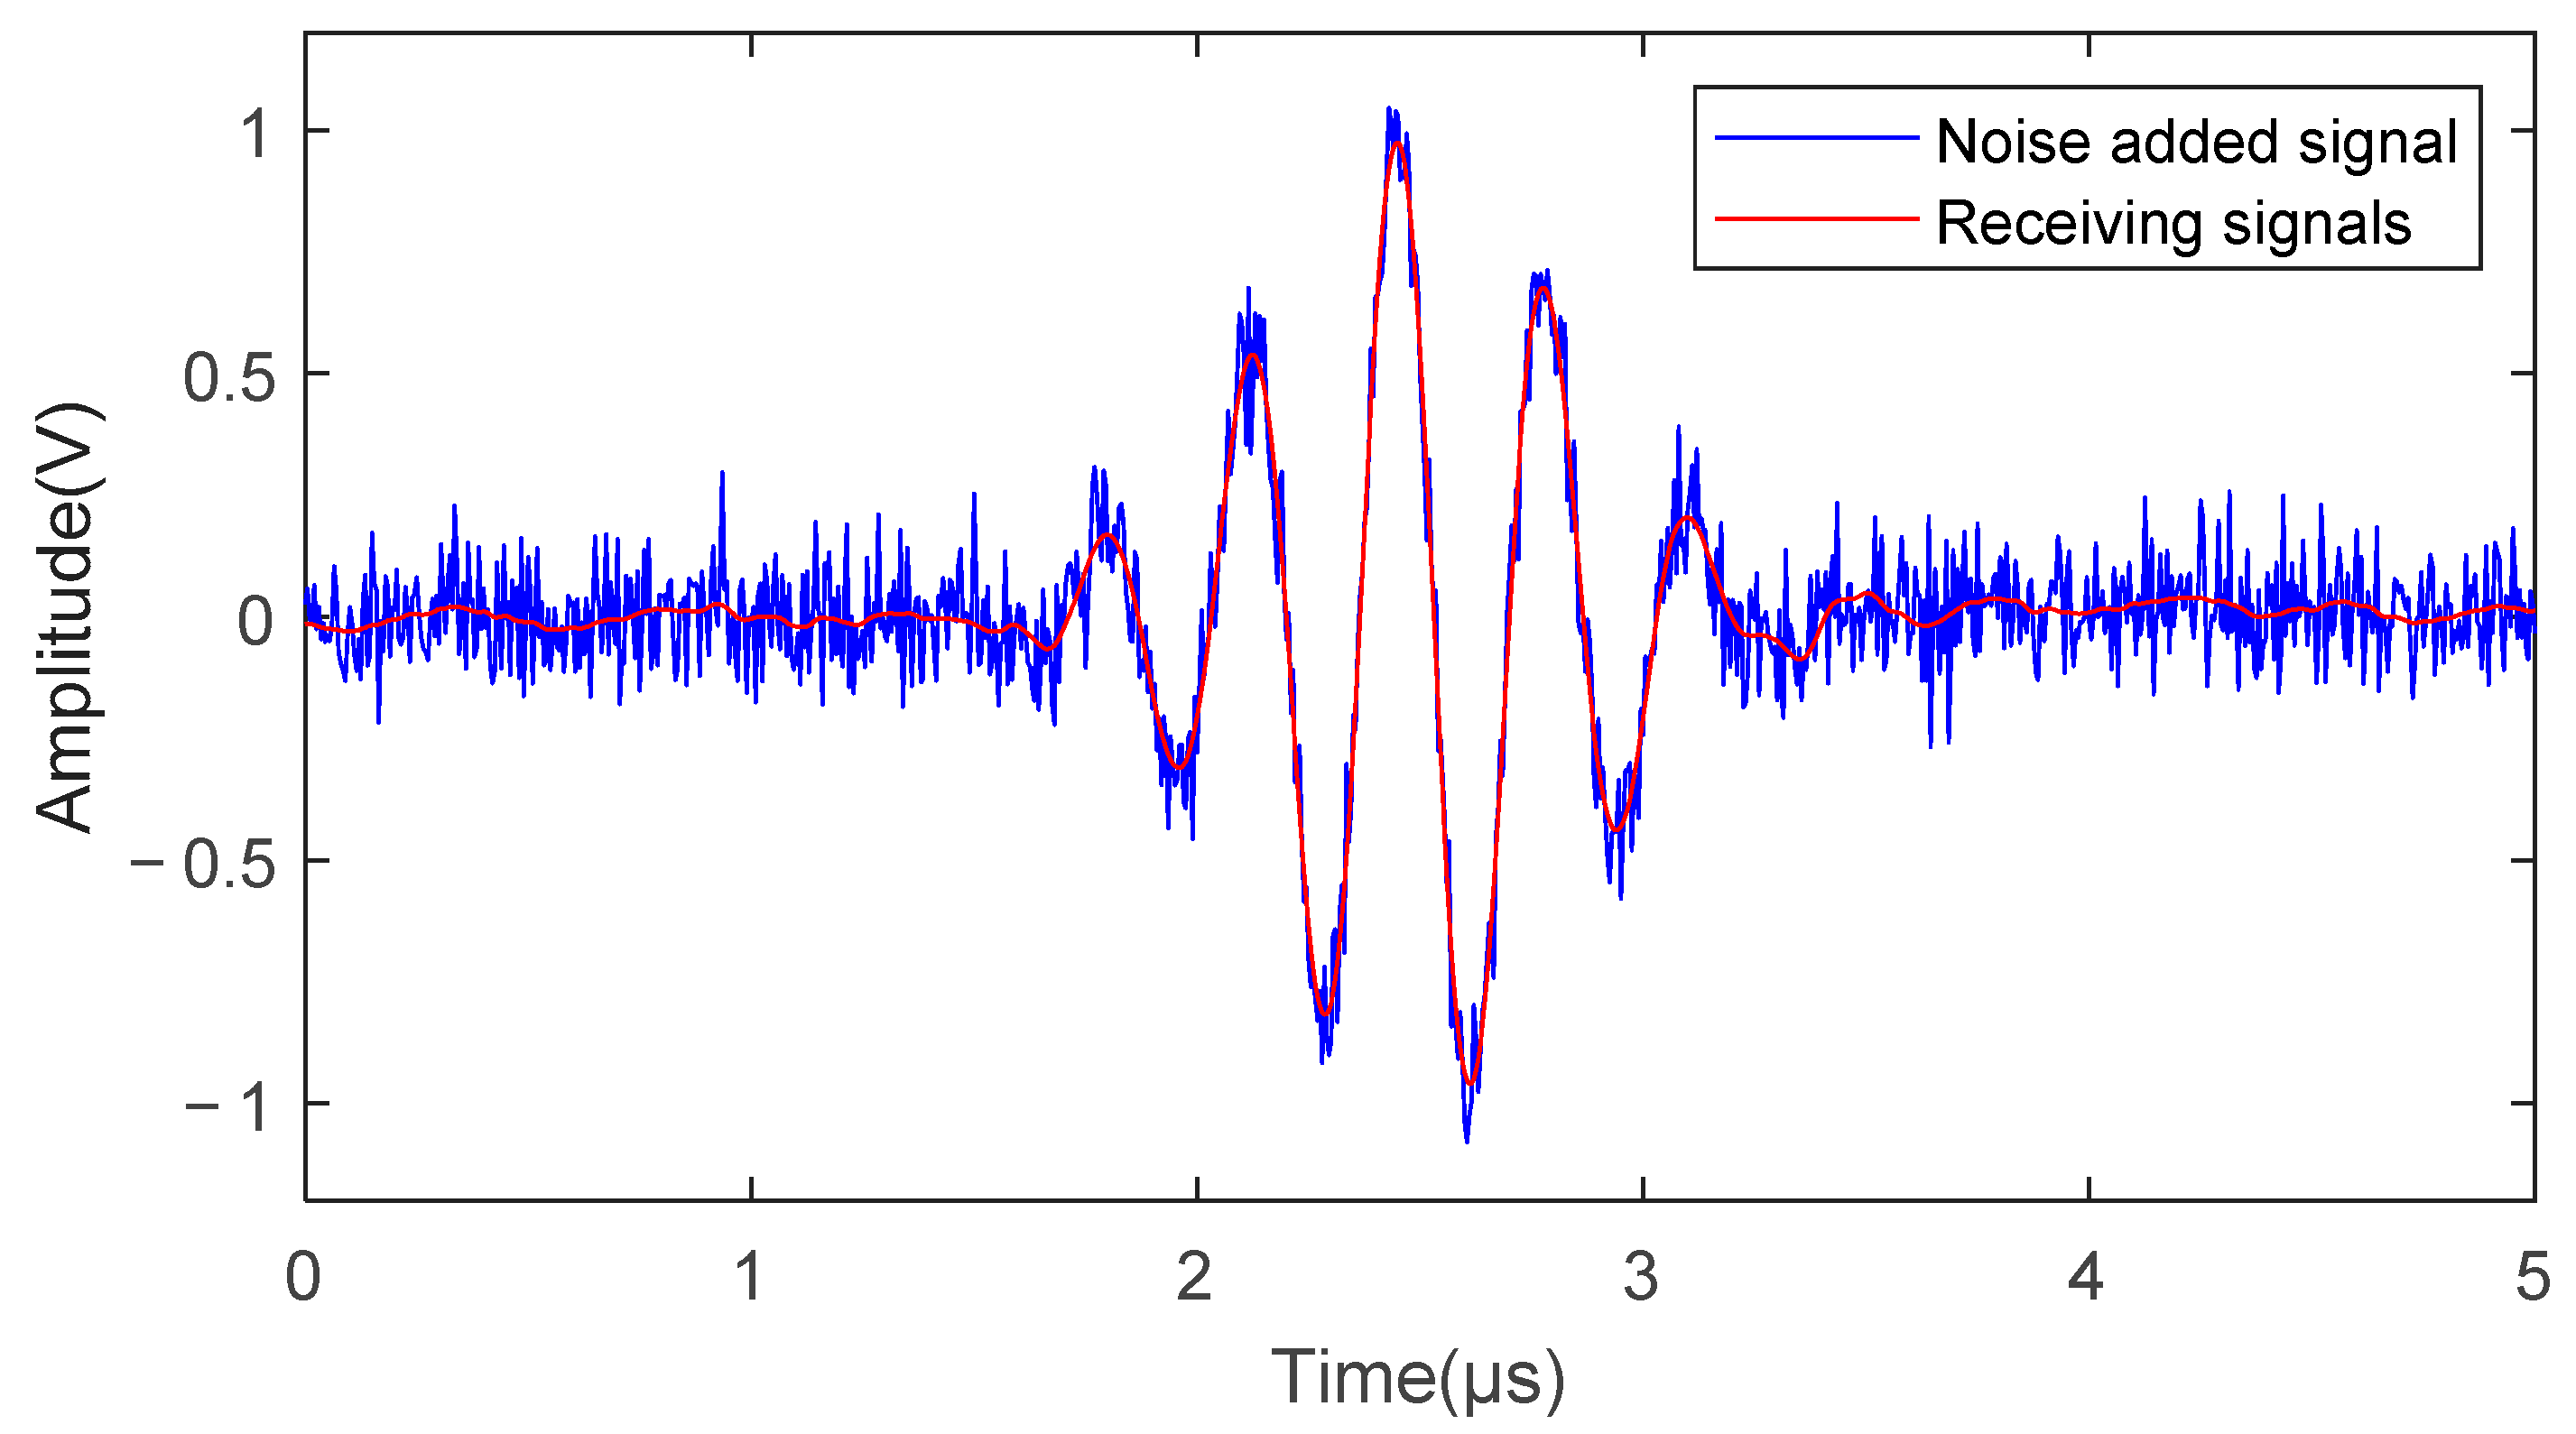
3.4. Echo Signal Estimation Method
4. Simulation Experiments
4.1. Simulation Experiment Platform
4.2. Evaluation Index
4.3. Simulation Result
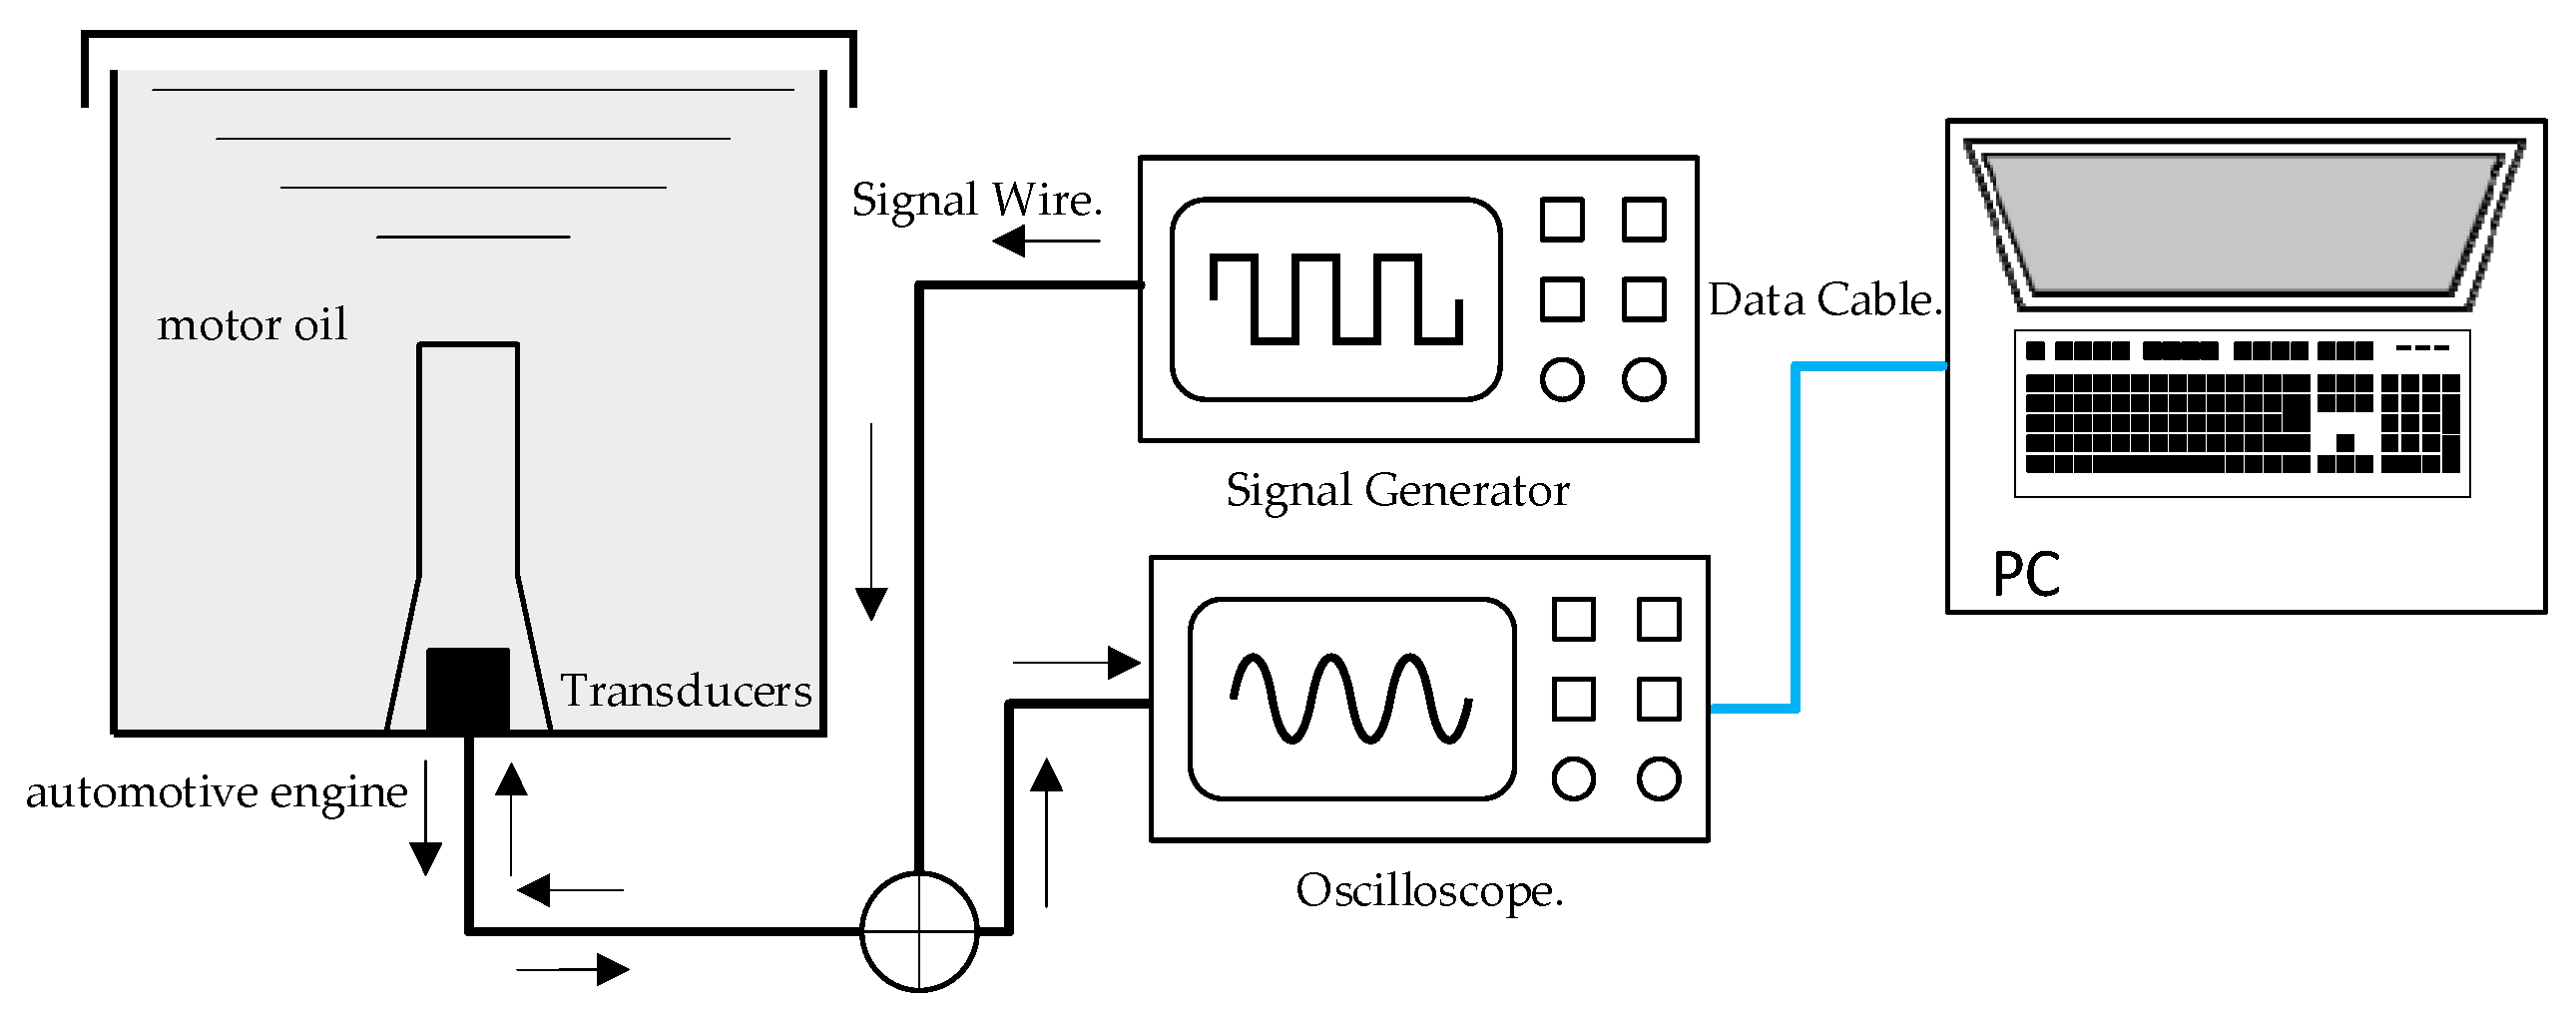
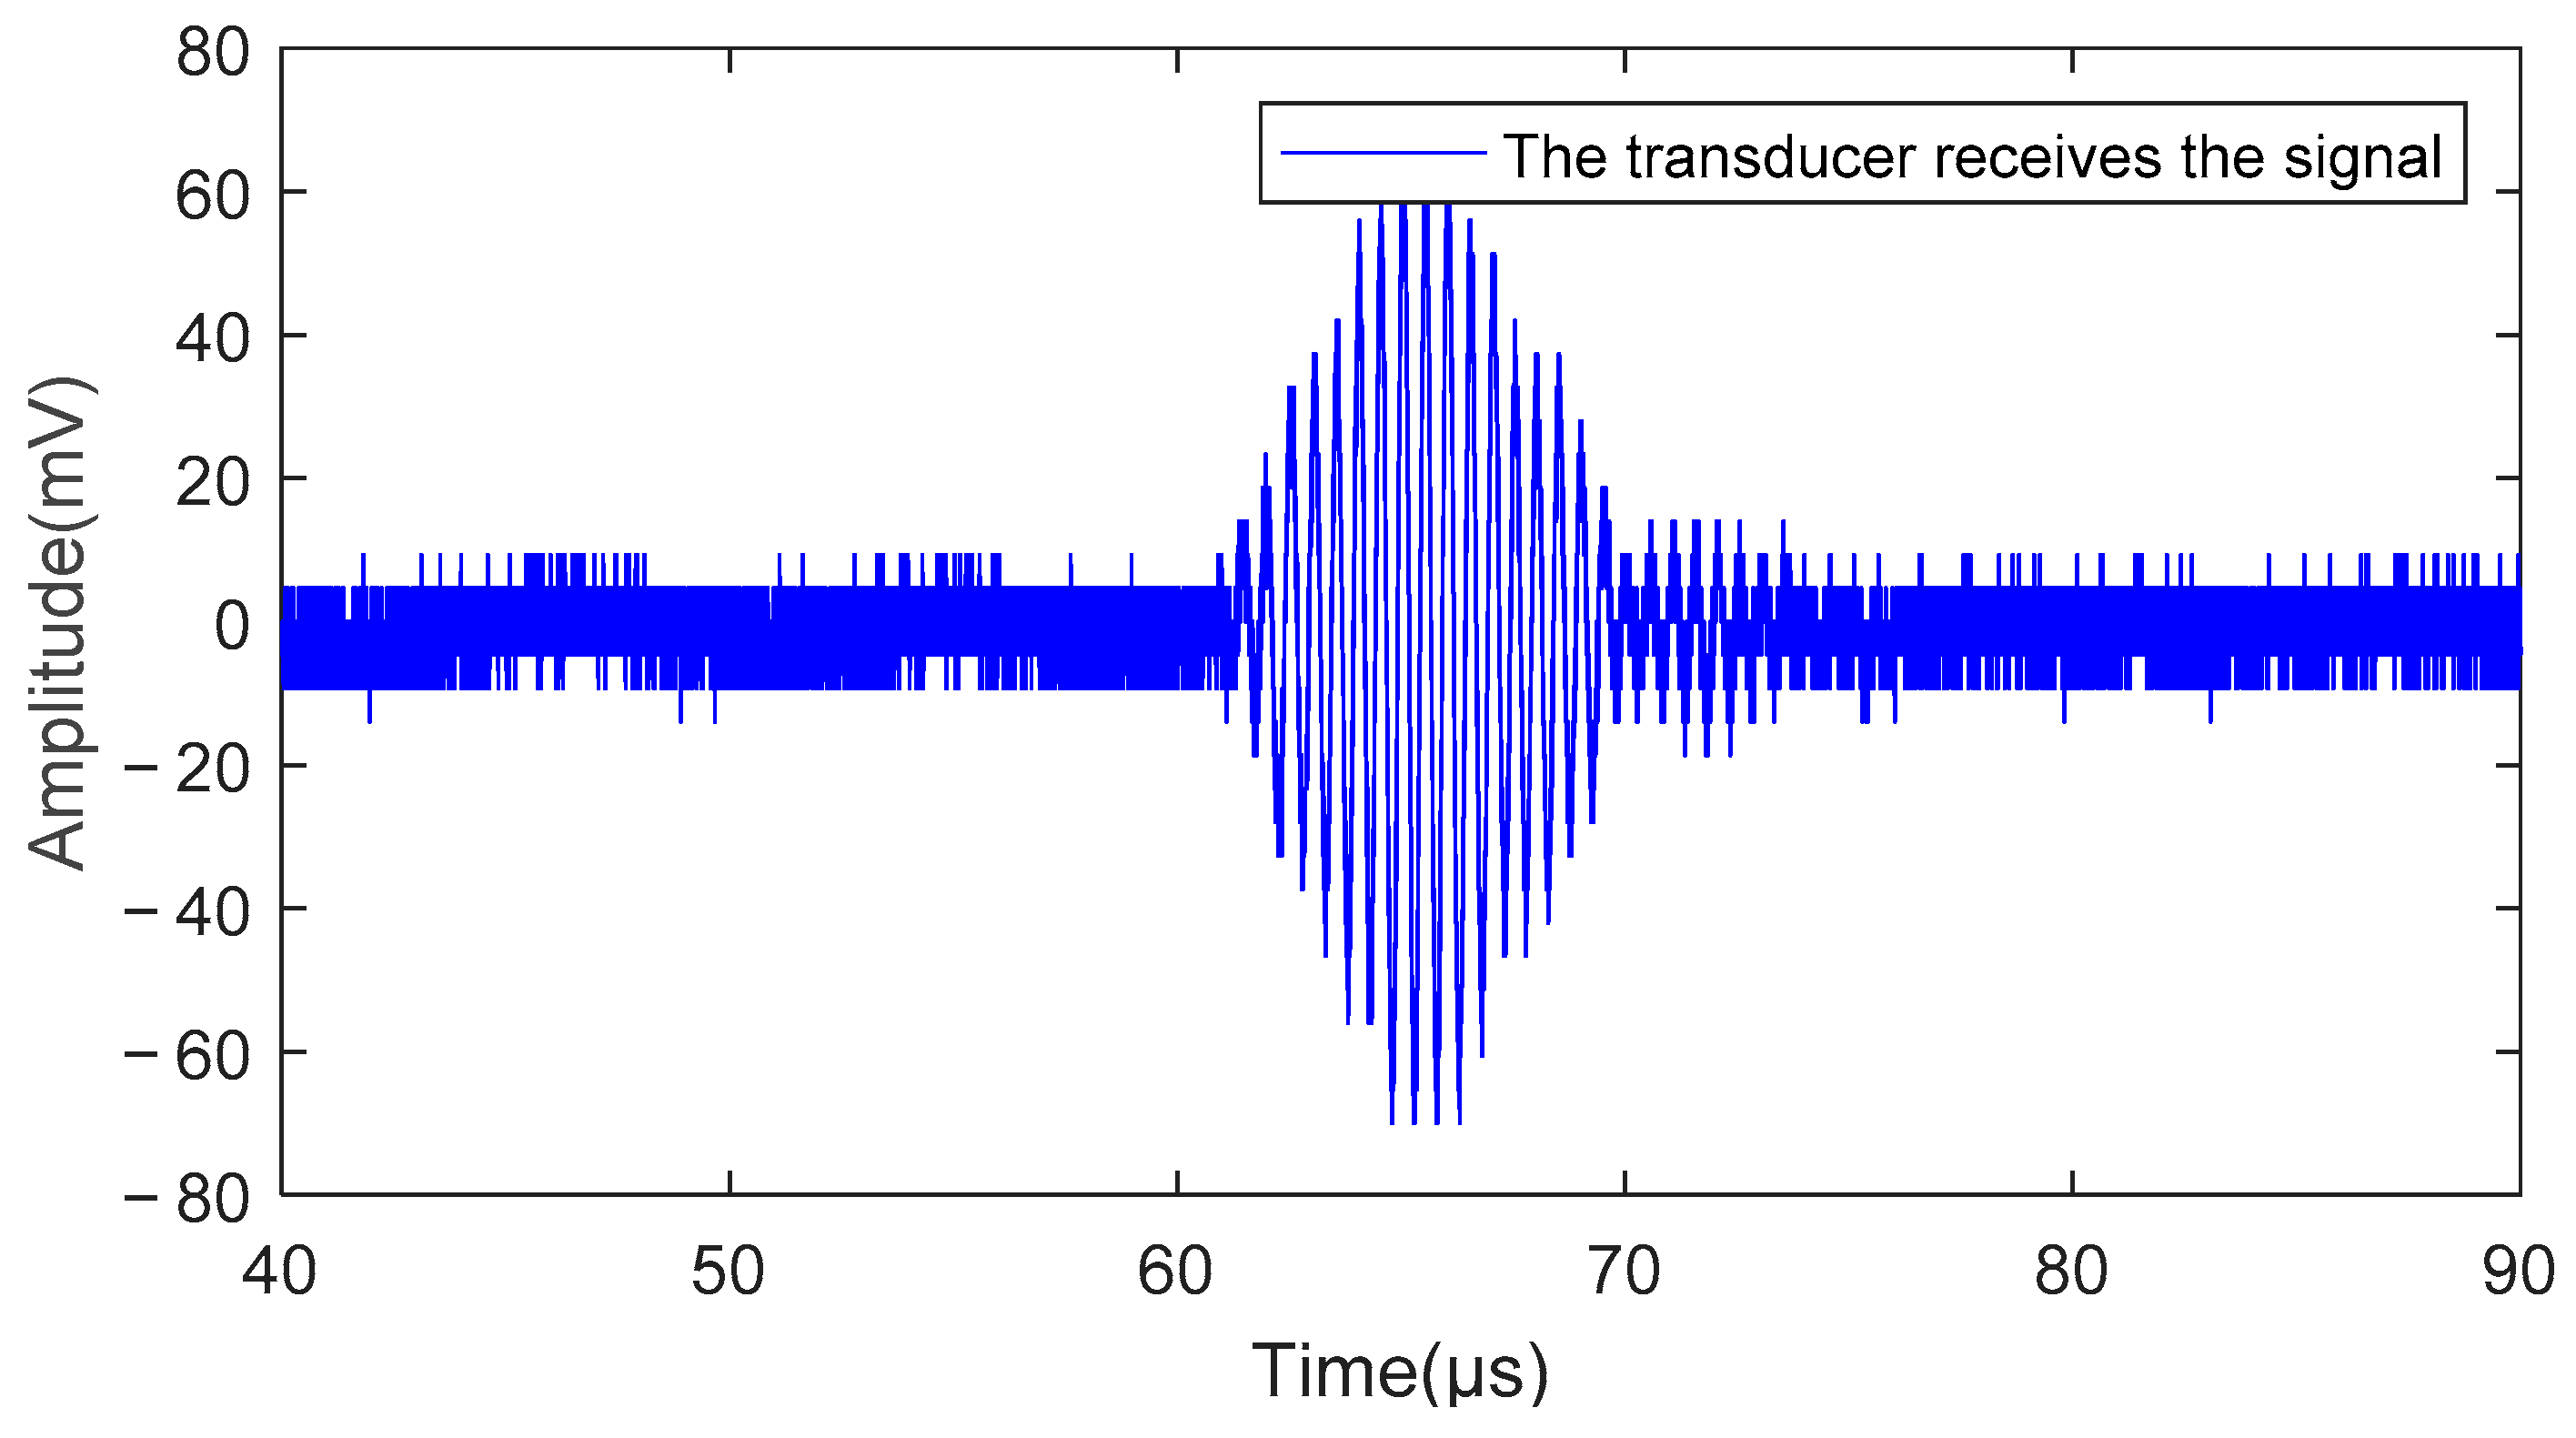
5. Physical Experiments
6. Conclusions
Author Contributions
Funding
Data Availability Statement
Conflicts of Interest
Abbreviations
| EMD | Empirical Mode Decomposition |
| EEMD | Ensemble Empirical Mode Decomposition |
| CEEMD | Complementary Ensemble Empirical Mode Decomposition |
| CEEMDAN | Complete Ensemble Empirical Mode Decomposition with Adaptive Noise |
| IMF | Intrinsic Mode Function |
| NCC | Normalized Cross Correlation |
| RMSE | Root Mean Square Error |
| MIE | Mutual information entropy |
| VMD | Variational Mode Decomposition |
| GRA | Grey Relational Analysis |
| SSWT | Synchro Squeezing Wavelet Transform |
| WTD | Wavelet Threshold Denoising |
References
- Lu, Z.K.; Yang, C.; Qin, D.H.; Luo, Y.L.; Momayez, M. Estimating ultrasonic time-of-flight through echo signal envelope and modified Gauss Newton method. Measurement 2016, 94, 355–363. [Google Scholar] [CrossRef]
- Colantoni, A.; Cecchini, M.; Monarca, D.; Marcantonio, V. Ultrasonic waves for materials evaluation in fatigue, thermal and corrosion damage: A review. Mech. Syst. Signal Process. 2018, 120, 32–42. [Google Scholar]
- Ahila, A.; Poongodi, M.; Bourouis, S.; Band, S.S.; Mosavi, A.; Agrawal, S.; Hamdi, M. Meta-Heuristic Algorithm-Tuned Neural Network for Breast Cancer Diagnosis Using Ultrasound Images. Front. Oncol. 2022, 12, 834028. [Google Scholar]
- Al-Aufi, Y.A.; Hewakandamby, B.N.; Dimitrakis, G.; Holmes, M.; Watson, N.J. Thin film thickness measurements in two phase annular flows using ultrasonic pulse echo techniques. Flow Meas. Instrum. 2019, 66, 67–78. [Google Scholar] [CrossRef]
- Oral, M. Investigation of Surface Damages in Composite Materials Using Ultrasonic Lamb Waves. El-Cezeri 2021, 8, 652–665. [Google Scholar] [CrossRef]
- Stanišić, S.M.; Ignjatović, L.M.; Anðelković, I.; Stević, M.C.; Tasić, A.M.; Biserčić, M.S. Ultrasound-assisted extraction of matrix elements and heavy metal fractions associated with Fe, Al and Mn oxyhydroxides from soil. J. Serbian Chem. Soc. 2012, 77, 1287–1300. [Google Scholar] [CrossRef]
- Wang, B.; Zhong, S.; Lee, T.L.; Fancey, K.S.; Mi, J. Non-destructive testing and evaluation of composite materials/structures: A state-of-the-art review. Adv. Mech. Eng. 2020, 12, 152–169. [Google Scholar] [CrossRef]
- Wu, B.; Huang, Y.; Krishnaswamy, S. A Bayesian Approach for Sparse Flaw Detection from Noisy Signals for Ultrasonic NDT. NDT E Int. 2017, 85, 76–85. [Google Scholar] [CrossRef]
- Zhao, G.; Liu, S.; Zhang, C.; Jin, L.; Yang, Q. Ultrasonic nonlinear response of micro plastic damage on aluminum alloy plate with varying thickness. Jpn. J. Appl. Phys. 2022, 61, 016503. [Google Scholar] [CrossRef]
- Guo, R.; Chen, D.; Fei, C.; Li, D.; Zhang, Q.; Feng, W.; Yang, Y. Optimization design of high-frequency ultrasonic transducer based on ANFIS and particle swarm optimization algorithm. Appl. Acoust. 2022, 187, 108507. [Google Scholar] [CrossRef]
- Lu, Z.; Cui, Y.; Qin, D.; Luo, Y. Estimating the parameters of ultrasonic echo signal in the Gabor transform domain and its resolution analysis. Signal Process. 2016, 120, 607–619. [Google Scholar] [CrossRef]
- Wang, D.W.; Wang, Z.B.; Chen, Y.X.; Li, H.Y.; Wang, H.K. Ultrasonic echo processing method based on dual-Gaussian attenuation model. Acta Phys. Sin. 2019, 689, 084303055213. [Google Scholar] [CrossRef]
- Cheng, J.; Xu, Y.; Ding, D.; Liu, W. A novel de-noising method based on coherence average for ultrasonic signal of partial discharge in transformer. IET Sci. Meas. Technol. 2021, 15, 302–311. [Google Scholar] [CrossRef]
- Cooper, J.; Tran, A.N.; Wallander, S. Testing for Specification Bias with a Flexible Fourier Transform Model for Crop Yields. Am. J. Agric. Econ. 2017, 99, 800–817. [Google Scholar] [CrossRef]
- Rhif, M.; Abbes, A.B.; Farah, I.; Martínez, B.; Sang, Y. Wavelet Transform Application for/in Non-Stationary Time-Series Analysis: A Review. Appl. Sci. 2019, 9, 1345. [Google Scholar] [CrossRef]
- Imaouchen, Y.; Kedadouche, M.; Alkama, R.; Thomas, M. A Frequency-Weighted Energy Operator and complementary ensemble empirical mode decomposition for bearing fault detection. Mech. Syst. Signal Process. 2017, 82, 103–116. [Google Scholar] [CrossRef]
- Gu, J.; Peng, Y.X. An improved complementary ensemble empirical mode decomposition method and its application in rolling bearing fault diagnosis. Digit. Signal Process. 2021, 113, 103050. [Google Scholar] [CrossRef]
- Liu, Y.; Ma, K.; He, H.; Gao, K. Obtaining Information about Operation of Centrifugal Compressor from Pressure by Combining EEMD and IMFE. Entropy 2020, 22, 424. [Google Scholar] [CrossRef]
- Ke, Z.; Di, C.; Bao, X. Adaptive Suppression of Mode Mixing in CEEMD Based on Genetic Algorithm for Motor Bearing Fault Diagnosis. IEEE Trans. Magn. 2021, 58, 8200706. [Google Scholar] [CrossRef]
- Torres, M.E.; Colominas, M.A.; Schlotthauer, G.; Flandrin, P. A complete ensemble empirical mode decomposition with adaptive noise. In Proceedings of the 2011 IEEE International Conference on Acoustics, Speech and Signal Processing (ICASSP), Prague, Czech Republic, 22–27 May 2011; pp. 4144–4147. [Google Scholar] [CrossRef]
- Li, T.; Qian, Z.; He, T. Short-Term Load Forecasting with Improved CEEMDAN and GWO-Based Multiple Kernel ELM. Complexity 2020, 2020, 1209547. [Google Scholar] [CrossRef]
- Sabatini, A.M. Correlation receivers using Laguerre filter banks for modelling narrowband ultrasonic echoes and estimating their time-of-flights. IEEE Trans. Ultrason. Ferroelectr. Freq. Control 2002, 44, 1253–1263. [Google Scholar] [CrossRef]
- Demirli, R.; Saniie, J. Model-based estimation of ultrasonic echoes. Anal. Algorithms. IEEE Trans. Ultrason. Ferroelectr. Freq. Control 2001, 48, 787. [Google Scholar] [CrossRef]
- Huang, N.E.; Shen, Z.; Long, S.R.; Wu, M.C.; Shih, H.H.; Zheng, W.; Yen, N.; Tung, C.C.; Liu, H.H.; Yen, N.C. The empirical mode decomposition method and the Hilbert spectrum for non-stationary time series analysis. Proc. R. Soc. Lond. Ser. A Math. Phys. Eng. Sci. 1998, 454, 903–995. [Google Scholar] [CrossRef]
- Wu, Z.; Huang, N.E. Ensemble Empirical Mode Decomposition: A Noise-Assisted Data Analysis Method. Adv. Adapt. Data Anal. 2011, 1, 1–41. [Google Scholar] [CrossRef]
- Lei, Y.; Liu, Z.; Ouazri, J.; Lin, J. A fault diagnosis method of rolling element bearings based on CEEMDAN. Proc. Inst. Mech. Eng. C J. Mech. Eng. Sci. 2017, 231, 1804–1815. [Google Scholar] [CrossRef]
- Olvera-Guerrero, O.A.; Prieto-Guerrero, A.; Espinosa-Paredes, G. Decay Ratio estimation in BWRs based on the improved complete ensemble empirical mode decomposition with adaptive noise. Ann. Nucl. Energy 2017, 102, 280–296. [Google Scholar] [CrossRef]
- Shuang, G.; Xiao-Li, L.; Fei, L. Near Infrared Spectroscopy Process Pattern Fault Detection Based on Mutual Information Entropy. Spectrosc. Spectr. Anal. 2019, 39, 1736–1741. [Google Scholar]
- Omitaomu, O.A.; Protopopescu, V.A.; Ganguly, A.R. Empirical Mode Decomposition Technique with Conditional Mutual Information for Denoising Operational Sensor Data. IEEE Sens. J. 2011, 11, 2565–2575. [Google Scholar] [CrossRef]
- Lei, Z.; Su, W.; Hu, Q. Multimode Decomposition and Wavelet Threshold Denoising of Mold Level Based on Mutual Information Entropy. Entropy 2019, 21, 202. [Google Scholar] [CrossRef]
- Donoho, D.L.; Johnstone, J.M. Ideal spatial adaptation by wavelet shrinkage. Biometrika 1994, 81, 425–455. [Google Scholar] [CrossRef]
- Peng, T.; Bao-Ping, G. Wavelet Denoising Based on Modified Threshold Function Optimization Method. J. Signal Process. 2017, 8, 1259–1284. [Google Scholar]
- Jiao, Y.; Li, Z.; Zhu, J.; Xue, B.; Zhang, B. ABIDE: A Novel Scheme for Ultrasonic Echo Estimation by Combining CEEMD-SSWT Method with EM Algorithm. Sustainability 2022, 14, 1960. [Google Scholar] [CrossRef]


| IMF1–2 | IMF2–3 | IMF3–4 | IMF4–5 | IMF5–6 | IMF6–7 | IMF7–8 | IMF8–9 | IMF9–R |
|---|---|---|---|---|---|---|---|---|
| 1.945 | 2.053 | 2.502 | 1.338 | 1.706 | 2.215 | 2.791 | 3.612 | 4.252 |
| SNR of the Noisy Signal (dB) | Received Signal | ||
|---|---|---|---|
| SNR (dB) | RMSE | NCC | |
| 0 | 12.6890 | 0.0580 | 0.97412 |
| 3 | 15.2926 | 0.0430 | 0.98552 |
| 6 | 18.9602 | 0.0282 | 0.99373 |
| 9 | 21.8262 | 0.0202 | 0.99675 |
| 12 | 24.6710 | 0.0146 | 0.99830 |
| 15 | 27.5058 | 0.0105 | 0.99911 |
| 18 | 29.9366 | 0.0079 | 0.99950 |
| 21 | 32.2653 | 0.0061 | 0.99971 |
| 24 | 34.4046 | 0.0048 | 0.99982 |
| 27 | 36.5031 | 0.0037 | 0.99989 |
| 30 | 37.4580 | 0.0034 | 0.99992 |
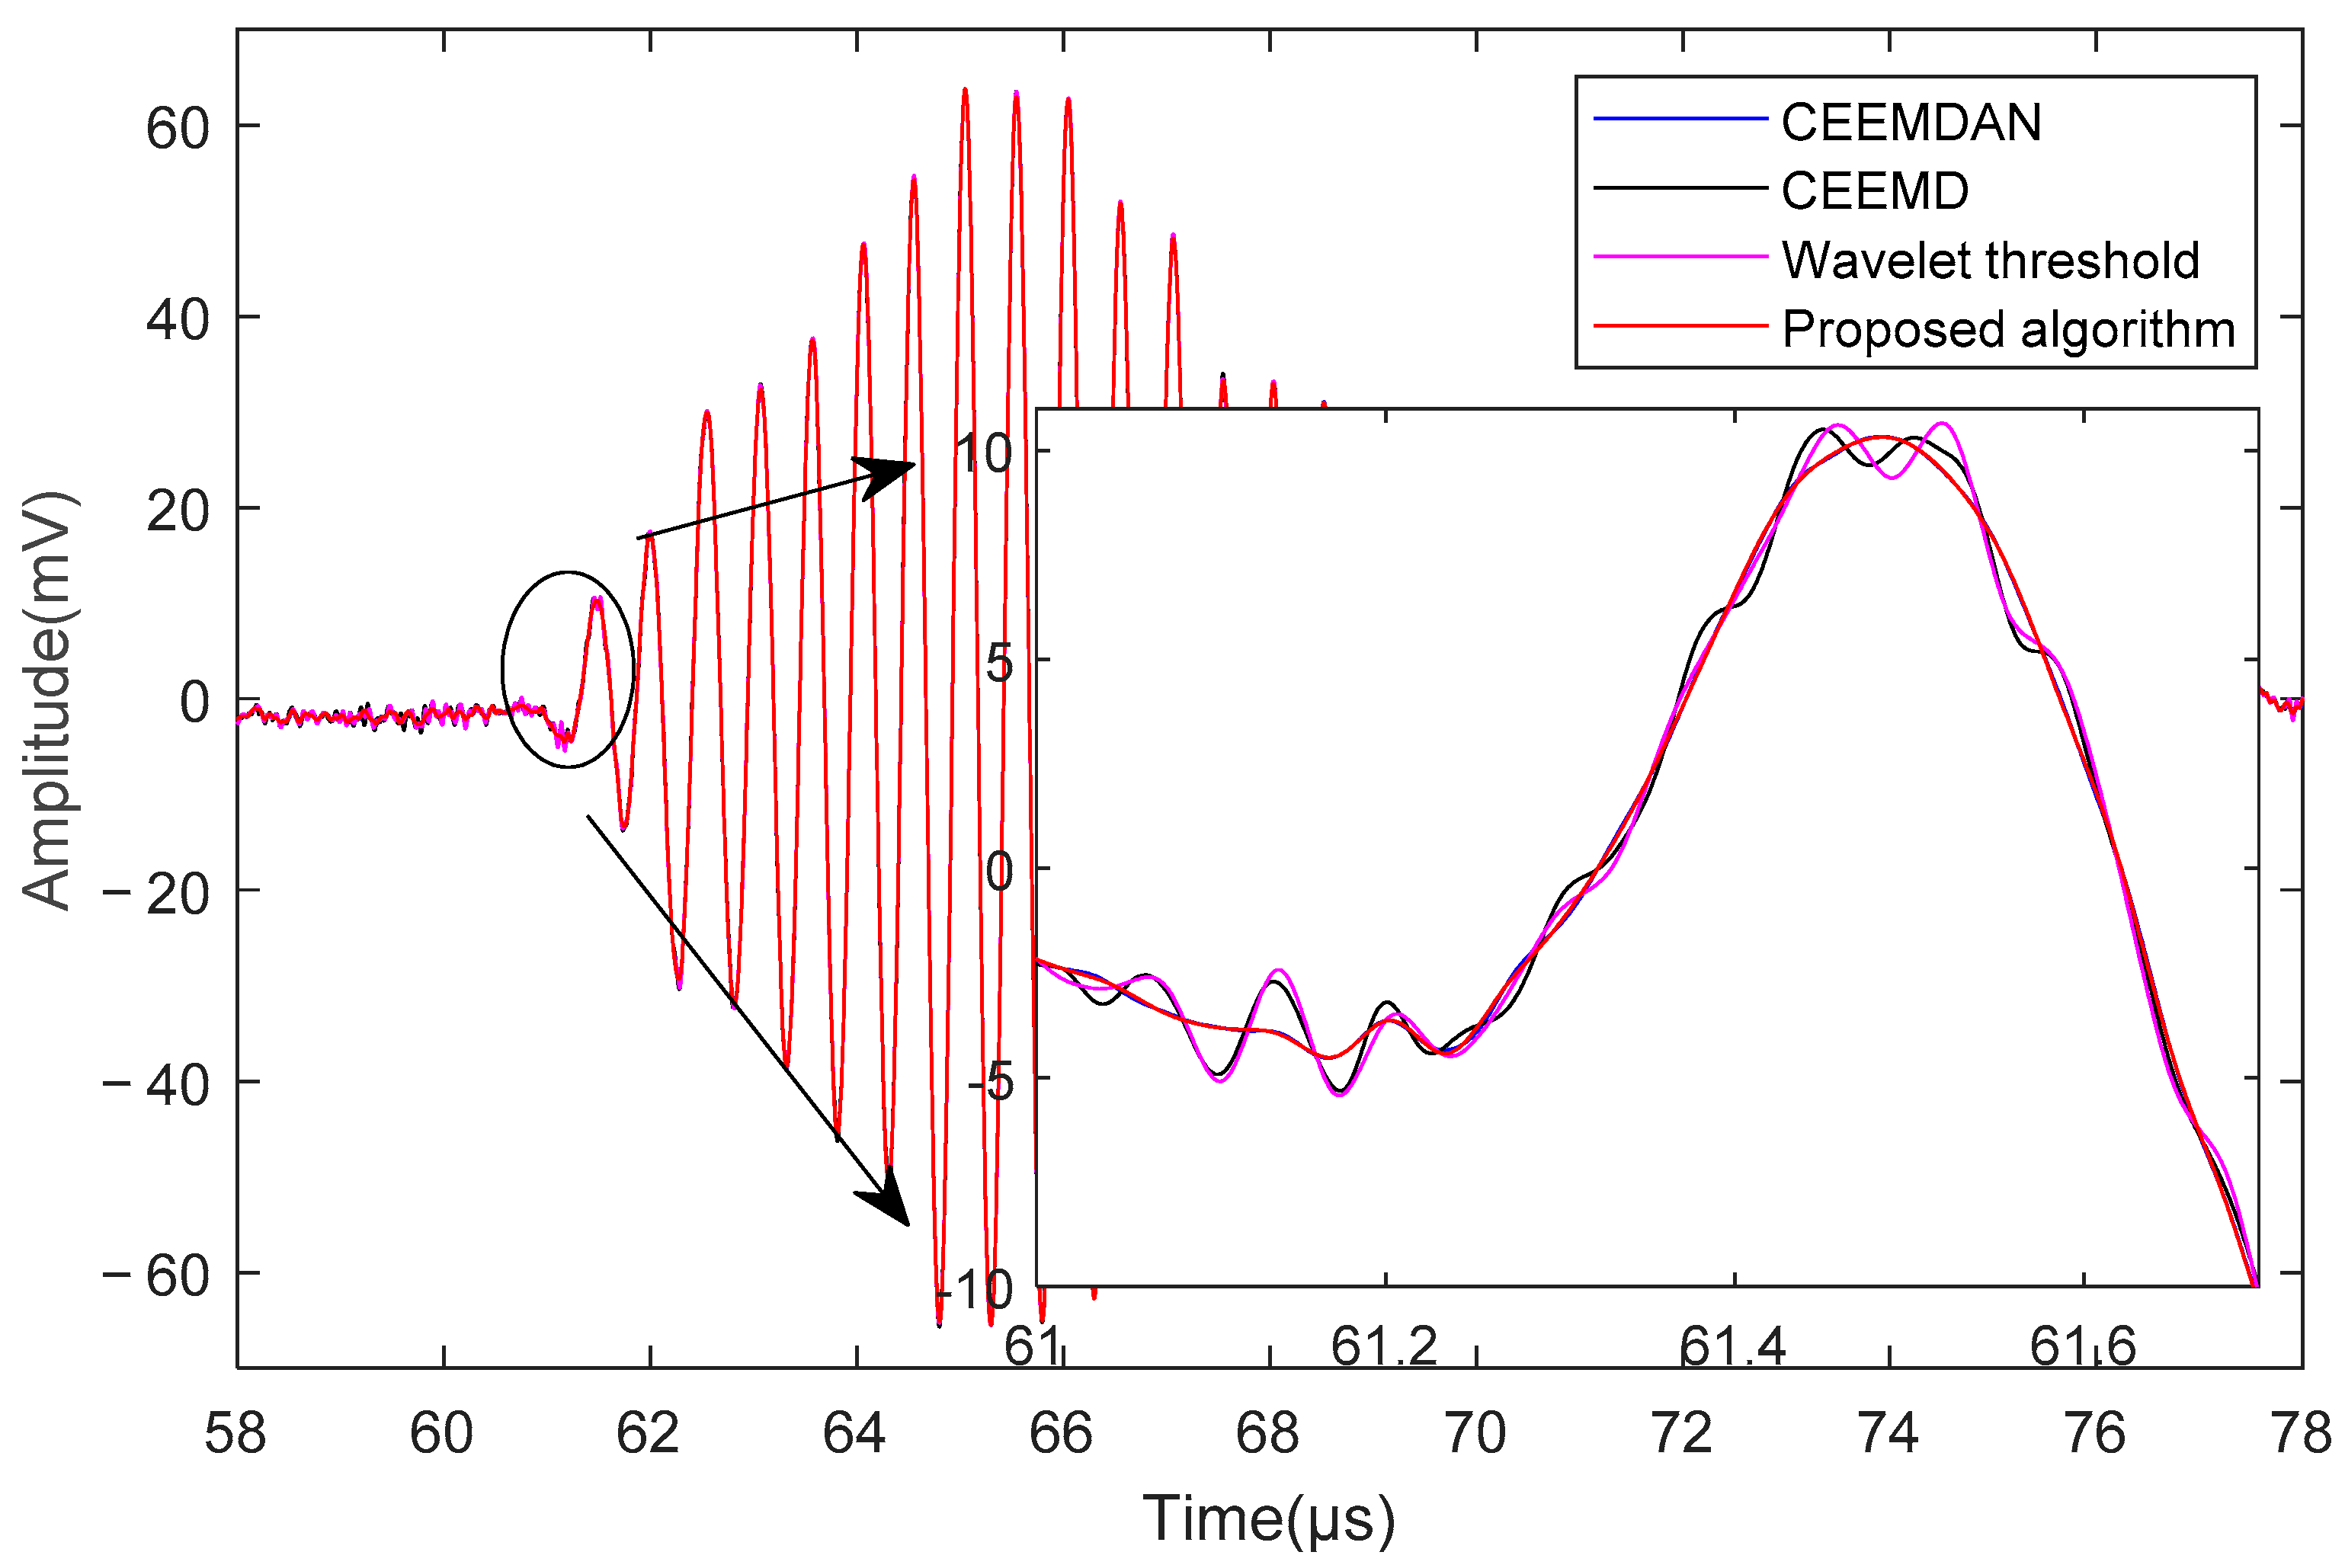
| Denoising Algorithm | SNR (dB) | RMSE | NCC |
|---|---|---|---|
| CEEMD | 16.3761 | 0.0379 | 0.98845 |
| CEEMDAN | 19.9904 | 0.0250 | 0.99500 |
| Wavelet Threshold | 20.1588 | 0.0245 | 0.99527 |
| Proposed Algorithm | 21.8262 | 0.0202 | 0.99675 |
| Group | Research Methodology | SNR (dB) | RMSE | References |
|---|---|---|---|---|
| A | VMD-MIE-WTD | 20.494 | 0.021 | [30] |
| B | CEEMD-GRA-SSWT | 20.936 | 0.020 | [33] |
| C | Proposed Algorithm | 21.062 | 0.019 | * |
| (a) | |||||||||
|---|---|---|---|---|---|---|---|---|---|
| IMF1–2 | IMF2–3 | IMF3–4 | IMF4–5 | IMF5–6 | IMF6–7 | IMF7–8 | IMF8–9 | IMF9–10 | |
| 2.729 | 2.688 | 2.630 | 2.490 | 2.372 | 2.579 | 2.778 | 0.987 | 1.529 | |
| (b) | |||||||||
| IMF10–11 | IMF11–12 | IMF12–13 | IMF13–14 | IMF14–15 | IMF15–16 | IMF16–17 | IMF17–R | ||
| 2.120 | 2.531 | 3.135 | 4.540 | 5.775 | 6.364 | 7.000 | 7.586 | ||
Disclaimer/Publisher’s Note: The statements, opinions and data contained in all publications are solely those of the individual author(s) and contributor(s) and not of MDPI and/or the editor(s). MDPI and/or the editor(s) disclaim responsibility for any injury to people or property resulting from any ideas, methods, instructions or products referred to in the content. |
© 2023 by the authors. Licensee MDPI, Basel, Switzerland. This article is an open access article distributed under the terms and conditions of the Creative Commons Attribution (CC BY) license (https://creativecommons.org/licenses/by/4.0/).
Share and Cite
Li, Z.; Xu, H.; Jiang, B.; Han, F. Wavelet Threshold Ultrasound Echo Signal Denoising Algorithm Based on CEEMDAN. Electronics 2023, 12, 3026. https://doi.org/10.3390/electronics12143026
Li Z, Xu H, Jiang B, Han F. Wavelet Threshold Ultrasound Echo Signal Denoising Algorithm Based on CEEMDAN. Electronics. 2023; 12(14):3026. https://doi.org/10.3390/electronics12143026
Chicago/Turabian StyleLi, Zhiwei, Huyue Xu, Bibo Jiang, and Fangfang Han. 2023. "Wavelet Threshold Ultrasound Echo Signal Denoising Algorithm Based on CEEMDAN" Electronics 12, no. 14: 3026. https://doi.org/10.3390/electronics12143026
APA StyleLi, Z., Xu, H., Jiang, B., & Han, F. (2023). Wavelet Threshold Ultrasound Echo Signal Denoising Algorithm Based on CEEMDAN. Electronics, 12(14), 3026. https://doi.org/10.3390/electronics12143026