1. Introduction
With the largest economy in Africa and a population of over 200 million people, Nigeria is currently unattractive to foreign investors due to its energy crisis, and businesses have moved to neighbouring African countries to avoid higher production costs [
1,
2,
3]. Due to its insufficient electricity supply, commercial and residential buildings use noisy fossil fuel-powered electric power generators to power their homes and businesses. According to recent reports, Nigeria spends about USD 4.65 billion on power generator fuel [
4].
Nigeria’s energy access rate stands at approximately 60%, indicating a significant energy gap compared to other nations. The increasing population has resulted in a pressing requirement to enhance the electricity supply to meet the escalating demand [
1,
2,
3,
4]. Furthermore, there is a notable discrepancy between the power stations’ installed capacity and their actual electricity output. The Nigerian government has implemented measures to revamp the energy sector with the aim of generating sufficient revenue to support infrastructure investments [
5]. The proposed measures involve the implementation of deregulation and restructuring policies in the oil and gas industries, along with the privatisation of the power sector. The government implemented a two-stage process for the privatisation of power generation and distribution to facilitate increased investments in the restructuring of the power sector. The observed data indicate that efforts are underway to operationalise the policies [
5,
6]. The analysis suggests that further measures are necessary and that the existing policies must be regularly assessed and revised to ensure their applicability in the face of worldwide, domestic, and regional advancements.
Electricity availability, supply, demand, and consumption are crucial for population growth, rural–urban integration, and economic growth [
1,
5]. Thus, Nigerian decision-makers should remove or reduce power sector investment barriers. They should also incentivise industry investments [
5,
6].
In 2001, the Nigerian government started privatising and restructuring the power sector to boost electricity generation and distribution [
7]. However, despite decades of energy sector reform, Nigeria still does not have enough electricity to feed the economy and power residential homes and commercial and industrial businesses [
8].
Due to the rise in population worldwide, there is an ongoing need to ensure that the generation and supply of electric power are adequate to meet the requirements of the commercial, industrial, residential, and transportation sectors. Therefore, planning to expand power systems is performed to determine the best approach in extending power generation, transmission, and distribution networks at the lowest possible cost, while making room for future expansion [
9].
The objective of this study is to conduct a comprehensive analysis of the Nigerian electricity industry, with a focus on evaluating the effects of policies on electricity production and distribution from 2001 to 2020. Additionally, the study aims to construct a deterministic model that can assist future policymakers.
This paper has the following structure. The related work is presented in
Section 2, while
Section 3 describes the results of the analyses conducted on nine electricity policies in Nigeria between 2001 and 2020. The architecture of the decision support tool for accessing the feasibility and operation cost of electric power systems is described in
Section 4.
Section 5 highlights the discussion and performance results of the case study used in this paper to demonstrate the operation of the decision support tool (DST). Limitations of this study are discussed in
Section 6, and lastly, the conclusions are provided in
Section 7.
2. Literature Review
Generation expansion planning (GEP) and transmission expansion planning (TEP) are the two most common kinds of planning for expanding a power system. GEP and TEP are immensely helpful in assessing the feasibility of obtaining the desired outputs from building new generation power plants or new transmission facilities due to the high capital investments required for these projects. [
10,
11].
The 2018 study by Gacitua, Gallegos, and others argue that the complexity of modern energy systems makes it challenging to construct models that accurately represent long-term horizons while preserving computational compliance. Because of this, several models have been developed for expansion planning. These models have been designed to provide each study with adequate coverage while maintaining an overall system perspective. According to Zhu and colleagues, GEP is a complex problem because of the power generation units’ size, non-linearity, and long-term nature [
12,
13].
GEP has always attracted more attention from investors and customers due to the high investment required to increase energy production. This is because GEP is more environmentally friendly. The investment planning for GEP should consider the following factors: timeframe, new generation units technology, size, investment recovery, and risks. This will ensure that investors achieve a good return on their capital and that end consumers are happy with the product. The primary goal of the GEP is to expand the existing power system to meet the anticipated increase in future demand, while simultaneously meeting the criteria for system reliability [
10].
While conducting this study’s literature review, previous studies on several electricity policies in Nigeria were reviewed [
1,
14,
15,
16,
17,
18]. The nine policies outlined in
Table 1 were chosen to receive an in-depth analysis as part of this research project to understand better how they impacted the nation’s capacity for the generation and distribution of electricity between the years 2001 and 2020. The total amount of electricity generated and the years in which the policies were implemented are presented in
Figure 1. In addition, the characteristics of the policies that influenced the generation and supply of electricity in Nigeria over 20 years were investigated in this study.
It was noted that tools developed in previous studies such as [
19,
20,
21,
22,
23] were complex and required an in-depth technical knowledge of electrical engineering, programming, or planning to use. Hence, in this study, we developed an accessible deterministic modelling tool to aid policymakers and planners in estimating the feasibility and cost of different investment options during generation expansion planning (GEP) and transmission expansion planning (TEP). An IEEE 30-bus system will be used to demonstrate the working of the tool in this study.
3. Materials and Methods
The first part of this research involved a detailed and critical literature review of the existing Nigerian government’s policies on energy and electric power generation and supply to determine if they are robust enough to support sustainable national electrification and to ascertain their contributions to the power sector between 2001 and 2020.
Due to the nature of this study, a mixed-method methodology was employed. This methodology consisted of conducting a literature review, research surveys such as questionnaires, and semi-structured face-to-face interviews. Both quantitative and qualitative methods were used to analyse the data collected during the process of validating the findings from various sources.
A total of 78 subject matter experts from the generation, transmission, and distribution arms of the Nigerian power sector, who participated in this study, were selected through purposive sampling. The survey was disseminated using JISC, which was also used to collect the survey results. The data collected from the interview and survey were analysed using Nvivo, SPSS, and MS Excel, and were used to study the impact that nine different policies had on the generation and supply of electricity between 2001 and 2020. In addition, this analysis was carried out to determine which policies would have been the most effective in meeting the electricity demand.
Grounded theory was used to study how the policies contributed to the sector’s performance by interviewing stakeholders in the sector. Then, these data were used to develop a theory that explains the performance of the policies. Social network analysis was used to study how the policies performed across the industry by collecting data from respondents from the generating, transmission, and distribution companies. Then, the data were used to understand how they interact with each other.
Finally, a forecast was built on future electricity generation and consumption levels in Nigeria based on historical information from 1990 to 2018. An ARIMA artificial neural network (ANN) built in SPSS was utilised to assist in developing a model for creating forecasted electricity generation up to the year 2030.
During the preliminary examination of the policies, the deterministic model utilised the recommendations made by experts in the relevant fields. Using the information from the survey and the policies, a deterministic model was built in MATLAB to simulate changes in the Nigerian transmission network based on the IEEE 30-bus system. The transmission network was adjusted based on forecast data and policy data for 2030, and the network’s power flow was calculated using the Newton–Raphson method. This model assessed the system’s feasibility and identified the scenario with the least operating cost.
3.1. Policy Examination
Participants were tasked with ranking nine distinct policies according to the electricity generation or supply growth they brought about in Nigeria between 2001 and 2020. Additionally, they were asked to explain how the policies contributed to the power industry.
Figure 2 and
Figure 3 show an overview of the survey participants’ information. The number of years of experience held by the participants, the kind of organisation for which they are employed, and the power sector in which they are active are all included in these data.
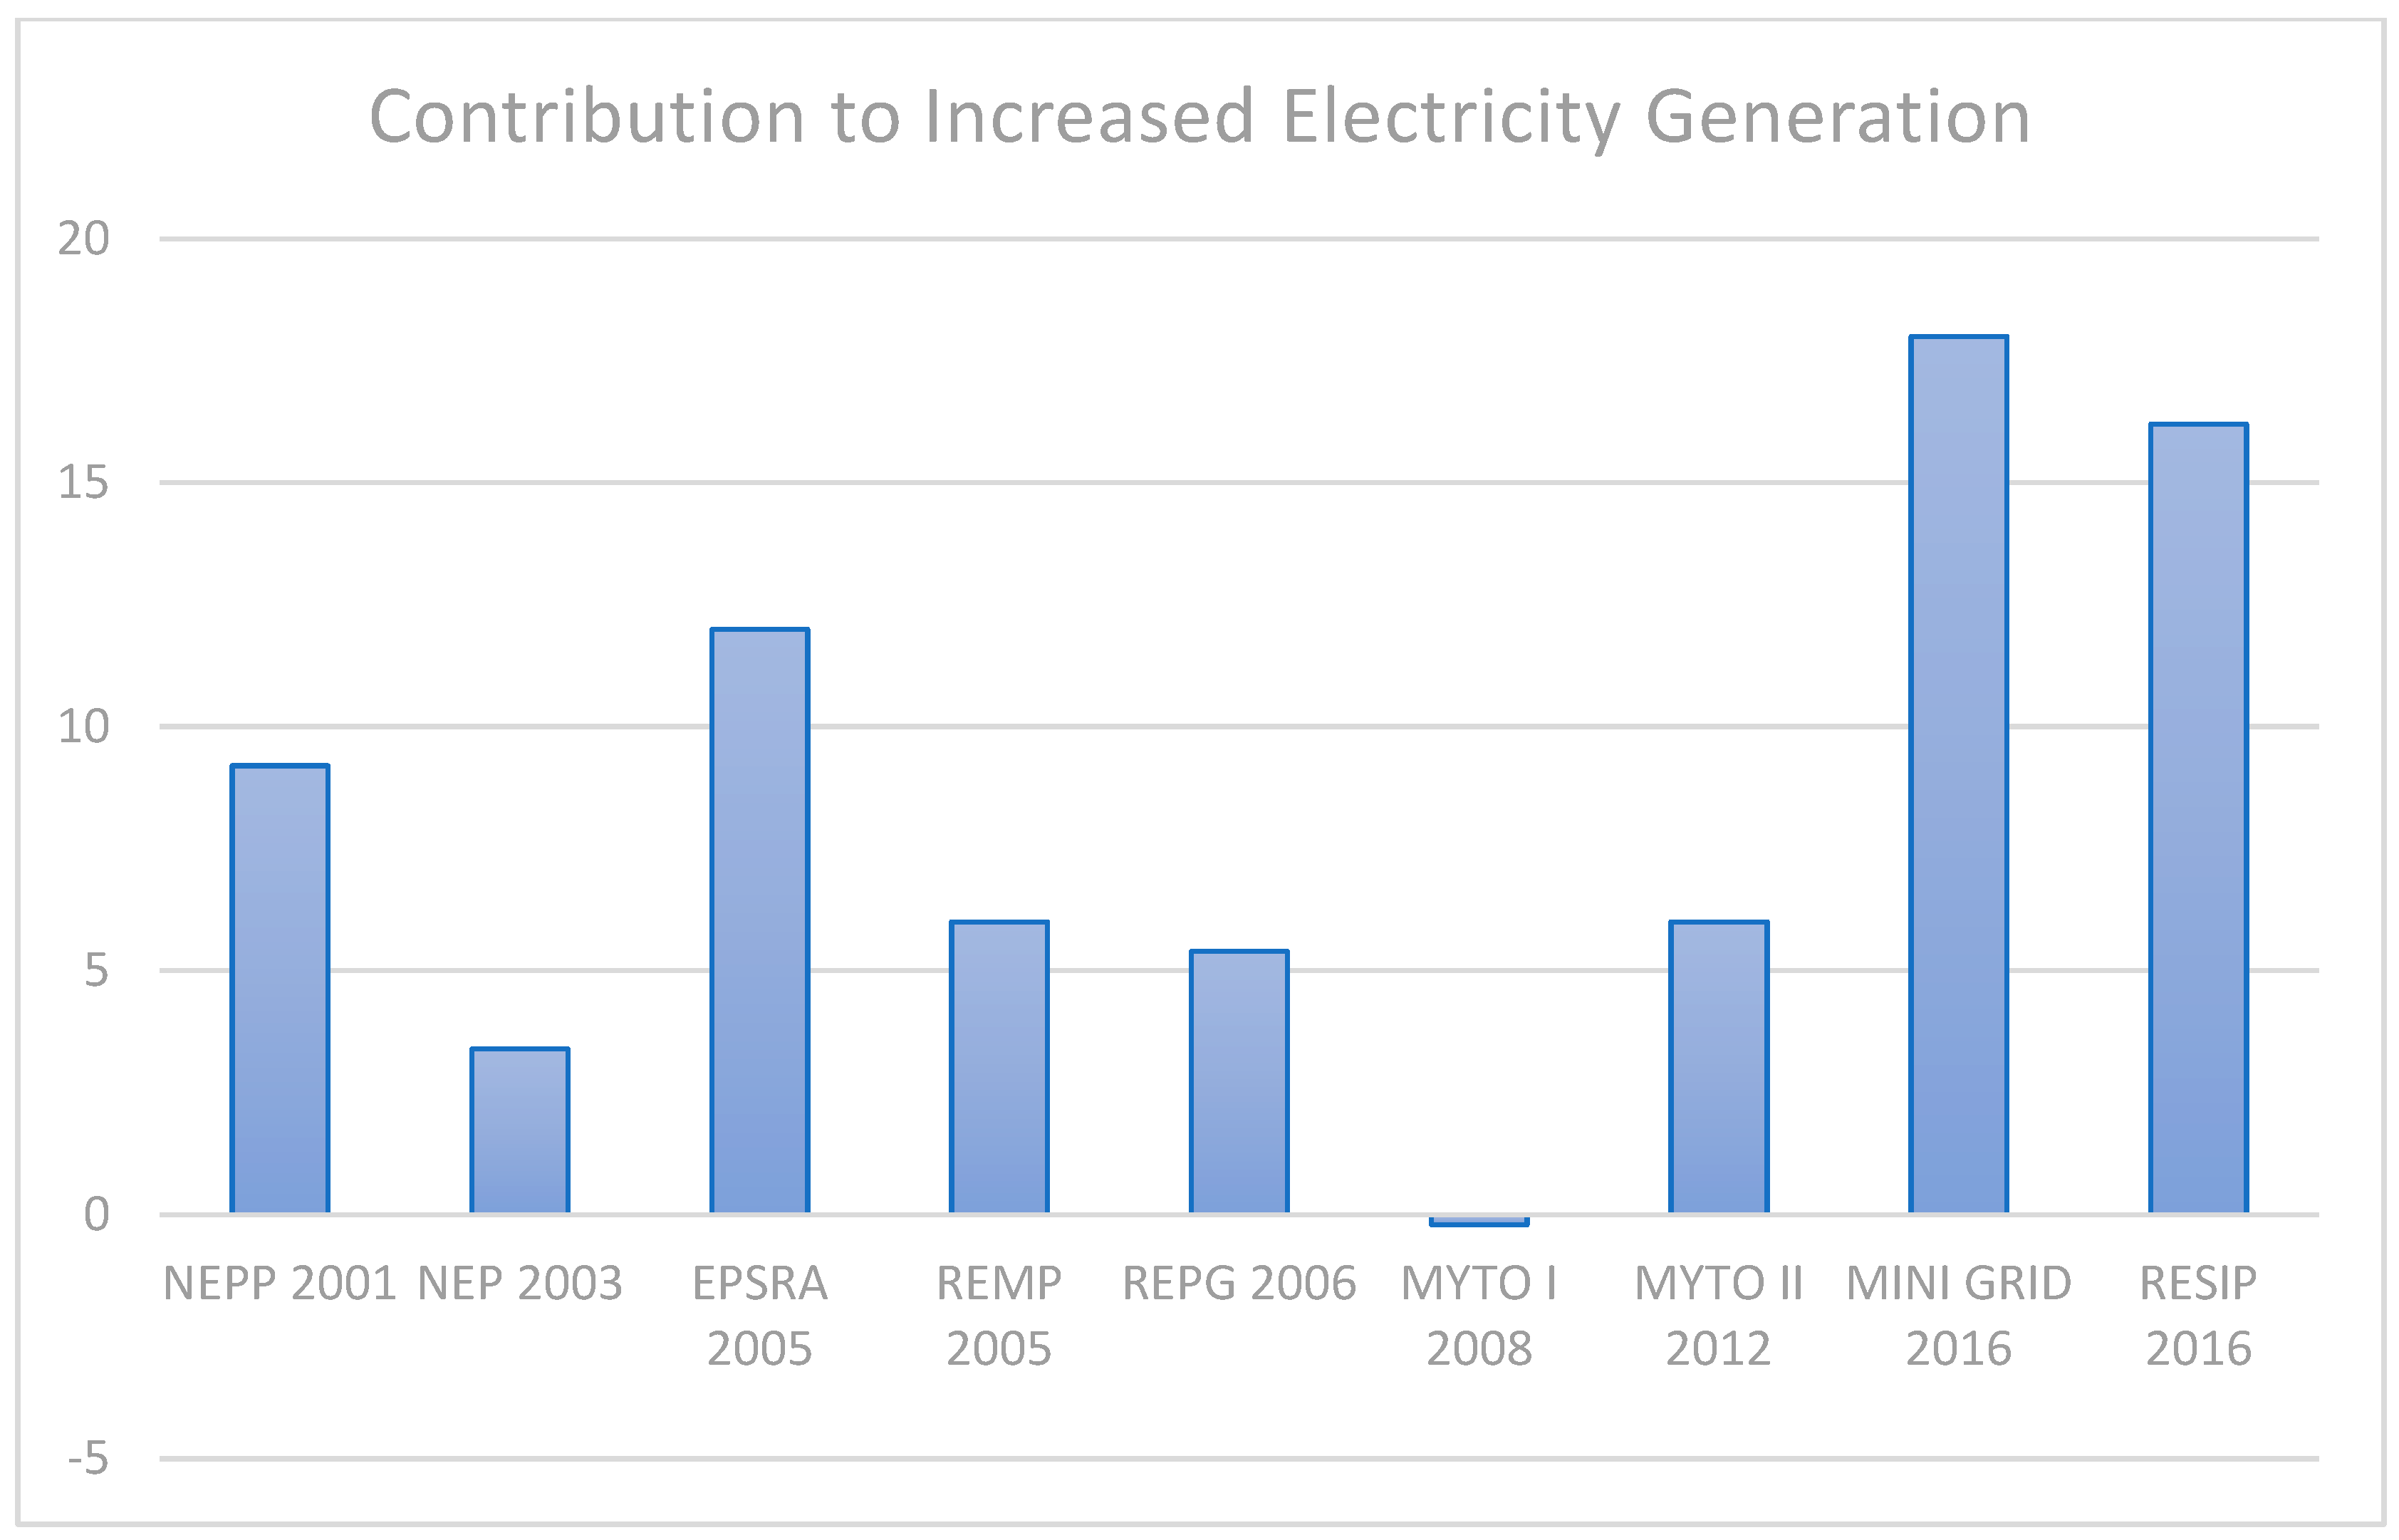
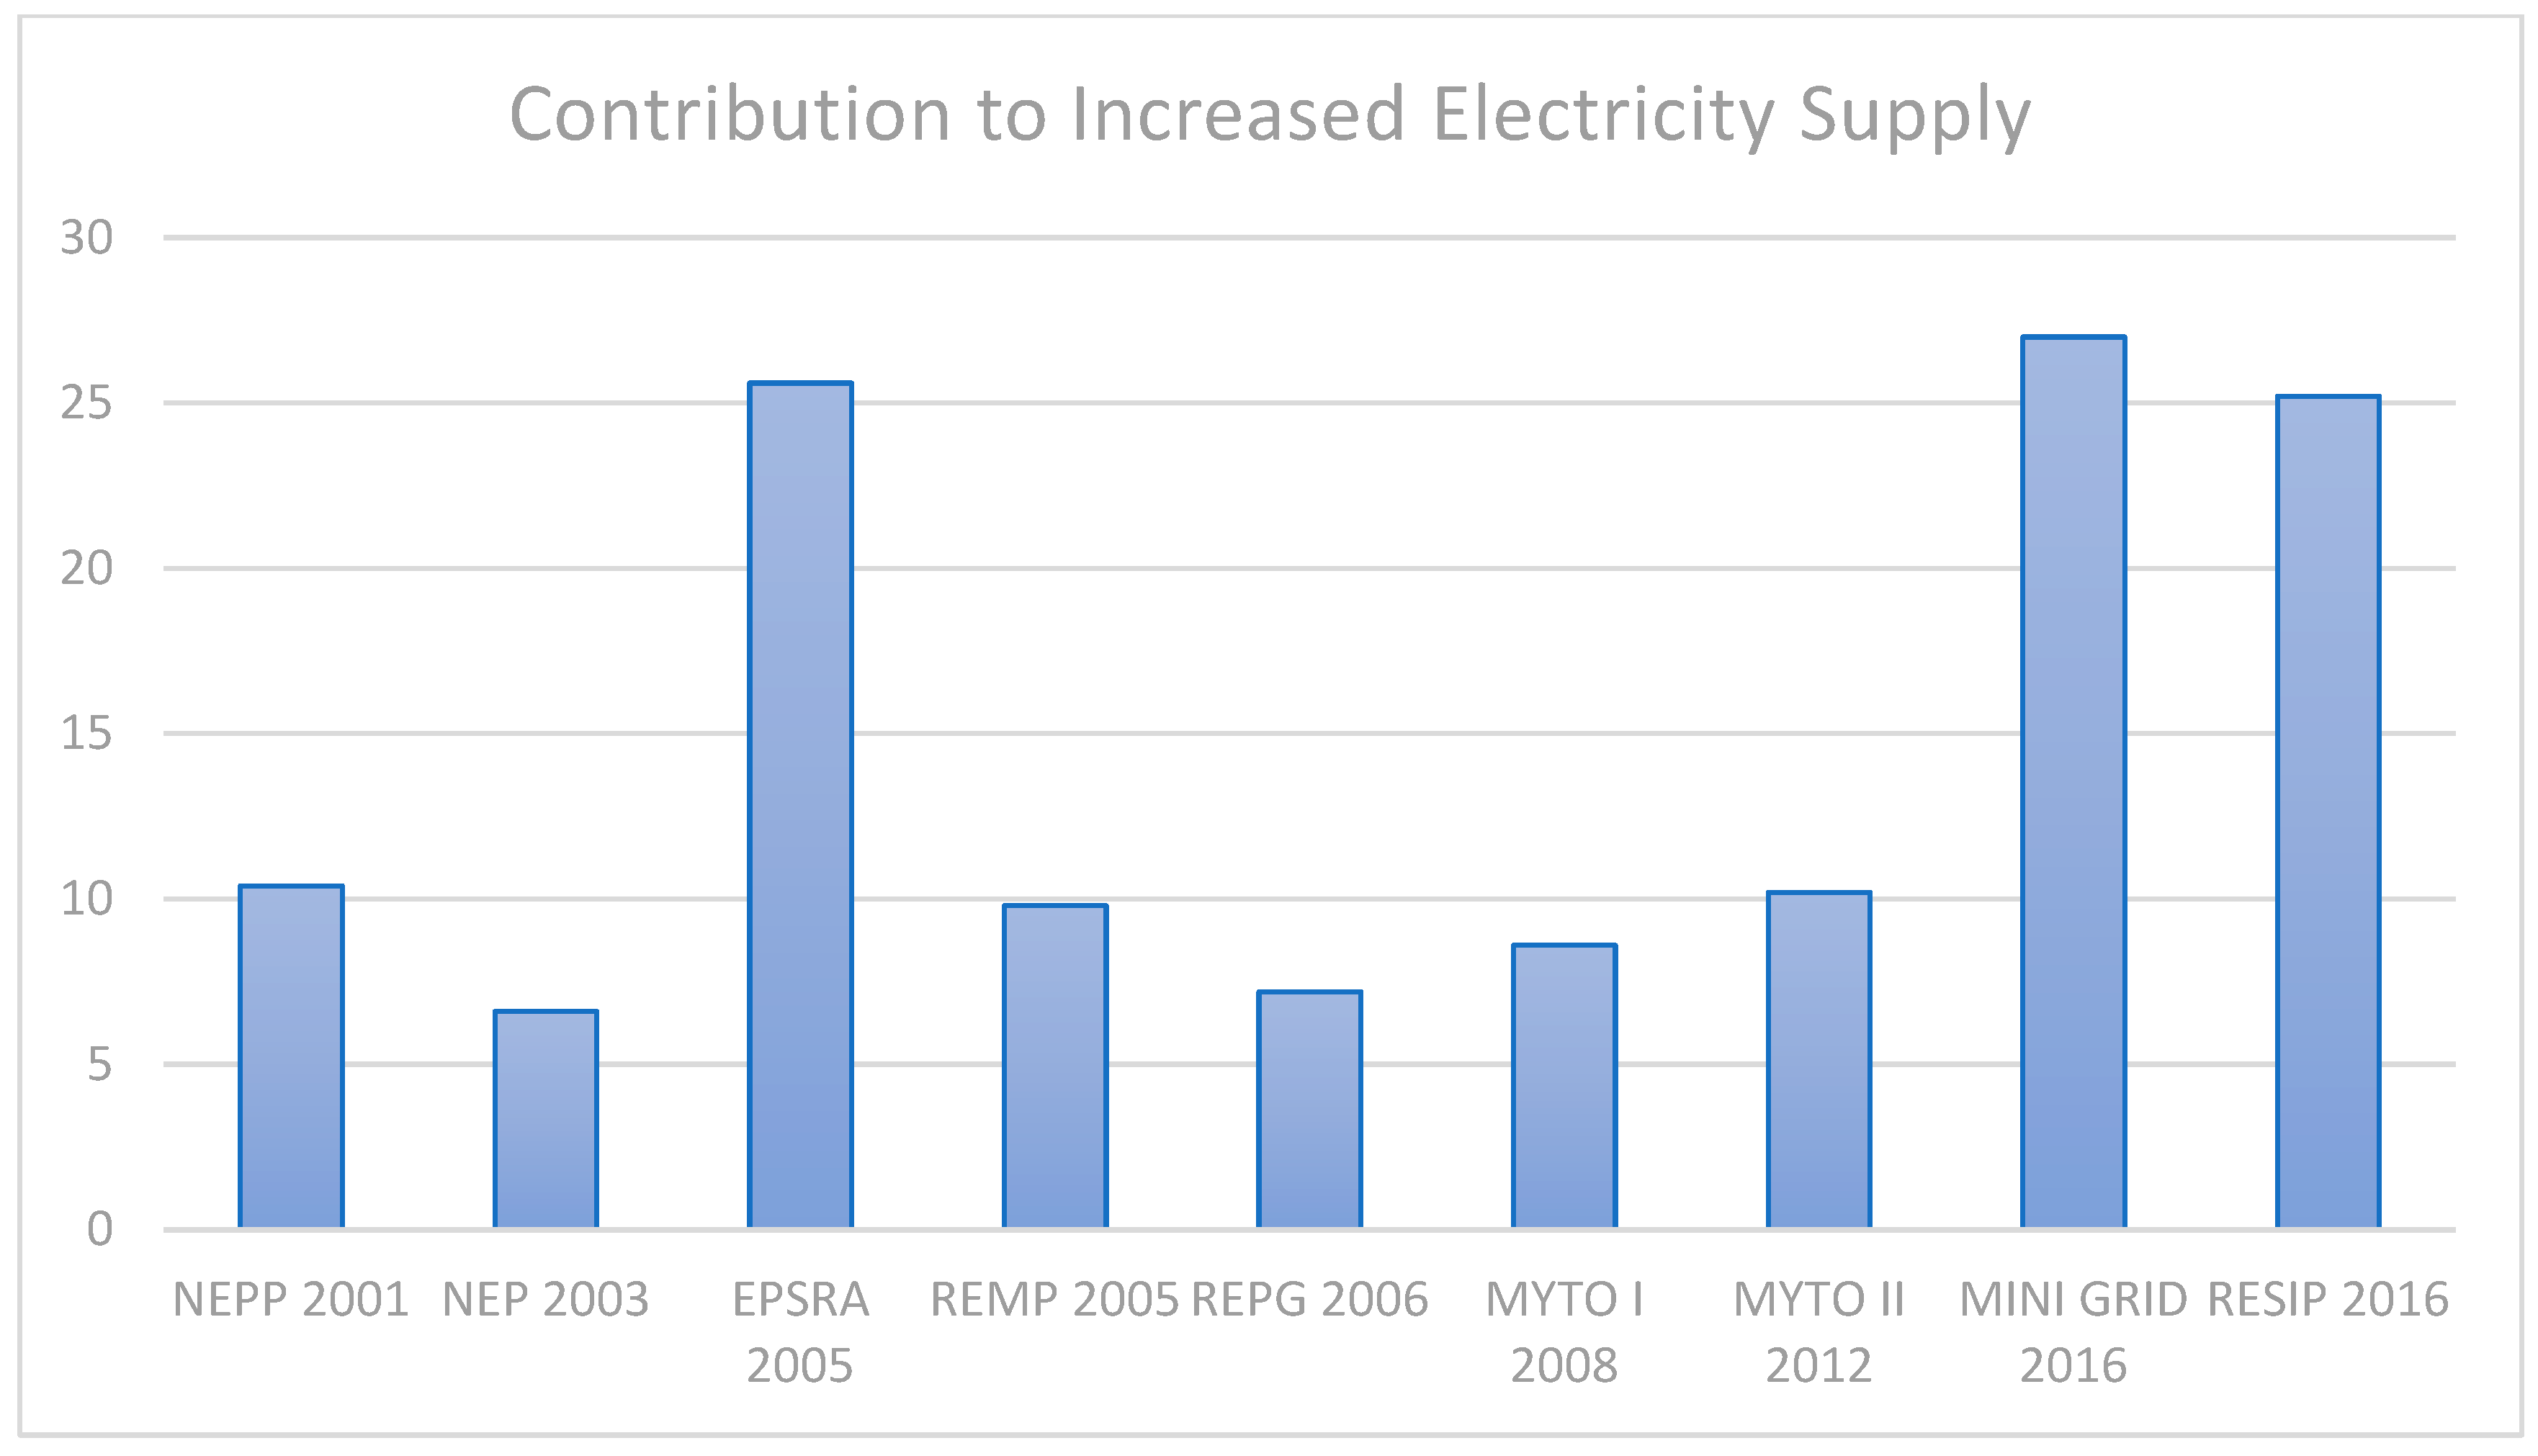
According to the results of the study, the policies referred to as Mini-grid (2016) and RESIP (2016) were the ones that performed the best in terms of both generation and supply, and both of which were introduced in 2016, as shown in
Figure 4 and
Figure 5.
Figure 6 shows that these two policies made it easier for the Rural Electrification Agency to provide electricity to areas that were previously unconnected to the primary transmission grid through mini-grids and to provide power to communities that were previously unreachable by the primary transmission grid. The Rural Electrification Agency was responsible for accomplishing this goal [
24]. This indicates that decision-makers and the government should either encourage more forms of electricity generation independent of the existing grids or continue with the current grid expansion programmes to support the electrification of the entire country.
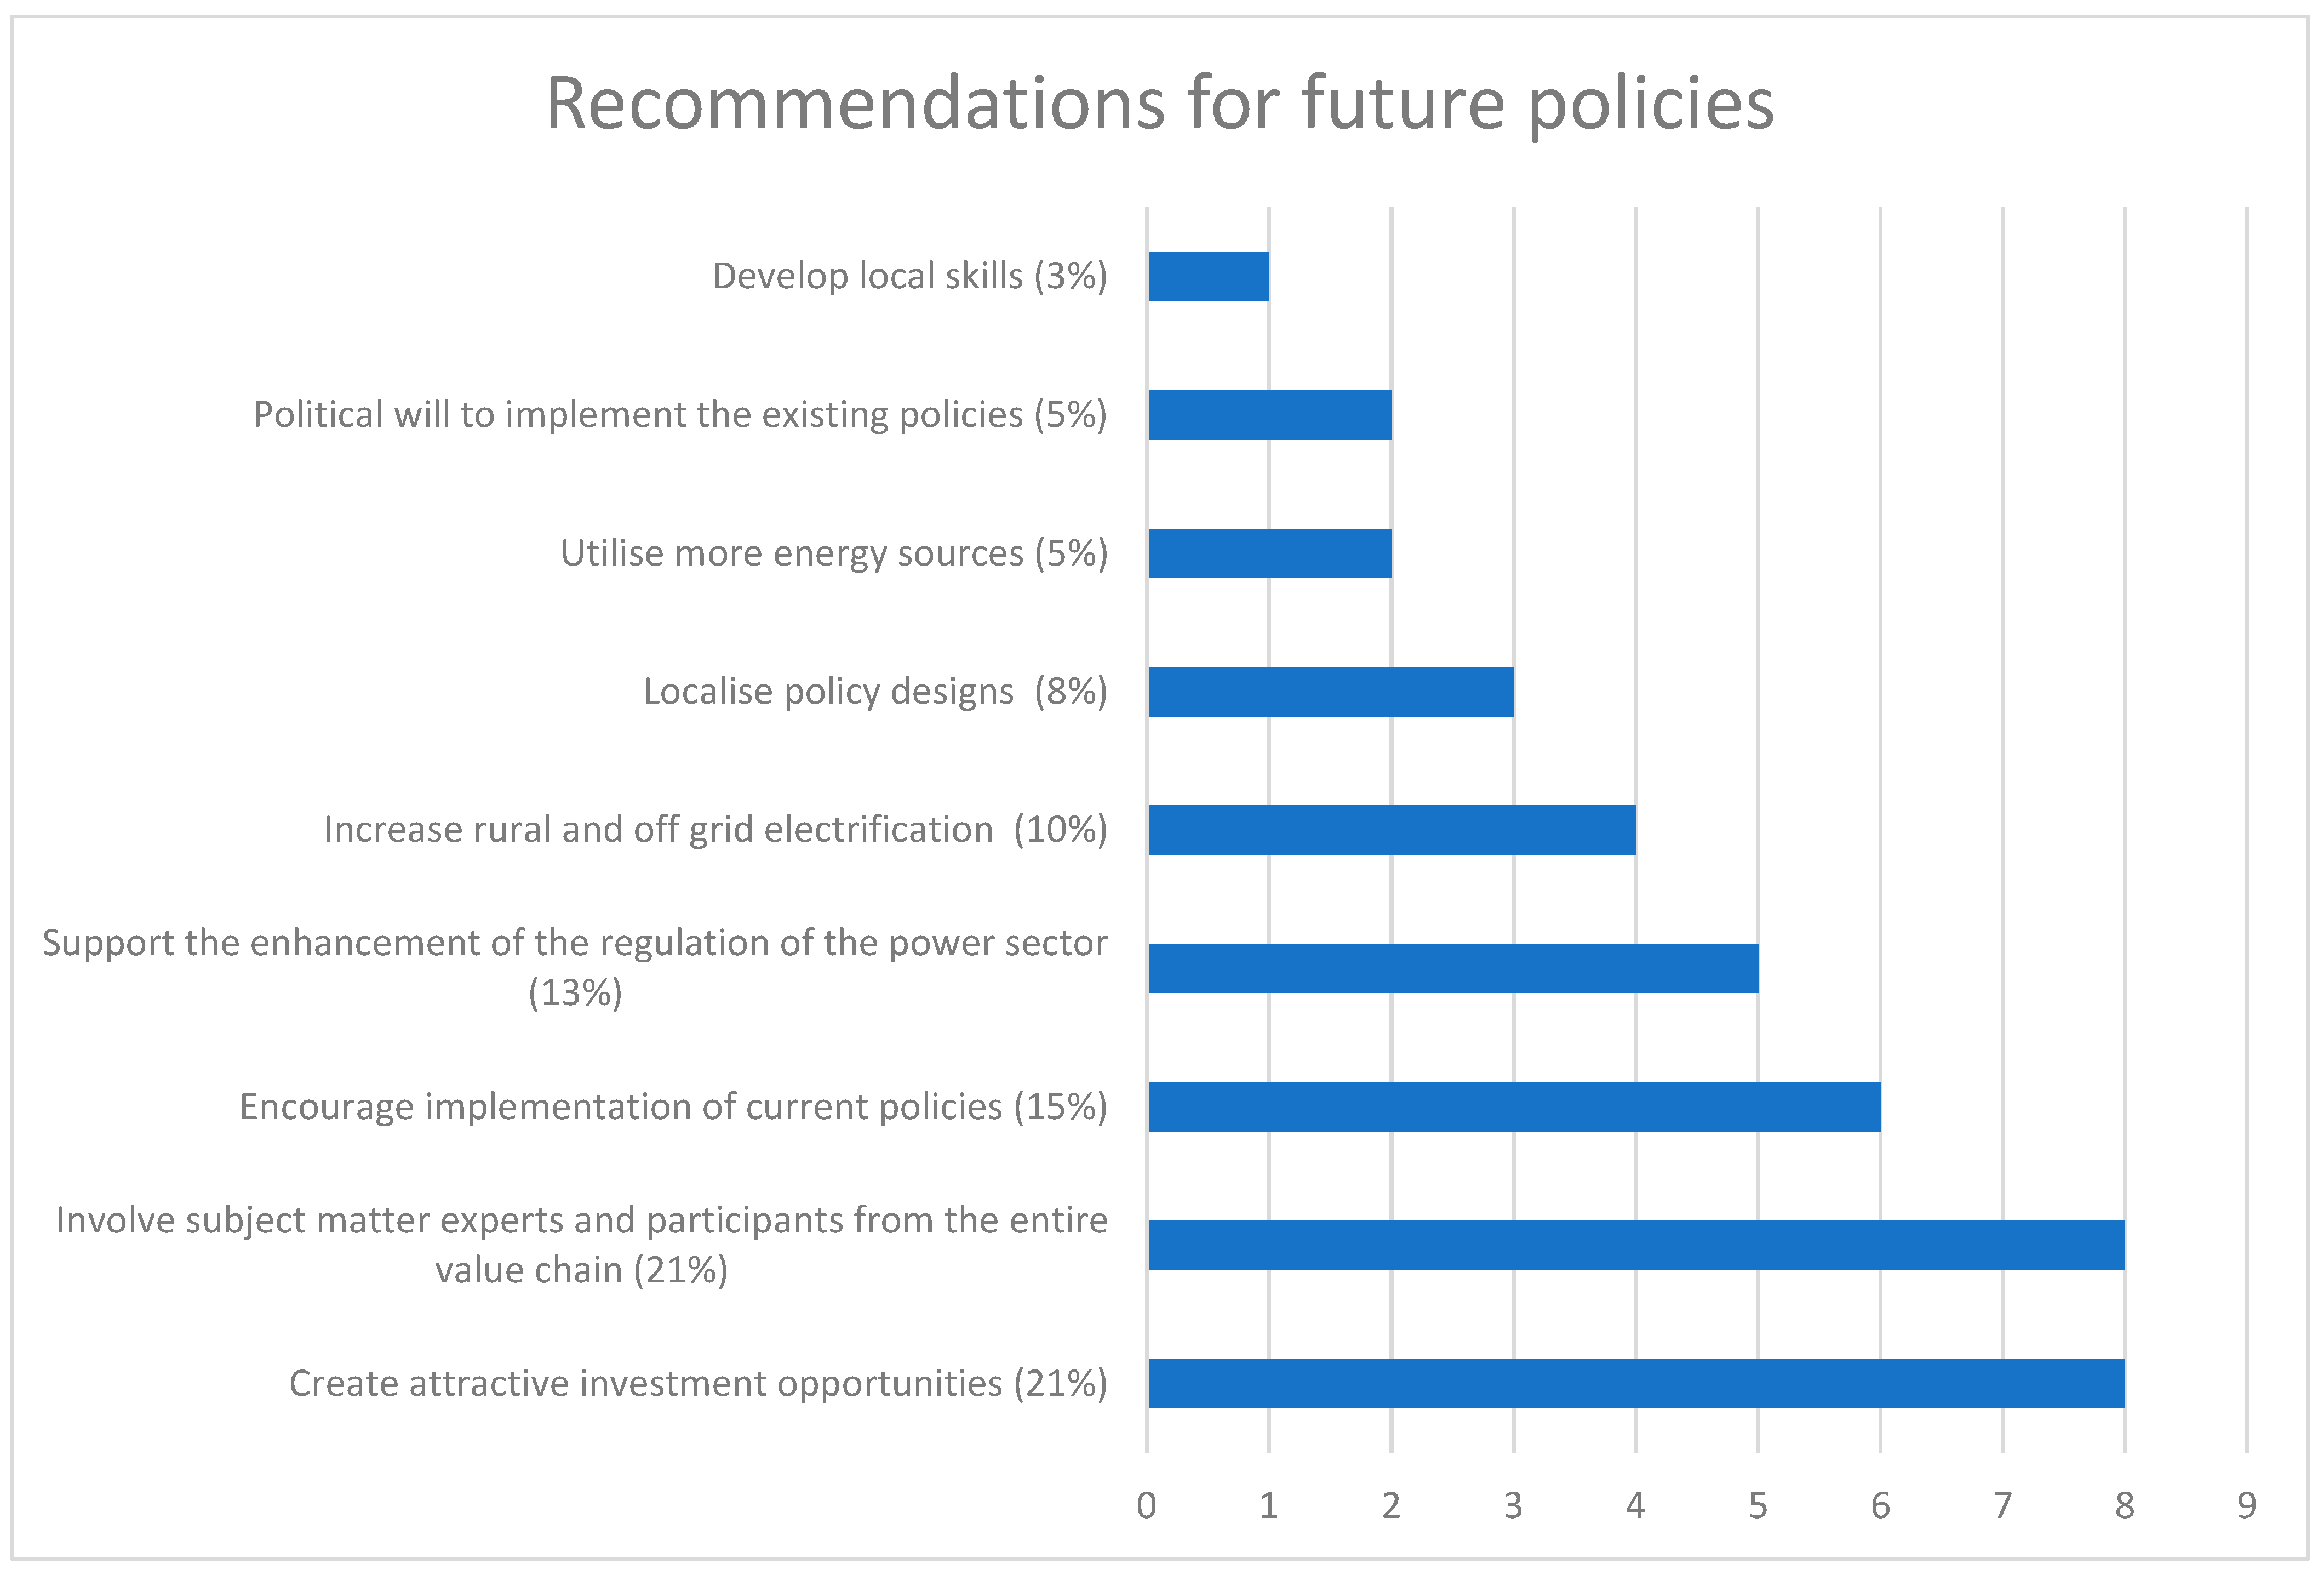
In conclusion, the participants discussed strategies for improving the nation’s electricity generation and supply by implementing new policies soon. The recommendations are laid out in
Figure 7 according to the frequency of occurrences.
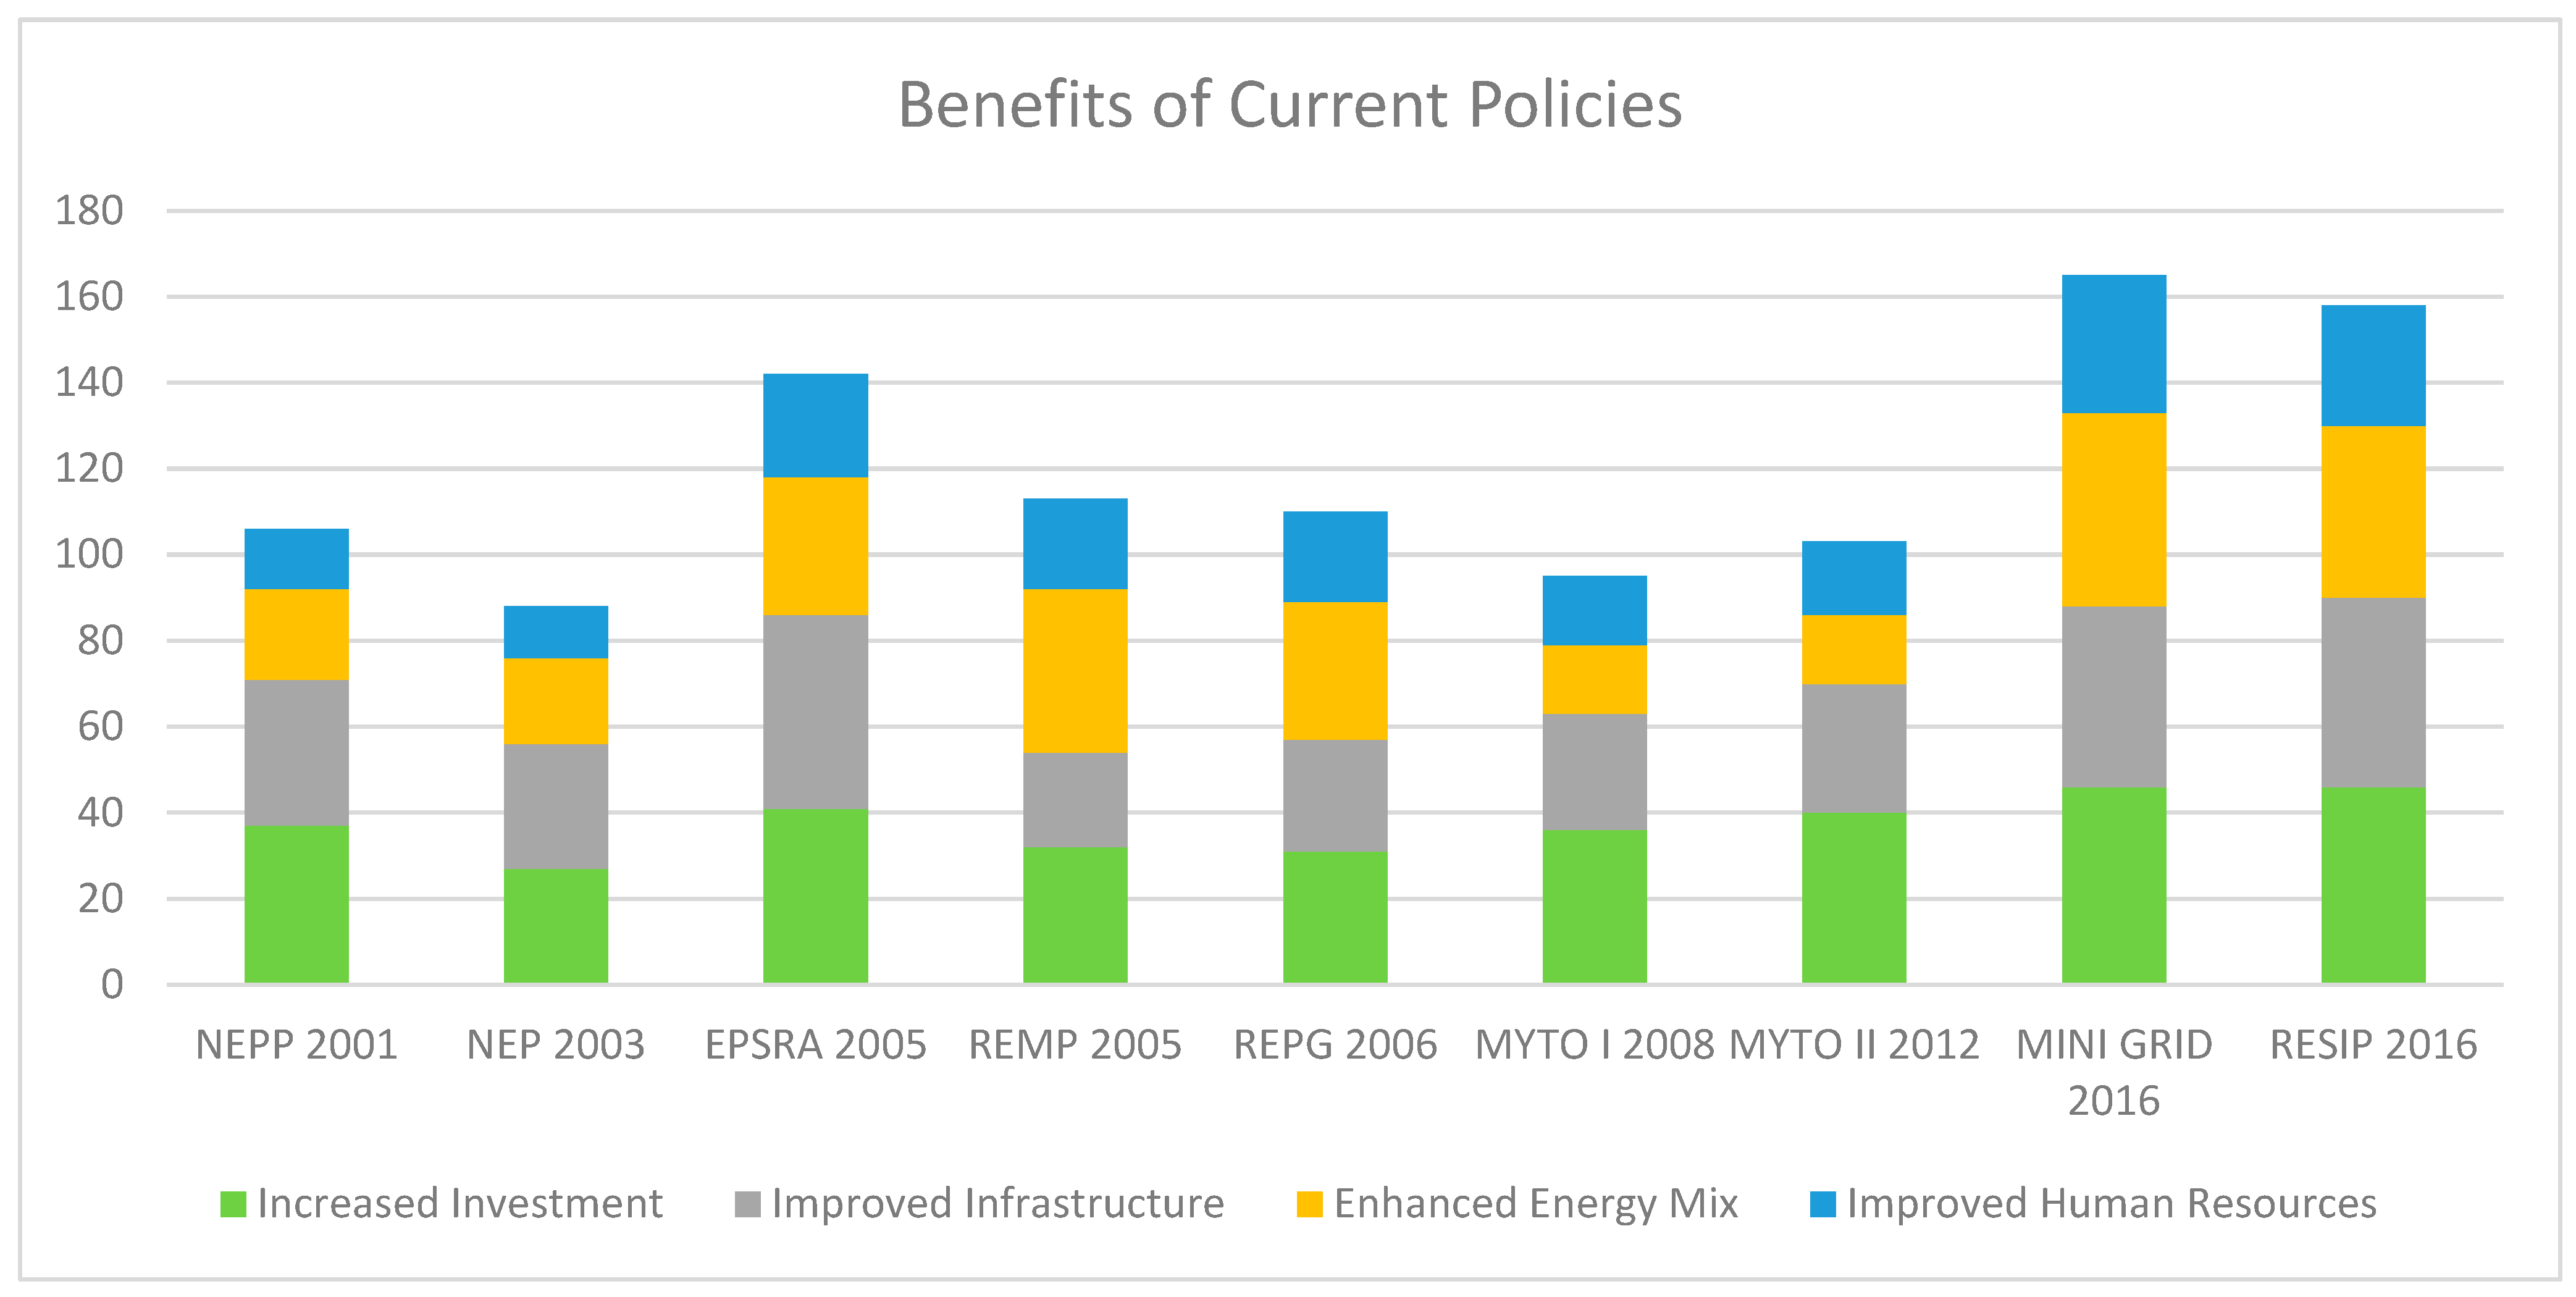
Figure 8 shows that overall, the policies have contributed to an increase in investment in the power sector (28%), improved infrastructure (27%), enhanced energy mix (26%), and improved human capital (18%) in the Nigerian electricity sector.
3.2. Forecasting Results
The observed electricity generation data and installed capacity between 1980 and 2018 were used to create forecast data between 2020 and 2050 in SPSS. The forecast data were used in the deterministic model to create new scenarios, combined with the survey outputs, to assess the feasibility of future policies in increasing electricity generation and supply.
Figure 9 shows the forecast data created in SPSS using the time-series ARIMA model.
A comparison of the performance of the system in its current vs. the forecast state in 2030 and against the policy case in 2030 was made using the tool by modelling multiple scenarios to: (1) observe the performance of each scenario and (2) identify areas for optimisation using the optimal power flow analysis provided via MATPOWER.
4. Decision Support Tool (DST)
Model Development Overview
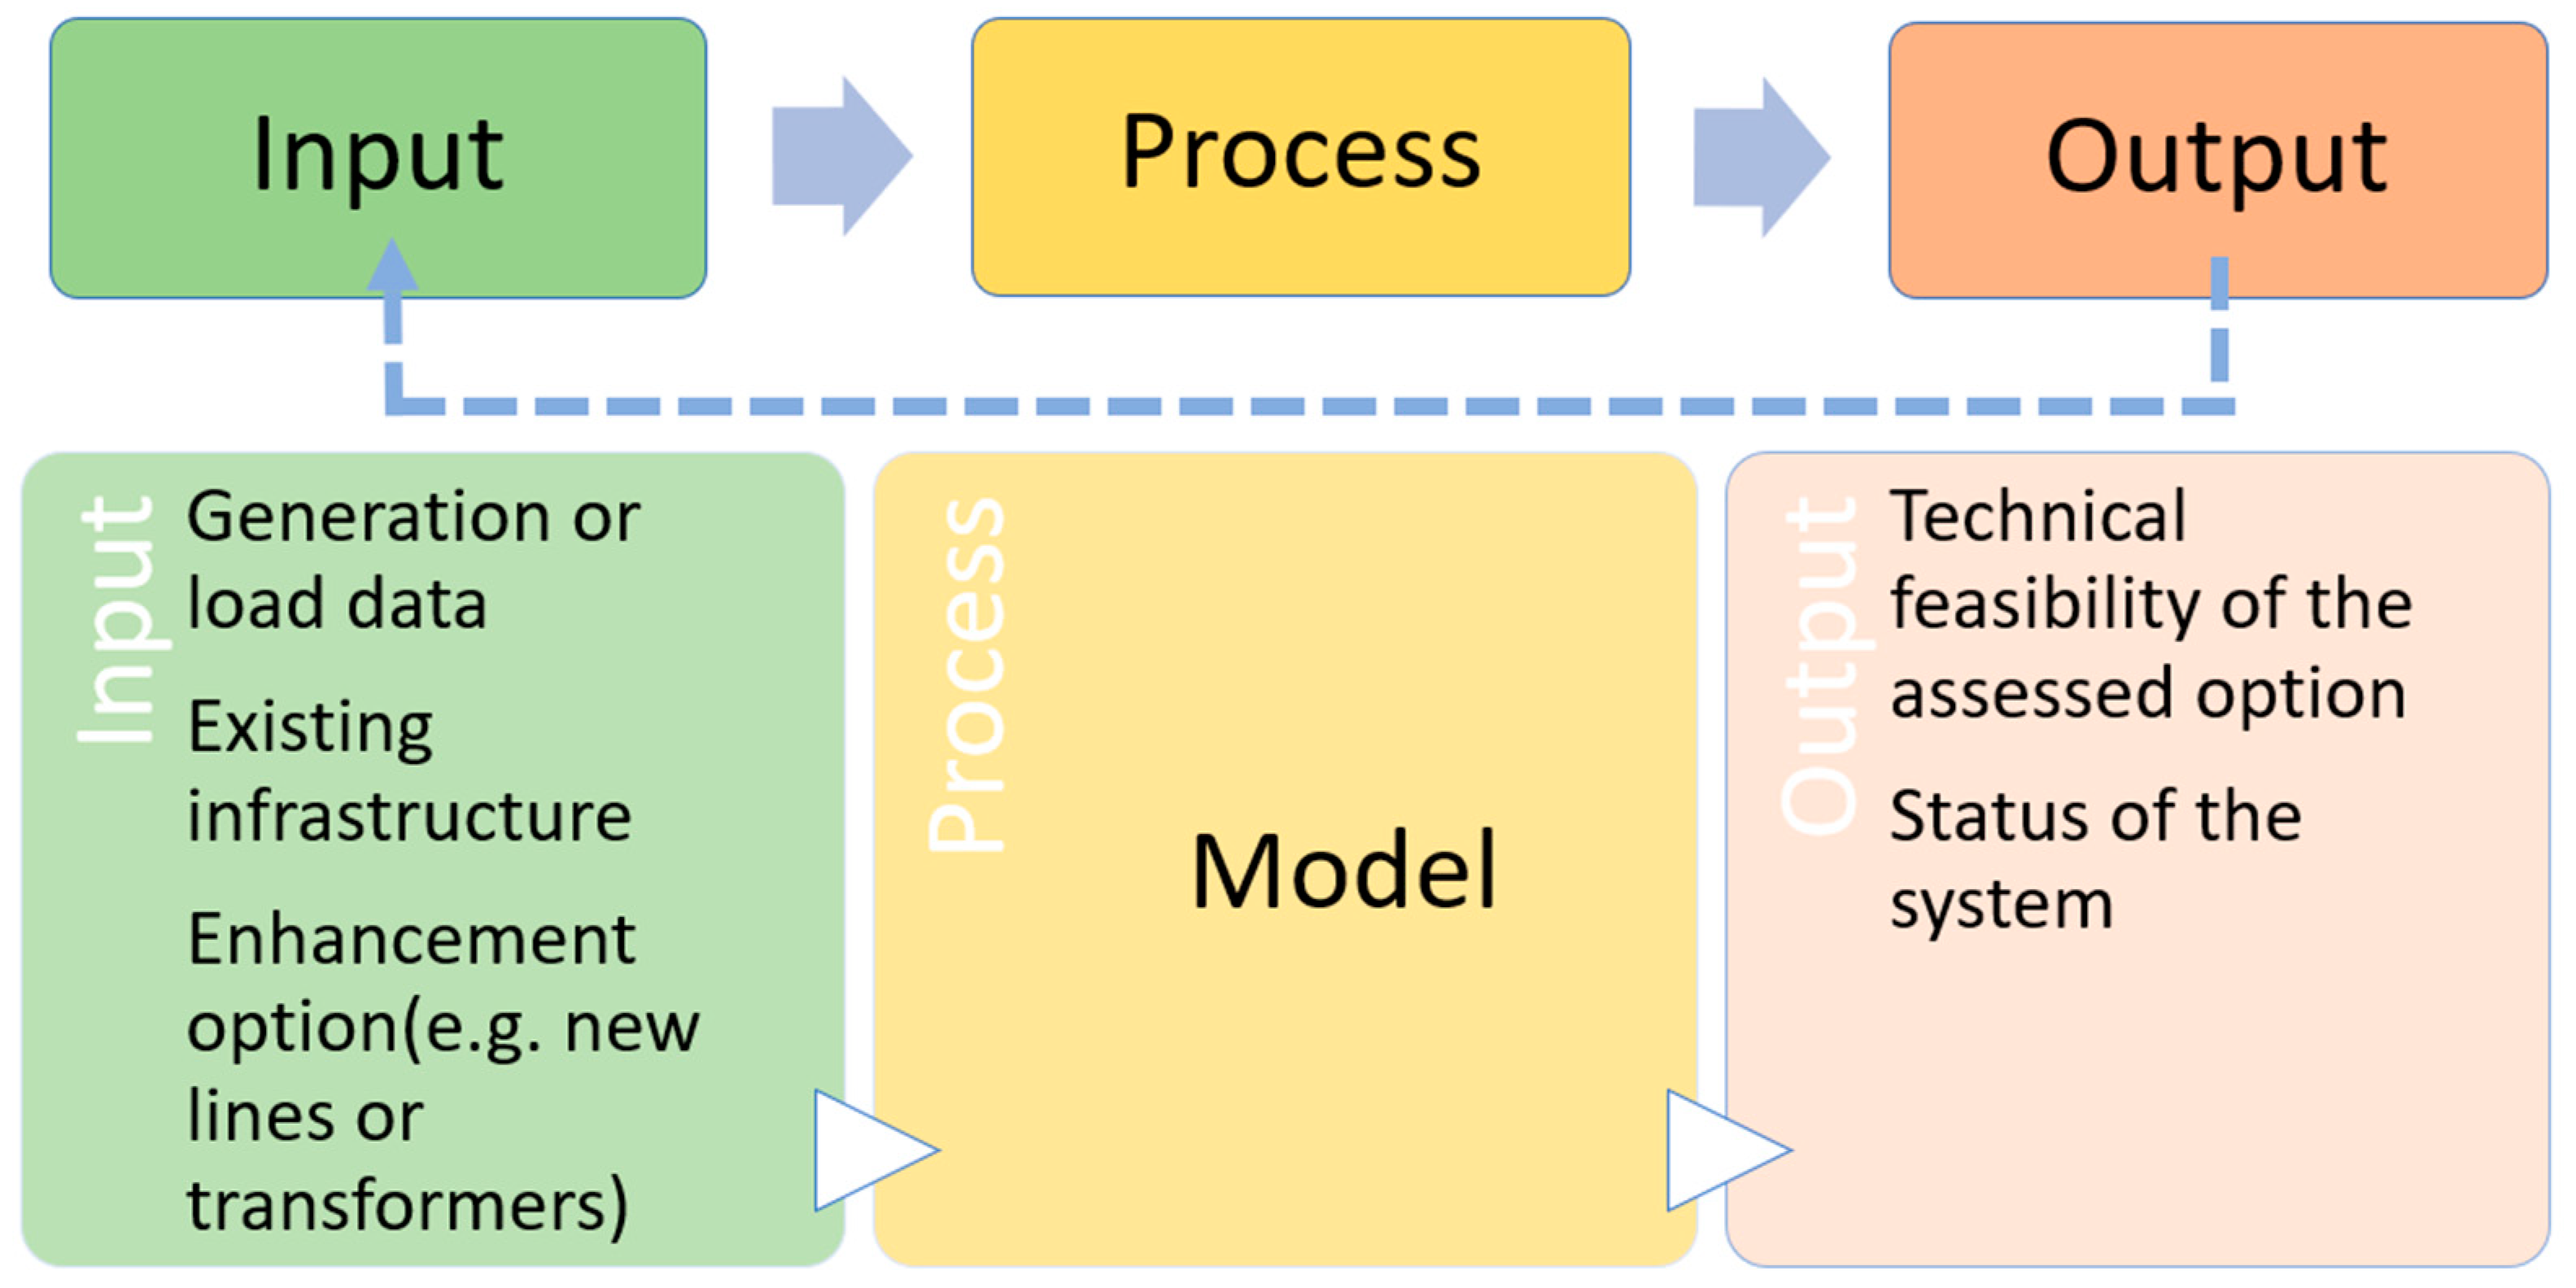
The forecast data from SPSS were used to create possible scenarios by adjusting the generation and load data. This information, in addition to the existing infrastructure, formed the inputs to the model. MATPOWER is an open-source tool used in MATLAB to run simulations and power flow analyses in this study. Power flow analyses were run on the scenarios to assess the technical feasibility of the options and the system’s status at the end of each run. In addition, the output will be used to recommend future policy designs to increase electricity generation and supply.
Figure 10 shows the process flow for the model developed in this study, and
Figure 11 depicts the logic used to design the load-modelling tool in MATLAB using the MATPOWER tool.
In MATPOWER, a model was constructed with the IEEE case 30, depicted in
Figure 12, as a proof-of-concept model that would be able to carry out the necessary analysis based on the alterations stated in the policies and the forecast data.
The Newton–Raphson method was adopted in this study due to the data available on the IEEE 30-bus case and its suitability for the MATPOWER analysis tool on MATLAB. While the tool was being constructed, additional nodes were developed to simulate improving the system’s performance. The tool was developed to allow policymakers to simulate various scenarios and investment options. Modifications to the scenario may involve an expansion of the existing network’s load or capacity, as well as the installation of new generators. Alterations classified as enhancements, on the other hand, include installing new transmission lines within the system. These lines are aimed at minimising power losses and maximising the flow of generated electricity to end users.
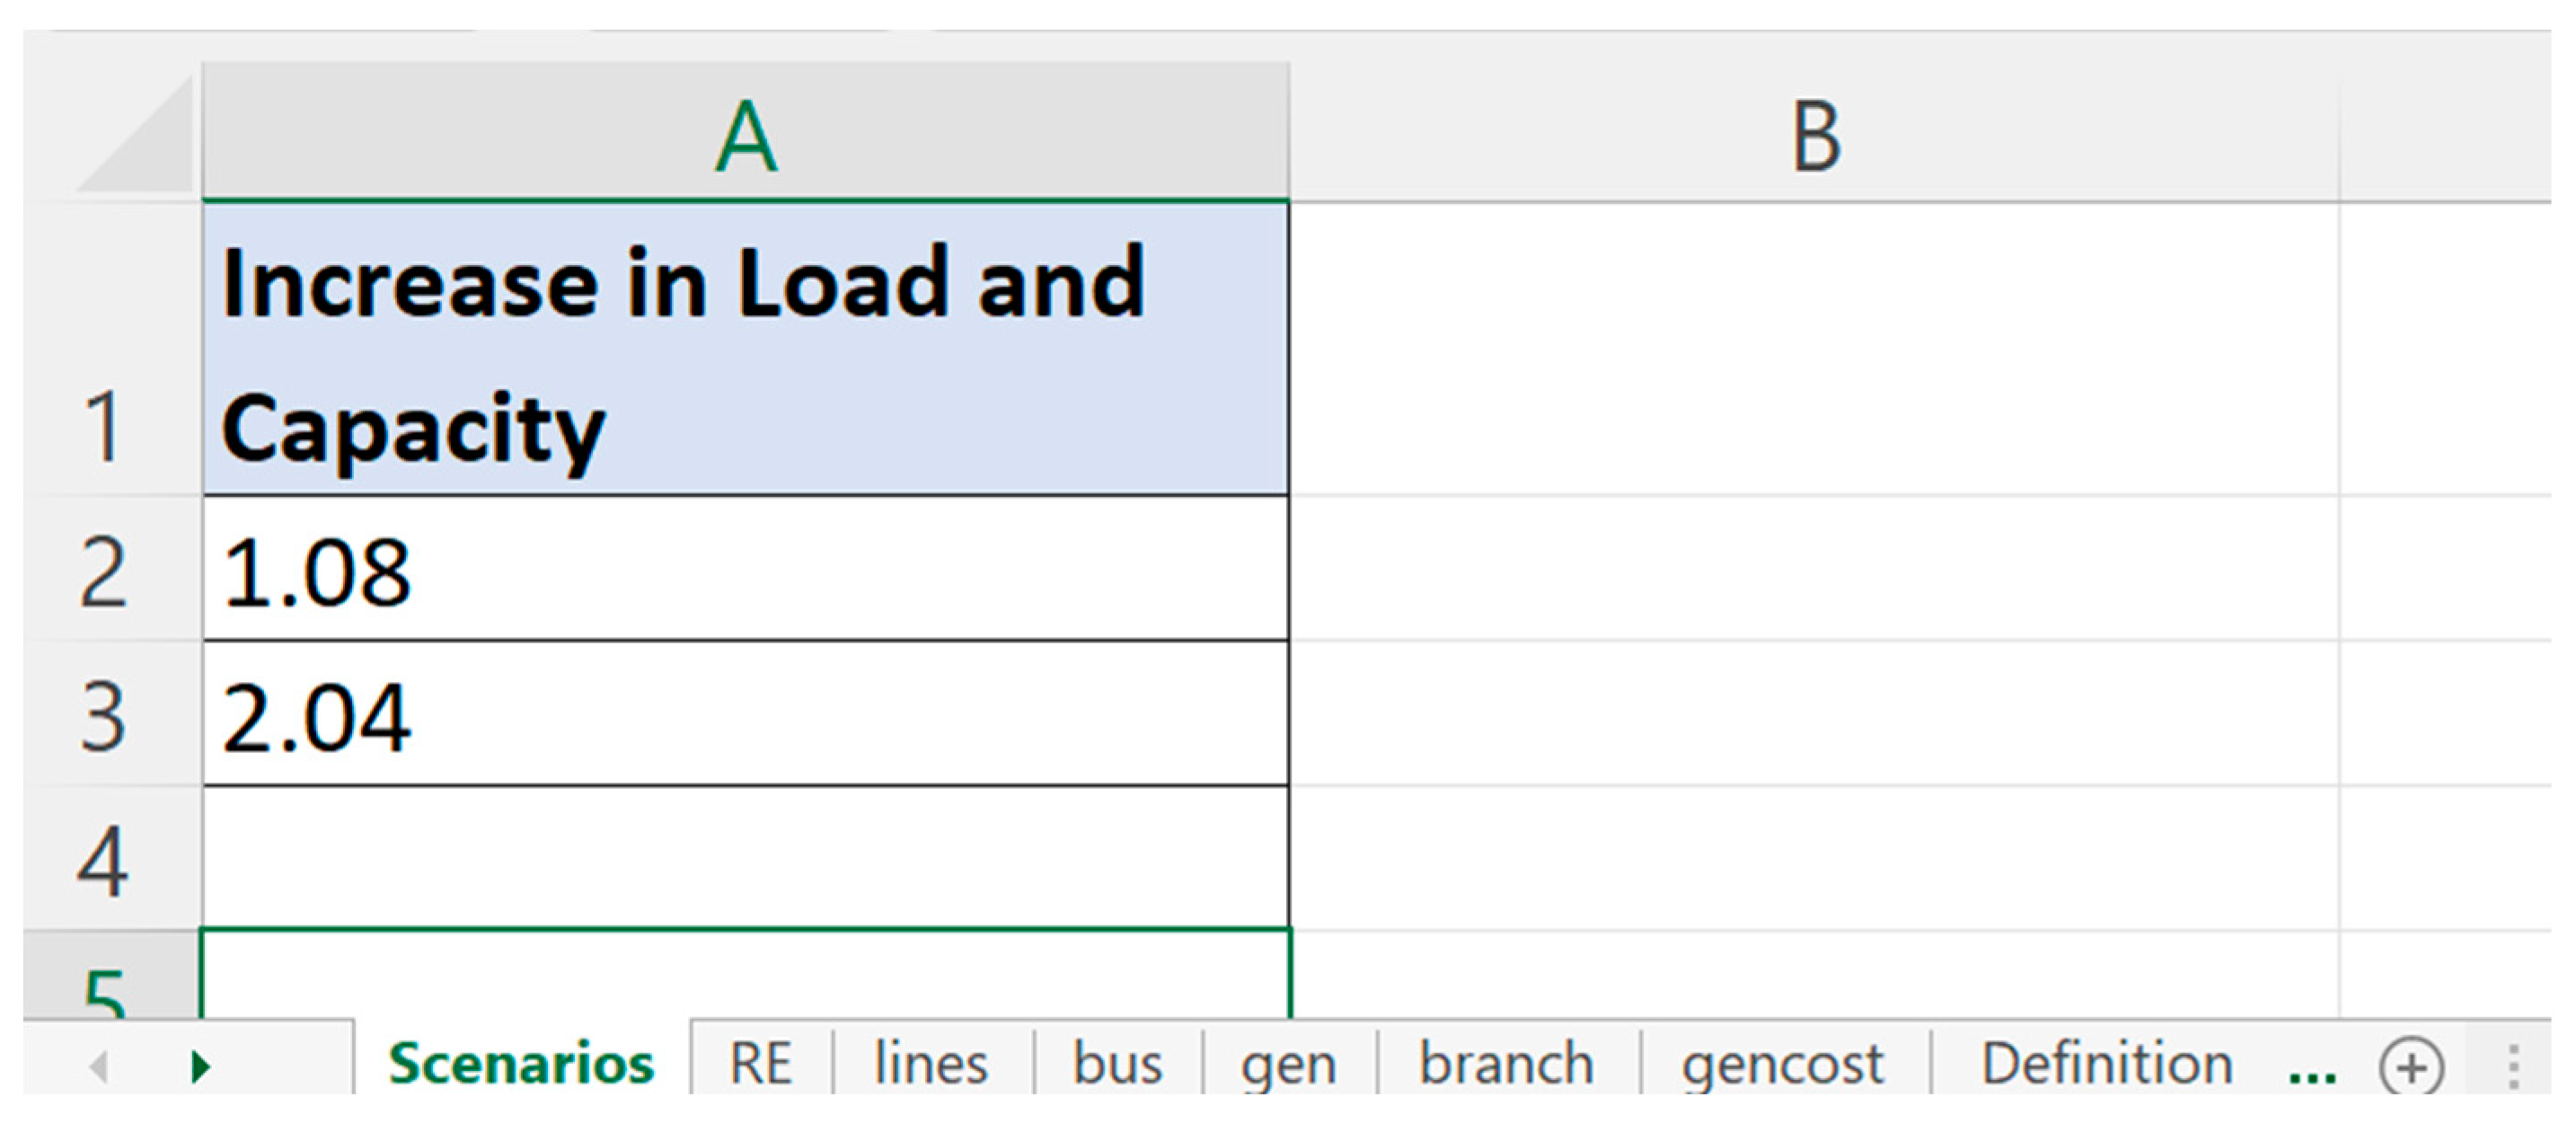
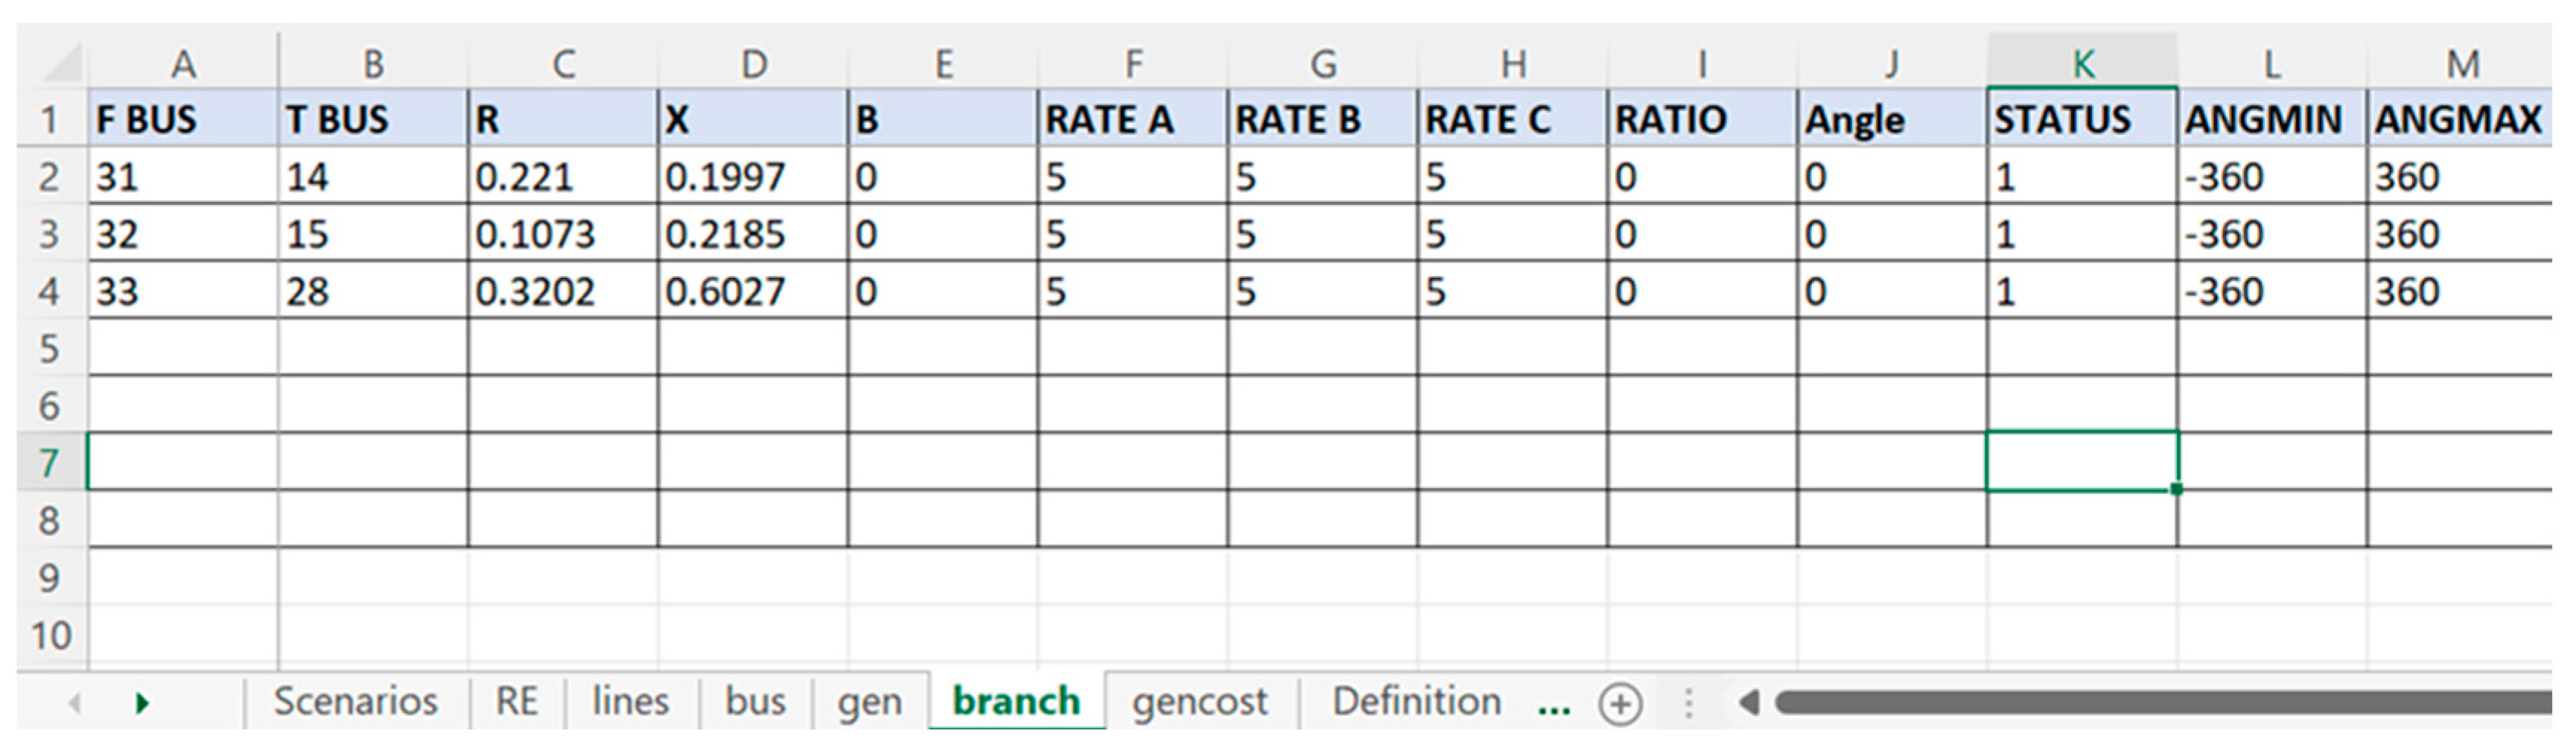
The users can specify the system characteristics using an input file created in Microsoft Excel. These characteristics include the amount by which the capacity and the load are to be increased, the amount of new generation that will be provided by renewable energy, which new transmission lines will be added to the model, and the specifics of any new buses, generators, or branches that are added to the system. The results of the input file are displayed in
Figure 13,
Figure 14,
Figure 15 and
Figure 16.
Upon completing analyses using the deterministic model developed in this study, the user can export the results from MATLAB to a Microsoft Excel file.
Figure 17 shows the model output file with the results of a power flow analysis completed using the model.
This study developed a robust tool with interfaces to be adjusted by the users and to ensure the accessibility of the tool. An executable file which can be run on any PC without MATLAB was generated to enable users with only a low-cost MATLAB compiler license to access the tool. Users only need to load and edit their input and edit parameters in spreadsheets and receive the results of their analyses in spreadsheets as well. Finally, a key feature of this tool is its capacity for a non-expert to use it to conduct feasibility assessments of electricity networks with an estimation for future scenarios, for which little data are available today.
5. Performance Results of the DST and Discussion
To demonstrate the performance of the decision support tool, the IEEE 30-bus system was adjusted with the following parameters:
The 30-bus system will be modified to represent changes projected to occur in the Nigerian power network in 2030 based on the results of the ARIMA time series forecasting, and then the targets stated in the policies.
Two scenarios will be compared—a forecast scenario that shows a 108% increase in load and a policy scenario that shows a 204% increase in load.
Additional generating stations will be added to the system to attain the desired increase in the aforementioned scenarios.
New lines and branches will be added to the system to link the new generators to the current grid.
The percentage of renewable energy in the generation mix will increase in increments of 5% from 0 to 100%.
There will be three different options that examine the effects of adding new transmission lines to boost the evacuation and distribution of power in the system. This would be noted as an enhancement option. Please note that enhancement option 1 adds one new transmission line to the system, enhancement option 2 adds two new transmission lines to the system, and enhancement option 3 adds three new lines to the system.
Optimal power flow (OPF) analysis will be run on the resulting 42 cases to determine the feasibility and the operating cost of the systems.
The IEEE 30-bus network shown in
Figure 12 is modified to create a 33-bus network, as depicted in
Figure 18. This modification involved the addition of three nodes marked with the red circles.
Table 2 and
Figure 19 show the results of the modelling using the decision support tool to compare different variations in the forecast and policy scenarios. The optimal power flow of the transmission network was calculated using the Newton–Raphson technique. The transmission network’s optimum power flow model was then constructed using the network’s most negligible loss as the objective function. The enhanced technique was then used to solve the optimisation issue. The simulation is examined and validated using the IEEE 30-bus system in the MATLAB programme.
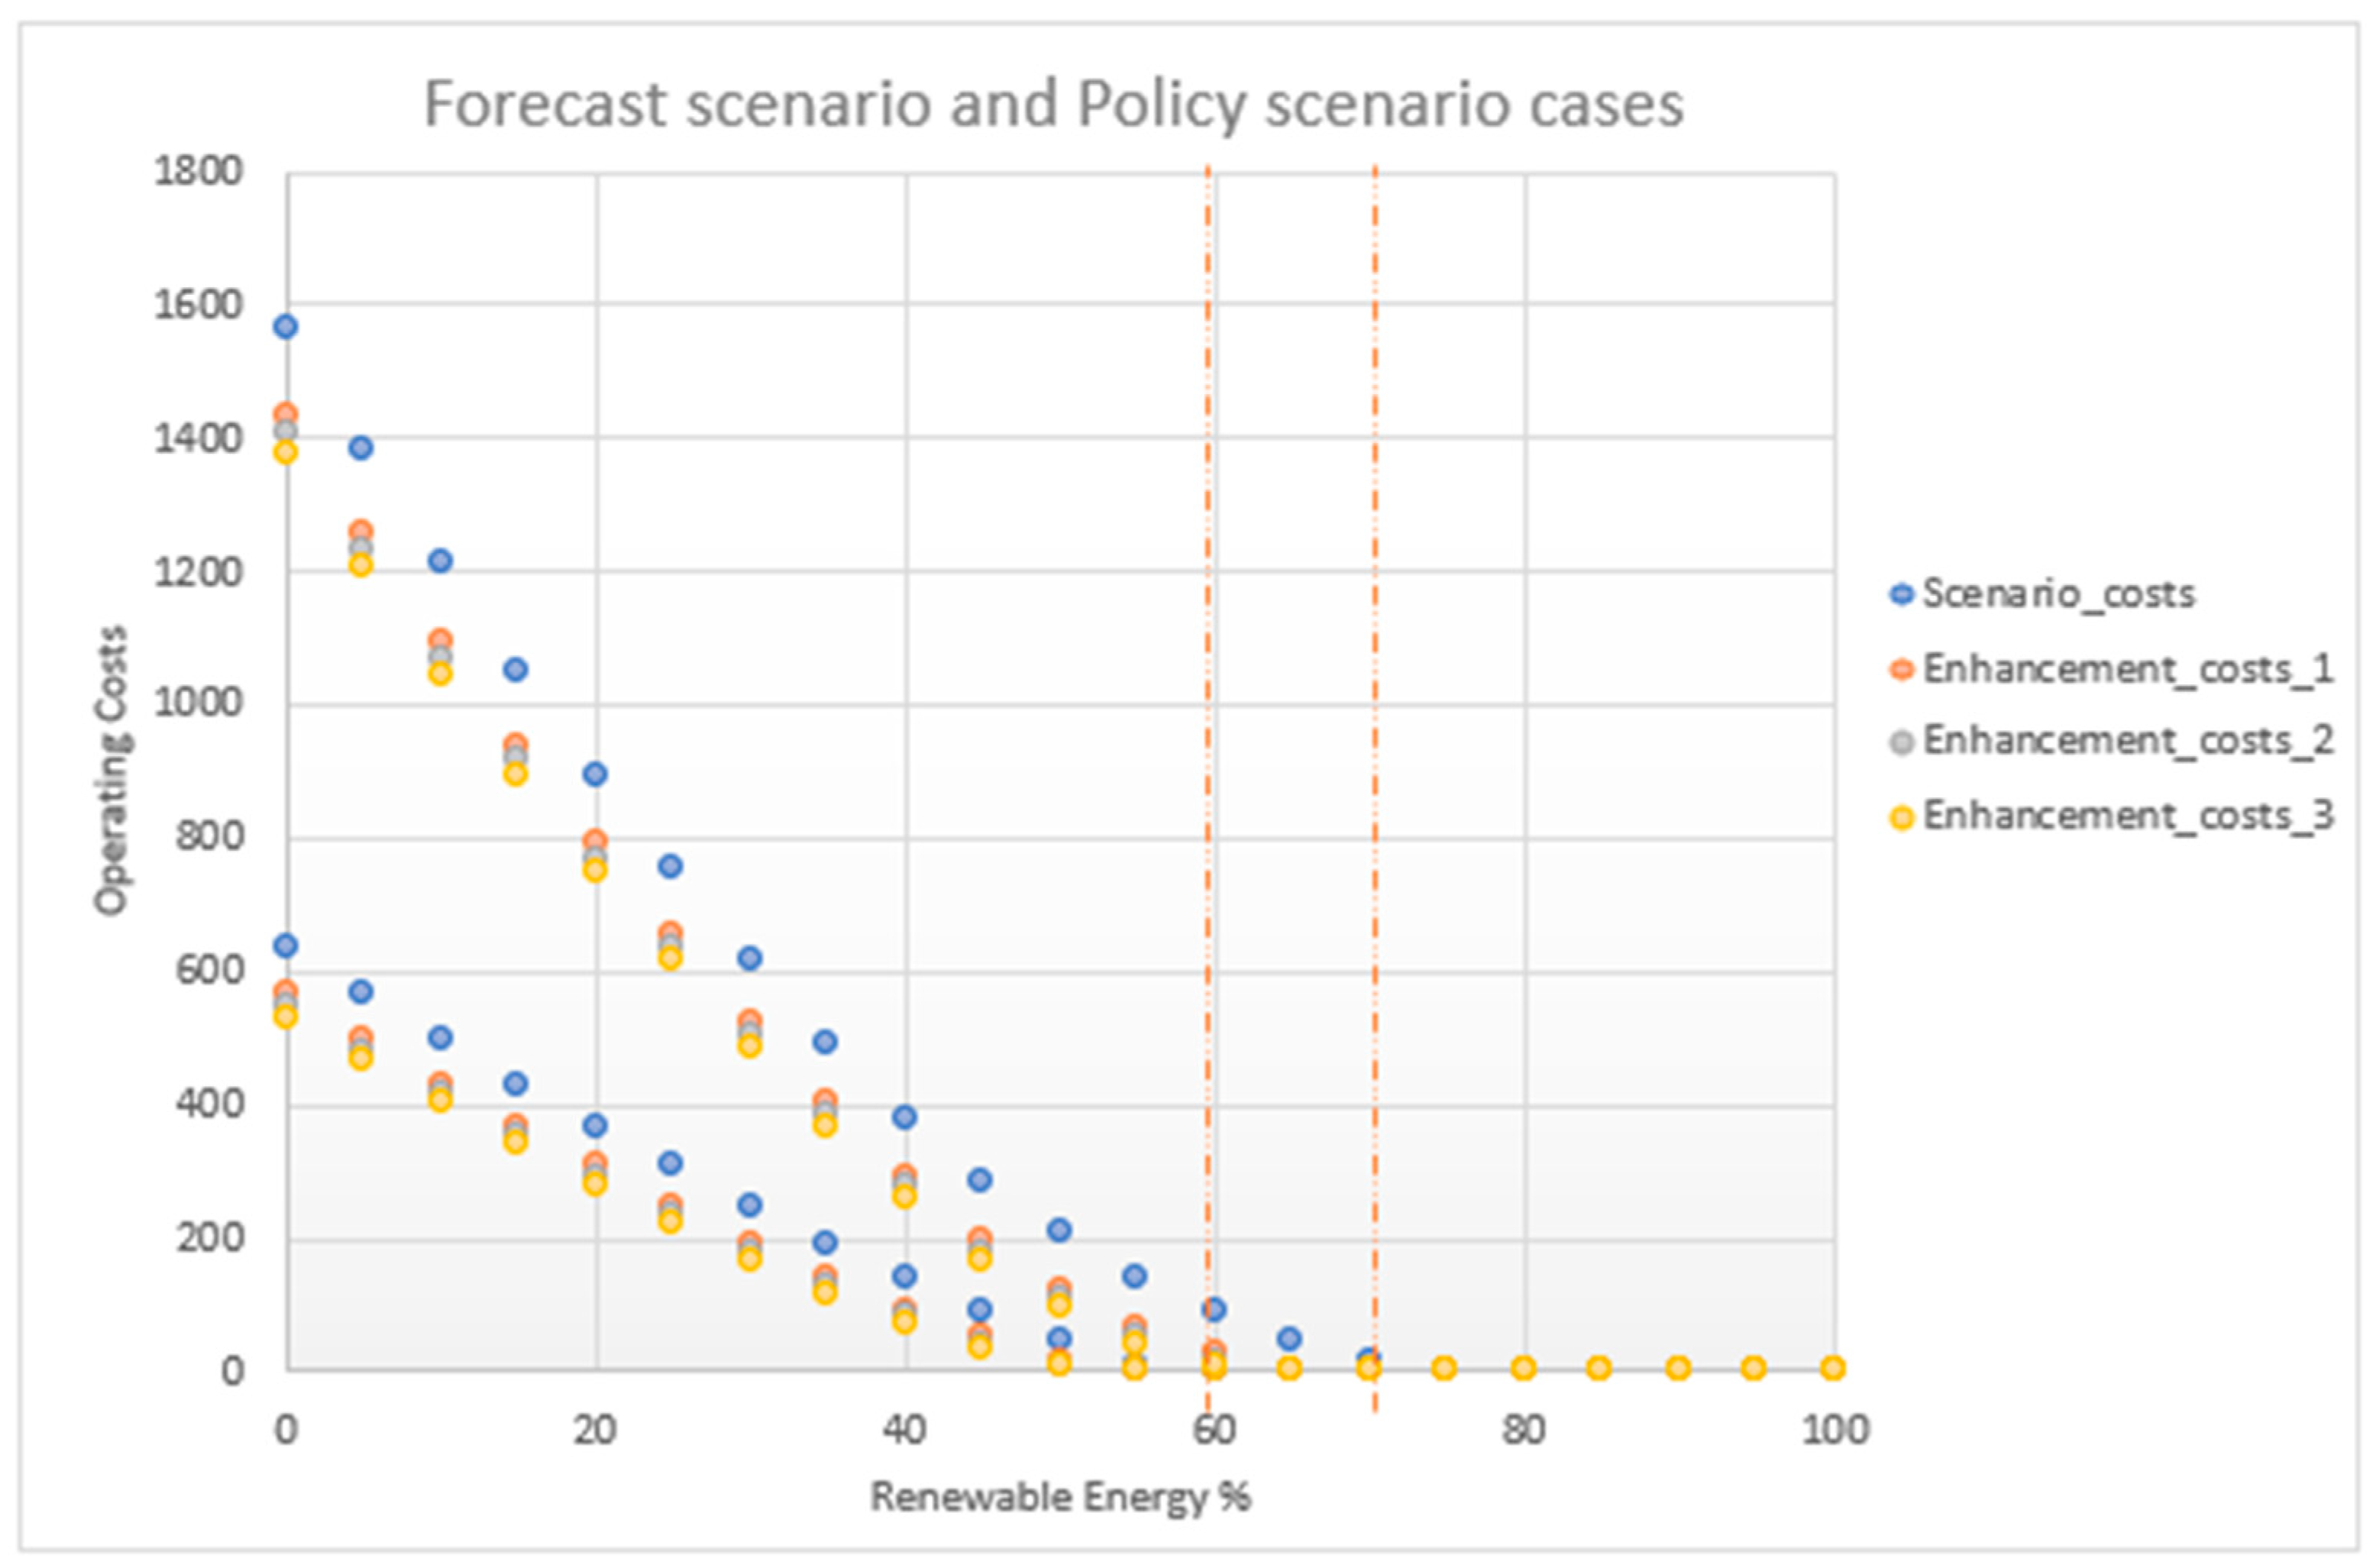
Further examination of
Table 2 and
Figure 19 shows that the operational cost of the systems analysed was reduced with the addition of certain options. For instance, let us consider scenario 2 with 25% renewables and compare it to the current base scenario without any renewables. It is evident that renewables, without considering any network enhancements, would lead to a 51% reduction in operational costs (from 1563 to 753). However, when we incorporate enhancement option 3, scenario 2 with 25% renewables experiences an even greater reduction in operational costs: 55% (from 1379 to 615). In comparison to the base case, scenario 2 with 25% renewables and enhancement option 3 achieves a remarkable cost reduction of 61%.
By examining the data in
Table 2 and
Figure 19, grid operators or investors may opt for enhancement option 1 due to its lower investment cost compared to option 3. However, it is essential to note that option 1 still manages to reduce operational costs by 58%, which is competitively close to the 61% reduction achieved by scenario 2 with 25% renewables and enhancement option 3. Consequently, this straightforward and easy-to-interpret tool yields a cost–benefit analysis as an outcome.
The test findings demonstrate that to lower network losses and boost system efficiency in both the 2030 forecast and the 2030 policy scenario, the current network needs to be modified to include more generators and transmission lines. The inclusion of renewable energy generators in the electricity mix also lowers the system’s operating cost. For the forecast scenario, the optimal power flow analysis showed no additional benefit of introducing over 60% renewable energy to the mix. For the policy scenario, the optimal power flow analysis showed no additional benefit of introducing over 70% renewable energy to the mix in 2030.
6. Limitations of the Study
Subsequent studies could examine the impact of the policies on electricity storage in Nigeria as this study only examined the impacts on electricity generation and supply.
This study did not investigate funding availability for the proposed generation and transmission expansion projects. Future studies could look at how the policies have affected the availability of funding for these projects.
The modelling tool was created using the IEEE 30-bus system as reliable load data from the Nigerian 330 kV bus network were unavailable. Future studies could use data from the Nigerian case to build the tool and include the 132 kV and 33 kV transmission networks.
This study examined the impact of the policies between 2001 and 2020. Future studies could assess the impacts of current policies beyond this period. In addition to these specific points, future studies could also look at other factors that have affected the development of the Nigerian electricity sector, such as the country’s economic growth, political stability, and climate change.
It can be noted that the tool’s purpose is to provide an overview of the feasibility of future scenarios and serve as a basis for conducting cost–benefit analyses for various investment options to determine the optimal choice. However, it should be emphasized that the tool is not designed to be a dynamic tool or a comprehensive power system analysis software that precisely simulates the behaviour of the system during operation. In simpler terms, the tool focuses on quantifying the cost implications of transitioning from one status to another, rather than providing a detailed analysis of the dynamic process involved in reaching the new status.
7. Conclusions
Several ambitious policies aimed at increasing the proportion of renewable energy, enhancing energy efficiency, and incorporating rural electrification have been issued; however, Nigeria is still yet to bridge the gap in electricity supply and demand. This study critically reviewed electricity policies in Nigeria over 20 years to understand how they contributed to electricity generation and supply. This information was used to develop a tool to support future policymakers in designing more efficient policies.
A deterministic modelling tool referred to as the decision support tool (DST) was developed in this study and was used to examine the Nigerian electricity policies from 2001 to 2020 to identify the least-cost electrification generation and supply option required to provide electricity to all areas of Nigeria by 2030.
Tools developed in previous studies are complex and require an in-depth technical knowledge of electrical engineering, programming, or planning to use. Hence, in this study, we developed an accessible deterministic modelling tool to aid policymakers and planners in estimating the feasibility and cost of different investment options during generation expansion planning (GEP) and transmission expansion planning (TEP).
Although this tool does not require access to expensive or exclusive software licences to run, it would nevertheless provide future policymakers with the ability to perform robust analyses as they model or extrapolate the potential effects of their ideas before committing to specific courses of action. The software is accessible even to policymakers and planners with little to no technical background; however, it should be noted that the decision support tool (DST) developed in this study is not designed to be a dynamic tool or a comprehensive power system analysis software that precisely simulates the behaviour of the system during operation.


