1. Introduction
The configuration of modern instruments for measuring analog quantities is, in most cases, based on digital data processing systems. In the acquisition part of the measurement chain, from the input circuits, possibly with the measurement sensor, to the analog-to-digital converter (ADC), hardware processing of measurement information carried by signals takes place. Compared to traditional analog devices, in digital devices, the circuitry of the analog part of the measurement chain is reduced in order to quickly access the digital representation of the analog signal processed in the ADC [
1]. In this way, the impact of various disturbances on the processed information is avoided or significantly limited. In the case of instruments with software digital data processing, the key role in the measurement channels is played by software algorithms, which largely determine their properties and the quality of the measurement process. Virtual instruments are also created in this way.
The aim of the research related to the content of this paper was to develop, calibrate and test the properties of a multi-channel temperature measurement system dedicated to research on energy dissipation from power cables in casing pipes with various fillers running in underground ducts [
2]. Comparative temperature measurements were used to assess the efficiency of heat removal from the cable to surrounding media with different thermal properties. Predicted temperatures under these conditions usually range from 10 to 70 °C. In the form of a laboratory model simulating underground power lines, a test stand was developed for the experimental assessment of temperature distribution in casing pipes filled with various media surrounding the power cable [
2]. A multi-channel temperature measurement system was required to perform the assessment as intended. The considered system consists of ten temperature measurement channels, but the number of measurement channels in the system is easy to expand.
Electricity is distributed worldwide mainly via overhead lines and increasingly using underground power cables [
3,
4,
5,
6]. Since the transmission of electricity is associated with the release of heat in the power line, an important issue affecting the permissible current carrying capacity (ampacity) of the cable used is a way of removing heat from the power cable, especially in the underground line [
7,
8,
9]. Heat dissipation from underground cables has been analyzed in many publications in the form of numerical simulations [
10,
11,
12] or on the basis of the results of experimental studies [
13,
14,
15]. In all of them, the temperature distribution in the medium surrounding the power cable is an indicator of the efficiency of heat dissipation from the cable, buried directly in the ground or placed in casing pipes buried underground. The heat generation in the cable is due to the conductor resistance and the dielectric properties of the protective insulation of the cable. This heat has to be removed to the surrounding medium to avoid overheating of the cable insulation. The efficiency of heat dissipation depends on the properties of the surrounding medium, i.e., its thermal conductivity.
Temperature measurements are the most frequently performed measurements in industrial applications [
16,
17,
18,
19]. In digital instruments, temperature as a non-electrical analog quantity must first be converted by a suitable sensor into an electrical quantity and then by an ADC converter into its digital representation. The selection of temperature sensors with optimal properties from the point of view of the measurement system configuration is one of the important points related to the design of such a system. The following four most popular types of contact temperature sensors are used in continuous measurements in industrial applications [
20,
21]:
Resistance temperature detectors (RTDs);
Thermocouples;
Semiconductor-based sensors;
Negative temperature coefficient (NTC) thermistors.
RTD resistance increases with increasing temperature [
22]. The RTD consists of a foil or a wire wrapped around a ceramic or glass core. Platinum sensors are the most accurate RTD sensors, while nickel and copper provide a lower cost; however, nickel and copper are not as stable and reproducible as platinum. Platinum RTDs offer highly accurate quasi-linear characteristics in the range of −200–850 °C but are significantly more expensive than copper or nickel.
A thermocouple consists of two electrically connected wires made of different metals’ alloys [
23]. The voltage generated between the two dissimilar metals changes with the temperature difference between the shorted and loose ends of the thermocouple. To specify the measured temperature, the reference temperature should be known. Thermocouples are non-linear sensors, and their accuracy is low, from 0.5 to 5 °C, but thermocouples operate over the widest temperature range, from −200 to 1750 °C.
A semiconductor-based temperature sensor is typically embedded in integrated circuits (ICs) [
21,
24]. These sensors use two identical diodes with temperature-sensitive voltage and current characteristics to monitor temperature changes. They offer a linear response but have the lowest accuracy of the basic sensor types. These temperature sensors also have the slowest response over the entire temperature range (−70–150 °C).
A thermistor Is a temperature-sensitive resistor that shows a continuous change in resistance that correlates with changes in temperature. NTC thermistor provides higher resistance at low temperatures [
25,
26,
27] As the temperature rises, the resistance decreases. Small changes in temperature are reflected in large changes in resistance compared to other resistance temperature sensors. The characteristics of the NTC thermistor are non-linear due to its exponential nature. The effective operating range is −50–150 °C for standard thermistors or up to 250 °C for glass thermistors.
PTC thermistors are also used in the measurement and control systems. These types of thermistors are divided into two groups depending on the materials used, their construction, and the production process. The first group of PTC thermistors consists of silistors that use silicon as a semiconductor material. They are used as PTC temperature sensors due to their linear resistance versus temperature characteristics, with a relatively slight slope over most of their operating range. Their temperature coefficients of resistance are much lower than the absolute values of these coefficients for NTC thermistors (negative). The second group is the switching type PTC thermistor. This type of thermistor has a highly non-linear temperature-resistance curve. When the switching type PTC thermistor is heated, the resistance first begins to decrease until it reaches a certain critical temperature. As the temperature continues to rise above this critical value, the resistance increases dramatically. These types of PTC thermistors are widely used in PTC heaters, threshold sensors, etc. Polymer PTC thermistors belong to the latter group and are often used as resettable fuses.
In this study, NTC thermistors were selected to measure the temperature in the channels of the developed system due to the advantages of using this type of sensor, e.g., small size and low cost, fast temperature response, high sensitivity, suitability for precise temperature measurement and control, and simple application circuits. At the same time, due to material and manufacturing criteria, standardization of semiconductor components such as NTC thermistors is difficult. Therefore, the possibilities of their interchangeable use are limited [
28]. The temperature measurements with NTC sensors can be largely inaccurate for a variety of reasons. The most important of them are low stability (especially long-term) and low repeatability of the static characteristics of individual elements within a given type [
28,
29], resulting in poor interchangeability of these sensors in measurement devices [
26].
In temperature measurement with thermocouples, in a wide range of applications, an accuracy of ±0.5–±2 °C is easily achievable, depending on the type of thermocouple and tolerance class [
17,
18,
23].
With platinum RTDs, the temperature can be measured extremely accurately due to the stability of the material and the quasi-linear relationship between temperature and resistivity, and an accuracy of ±0.01–±0.3 °C can be easily achieved in industrial applications.
In [
22] it is stated that the accuracy tolerance standard for the available RTDs ranges from 0.08 to 0.67 C depending on the RTD tolerance class and application circuit configuration. In [
20], the accuracy of the platinum RTD thermometer is disclosed to be 0.3–4.6 °C.
The accuracy of typical semiconductor temperature sensors is within 0.5–4 °C [
21]. Precision analog temperature sensors achieve an accuracy of 0.1–0.4 °C [
24].
In paper [
26], the accuracy of temperature measurement devices with an NTC thermistor calibrated by various methods is from 0.8 to 1.6 °C, while using the parameter values provided by the manufacturer, the inaccuracy exceeds 6 °C.
In all cases, the overall measurement accuracy is also affected by additional factors related to the properties of the sensor application circuits and other characteristics of the measurement system. The digital measurement system is usually supported by a controller enabling centralized data processing. Typically, temperature-measuring instruments using NTC sensors are based on microcontroller devices [
30,
31]. The actual course of non-linear characteristics is usually reproduced in the measurement algorithm using the Look-Up-Table method. Determining the actual sensor characteristics in connection with recalibrating or replacing the sensor and updating it in the thermistor software model is quite troublesome.
Multi-channel temperature measurements are performed in many applications [
32,
33,
34,
35,
36]. Some of these systems were created as virtual instruments in the NI LabVIEW (National Instruments, Austin, TX, USA) environment [
35,
36]. NTC thermistors as temperature sensors are also used in multi-channel systems, although not very often [
37,
38]. They are usually connected to complex application circuits that are the inputs of measurement channels.
Paper [
30] presents a temperature-measuring device using an NTC thermistor and is based on a microcontroller. Its measurement inaccuracy compared to a digital thermometer is over 3 °C.
In a multi-channel temperature sensor system [
32] using semiconductor temperature sensors with a sensor output providing a pulse-width modulation (PWM) signal, the measurement errors ranged from −0.9 to +1.1 °C.
In the case of a multi-channel data measurement system containing temperature measurement channels with digital sensors [
34], the absolute accuracy of any of the channels is estimated at ±0.2 °C when the manufacturer declares the accuracy of the digital sensor to be ±0.5 °C.
The recorder with NTC thermistors in a matrix of temperature sensors, controlled by a microprocessor with an ADC converter, is presented in [
37]. The temperature measurement error is 1 °C. On the other hand, in [
38], a multi-channel temperature measurement system consisting of a 16-channel multiplexer, 12-bit analog-to-digital converter, differential amplifier and NTC temperature sensors was described. Declared accuracy in temperature measurements is better than 0.1 °C.
The multi-channel temperature measurement system presented in this article, is a virtual instrument developed for measuring and registering the temperature distribution at specific points in the laboratory model of the underground power line. Virtual instrument [
39] means a fully functional measuring instrument (or system) in which basic functions performed in hardware in traditional measurement circuits, such as correction of processing characteristics or mathematical operations on signals, have been transferred to software and are digital data operations implemented in software procedures.
The developed instrument is supported by the NI PXI platform, the NI LabVIEW environment, and NTC thermistors in the input circuits of the measurement paths. The measurement channels use the NI DAQ card installed in the NI PXI platform housing.
Built-in measurement channel calibration procedures are an important part of the system’s functionality. Calibration results saved in files are used to determine and update the actual characteristics of individual temperature measurement channels.
Successfully completed tests of the developed device confirmed the validity of the assumptions regarding the following:
Simple thermistor application circuits;
The possibility of calibrating the measuring circuits within the implemented hardware and software configuration, using only an additional device for setting the temperature and a reference thermometer;
No need to adjust elements and characteristics in the analog part of the measurement channels;
Acceptable accuracy of temperature measurement in all channels,
Satisfactory convergence of the obtained processing characteristics in individual channels.
The main theoretical contribution made to the empirical research is the development of a mathematical model of the measuring channel, taking into account the properties of linear and non-linear elements in the measuring channel, which is the starting point for the correct configuration of all software procedures performed in the developed device.
The article is organized as follows. In
Section 2, following an overall system concept, details of the temperature sensors used, sensor application circuits, ADC operations, and data processing software were provided.
Section 3 contains an explanation of the methodology for measuring channel calibration and examples of calibration results. The results of the measurements verifying the operation of the measurement channels are presented in
Section 4. The last two parts of the article contain comments on the obtained results and conclusions summarizing the research on the developed multi-channel temperature measurement system.
2. Materials and Methods Used in the Development of a Multi-Channel Temperature Measurement System
Basic operations in all measurement channels in the developed virtual instrument are performed in software on digital data. Its configuration is shown in
Figure 1. The instrument is based on the NI PXI measurement platform
1 with a user interface (screen, keyboard, and mouse) and NI terminal block
2 cooperating with a set of thermistors. The temperature information is obtained from the thermistors and is further processed in the NI LabVIEW environment. A temperature calibrator
3 (T-704 Mors, Gdynia, Poland) was applied to set specific temperatures during the calibration of measurement channels and during the testing of their properties. The digital temperature meter
4 (DT-34 [
40]) was used as a reference instrument to verify the temperature setting.
A single temperature sensing circuit uses an additional resistor
Ri (
Figure 2) connected in series with the NTC thermistor
RTi, which forms a thermistor conditioning circuit as a voltage divider, whose output voltage is fed to the input of the NI DAQ card installed in the NI PXI measurement platform. For all measurement channels, the additional resistors
Ri are placed on the PCB (Printed Circuit Board) in the NI terminal block
2 (
Figure 1). NTC thermistors, located on the measured object, have cable connections to their conditioning circuits. The eleven input channels of the NI DAQ card (
Figure 2a) are used for measurements in the studies mentioned in the Introduction. Channel 0 (ch_0) is used to measure the voltage
Uz, supplying the thermistor conditioning circuits, and another ten channels (ch_1—ch_10) are used to measure the output voltages
Ui from voltage dividers.
Figure 2b shows the thermistor cables connected to the pins on the NI terminal block.
2.1. Measurement Platform
NI PXI measurement platform
1 (
Figure 1) consists of the NI PXIe-1082Q (National Instruments Chassis) housing, which is equipped with the NI PXIe-8135 (Embedded Controller) and NI PXIe-6341 (DAQ card). The NI SH68M-68F-EPM cable (68-pin male VHDCI to 68-pin female D-SUB connector) connects the NI terminal block
2 to the DAQ card.
The NI PXIe-1082Q is an 8-Slot (4 hybrid slots, 2 PXIe Slots, 1 PXIe System Timing Slot) NI PXI Chassis [
41].
The NI PXIe-8135 is an embedded Quad-Core 2.3 GHz (Intel Core i7) controller for NI PXI Express systems [
42].
The NI PXIe-6341 DAQ card [
43] includes, among others, 16 analog inputs (16-Bit, 500 kS/s), 2 analog outputs, 24 digital I/O, and four 32-bit counter/timers for PWM. The DAQ input channels in the developed system were configured in the NI terminal block [
44] to operate in the RSE (Referenced Single-Ended) mode.
2.2. Terminal Block
The NI SCB-68A terminal block [
44] provides a shielded I/O connection for interfacing I/O signals to a plug-in data acquisition device (DAQ card) with a 68-pin connector. The NI terminal block
2 (
Figure 1 and
Figure 2b) is used for the acquisition of measurement data from all active channels. The voltage dividers (
Figure 2a) form the
RTi thermistor conditioning circuits in the individual channels and are mounted on the PCB inside the NI terminal block, adapted to the assembly of additional elements. The
Ri resistors in each measuring channel
i perform an auxiliary function, ensuring that the DAQ input voltages
Ui change with changes of each resistance
RTi according to the following relationship:
where:
Us—the common supply voltage for all ten voltage dividers;
i—number of specific channels (from 1 to 10);
Ri—additional resistance in the voltage divider in channel
i;
RTi—resistance of thermistor in channel
i.
The supply voltage Us comes from the DAQ card and is obtained from 5 V through a series-connected 10 Ω resistor. The load is a parallel connection of ten voltage dividers with a resistance of several kΩ. It is a stable system due to the nature of temperature changes and therefore changes in the resistance of the thermistors.
2.3. Temperature Sensors
For linear or linearized elements, the mathematical description of the static characteristic using a linear function is unambiguous, while different non-linear models are used to describe the course of the NTC thermistor characteristics [
25,
45,
46]. Basic mathematical models describing the non-linear relationship between thermistor resistance and temperature are created in one of the following two ways: using the Steinhart–Hart (S-H) equation or an equation with the material constant
β (beta) [
47,
48].
The Steinhart–Hart equation takes the following form:
where:
T—temperature (in Kelvin [K] and
TC [°C] =
T [K] − 273.15);
RT—resistance [Ω] of the sensor at temperature
T [K];
A,
B,
C—coefficients with values dependent on the thermistor properties, possible to be determined in reference measurements.
The equation with the characteristic constant
β of the NTC material, more commonly used by thermistor manufacturers to describe the course of the characteristics of thermistors, has the following form:
where:
RT0—sensor resistance [Ω] at temperature
T0 [K];
β [K]—material constant of the sensor.
The value of β is dependent upon material and thermistor construction and is considered unique for each thermistor.
Since the results obtained in verification measurements of the elaborated system using both thermistor models differ in practice to a lesser extent than the assumed measurement error, the article presents only the results obtained using the thermistor model with material constant β. It should be noted that software algorithms based on the Steinhart–Hart model are only slightly more complex, but they are as easy to implement in software as those referring to the model with the material constant β.
NTC10k thermistors, hermetic miniature sensors with a resistance of 10 kΩ at a temperature of 25 °C, were used as temperature sensors in the developed measuring system. The manufacturer of the NTC10k thermistors under consideration declares in the datasheet [
49] that the sensor
RT resistance at 25 °C is 10 kΩ ± 1%, and its coefficient
β is 3380 K ± 1%. The error area resulting from the permissible dispersion of these parameters, using Formula (3) to determine the temperature, is shown in
Figure 3. The combination of the permissible deviations of the thermistor resistance and the material constant
β, according to the manufacturer’s data, creates a plane of permissible errors in determining the temperature with the thermistor in the given temperature range. This means that for temperatures in the range of 0–100 °C, the temperatures determined by individual sensors may differ from the actual temperature by the value of Δ
T, located in the area limited by colored lines in
Figure 3. These considerations do not take into account other factors contributing to measurement errors.
As mentioned earlier, the fabrication of thermistors is associated with low repeatability of the static characteristics of individual elements within a given type. Subsequent thermistors on the production line can differ in parameters in the mathematical model describing their properties. In order to use the thermistor mathematical model to measure temperature with greater accuracy than can be obtained based on the accuracy declared by the thermistor manufacturer, it is necessary to perform a reference measurement cycle at several temperatures to determine the sensor resistance values at these temperatures. Then, the values of the appropriate coefficients appearing in the mathematical formulas describing the static properties of individual thermistors can be calculated. To increase the accuracy of temperature measurement with the use of selected NTCs in the developed device, each measurement channel should be calibrated in terms of determining the properties of each thermistor and its application circuit at the DAQ input. In other words, the parameters of the static characteristics of each thermistor and the resistances of the auxiliary resistors in each of the voltage dividers should be determined.
2.4. Software Procedures in a Virtual Instrument
Software procedures are an integral part of the measurement channels. These procedures process the data provided by the DAQ card. In turn, DAQ inputs collect analog signals from individual temperature measurement channels, including NTC sensors in their conditioning circuits. These procedures also include several additional operations, including calibration of each of the measurement channels and verification of their processing characteristics, in particular, the following:
Determination of the value of auxiliary resistors
Ri in the input circuits of every channel (
Figure 2a);
Measurements of resistance RTi of thermistors at selected temperatures;
On the basis of the two previous steps, the determination of coefficient values in the mathematical model for individual thermistors;
Temperature verification measurements using designated models for individual thermistors and for entire measurement channels.
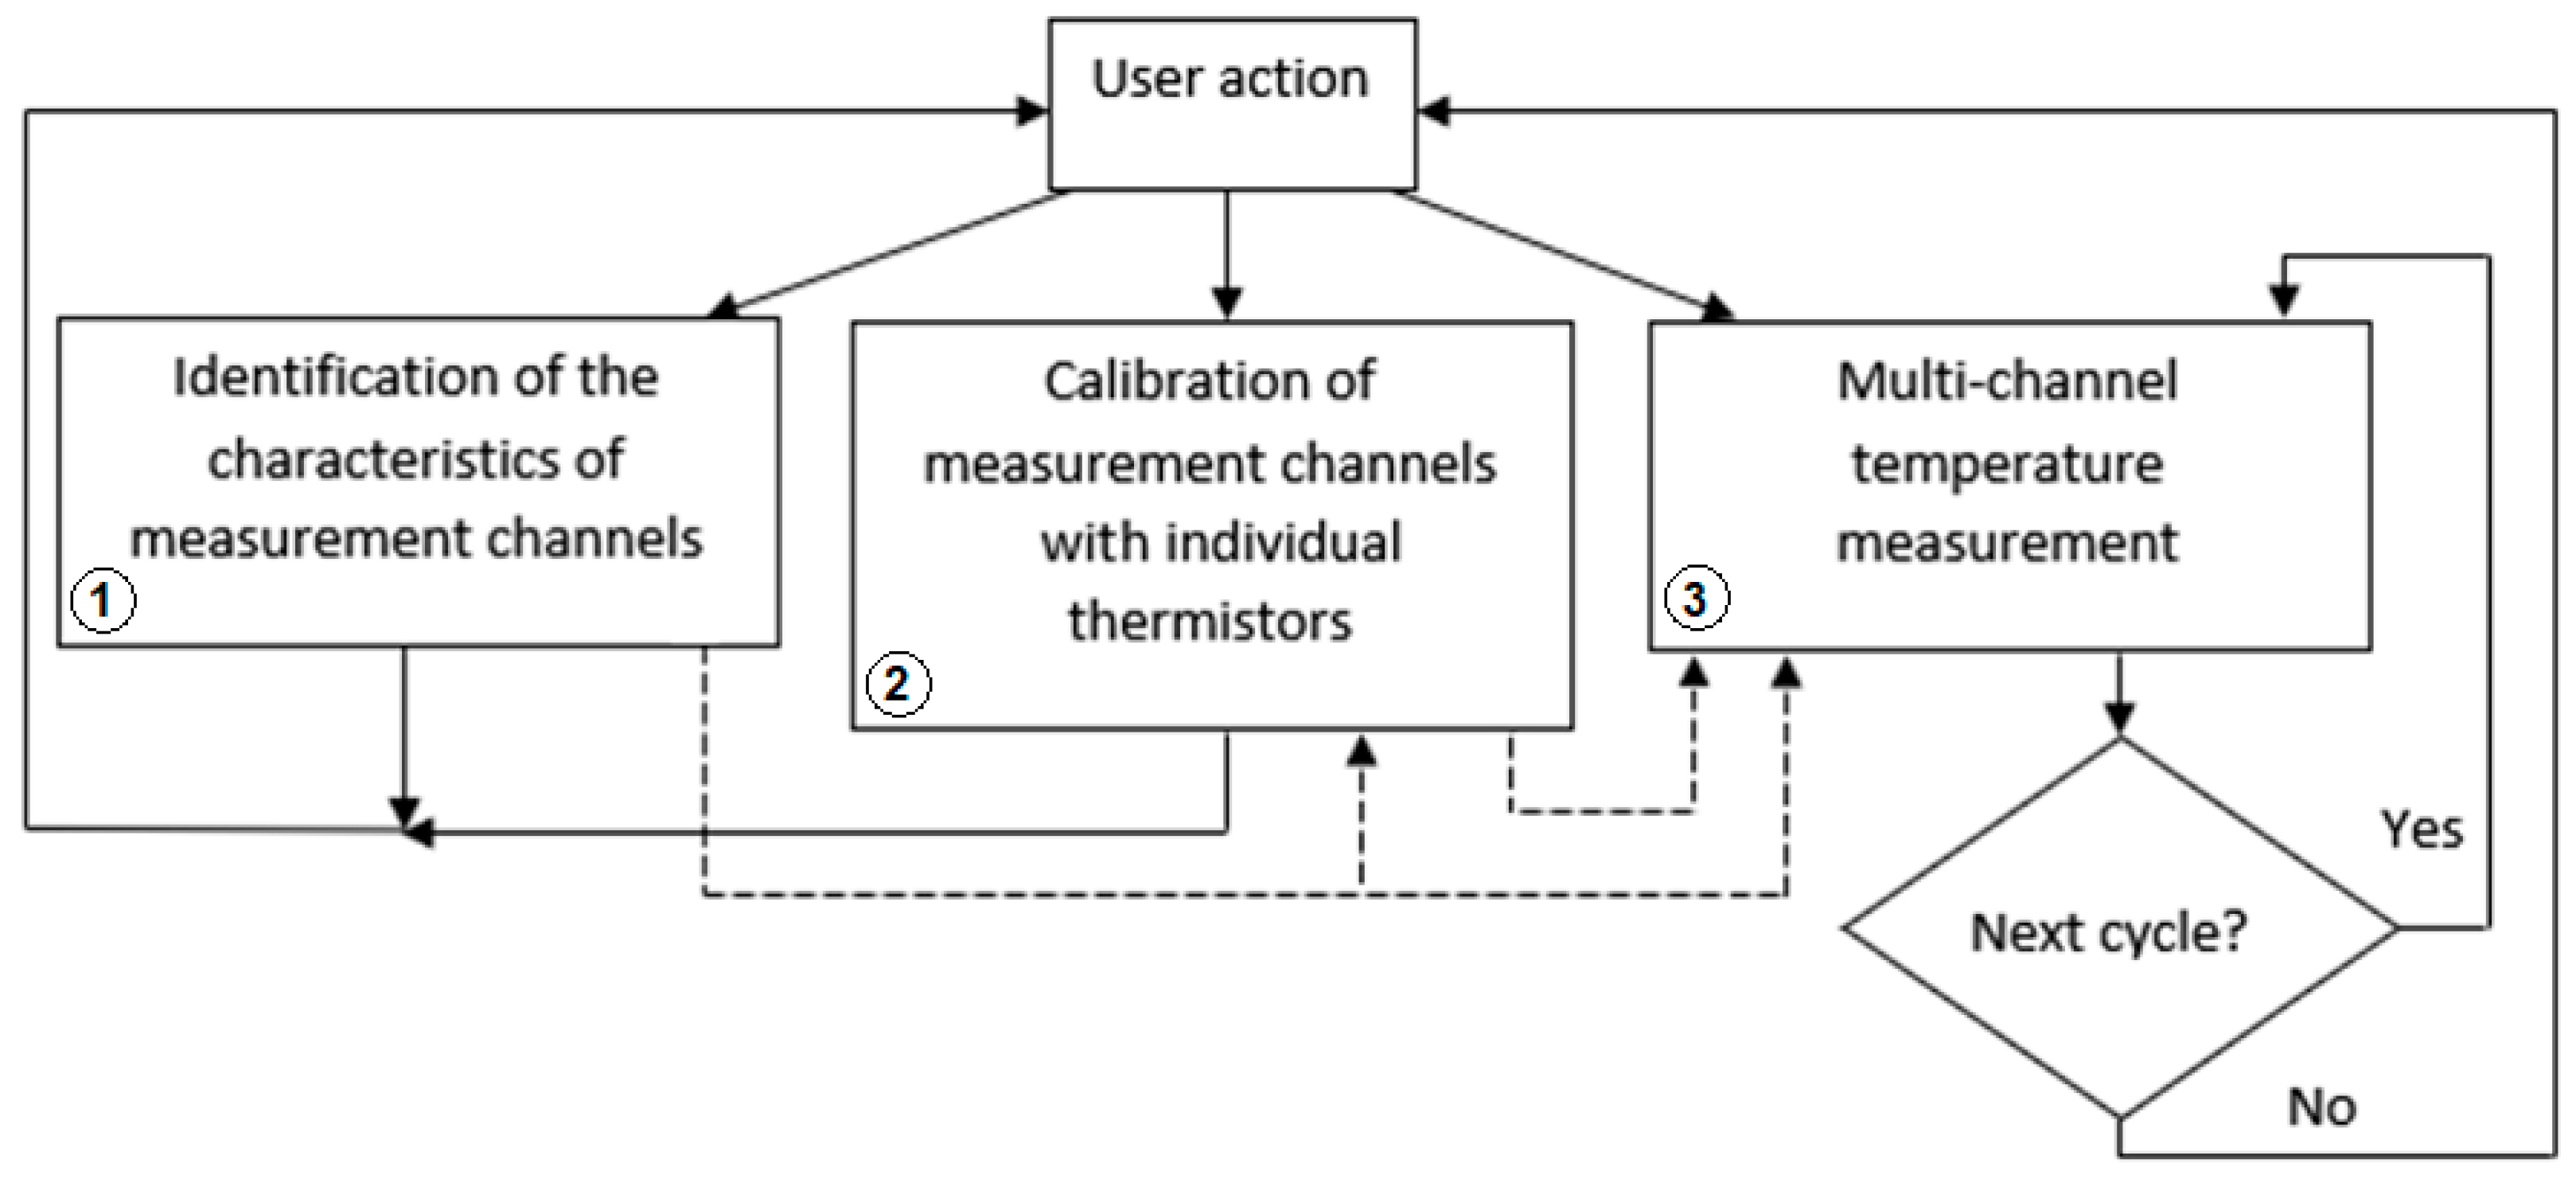
The basic procedures performed as a part of the operation of the measurement system are shown in
Figure 4. Dashed lines show the data flow between procedures.
The purpose of the procedure ➀ (
Figure 4) is to determine the value of the auxiliary resistors
Ri in individual voltage dividers (
Figure 2). These values are used in both other procedures.
The calibration procedure of measuring channels ➁ (
Figure 4) is used for determining coefficients in a mathematical model of individual measurement channels based on the determined thermistor resistances at specified temperatures and the characteristics of individual voltage dividers. The results can be used in accuracy assessment [
27,
34].
The multi-channel temperature measurement procedure ➂ is the target procedure of the instrument. Temperature measurements are made continuously in subsequent cycles, and the results are stored in the system’s memory.
The “User Action” header operation allows the operator to move between procedures and activate the selected one.
4. The Results of the Verification Measurements
In the developed measurement system, the same channels used to identify the characteristics of thermistors were used as measurement channels. The mathematical model of the measuring channel
i, in the system shown in
Figure 2a, takes into account the conversion of the temperature
Ti into the resistance
RTi and then the
RTi into the voltage
Ui being the input voltage of the ADC, and finally, the voltage
Ui is converted in the ADC to its digital representation
Di. For individual channels, the mathematical model
Di = f(Ti) describes the way of processing information in the acquisition part of the channel. For the system under consideration, the conversion of
Ti into
Di is described as the sequence of conversions as follows:
where:
Ri is the auxiliary resistance in channel
i;
Us is the measured supply voltage;
Ui is the input voltage of the ADC in channel
i;
Di and
Ds are the digital representations of input voltages
Ui and
Us, and
RTi, as a function of
Ti, is the resistance determined on the basis of the transformed dependency (3), which is the individual thermistors approximation characteristics with corresponding coefficients determined in the previous section.
Since the digital DAQ output data is automatically converted in the LabVIEW environment to DAQ input voltage units, the characteristics of the ADC converter can be described as follows:
The resistance
RTi can be calculated using the following formula:
In order to perform the software determination of
Ti for individual channels in the temperature measurement procedure ➂ (
Figure 4), the calculated values of
RTi should be included in the Equation (3) together with the following previously determined other factors:
T0,
RT0i, and
βi. The mathematical model obtained in this way to determine the temperature
Ti is implemented as a software part of individual measurement channels and is the subject of experimental research.
The results of the verification measurements, containing the average temperatures (
TA) calculated from the temperatures obtained in all 10 channels, in relation to the corresponding reference temperatures
Tref, are presented in
Table 5. Reference temperatures
Tref were measured with a DT-35 digital thermometer [
40].
In
Table 6, the differences between the temperatures obtained from exemplary channel 1 (ch_1) and the reference temperatures (
Tref) are shown in relation to the reference temperatures (
Tref).
Figure 5, on the example of the results from channel 1, shows the differences between the temperatures determined from the Formula (3) and the reference temperatures (
Tref) in relation to
Tref. Additionally, standard deviations resulting from the dispersion of the results in the series in each of the measurement points for this channel have been marked. The results obtained for the other channels were similar.
Figure 6 contains a graph of the differences between the temperatures obtained in verification tests for all ten channels and the reference temperatures (
Tref), in relation to the reference temperatures. It shows the course of residual errors, defined as differences between temperatures determined in measurement channels, taking into account mathematical models describing the characteristics of individual sensors and temperature reference data.
5. Discussion
The satisfactory accuracy of the temperature measurement results obtained with the developed instrument, confirmed during verification tests, depends on the appropriate configuration of the acquisition part of measurement channels and on the correctness of subsequent procedures leading to the determination of the characteristics of individual channels, including the identification of coefficients in mathematical models of individual NTC thermistors. During the verification measurements, the satisfactory convergence of the obtained processing characteristics in individual channels was confirmed.
The systemic configuration of measurement channels is simpler than in similar temperature measuring instruments, e.g., described in [
35,
36,
38]. The use of the NI PXI platform together with the NI DAQ card in the developed device allowed for a simple configuration of the thermistor application circuits ensuring the correct acquisition of temperature information. Thanks to this, it was possible to transfer to the software the implementation of complex functions, including non-linear ones, which must be performed for the correctness of measurements and are incomparably easier to perform in software procedures than in analog circuits.
As part of the implemented hardware and software configuration of the device, the calibration of the measurement channels is carried out only with the use of an additional device for setting the temperature and a reference thermometer. It is not necessary to determine the characteristics of the sensors using external measuring systems, e.g., as in [
26,
38]. In the acquisition part of the measurement channels, there are no elements that require adjustment during calibration in order to obtain the desired processing properties.
The quality of determination of characteristics of the measuring path depends largely on the accuracy of the stabilization of the reference temperatures during the calibration procedures of the track elements. Since the resolution of the NI DAQ card [
43] used in the system and its accuracy, as well as the procedures for programming the measurement paths have been verified in numerous tests, the main emphasis in the calibration procedures of the measurement system should be on precise temperature stabilization and ensuring good thermal coupling of all sensors in the temperature calibrator. Residual errors observed as variations in the temperature error curves in the measurement channels (
Figure 6) may be the result of temperature differences in the thermal calibrator chamber in which the tested sensors were located together, both at the stage of identifying the processing characteristics in individual channels and during verification measurements. The level of these errors is quite low compared to the results of other studies, e.g., described in [
26].
The operations related to the developed device were performed in the presence of various random disturbances, the effects of which were observed as different sample values in the measurement series, with the measurement conditions unchanged. The impact of accompanying factors on the obtained results was effectively reduced by acquiring a series of measurements instead of simple samples at each stage of the research.
Compared with other solutions of multi-channel devices operating on the basis of invasive contact methods of temperature measurement, shown for example in [
16,
17,
18,
19,
20,
21,
22,
23,
24], several properties of the method used can be indicated. In addition to the positive features, such as the high measurement sensitivity of NTC thermistors and the simplicity of analog application circuits, determining the temperature value in each of the measurement channels requires performing calculations using non-linear functions, taking into account individual parameter values in each of the channels. In addition, unlike other types of sensors, each replacement of the NTC thermistor with a different one must be accompanied by the introduction of its current parameters to the measurement algorithms. Their determination is possible as a result of performing an additional operation, shown in
Figure 4, as procedure 2 built into the developed software of the device.


