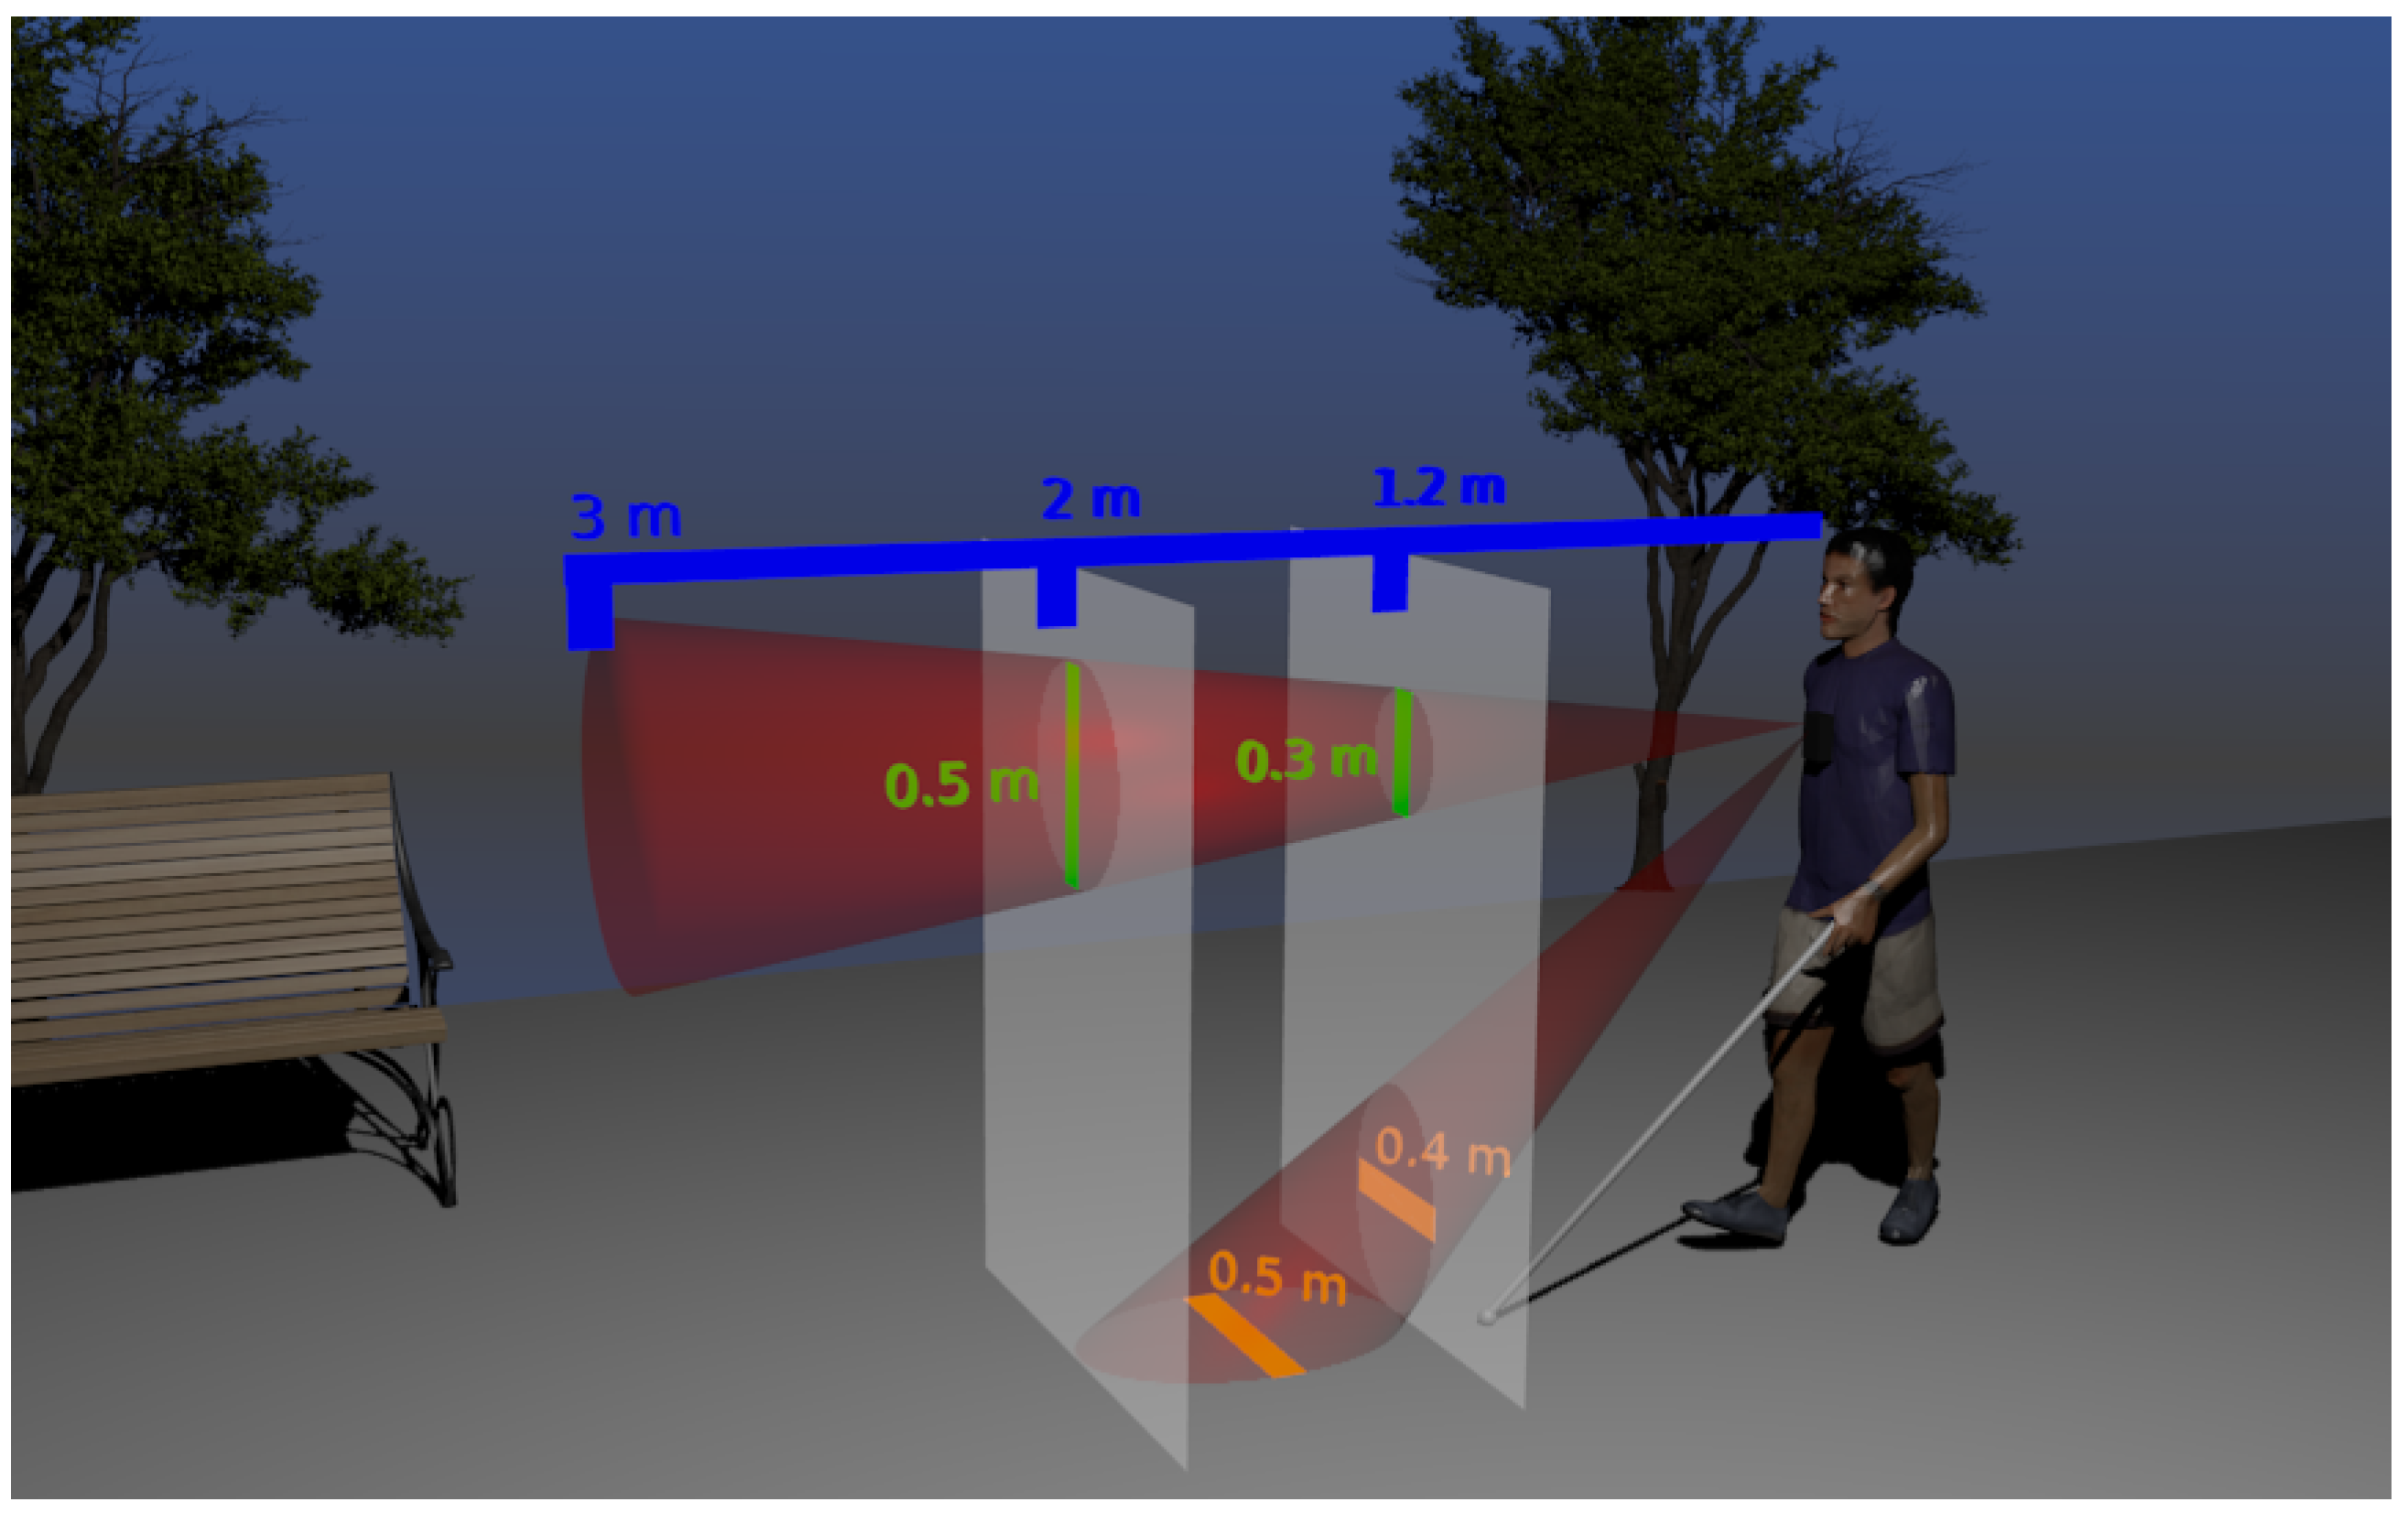
Communication

Safe Displacements Device for All Conditions Blind People

1
Departamento de Ingeniería Informática y de Sistemas, Universidad de La Laguna, 38200 San Cristobal de La Laguna, Spain
2
Ataman Science S.L.U., 38290 El Rosario, Spain
3
Departamento de Didáctica e Investigación Educativa, Universidad de La Laguna, 38200 San Cristobal de La Laguna, Spain
*
Author to whom correspondence should be addressed.
Electronics 2023, 12(10), 2171; https://doi.org/10.3390/electronics12102171
Submission received: 15 March 2023 / Revised: 2 May 2023 / Accepted: 8 May 2023 / Published: 10 May 2023
(This article belongs to the Special Issue Design, Development and Testing of Wearable Devices)

Abstract

:
One of the challenges faced by the blind to achieve optimum mobility is obstacles detection and avoidance. The traditional aid is the mobility white cane, but nowadays, there are also electronic travel aids. However, none of them is widely used. The eBAT (electronic Buzzer for Autonomous Travel) has been designed to provide protection and easy usage, interacting with a user’s mobile phone. To improve its performance, a usage test was carried out by 25 totally blind users divided by sex, age range and autonomy in mobility. The main results are that the eBAT gives a reduction in the involuntary contacts but also decreases the walking speed. There are differences between sex, age and mobility groups but with limited statistical significance, and there are also some correlations between variables.

1. Introduction

It is estimated by the World Health Organization [1] that there were about 2.2 billion visually impaired persons in the world in 2019, which is a rapid increase from 161 million in 2002 [2]. Some of the problems related to visual loss include the limitation in the ability to move independently, the walking speed lowering and unwanted contact with obstacles in the line of movement [3].
For the visually impaired, to achieve an acceptable level of mobility (considered as the ability to move independently, safely and efficiently in the environment [4]), it is necessary to use mobility aids. The most popular is the white cane, which is a tool made mainly of aluminum or graphite, in a fixed or folding format (4 to 6 segments), with variable length to meet user’s characteristics such as height or perceptual anticipation needed.
The second in the list is the guide dog, but most blind people prefer the white cane because it is versatile and low maintenance. It provides indirect information about objects or surfaces, facilitating perceptual anticipation. However, this anticipation is only about 1 m because it depends on the cane length and height of the person. Another drawback is that it is only up to the waist in height, leaving obstacles such as traffic signs or undetected branches from trees. For this reason, only 15% of the visually impaired go outside their homes at least once a day on their own [5].
With the gradual introduction of the electronics into the day-to-day, several devices have appeared with the aim of improving the life quality of the disabled in different and varied fields [6,7,8,9], including exoskeletons or dementia. In the particular case of the visually impaired, there are several research areas. Some efforts have been made into the inclusion of modern information systems [10,11], including Braille [12], or even trying to remove the blindness using prosthetics [13]. In some cases, studies focus on the navigation [14] (with a special mention of indoor navigation due to its intrinsic difficulties [15]).
This study focuses on the “Electronic Mobility Aids” (EMAs) [16] as an alternative that can be complementary to the white cane, which transforms information from the environment to a sensory channel different from the vision. Many of them have been developed over the last years. Some can be placed directly on the white cane [17], and others are held by the user [18]. Some designs have even used belts [19] or shoes [20] to position them. For a review of the most important and recent ones, see the review carried by Messaoudi et al. [21].
Despite the efforts and the heterogeneity of the ideas, none of the existing EMAs has been widely adopted among the blind people, which is due to the problems they manifest when used in the real world outside the laboratory environment. That can be summarized in its excessive size, weight, battery life, reliability, complexity of use and cost [22]. Another limitation evidenced in EMA studies is the lack of designs based on user experience, essentially using subjects with temporary vision deprivation (blindfolded) instead of the visual loss being permanent [23]. Taking into account these limitations, this study presents the results obtained for the interaction of different groups of visually impaired with the eBAT (electronic Buzzer for Autonomous Travel) [24]. These have already evolved from an initial prototype applying modifications to the sensors [25] to a stage of improving engineering design.

2. Materials and Methods

2.1. The eBAT Device

The aim of the project is to build an EMA for the visually impaired that increases mobility safety, detecting both obstacles from ground level and at height. It should be low cost and provide good user experience. Accommodating user’s preferences for the white cane, it should be able to be used as a complement instead of trying to replace it. There are different types of sensors to calculate distances, but the most versatile and cheapest are those based on ultrasound. A comparison of some of the currently available is in Table 1.
In them, distances to the obstacles are measured with the time-of-flight method, recording the time lasted from the ultrasonic emission to the echo reception. The model that offers lower price with reasonable performance is the HC-SR04. It can measure distances between two centimeters and four meters, with sub-centimeter accuracy and cone-beam-type detection. The eBAT has two sensors of this type to provide the required coverage. It uses an Arduino microcontroller that is responsible for operating the sensors and the Bluetooth. It should be located on the upper part of the torso not to interfere with the nominal use of the white cane. The two sensors are placed in different positions due to their specific functions. The top one is parallel to the ground to detect high obstacles. The bottom sensor is at a forty-five degree angle to detect ground-level obstacles. The effective obstacle detection ranges of the eBAT sensors configuration are shown in the diagram of Figure 1, with the device resting on the chest hanging from the neck.
Once the eBAT has detected any obstacle, the distance obtained from the sensors is transmitted to an application installed on the user’s mobile phone via Bluetooth. The app has been created specifically for the device and works on Android. It is also responsible for the haptic (sense of touch) feedback, using vibration pulses with a frequency inversely proportional to distance (more intense vibration for closer obstacles) from no vibration for detection beyond the limit to continuous vibration. A screenshot of the application in Figure 2.
For testing purposes, settings of the application were fixed and the interaction panel was simplified, leaving only a large area to switch ON/OFF the connection with the device and indicating with color if the connection with the eBAT is established (Green = ON) or disconnected (Red = OFF). In principle, the color was only as an indication for the supervisor to check the status of the device, but it can be useful for any visually impaired person with partial vision.

2.2. Obstacle Detection and Satisfaction Tests

For the present study, a careful selection of volunteers was carried out trying to avoid the main limitation that have been evidenced in similar studies: the lack of user experience and interaction with the device design. Instead of blindfolded, they were total blind persons and white cane users. We were trying also to cover different groups that might condition the mobility (even between the normalized vision people) such as autonomy, age, and sex to determine they have any influence. A total of 25 subjects were selected, with 36% women and 64% men. Their ages ranged from 26 years to 56. On average, the onset of visual loss was from 19 years of age. Regarding the personal autonomy (reported by themselves), only one considered themself to be autonomous in habitual exteriors compared to 56% who reported autonomy in any environment. The rest identified themselves with a level of autonomy in habitual outdoor settings and, if necessary, users of public transport.
Each subject was individually instructed on the use of the eBAT, reporting on its obstacle detection capabilities and the operation of the mobile application. By way of training, various approaches to known obstacles were made in order to experience the feedback provided by the eBAT. Users were also instructed to use the formal white cane holding position (at pelvic height) not to interfere with the ultrasound emissions. The average duration of the instructional process was fifteen minutes. Each of the subjects had to complete two courses with obstacles: one exclusively using the white cane and another with EMA help. Two types of obstacles were chosen: one located at ground level with dimensions (width × height) 1 × 1.2 m and the other with the same dimensions, but located in height (0.8 m from ground). See diagrams of Figure 3.
Their material was foam core cardboard to allow reflection of the ultrasounds but not to entail risk in case of physical contact. Obstacles were arranged in a 16 m corridor, with two ground-level obstacles and another two in height. They were distributed in such a way that the route was symmetrical. Figure 4 shows the diagram with the final route arrangement, which can be carried out in both directions indistinctly.
For each volunteer, without eBAT and with eBAT, the duration of the displacement and number of involuntary contacts with present obstacles (understood as shocks of any part of the body and/or the cane) were measured by a supervisor. Once the two tours were completed, each subject filled a satisfaction questionnaire about the eBAT device and its performance as a tool to detect obstacles in the line of travel, presenting a score scale from 0 to 10 as possible response alternatives. There were five questions: about the size (Q1), mobility (Q2), use of the mobile phone (Q3), safety (Q4) and overall satisfaction (Q5).

3. Results

The results obtained were processed using the SciPy statistical analysis package [26] and graphical representation obtained with matplotlib [27]. Both were implemented in the programming language python [28].

3.1. Mobility Test

The summary of the main results obtained for the number of involuntary contacts and journey duration is shown in Table 2.

3.1.1. Involuntary Contacts

For the number of involuntary contacts, it was found that on average, the difference between the route without the use of the eBAT and when it was used was 4.3 contacts. This represents an average improvement of 75%. In order to perform a deeper analysis of the results obtained, subjects were split into different groups: first, sex group (women/men) and two age groups for each of them, dividing by the median (45 years for men, 31 for women). The histogram of the data obtained is presented in Figure 5.
Some differences are present between groups. To better understand their scope, the T-test statistic [29] was calculated, which provides a p v a l u e , indicating differences with statistical relevance for values lower than 5% (p v a l u e < 0.05 ) or no statistical difference for values greater than 95% (p v a l u e > 0.95 ). This calculation was made for the comparison between all the groups in the study. Results for the Men–Women; Older–Younger; Older men–Younger men; Older women–Younger women; Older men–Older women; Younger men–Younger women; Older men–Younger women and Younger men–Older women are in Table 3.
The comparison of difference in the number of contacts using the autonomy level in subjects’ mobility (between the ones with more and less autonomy) is shown in Table 4.

3.1.2. Time to Complete the Path

In the case of time spend for the route, the obtained average difference was 7.5 s between the case of not using the eBAT and its use, which represents an average increase of 20% in the time needed. The histogram obtained divided by sex and age groups is shown in the graph of Figure 6.
As for the number of contacts, there are also differences between groups. In Table 5, the T-test results of the compared differences between sex and age are presented. Table 6 shows the corresponding differences by mobility group.
The closest comparison to statistical significance is that between younger females and younger male (0.0788), while the comparison between mobility groups presents no statistical difference (0.9774).

3.2. Satisfaction Questionnaire

The results obtained for each question of the satisfaction survey were also analyzed. See Table 7 for a summary.
It is observed that the best score was obtained for the question on mobile phone use with the eBAT and the worst score was obtained for the size of the device.
Detailed results for the first question (about the size of the eBAT) are shown in Figure 7.
Comparisons between groups’ results are shown in Table 8 (sex and age) and Table 9 (mobility).
About the second question, regarding the usefulness for mobility, the histogram of the results is shown in Figure 8.
Comparisons between sex and age groups are shown in Table 10 and that between the mobility groups is shown in Table 11.
The older men and younger women groups have no statistical difference between them.
The histogram about the third question (Q3) regarding the use of the mobile phone is shown in Figure 9.
Corresponding comparisons between groups of sex and age are shown in Table 12 and that between mobility groups is shown in Table 13.
There is no difference in the scores between sex groups, and they are statistically equivalent (p v a l u e > 0.95 ).
For question number four about the safety level perceived by the volunteers, the histogram is presented in Figure 10.
The comparisons between sex and age groups are shown in Table 14, while the comparison between mobility groups is shown in Table 15.
Finally, the histogram with the scores for the total satisfaction with the eBAT divided by sex and age groups is shown in Figure 11.
For the comparisons between sex and age groups, see Table 16, and for the mobility groups, see Table 17.
The strongest difference found was between young women and young men, but this was not statistically significant ( p v a l u e = 0.059 ).

3.3. Correlations

Another statistical test carried out for all the implied variables was the correlations using Pearson’s r [30]. It was computed using the NumPy [31] Python library for numerical arrays. The limit for significance is usually established in r 2 = 0.5 (or r = 5 = 0.71 ).
The correlation matrix for all the variables (age, sex, mobility, the five questions in the survey, difference in the number of involuntary contacts with and without the eBAT and difference in the time spent in the mobility test) for all the subjects in the study is shown in Table 18.
The strongest correlation ( r 2 = 0.56) is shown between the usefulness and the satisfaction scores with the eBAT device.
The computed correlation matrix for the men group is shown in Table 19.
Again, the strongest correlation is shown between the usefulness and the satisfaction.
For the women group, the correlation matrix is in Table 20.
Three correlations are highlighted. The strongest one is that between the satisfaction and the usefulness of the eBAT. There is a moderate correlation between the satisfaction and the use of the mobile phone as well as between the age and the time difference obtained with and without the eBAT.
In the case of the old group, the correlation matrix is in Table 21.
There is only moderate correlation, again, between usefulness and satisfaction.
The correlation matrix for the young group is shown in Table 22.
Here, only the correlation between satisfaction and usefulness is moderate.
The greater autonomy group correlation matrix is shown in Table 23.
No high correlation is present for the group with more autonomy in mobility.
For the last group, with less autonomy in mobility, the corresponding correlation matrix is presented in Table 24.
Here, there are two moderate correlations (between safety and satisfaction as well as usefulness and safety) and one strong correlation. The strongest in all the tables ( r 2 = 0.8 ) was between the usefulness and the satisfaction scores.

4. Discussion

In the present study, the level of execution of an independent movement task of totally blind people using the white cane along an unknown route was examined with an electronic obstacle detection device. Based on the results obtained, it can be established that the eBAT is a mobility-facilitating device that allows the detection and avoidance of elements that can be located in the line of movement, both from the ground and from height, without a high cost and accessible to anyone with blindness. The eBAT provides a 75% reduction in the involuntary contacts at a cost of 20% more time spent. This increase in time can be related to the cognitive load of using a new device. However, it does not represent a barrier to the use of the eBAT, since a general satisfaction of the users is obtained with a notable score. As the eBAT is still a device under development, the low score for its size could be improved in future iterations.
Using different comparisons between differentiated groups among the volunteers, only some statistically significant results have been found. The older men and younger women are equivalent for usefulness score. It is the same case for the usage of the mobile phone between the women and men groups. There is a difference in the total satisfaction of the device between the younger women and younger men groups of about 1 point score (0.87), while there was no comparison between mobility groups gave statistically significant results. From the analyzed data, the performance of the device and the perceived satisfaction in all the aspects is similar, making the eBAT a device for all conditions blind people.
For the correlations, it is stated that the usefulness of the device is correlated with the satisfaction, indicating that subjects finding the eBAT useful are satisfied with it with some variations in the total correlation between groups. For some groups, the correlation with satisfaction is present also in the mobile phone usage (women) and the safety (less autonomy for the mobility), showing that the preferences of the users can be different according with the division of the groups. Surprisingly, the satisfaction with the device is not correlated with its performance (difference in the number of involuntary contacts or time spent). It is even totally uncorrelated ( r 2 = 0 ) for the less autonomy in mobility group. The low score in the size is not correlated with the satisfaction, reaching 0 for the group with more autonomy in mobility.
Although the relatively small size of the sample (N = 25) is the main limitation of the study, the difficulty of access to potential participants with the condition of total blindness makes it an improvement compared with similar devices developed in recent years ([32] with only four blind volunteers or [33] with a test with six blind people), epecially for an archipelago far away from mainland and spread over eight islands such as the Canary islands, where the present study was performed. However, this did lead to an unbalanced sample between sexes.
To continue the development, the engineering design and adaptation of the eBAT, an option to provide different settings for the device is needed, giving the option to adjust the performance to user preferences. This could incorporate, for example, pre-defined modes (indoor/outdoor) comparing the user satisfaction and studying the accessibility of the application.
Power consumption, not only for the eBAT but also the incidence of the application in the mobile phone battery, should be properly analyzed and adjusted. First, this is because the size is the lower-rated aspect of the device, and the battery is usually a critical element for the device size. Secondly, this is because an application that drains phone battery too fast is non-desirable.
Finally, another limitation that should be studied is the current way to wear the device (resting on the chest, hanging from the neck), as the eBAT can be moved or even rotated in some situations such as picking up something from the ground or sitting down in a chair, producing then errors in the detections.

Author Contributions

Conceptualization, D.A. and B.C.; Data curation, D.A. and A.S.; Formal analysis, D.A. and A.S.; Investigation, D.A. and A.S.; Methodology, D.A. and B.C.; Software, D.A.; Supervision, A.S., J.T. and B.C.; Validation, A.S. and B.C.; Writing—original draft, D.A.; Writing—review and editing, D.A., A.S., J.T. and B.C. All authors have read and agreed to the published version of the manuscript.

Funding

This research received no external funding.

Institutional Review Board Statement

The study was conducted in accordance with the Declaration of Helsinki and approved by the Ethics Committee “Comité de Ética de la Investigación y Bienestar Animal” of Universidad de La Laguna (protocol code CEIBA2021-0466, approved on 13 July 2021).

Informed Consent Statement

Informed consent was obtained from all subjects involved in the study.

Acknowledgments

The authors want to acknowledge the support provided by the Universidad de La Laguna and Ataman Science S.L.U.

Conflicts of Interest

The authors declare no conflict of interest.

Abbreviations

The following abbreviations are used in this manuscript:
EMAElectronic Mobility Aid
eBATelectronic Buzzer for Autonomous Travel
USDUnited States Dollars
SDStandard Deviation

References

  1. World Health Organization. World Report on Vision; World Health Organization: Geneva, Switzerland, 2019; 160p. [Google Scholar]
  2. Resnikoff, S.; Pascolini, D.; Etya’ale, D.; Kocur, I.; Pararajasegaram, R.; Pokharel, G.P.; Mariotti, S.P. Global data on visual impairment in the year 2002. Bull. World Health Organ. 2004, 82, 844–851. [Google Scholar] [PubMed]
  3. Lamoureux, E.L.; Hassell, J.B.; Keeffe, J.E. The determinants of participation in activities of daily living in people with impaired vision. Am. J. Ophthalmol. 2004, 137, 265–270. [Google Scholar] [CrossRef] [PubMed]
  4. Kuyk, T.; Liu, L.; Elliott, J.; Fuhr, P. Visual Search Training and Obstacle Avoidance in Adults with Visual Impairments. J. Vis. Impair. Blind. 2010, 104, 215–227. [Google Scholar] [CrossRef]
  5. Manduchi, R.; Kurniawan, S. Mobility-related accidents experienced by people with visual impairment. Insight Res. Pract. Vis. Impair. Blind. 2011, 4, 44–54. [Google Scholar]
  6. Van der Roest, H.G.; Wenborn, J.; Pastink, C.; Dröes, R.M.; Orrell, M. Assistive technology for memory support in dementia. Cochrane Database Syst. Rev. 2017, 6, CD009627. [Google Scholar] [CrossRef] [PubMed]
  7. Kim, H.K.; Park, J. Examination of the Protection Offered by Current Accessibility Acts and Guidelines to People with Disabilities in Using Information Technology Devices. Electronics 2020, 9, 742. [Google Scholar] [CrossRef]
  8. Wang, T.; Zhang, B.; Liu, C.; Liu, T.; Han, Y.; Wang, S.; Ferreira, J.P.; Dong, W.; Zhang, X. A Review on the Rehabilitation Exoskeletons for the Lower Limbs of the Elderly and the Disabled. Electronics 2022, 11, 388. [Google Scholar] [CrossRef]
  9. Wan, X.; Zhang, K.; Ramkumar, S.; Deny, J.; Emayavaramban, G.; Siva Ramkumar, M.; Hussein, A.F. A Review on Electroencephalogram Based Brain Computer Interface for Elderly Disabled. IEEE Access 2019, 7, 36380–36387. [Google Scholar] [CrossRef]
  10. Yfantidis, G.; Evreinov, G. Adaptive blind interaction technique for touchscreens. Univ. Access Inf. Soc. 2006, 4, 328–337. [Google Scholar] [CrossRef]
  11. Shahira, K.C.; Lijiya, A. Towards Assisting the Visually Impaired: A Review on Techniques for Decoding the Visual Data from Chart Images. IEEE Access 2021, 9, 52926–52943. [Google Scholar] [CrossRef]
  12. Isayed, S.; Tahboub, R. A review of optical Braille recognition. In Proceedings of the 2015 2nd World Symposium on Web Applications and Networking (WSWAN), Sousse, Tunisia, 21–23 March 2015; pp. 1–6. [Google Scholar] [CrossRef]
  13. Shim, S.; Eom, K.; Jeong, J.; Kim, S.J. Retinal Prosthetic Approaches to Enhance Visual Perception for Blind Patients. Micromachines 2020, 11, 535. [Google Scholar] [CrossRef] [PubMed]
  14. Real, S.; Araujo, A. Navigation Systems for the Blind and Visually Impaired: Past Work, Challenges, and Open Problems. Sensors 2019, 19, 3404. [Google Scholar] [CrossRef] [PubMed]
  15. Plikynas, D.; Žvironas, A.; Gudauskis, M.; Budrionis, A.; Daniušis, P.; Sliesoraitytė, I. Research advances of indoor navigation for blind people: A brief review of technological instrumentation. IEEE Instrum. Meas. Mag. 2020, 23, 22–32. [Google Scholar] [CrossRef]
  16. Brabyn, J. A Review of Mobility Aids and Means of Assessment. In Electronic Spatial Sensing for the Blind: Contributions from Perception, Rehabilitation, and Computer Vision; Warren, D.H., Strelow, E.R., Eds.; Springer: Dordrecht, The Netherlands, 1985; pp. 13–27. [Google Scholar] [CrossRef]
  17. Buchs, G.; Simon, N.; Maidenbaum, S.; Amedi, A. Waist-up protection for blind individuals using the EyeCane as a primary and secondary mobility aid. Restor. Neurol. Neurosci. 2017, 35, 225–235. [Google Scholar] [CrossRef] [PubMed]
  18. Kammoun, S.; Parseihian, G.; Gutierrez, O.; Brilhault, A.; Serpa, A.; Raynal, M.; Oriola, B.; Macé, M.M.; Auvray, M.; Denis, M.; et al. Navigation and space perception assistance for the visually impaired: The NAVIG project. IRBM 2012, 33, 182–189. [Google Scholar] [CrossRef]
  19. Akram, S.; Mahmood, A.; Ullah, I.; Mujtabah, M.T.; Yasin, A.B.; Butt, A.R.; Shafique, M.; Manzoor, S. Construction and Analysis of a Novel Wearable Assistive Device for a Visually Impaired Person. Appl. Bionics Biomech. 2020, 2020, e6153128. [Google Scholar] [CrossRef]
  20. Yang, C.M.; Jung, J.Y.; Kim, J.J. Development and Evaluation of Shoe-type Walking Assistive Device for Visually Impaired Person. Sens. Mater. 2018, 30, 1869. [Google Scholar] [CrossRef]
  21. Messaoudi, M.D.; Menelas, B.A.J.; Mcheick, H. Review of Navigation Assistive Tools and Technologies for the Visually Impaired. Sensors 2022, 22, 7888. [Google Scholar] [CrossRef]
  22. Fok, D.; Polgar, J.M.; Shaw, L.; Jutai, J.W. Low vision assistive technology device usage and importance in daily occupations. Work J. Prev. Assesment Rehabil. 2011, 39, 37–48. [Google Scholar] [CrossRef]
  23. Klatzky, R.L.; Giudice, N.A.; Bennett, C.R.; Loomis, J.M. Touch-Screen Technology for the Dynamic Display of 2D Spatial Information Without Vision: Promise and Progress. Multisens. Res. 2014, 27, 359–378. [Google Scholar] [CrossRef]
  24. Abreu, D.; Codina, B.; Toledo, J.; Suárez, A. Validation of an eBAT as a mobility aid for blind people. Assist. Technol. 2020, 34, 1–9. [Google Scholar] [CrossRef] [PubMed]
  25. Abreu, D.; Toledo, J.; Codina, B.; Suárez, A. Low-Cost Ultrasonic Range Improvements for an Assistive Device. Sensors 2021, 21, 4250. [Google Scholar] [CrossRef] [PubMed]
  26. Virtanen, P.; Gommers, R.; Oliphant, T.E.; Haberland, M.; Reddy, T.; Cournapeau, D.; Burovski, E.; Peterson, P.; Weckesser, W.; Bright, J.; et al. SciPy 1.0: Fundamental algorithms for scientific computing in Python. Nat. Methods 2020, 17, 261–272. [Google Scholar] [CrossRef] [PubMed]
  27. Hunter, J.D. Matplotlib: A 2D Graphics Environment. Comput. Sci. Eng. 2007, 9, 90–95. [Google Scholar] [CrossRef]
  28. VanRossum, G.; Drake, F.L. The Python Language Reference; Python Software Foundation: Amsterdam, The Netherlands, 2010. [Google Scholar]
  29. Welch, B.L. The generalization of ‘Student’s’ problem when several different population variances are involved. Biometrika 1947, 34, 28–35. [Google Scholar] [CrossRef]
  30. Pearson, K. Note on Regression and Inheritance in the Case of Two Parents. Proc. R. Soc. Lond. 1895, 58, 240–242. [Google Scholar]
  31. Harris, C.R.; Millman, K.J.; Van der Walt, S.J.; Gommers, R.; Virtanen, P.; Cournapeau, D.; Wieser, E.; Taylor, J.; Berg, S.; Smith, N.J.; et al. Array programming with NumPy. Nature 2020, 585, 357–362. [Google Scholar] [CrossRef]
  32. Kim, J.H.; Park, J.E.; Lee, J.M. 3-D Space Visualization System Using Ultrasonic Sensors as an Assistive Device for the Blind. IEEE J. Transl. Eng. Health Med. 2020, 8, 1–5. [Google Scholar] [CrossRef]
  33. Barontini, F.; Catalano, M.G.; Pallottino, L.; Leporini, B.; Bianchi, M. Integrating Wearable Haptics and Obstacle Avoidance for the Visually Impaired in Indoor Navigation: A User-Centered Approach. IEEE Trans. Haptics 2021, 14, 109–122. [Google Scholar] [CrossRef]
Figure 1. Obstacle detection coverage diagram of the eBAT.
Electronics 12 02171 g001
Figure 2. View of the application developed for the eBAT. (a) OFF state in the left panel. (b) ON state in the right panel.
Electronics 12 02171 g002
Figure 3. Diagram of the used obstacles. (a) First panel with the obstacle in height. (b) Second panel with the ground-level one.
Electronics 12 02171 g003
Figure 4. Diagram of the 16 m long by 2 m wide corridor, with the obstacles every 3.2 m. It is possible to travel the same in both directions.
Electronics 12 02171 g004
Figure 5. Histogram of the difference of involuntary contacts between the realization of the route using the eBAT and without using it. Data are presented divided by sex groups and median age.
Electronics 12 02171 g005
Figure 6. Histogram of the difference in the time to complete the path using the eBAT and without using it. Data are presented divided by sex groups and median age.
Electronics 12 02171 g006
Figure 7. Histogram of the answers about the eBAT size perception of the volunteers. Data are presented divided by sex groups and median age.
Electronics 12 02171 g007
Figure 8. Histogram of the scores about the usefulness of the eBAT for the mobility. Data are presented divided by sex groups and median age.
Electronics 12 02171 g008
Figure 9. Histogram of the scores about the mobile phone use to operate and receive the feedback of the eBAT. Data are presented divided by sex groups and median age.
Electronics 12 02171 g009
Figure 10. Histogram of the scores about the perceived safety level with the device. Data are presented divided by sex groups and median age.
Electronics 12 02171 g010
Figure 11. Histogram of the overall satisfaction of the users with the eBAT divided by sex groups and median age.
Electronics 12 02171 g011
Table 1. Comparison of different ultrasonic distance sensors available on the market. Prices from http://digikey.com and http://automation24.es (accessed on 1 March 2023).
Comercial NameHC-SR04US-100Maxsonar-EZ0Microsonic-lcs+340
ImageElectronics 12 02171 i001Electronics 12 02171 i002Electronics 12 02171 i003Electronics 12 02171 i004
Min distance (cm)222.53.5
Max distance (cm)400450765500
Resolution (cm)0.30.110.15
Detection angle (degrees)15153017
Frequency (KHz)404042120
Special characteristic-Temperature sensorNoise filterTemperature compensation
Unit price (USD)3.916.8729.58142.73
Table 2. Summary of mobility test results.
Involuntary ContactsTime to Complete
(Number)the Path (Seconds)
Average without eBAT4.8835.59
Average with eBAT0.644.15
Average of difference (with eBAT–without eBAT)−4.287.56
Standard deviation of difference1.43.99
Table 3. T-test of comparison between groups of the difference (with device–without device) in the number of involuntary contacts. No statistical significance is present.
SexAverage (SD)T t e s t (p v a l u e )Age RangeAverage (SD)T t e s t (p v a l u e )T t e s t (p v a l u e )
Men−4.06 (1.52)1.12 (0.2765)Older−4.12 (1.54)0.15 (0.8798)1.27 (0.2324)
Younger−4.00 (1.50)
Women−4.67 (1.05)Older−5.00 (1.09)1.03 (0.3368)
Younger−4.25 (0.83)
Age RangeAverage (SD)T t e s t  (p v a l u e )SexAverage (SD)T t e s t  (p v a l u e )T t e s t  (p v a l u e )
Older−3.92 (1.68)1.35 (0.1929)Women−5.00 (1.09)1.09 (0.2975)0.16 (0.8715)
Men−4.12 (1.54)
Younger−4.67 (0.85)Women−4.25 (0.83)0.34 (0.7436)
Men−4.00 (1.50)
Table 4. T-test of the difference (with device–without device) in the number of involuntary contacts by mobility autonomy groups. The comparisons present no statistical significance.
Mobility GroupAverage (SD)T t e s t (p v a l u e )
More autonomy−4 (1.46)1.13 (0.2688)
Less autonomy−4.64 (1.23)
Table 5. T-test of the difference (with device–without device) in the time to complete the path by sex and age groups. None of the comparisons presents significance.
SexAverage (SD)T t e s t (p v a l u e )Age RangeAverage (SD)T t e s t (p v a l u e )T t e s t (p v a l u e )
Men8.41 (4.08)1.52 (0.1450)Older8.72 (5.16)−0.28 (0.7839)0.09 (0.9232)
Younger8.11 (2.55)
Women6.02 (3.32)Older7.98 (1.87)−2.17 (0.0865)
Younger3.57 (3.11)
Age RangeAverage (SD)T t e s t  (p v a l u e )SexAverage (SD)T t e s t  (p v a l u e )T t e s t  (p v a l u e )
Older8.39 (4.42)1.08 (0.2901)Women7.98 (1.87)0.34 (0.7378)1.94 (0.0843)
Men8.72 (5.16)
Younger6.65 (3.25)Women3.57 (3.11)2.23 (0.0788)
Men8.11 (2.55)
Table 6. T-test of the difference (with device–without device) in the time to complete the path by mobility autonomy groups. The comparisons present no statistical difference (p v a l u e > 0.95 ).
Mobility GroupAverage (SD)T t e s t (p v a l u e )
More autonomy7.54 (4.56)−0.03 (0.9774)
Less autonomy7.58 (3.13)
Table 7. Satisfaction survey results summary.
QuestionSize (Q1)Usefulness (Q2)Mobile Phone Use (Q3)Safety (Q4)Satisfaction (Q5)
Average4.887.728.567.648.28
SD1.920.870.90.930.92
Table 8. T-test of the score for the size of the device by sex and age. None of the comparisons presents significance.
SexAverage (SD)T t e s t (p v a l u e )Age RangeAverage (SD)T t e s t (p v a l u e )T t e s t (p v a l u e )
Men4.5 (1.97)−1.37 (0.1871)Older4.87 (1.9)−0.73 (0.4798)−0.68 (0.5122)
Younger4.12 (1.96)
Women5.56 (1.64)Older4.8 (1.33)1.56 (0.1701)
Younger6.5 (1.5)
Age RangeAverage (SD)T t e s t  (p v a l u e )SexAverage (SD)T t e s t  (p v a l u e )T t e s t  (p v a l u e )
Older4.54 (1.91)−0.90 (0.3767)Women4.8 (1.33)0.08 (0.9403)−1.44 (0.1912)
Men4.87 (1.9)
Younger5.25 (1.88)Women6.5 (1.5)−2.08 (0.0741)
Men4.12 (1.96)
Table 9. T-test of the score for the size of the device by mobility autonomy groups. The comparisons presents no statistical significance.
Mobility GroupAverage (SD)T t e s t (p v a l u e )
More autonomy5.14 (1.92)0.75 (0.4619)
Less autonomy4.55 (1.88)
Table 10. T-test of the comparison for the usefulness for the mobility of the device. There is no statistical difference between the older men and younger women.
SexAverage (SD)T t e s t (p v a l u e )Age RangeAverage (SD)T t e s t (p v a l u e )T t e s t (p v a l u e )
Men7.75 (0.9)0.22 (0.8247)Older7.5 (0.87)−0.73 (0.4798)0.4 (0.6965)
Younger8 (0.86)
Women7.67 (0.82)Older7.8 (0.75)−0.48 (0.6482)
Younger7.5 (0.87)
Age RangeAverage (SD)T t e s t  (p v a l u e )SexAverage (SD)T t e s t  (p v a l u e )T t e s t  (p v a l u e )
Older7.54 (0.84)−1.06 (0.2992)Women7.8 (0.75)−0.6 (0.5606)0 (1)
Men7.5 (0.87)
Younger7.92 (0.86)Women7.5 (0.87)0.84 (0.4366)
Men8 (0.86)
Table 11. T-test of the comparison of the score for the usefulness for mobility by mobility autonomy groups. The comparison presents no statistical significance.
Mobility GroupAverage (SD)T t e s t (p v a l u e )
More autonomy7.86 (0.74)0.83 (0.4156)
Less autonomy7.55 (0.99)
Table 12. T-test of the comparison for the use of the mobile phone with the device. There is no statistical difference between sex.
SexAverage (SD)T t e s t (p v a l u e )Age RangeAverage (SD)T t e s t (p v a l u e )T t e s t (p v a l u e )
Men8.56 (0.93)0.02 (0.9856)Older8.37 (1.11)0.77 (0.4585)0.26 (0.8006)
Younger8.75 (0.66)
Women8.56 (0.83)Older8.6 (1.02)−0.17 (0.8699)
Younger8.5 (0.5)
Age RangeAverage (SD)T t e s t  (p v a l u e )SexAverage (SD)T t e s t  (p v a l u e )T t e s t  (p v a l u e )
Older8.38 (1.08)−1.02 (0.3215)Women8.6 (1.02)−0.34 (0.7413)−0.25 (0.8112)
Men8.37 (1.11)
Younger8.75 (0.59)Women8.5 (0.5)0.65 (0.5325)
Men8.75 (0.66)
Table 13. T-test of the comparison of the score for the use of the mobile phone by mobility autonomy groups. The difference is not statistically significant.
Mobility GroupAverage (SD)T t e s t (p v a l u e )
More autonomy8.86 (0.52)1.78 (0.0984)
Less autonomy8.18 (1.11)
Table 14. T-test of the comparison for the perceived safety with the device scores. There is no statistical significance in the differences.
SexAverage (SD)T t e s t (p v a l u e )Age RangeAverage (SD)T t e s t (p v a l u e )T t e s t (p v a l u e )
Men7.67 (0.92)0.32 (0.7533)Older7.62 (0.99)0.26 (0.8019)−0.09 (0.9338)
Younger7.75 (0.83)
Women7.56 (0.96)Older7.8 (0.98)−0.83 (0.4488)
Younger7.25 (0.83)
Age RangeAverage (SD)T t e s t  (p v a l u e )SexAverage (SD)T t e s t  (p v a l u e )T t e s t  (p v a l u e )
Older7.62 (0.92)−0.13 (0.8964)Women7.8 (0.98)−0.28 (0.7835)0.62 (0.5577)
Men7.62 (0.99)
Younger7.67 (0.94)Women7.25 (0.83)0.87 (0.4176)
Men7.75 (0.83)
Table 15. T-test of the comparison of the score for perceived safety with teh eBAT. The difference is not statistically significant.
Mobility GroupAverage (SD)T t e s t (p v a l u e )
More autonomy7.86 (0.91)1.31 (0.2039)
Less autonomy7.36 (0.88)
Table 16. T-test of the comparison for the satisfaction with the device. There is some difference in the limit for statistical significance (p v a l u e < 0.05 ) between the young women and the young men.
SexAverage (SD)T t e s t (p v a l u e )Age RangeAverage (SD)T t e s t (p v a l u e )T t e s t (p v a l u e )
Men8.5 (1)1.87 (0.074)Older8.37 (1.11)0.47 (0.6451)1.38 (0.1966)
Younger8.62 (0.86)
Women7.89 (0.57)Older8.0 (0.63)−0.62 (0.5549)
Younger7.75 (0.43)
Age RangeAverage (SD)T t e s t  (p v a l u e )SexAverage (SD)T t e s t  (p v a l u e )T t e s t  (p v a l u e )
Older8.31 (1.14)0.15 (0.879)Women8.0 (0.63)0.71 (0.4905)1.28 (0.2301)
Men8.37 (0.99)
Younger8.25 (0.59)Women7.75 (0.43)2.14 (0.0589)
Men8.62 (0.86)
Table 17. T-test of the comparison for the total satisfaction with the device. The difference is not statistically significant.
Mobility GroupAverage (SD)T t e s t (p v a l u e )
More autonomy8.5 (0.63)1.26 (0.2274)
Less autonomy8 (1.13)
Table 18. Correlation matrix for all the variables and all the subjects in the study (N = 25). Values greater than 0.5 are highlighted.
AgeSexAutonomySizeUsefulnessMobile PhoneSafetySatisfactionContacts Diff.Time Diff.
Age1.000−0.629−0.093−0.158−0.233−0.236−0.0220.0300.0100.281
Sex 1.000−0.0990.263−0.046−0.004−0.068−0.320−0.207−0.288
Autonomy 1.0000.1650.2910.3660.3500.4070.231−0.042
Size 1.0000.218−0.2620.221−0.004−0.443−0.366
Usefulness 1.0000.4550.5640.747−0.195−0.103
Mobile phone 1.0000.2410.3920.220−0.080
Safety 1.0000.538−0.1690.236
Satisfaction 1.0000.123−0.054
Contacts diff. 1.0000.140
Time diff. 1.000
Table 19. Correlation matrix for all the variables in the men group (N = 16). Values greater than 0.5 are highlighted.
AgeAutonomySizeUsefulnessMobile PhoneSafetySatisfactionContacts Diff.Time Diff.
Age1.000−0.1470.034−0.397−0.188−0.230−0.1810.046−0.167
Autonomy 1.0000.2870.3700.4330.4270.4620.173−0.002
Size 1.0000.352−0.3230.2600.191−0.449−0.288
Usefulness 1.0000.3900.5110.763−0.285−0.238
Mobile phone 1.0000.3520.3010.1130.027
Safety 1.0000.648−0.1490.231
Satisfaction 1.0000.021−0.204
Contacts diff. 1.0000.285
Time diff. 1.000
Table 20. Correlation matrix for all the variables in the women group (N = 9). Values greater than 0.5 are highlighted.
AgeAutonomySizeUsefulnessMobile PhoneSafetySatisfactionContacts Diff.Time Diff.
Age1.000−0.317−0.038−0.231−0.5300.148−0.417−0.6570.748
Autonomy 1.000−0.0300.0910.2090.1820.1750.354−0.268
Size 1.000−0.028−0.1450.228−0.292−0.300−0.383
Usefulness 1.0000.6000.6640.8810.0000.158
Mobile phone 1.0000.0310.8390.549−0.358
Safety 1.0000.319−0.2940.224
Satisfaction 1.0000.248−0.005
Contacts diff. 1.000−0.541
Time diff. 1.000
Table 21. Correlation matrix for all the variables in the old group (N = 13). Values greater than 0.5 are highlighted.
SexAutonomySizeUsefulnessMobile PhoneSafetySatisfactionContacts Diff.Time Diff.
Sex1.000−0.2100.373−0.184−0.3710.120−0.332−0.5270.170
Autonomy 1.0000.0490.3990.4160.3030.5500.470−0.018
Size 1.0000.107−0.6260.0740.030−0.516−0.315
Usefulness 1.0000.4500.4640.791−0.083−0.478
Mobile phone 1.0000.2260.4060.408−0.025
Safety 1.0000.626−0.0300.275
Satisfaction 1.0000.229−0.331
Contacts diff. 1.0000.205
Time diff. 1.000
Table 22. Correlation matrix for all the variables in the young group (N = 12). Values greater than 0.5 are highlighted.
SexAutonomySizeUsefulnessMobile PhoneSafetySatisfactionContacts Diff.Time Diff.
Sex1.000−0.2390.094−0.273−0.000−0.250−0.5940.485−0.545
Autonomy 1.0000.2930.1140.2130.4180.071−0.265−0.023
Size 1.0000.2700.2800.377−0.056−0.261−0.387
Usefulness 1.0000.4470.6840.853−0.3030.544
Mobile phone 1.0000.2970.412−0.165−0.071
Safety 1.0000.446−0.4850.218
Satisfaction 1.000−0.3300.688
Contacts diff. 1.000−0.251
Time diff. 1.000
Table 23. Correlation matrix for all the variables in the group with more autonomy in mobility (N = 14). No values greater than 0.5 .
AgeSexSizeUsefulnessMobile PhoneSafetySatisfactionContacts Diff.Time Diff.
Age1.000−0.689−0.329−0.305−0.099−0.1950.2540.2500.210
Sex 1.0000.118−0.091−0.132−0.074−0.505−0.108−0.348
Size 1.0000.465−0.1960.2150.000−0.406−0.386
Usefulness 1.0000.3200.2860.461−0.329−0.233
Mobile phone 1.000−0.0430.2210.000−0.083
Safety 1.0000.249−0.1600.317
Satisfaction 1.0000.1560.056
Contacts diff. 1.0000.326
Time diff. 1.000
Table 24. Correlation matrix for all the variables in the group with less autonomy in mobility (N = 11). Values greater than 0.5 are highlighted.
AgeSexSizeUsefulnessMobile PhoneSafetySatisfactionContacts Diff.Time Diff.
Age1.000−0.5820.078−0.174−0.3900.223−0.136−0.3860.431
Sex 1.0000.5130.0500.1790.038−0.162−0.271−0.222
Size 1.000−0.062−0.4830.155−0.086−0.639−0.355
Usefulness 1.0000.4890.8170.898−0.1640.062
Mobile phone 1.0000.3030.3620.284−0.111
Safety 1.0000.731−0.3750.121
Satisfaction 1.0000.000−0.183
Contacts diff. 1.000−0.251
Time diff. 1.000
Disclaimer/Publisher’s Note: The statements, opinions and data contained in all publications are solely those of the individual author(s) and contributor(s) and not of MDPI and/or the editor(s). MDPI and/or the editor(s) disclaim responsibility for any injury to people or property resulting from any ideas, methods, instructions or products referred to in the content.

