1. Introduction
The direct conversion of heat into electrical power through compact and reliable thermoelectric devices offers interesting prospects for a wide range of applications, from (micro-)scavenging [
1] to power small circuits and sensor nodes, to large-scale energy harvesting [
2], as well as interesting applications related to the possibility of localized cooling.
A thermoelectric generator (TEG) is a device that converts thermal energy directly into electrical energy by exploiting the Seebeck effect. Given a temperature gradient between two points within a material, the Seebeck effect is responsible for the generation of an electric voltage. The thermal gradient can be generated by exposing the hot side of the TEG to a high-temperature source, such as a waste heat stream, while the cold side of the TEG is cooled with a heat sink.
The ability to convert heat into electrical energy in a TEG-based system depends on several factors, including the materials and size of the TEG, the temperature difference between the TEG faces, and the electrical subsystem used to condition the output electrical parameters.
The planning of systems for thermoelectric energy conversion lacks reliable and feasible strategies for the quick and accurate design of the whole system, with both the thermal and electrical parts considered simultaneously. Typically, these two parts are designed separately and then combined, leading to a limited amount of converted energy.
On the one hand, current research focuses on the development of innovative materials that can overcome the limitations imposed by the currently available tellurium-based thermoelectric devices. In particular, several groups [
3,
4] (including our group) are focused on the development of thermoelectric generators based on nanostructured silicon, which is low-cost, sustainable, and allows on-chip integration with widely available technologies analogous to those used for the fabrication of integrated circuits.
On the other hand, the state-of-the-art of electrical system and strategy designs for the maximization of the electrical output power extraction from TEGs are based on the assumption that a TEG can be modeled as an ideal voltage source with an internal series resistor. Voltage sources and series resistors are modeled with either fixed values [
5,
6,
7,
8] or temperature-dependent values [
9]. In the latter case, the electrical elements are able to consider some aspects of the TEG’s non-linearity, such as the dependence of the Seebeck coefficient and output resistance on the temperature [
10].
However, this TEG modeling strategy neglects the effect of the electrical parameters on the thermal fluxes. The heat flux through the TEG from the hot to the cold side changes with the generated electrical current. This current contributes to the decrease in temperature between the TEG faces compared to an open-circuit configuration when the current through the TEG is zero. This phenomenon is due to the Peltier effect, which is not considered in the model of a simple voltage source and resistor in series. This model of a TEG holds valid if the TEG faces operate at a constant temperature and the thermal contact resistances are neglected. This means that an increase in the TEG output current requires a transfer of additional thermal energy into the system to compensate for the contribution of the Peltier effect.
In real applications, when TEG modules are used for thermoelectric energy conversion, the heating source cannot be controlled to maintain a constant temperature. At most, they can work with a constant heat flux. In addition, because commercial heat sinks have thermal resistances in the order of 2–10 K/W, this contact resistance cannot be neglected. Consequently, a constant temperature is achieved under steady-state conditions, i.e., when the current through the TEG is zero. However, the temperature on TEG faces decreases with an increase in the TEG current, thus changing the electrical parameters of the TEG (open voltage and output resistance).
The difference between the power generated in constant-temperature and constant-heat-flux conditions was experimentally verified in [
11,
12] by showing the different maximum power point (MPP) positions for both conditions.
Some techniques have been proposed in the literature to consider the effect of the electrical parameters on the thermal parameters. Concerning the thermoelectric system complexity, some state-of-the-art techniques are based on simplifications, such as the assumption of small temperature differences between the TEG faces [
13,
14] or the neglect of Joule heating [
15]. Other techniques use complex differential equations to introduce the thermal contact resistances and more accurately model the heat flux, leading to complexity in the design of the whole system [
16]. Conversely, in our previous paper [
17], we presented a method, experimentally verified in the present work, based on the modeling of both thermal and electrical elements in a single electrical simulator. Contrary to the use of complex systems of equations, this technique shifted the computing burden to a circuit simulator while preserving an intuitive representation that provided the designer with a general understanding of the problem and facilitated optimization.
In this work, the effectiveness and usability of the proposed method were verified by designing a complete thermoelectric system with a TEG, DC/DC boost converter, energy storage element (battery), and control system, in addition to the thermal energy sources of the heat exchange elements and the TEG.
In
Section 2, we present the model used for the design of each stage of the thermal to electrical power conversion chain. The control system and the algorithm used to optimize the power extraction from the TEG are described in
Section 3.
Section 4 focuses on the experimental verification of the proposed system and the control algorithm. Conclusions are drawn in
Section 5.
2. System Model
The design and optimization of the proposed system for direct thermal to electrical energy conversion were based on modeling all the electrical and thermal parameters by means of a single electrical circuit. In this way, all aspects of the system, from the heat source and heat sink to the energy storage element, could be considered at the same time and properly optimized. Indeed, the electric current delivered by the TEG, which depends on the electrical load, affects the heat transfer in the presence of thermal contact resistances, such as those related to a heat sink. On the other side, the heat exchange modifies the temperatures of the system elements and hence the voltage and current delivered by the TEG.
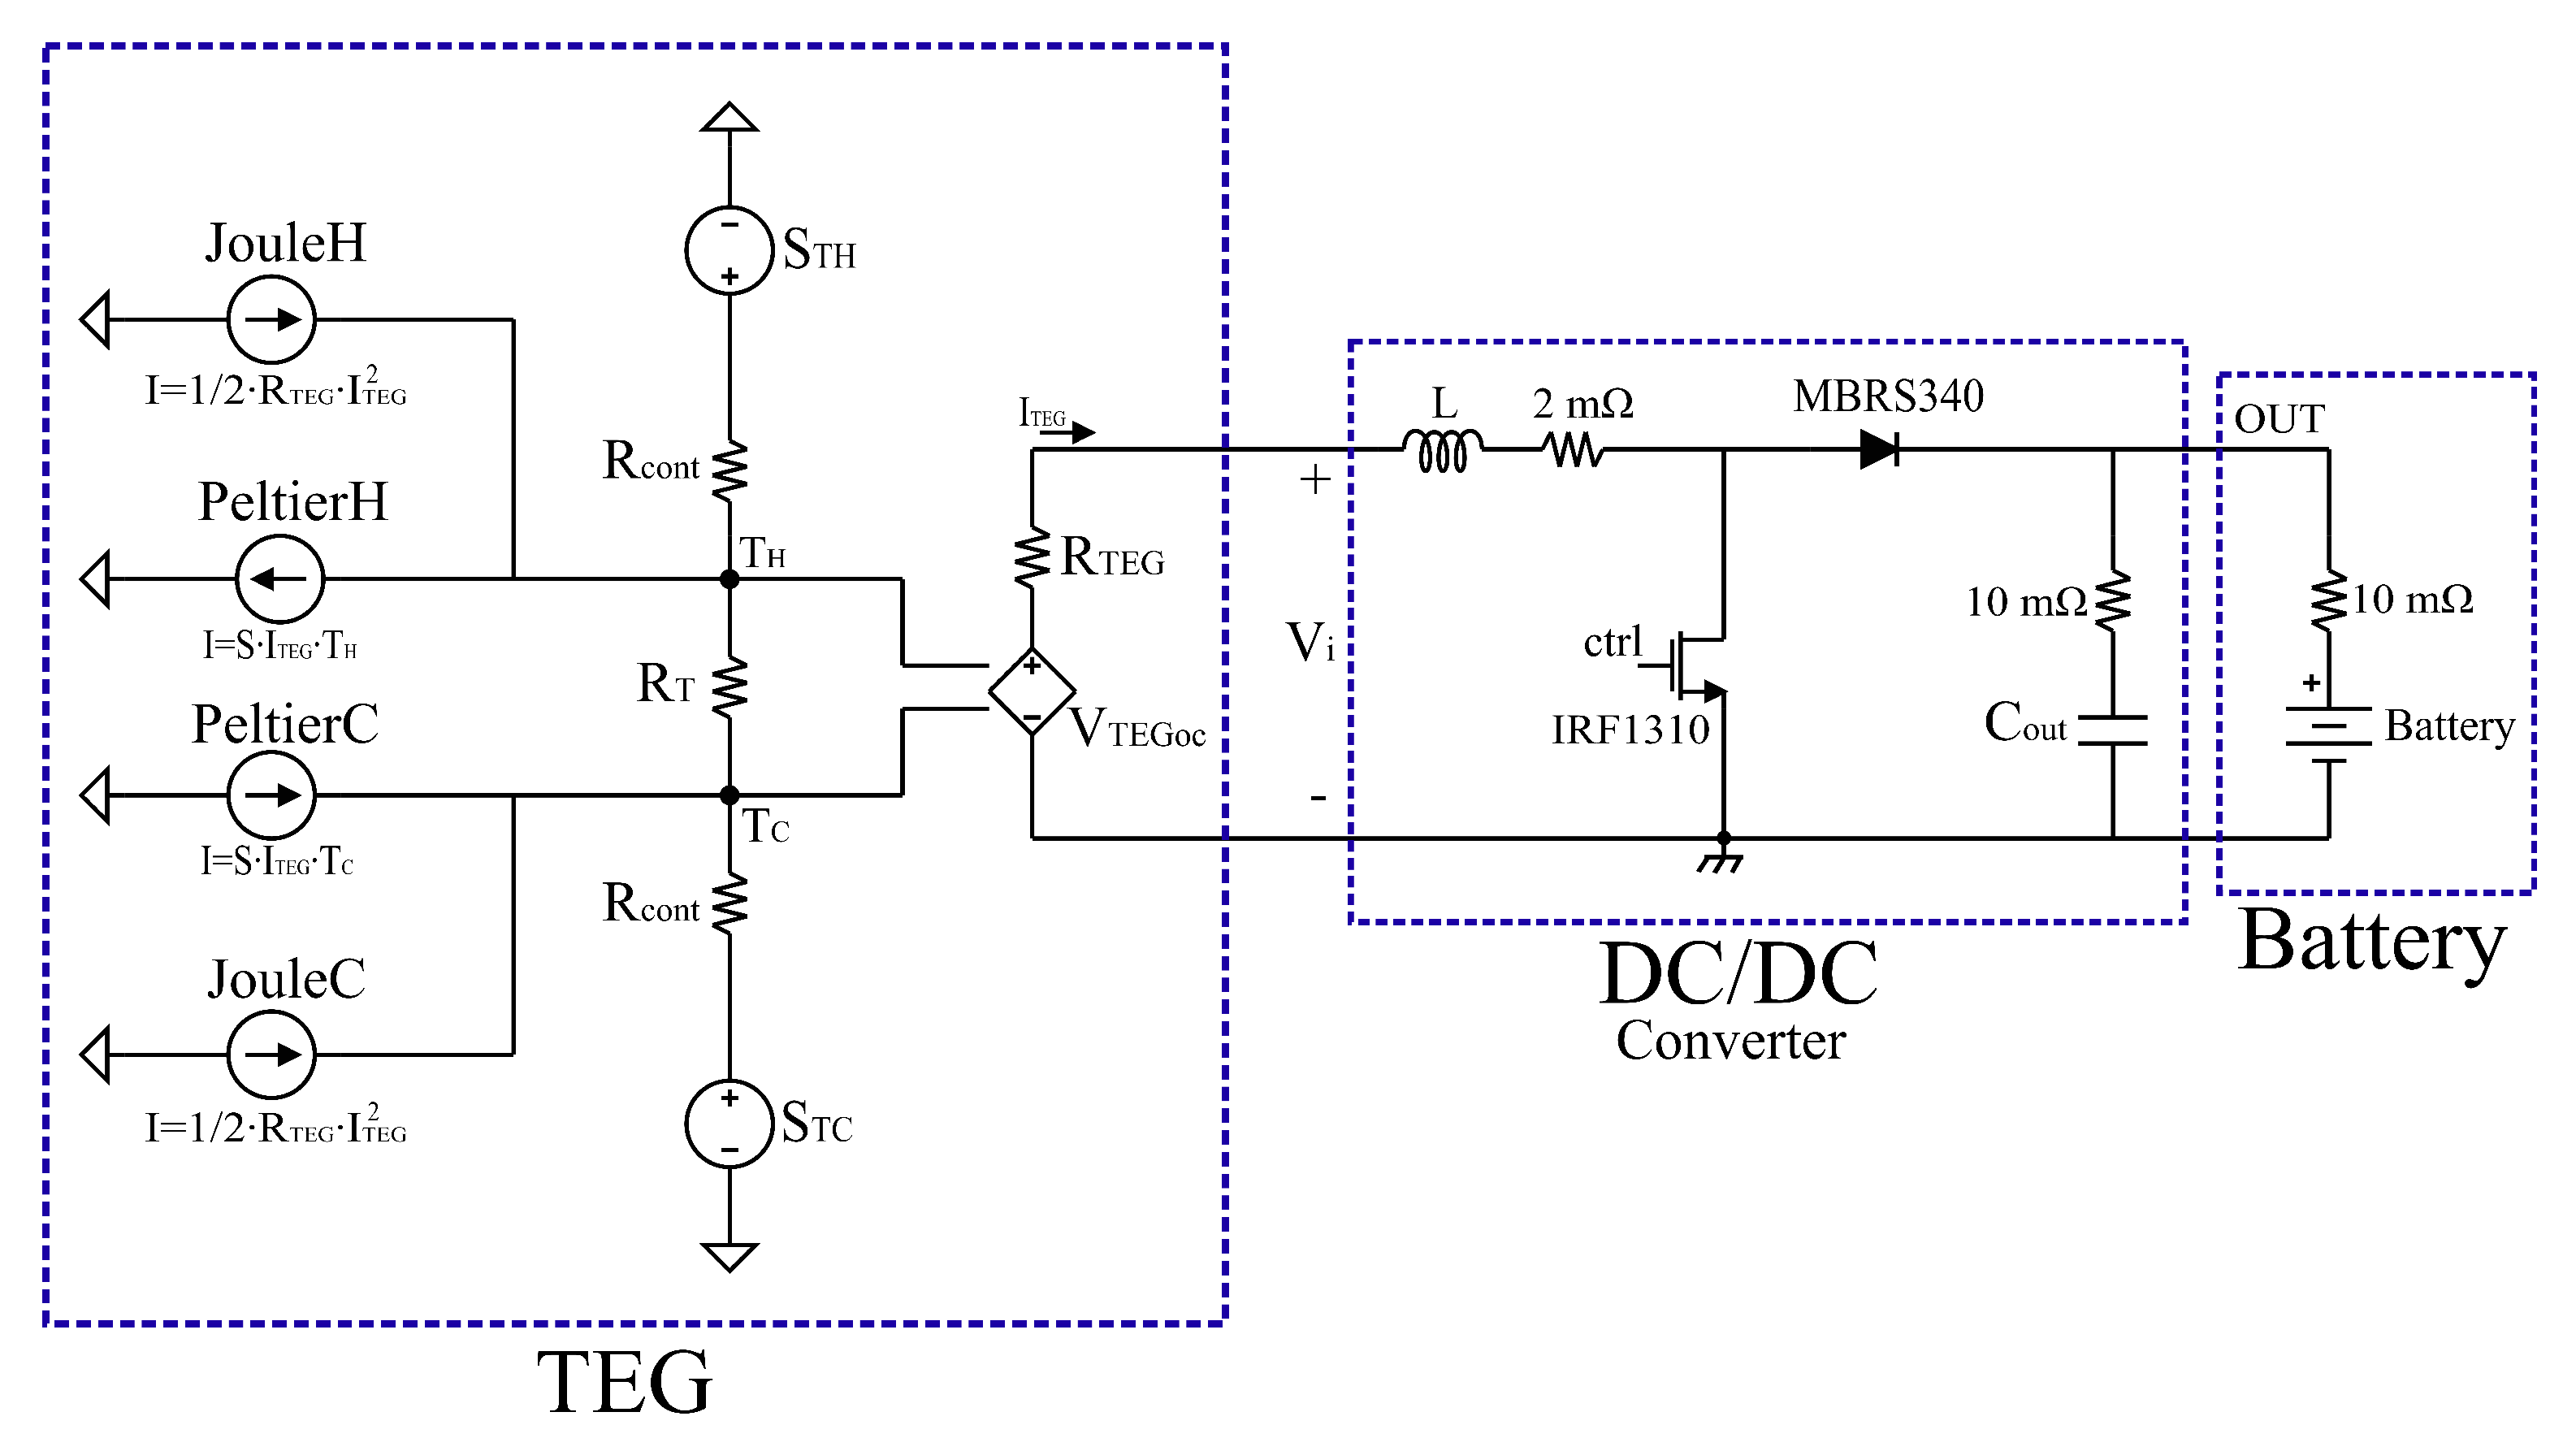
In
Figure 1, we show an electrical representation of the proposed system. It consists of three main parts: the TEG, the DC/DC converter, and the energy storage element.
2.1. TEG Modeling
The TEG model consists of electrical and thermal parts. The electrical part is composed of a voltage generator in series with its electrical resistance . The second includes two voltage sources and , which represent the two heat sources, as well as the two thermal contact resistances . The thermal resistance of the TEG is represented by , and the temperatures and are the control parameters for the source , whose output voltage is related to the control voltage by means of the equation , where S is the Seebeck coefficient.
The heat flux due to the Peltier effect is accounted for by the two equivalent current sources and for the hot and cold TEG sides, respectively. Their currents are proportional to the TEG output electrical current. This current also controls the two equivalent current sources and , which represent the heat generated by the Joule effect on the hot and cold sides of the TEG, respectively.
2.2. DC/DC Converter Modeling
The TEG is connected to the load via a DC/DC converter. Typically, DC/DC converters are used to maintain a stable output voltage despite changes in the input voltage or load conditions, or to match the voltage levels between different parts of a system [
18,
19,
20,
21]. In our case, the DC/DC converter aimed at both boosting the TEG output voltage to a level sufficient to charge the storage element, and maximizing the power extraction from the TEG device.
Although it would be preferable to optimize the system for maximum efficiency, the system was designed for maximum power transfer conditions. However, commercial TEG devices based on tellurium materials have a low-quality factor:
, where
S is the Seebeck coefficient, and
and
are the electrical and thermal conductivity, respectively. Consequently, as demonstrated in [
17], the conditions for maximum efficiency and maximum power transfer are very close; hence, the system operates under both conditions simultaneously.
The operation of a DC/DC switching converter can be divided into two main modes: continuous and discontinuous. This distinction is based on the values of the inductor current. The converter operates in continuous mode if the values of the inductor current are always positive. Otherwise, the converter operates in discontinuous mode, i.e., whenever the value of the inductor current is zero for an interval of the switching period.
In order to design the proposed DC/DC converter with low-cost devices, we decided to operate at the MPP in continuous mode conditions. In this case, since the inductor current is always positive with a saw-tooth shape, lower current peaks are present compared to the discontinuous mode. In the latter case, indeed, a current with a triangular shape and a low circulation angle is observed. The lower the current peak in the inductor, the lower the current that should be sustained by the DC/DC converter devices. In addition, when the current in the inductor is zero, voltage ringing can occur on the common node between the inductor, transistor, and diode. This is due to the resonance of the inductor and the parasitic capacitance of the transistor when a great impedance is shown in the diode and transistor (both elements off). This ringing can be damped with a suitable RC snubber at the expense of additional power dissipation and component costs [
22].
Under steady-state conditions, when the DC/DC input and output voltages are constant, the current swing in the inductor is the same for both the ’on’ and ’off’ phases of the transistor. This set of conditions results from the saw-tooth current behaviour. Considering the transistor ’on’ phase, the voltage in the inductor is constant and equal to the input voltage. Therefore, since the current in the inductor is equal to its derivative, the current swing (
) is calculated as shown in Equation (
1), where
is the input voltage of the DC/DC converter,
is the transistor ’on’ time, and
L is the inductor value.
The conditions delimiting the continuous and discontinuous operating modes occur when the average current in the inductor is equal to half the inductor current swing. Indeed, under these conditions, the inductor current is null for an instant. The average current in the inductor is equal to the average input current in the DC/DC converter. It can be derived from the current equation in the input mesh, as shown in Equation (
2), where
and
are the equivalent output resistance and the open-circuit voltage of the TEG, respectively. These limit conditions can be interpreted as a restriction on the selection of the inductor value. Indeed, considering Equation (
2) and the maximum power transfer conditions between the TEG and the DC/DC converter,
, the value of the inductance needed to operate in the limit conditions and ensure maximum power transfer is shown in Equation (
3).
Considering a real TEG device, an ranging from 5 Ω to 20 Ω could be used to determine the required inductor value. As a result, assuming a switching frequency () equal to 10 kHz, the inductor value should be greater or equal to 1 mH. In order to minimize the size, we selected a 1 mH inductor.
The switch was implemented with an N-MOSFET IRF1310, which had an ’on’ resistance of about 36 mΩ and could sustain a maximum current of 42 A and a maximum drain to source voltage of 100 V with a 12 V driving voltage at the gate. The MOSFET was driven by a PWM (pulse width modulation) signal generated by a digital controller according to the algorithm discussed in the next
Section 3.
An MBRS340 diode was used. This diode is characterized by a threshold voltage of 0.43 V and a maximum current of 3 A. Although replacing the diode with a switch could enhance the converter’s efficiency, it required a proper driving circuit able to boost the driving gate voltage to bring the N-MOSFET into conduction. Furthermore, the accurate control of the switch activation time, including the dead time, had to be ensured to avoid the simultaneous conduction of both switches, which would lead to an inrush current of the battery discharge. As a result, the additional devices would raise the cost of the DC/DC converter. Therefore, a basic converter architecture was adopted for the proposed solution.
2.3. Electric Storage Element Modeling
For the electrical storage element, a basic battery model consisting of a 12 V voltage source and a 10 mΩ parasitic series resistor was used. Depending on the selected battery, the storage element model could be improved by considering its dynamic behavior and state of charge. However, in order to keep the simulation complexity manageable, the usage of the basic model for the battery was sufficient for the development and qualification of the system and control algorithm.
2.4. Simulation Results
The circuit was analyzed in LTSPICE [
23] (Linear Technology Simulation Program with Integrated Circuit Emphasis), allowing for the simultaneous optimization of the electrical and thermal parts.
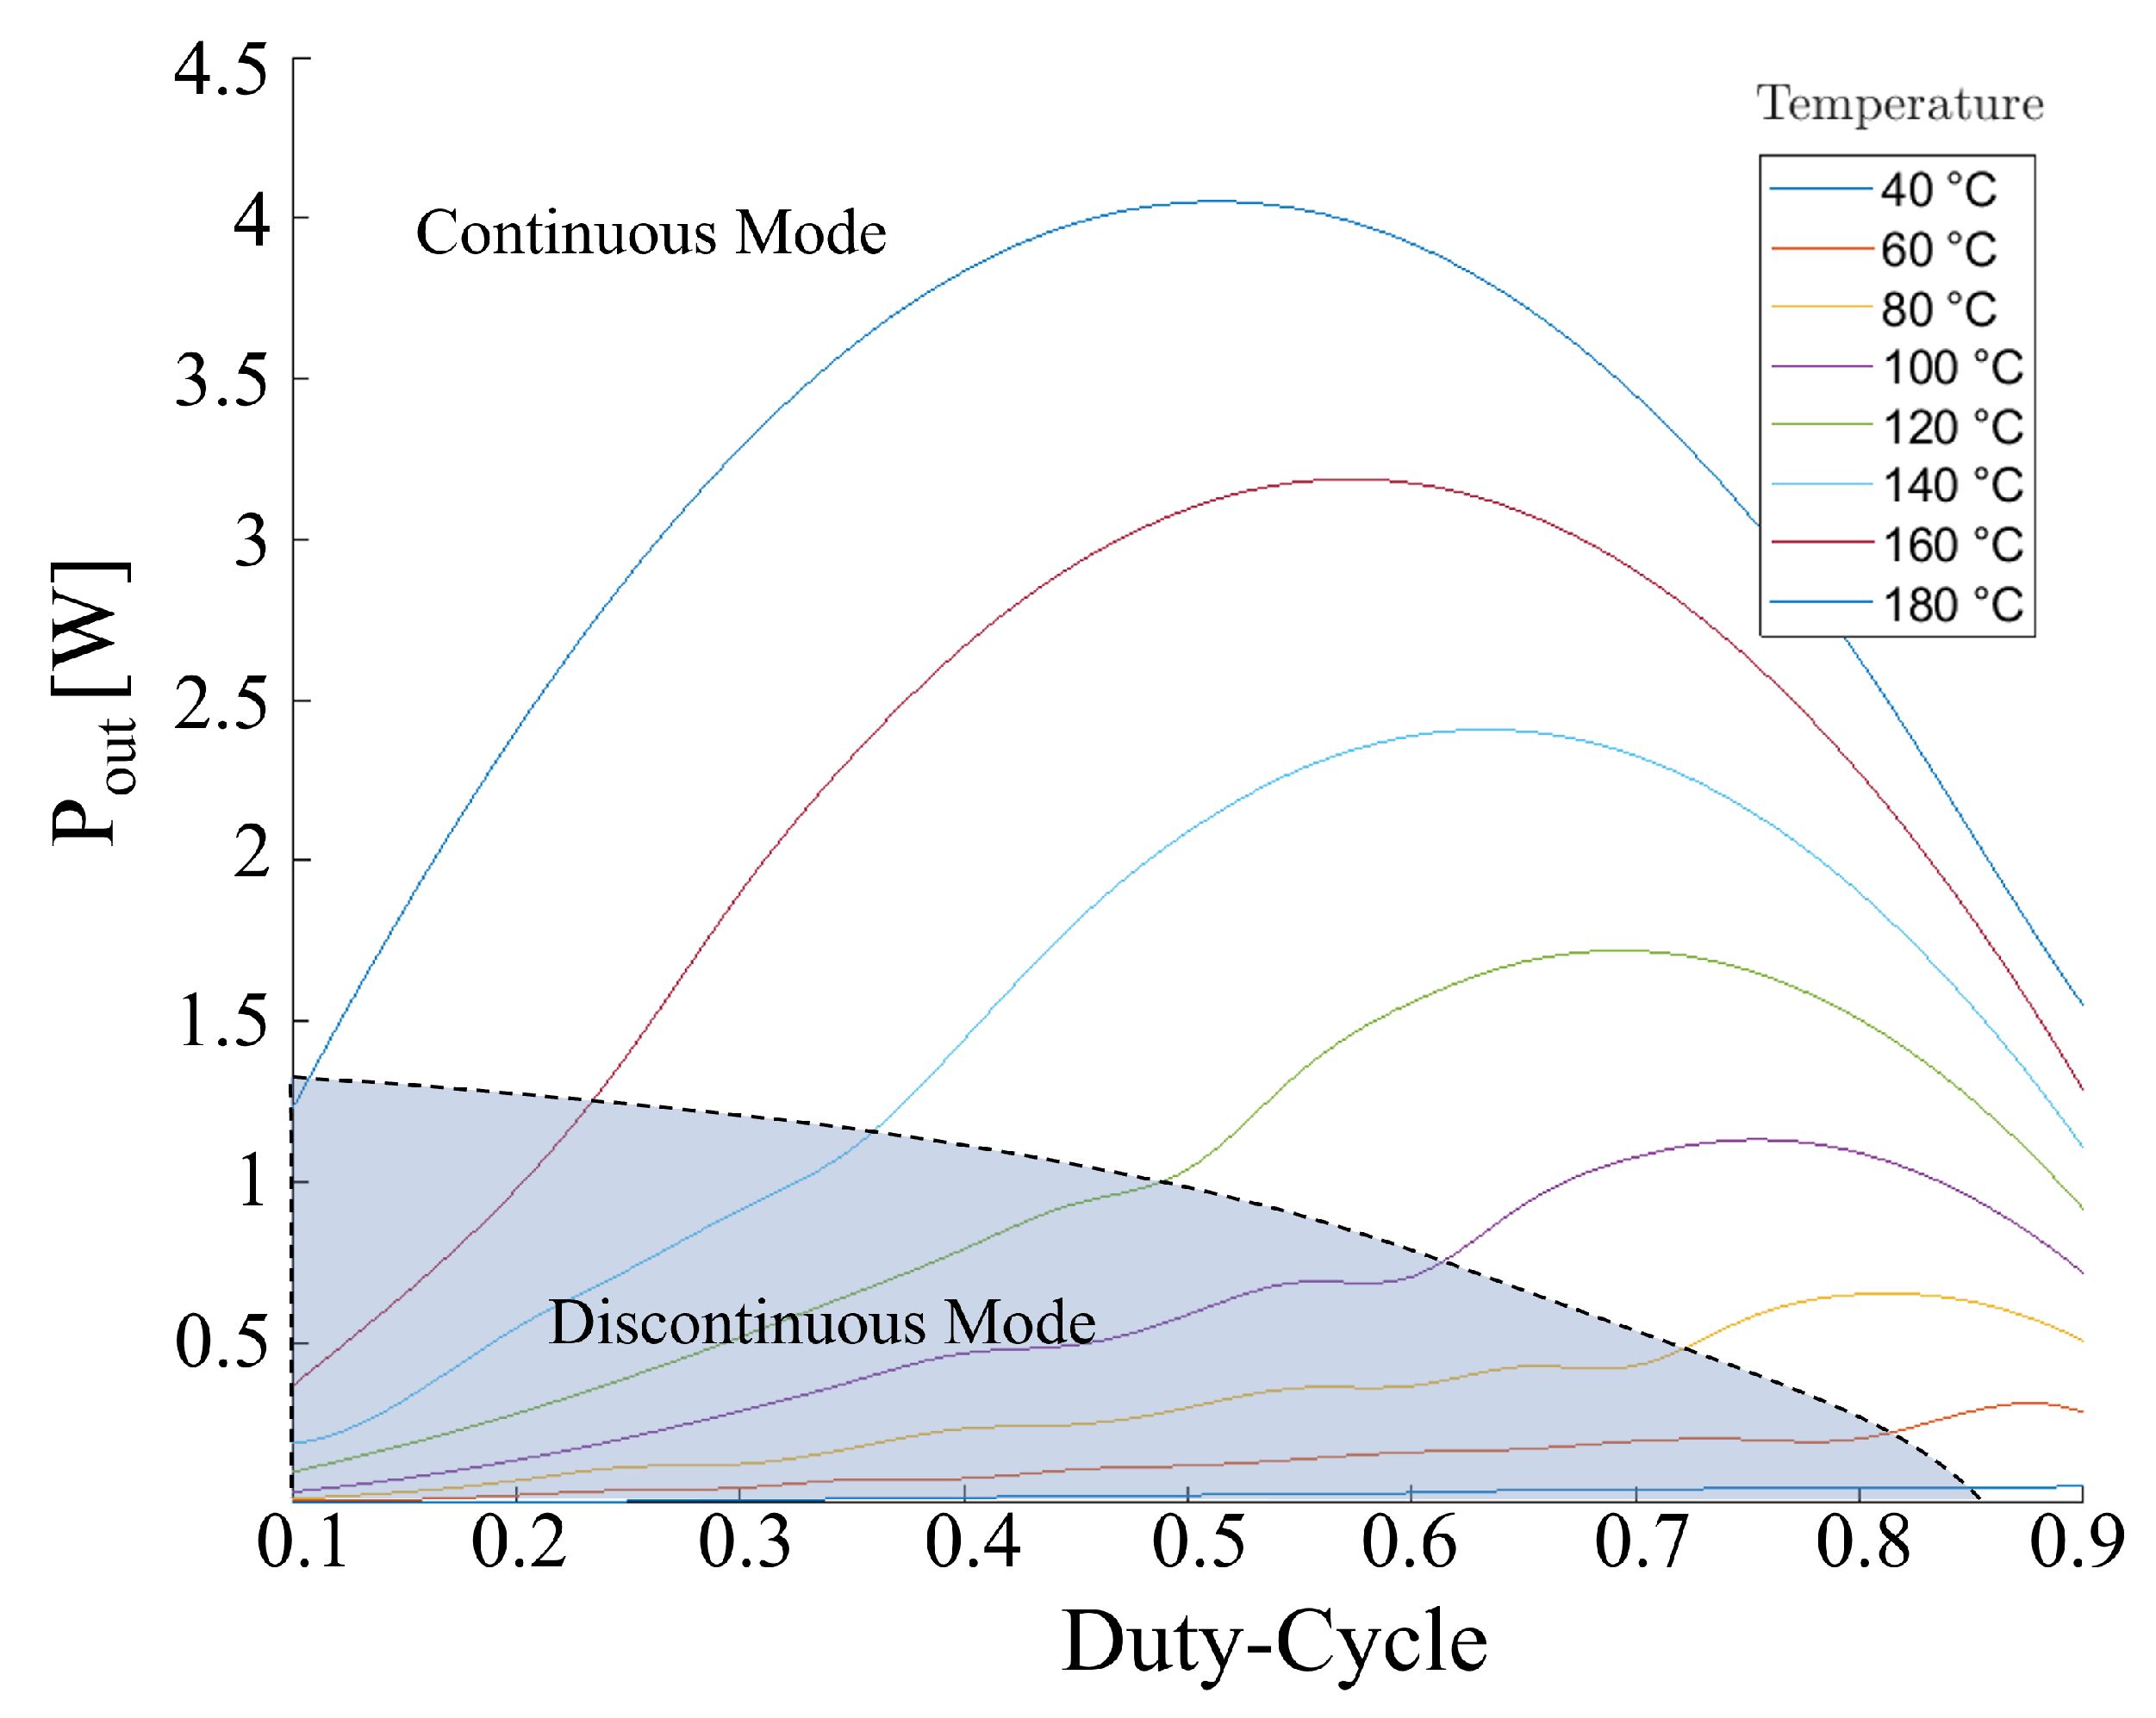
Figure 2 depicts the TEG output power as a function of the control signal duty cycle and the temperature of the TEG hot side. As expected, the duty cycle required to reach the MPP varied with temperature: the greater the temperature, the lower the duty cycle.
It should be noted that the DC/DC converter operated in discontinuous mode for some duty cycle and temperature values. However, the intent was to operate the DC/DC converter close to the MPP, which is always in the continuous mode region.
3. Control System and Algorithm
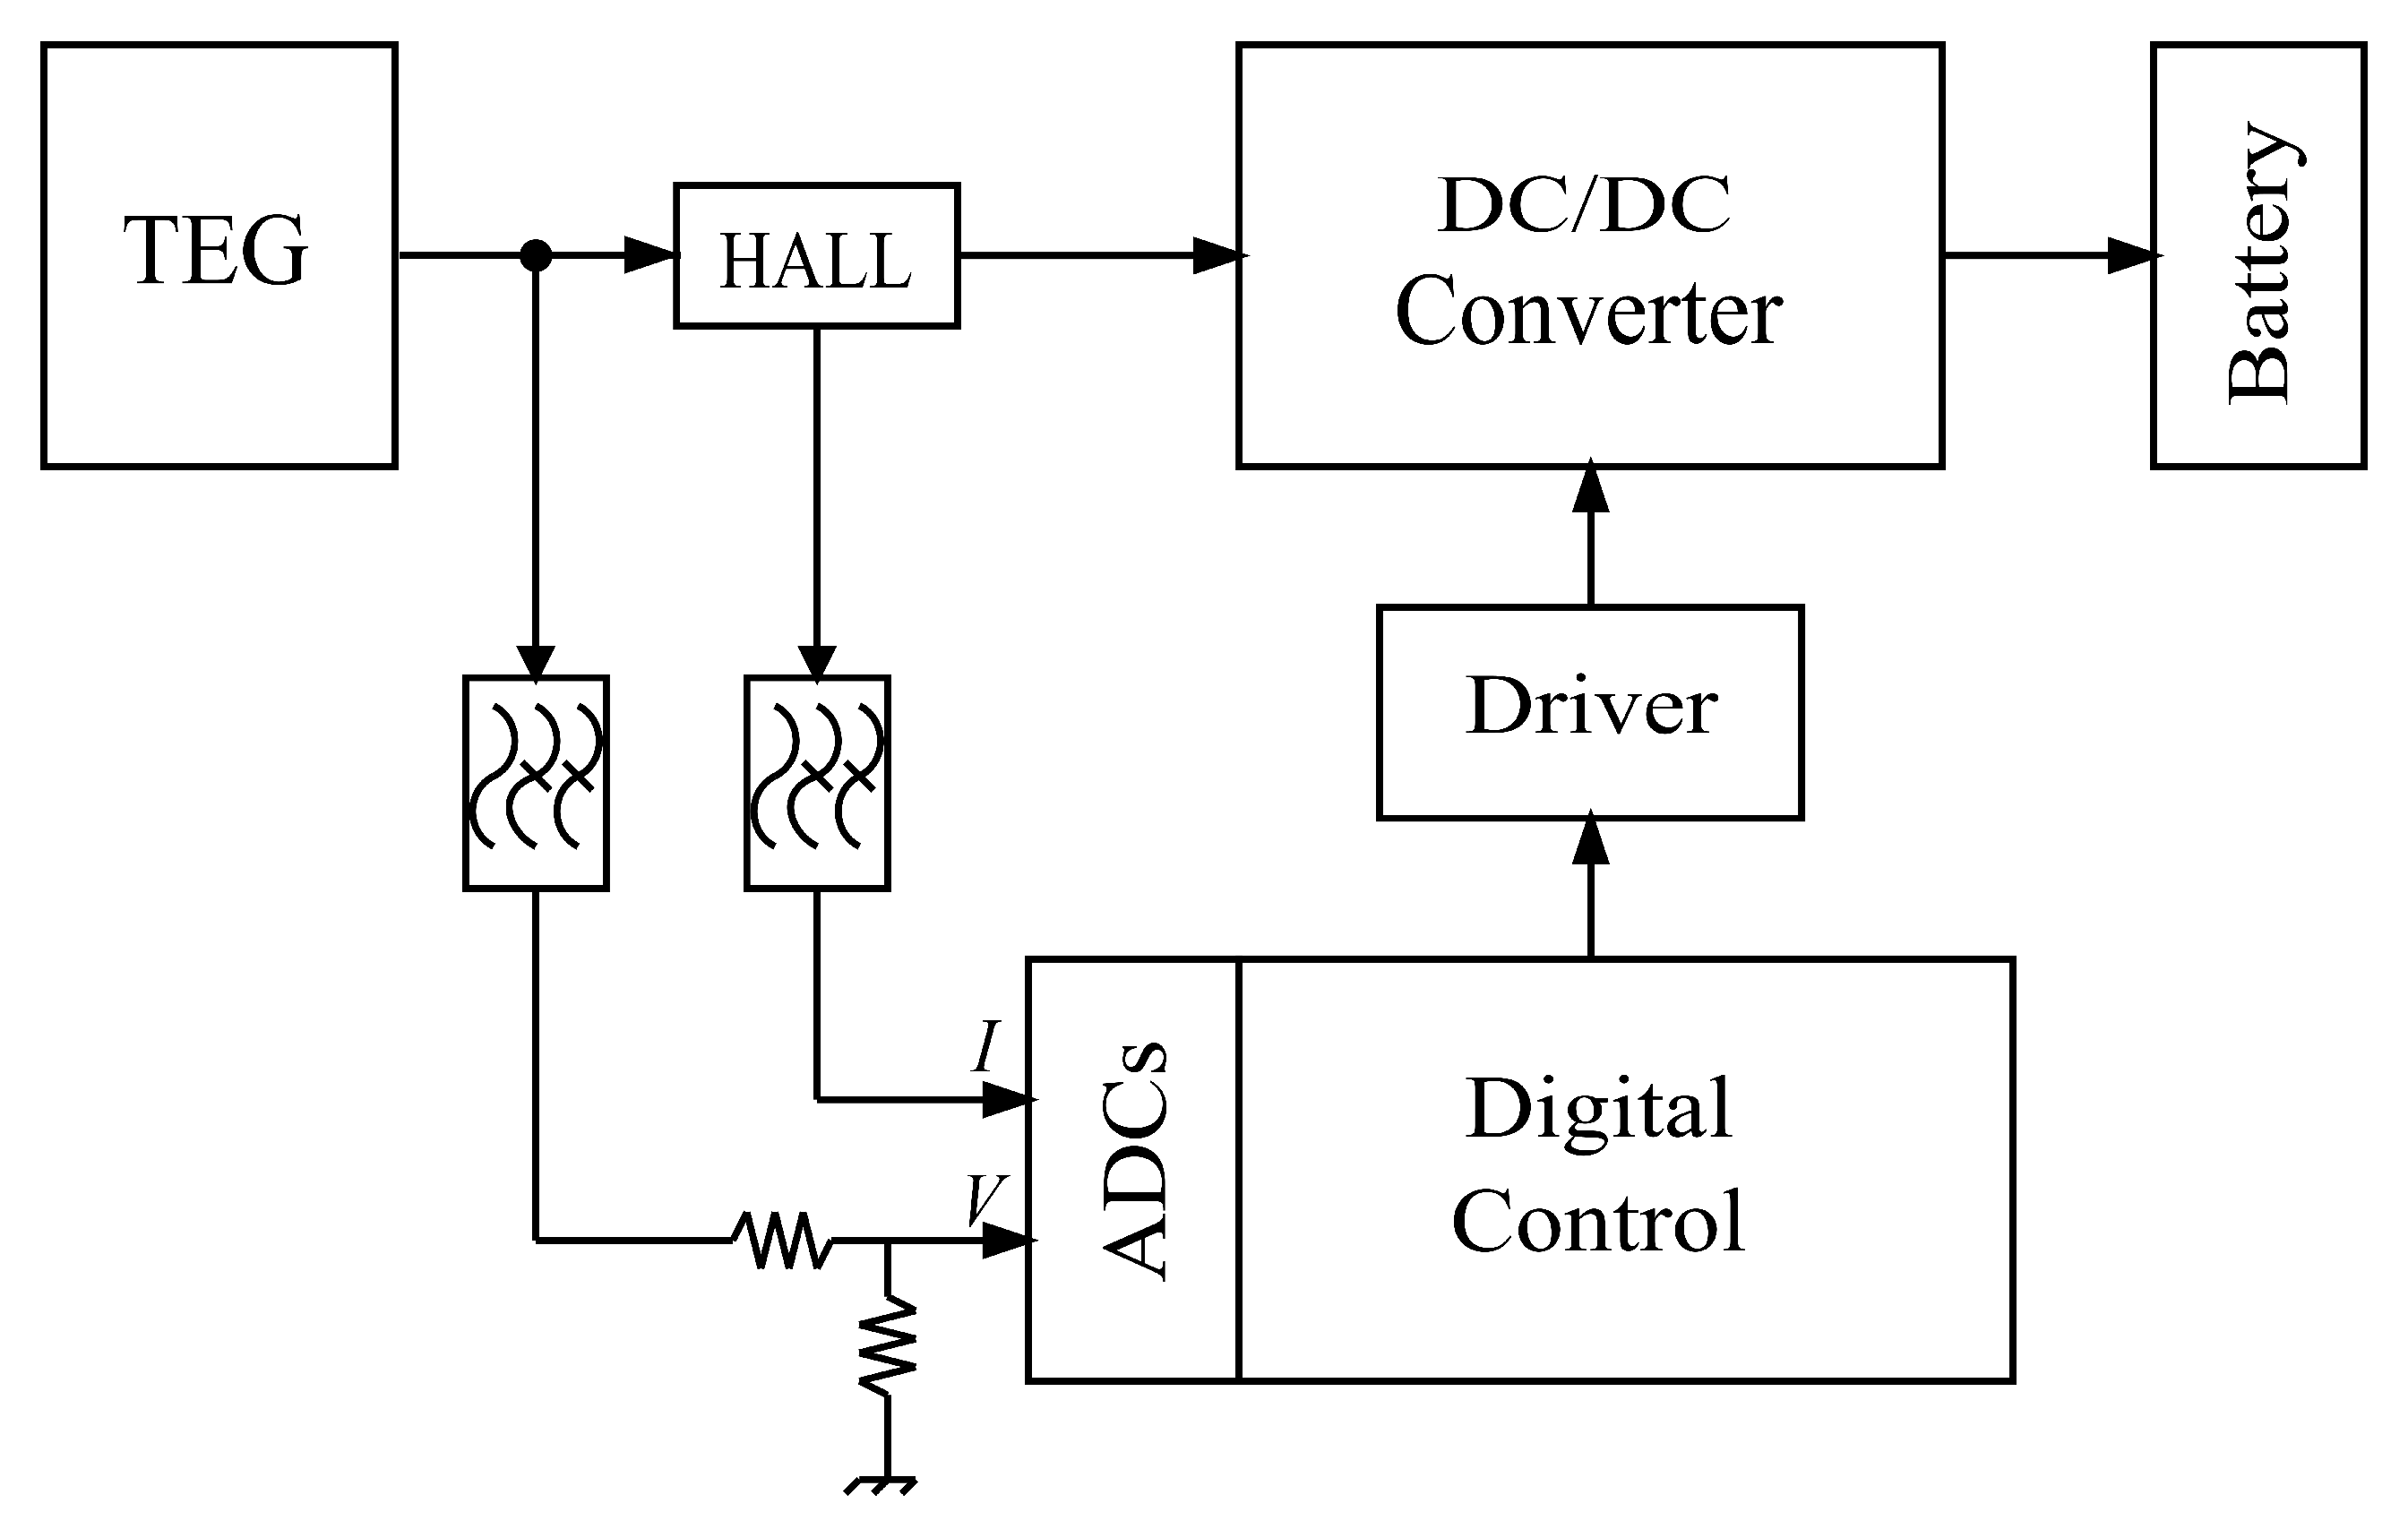
On the basis of the simulations, we assembled the system shown in
Figure 3, exploiting the opportunities offered by the model that included the whole system from the heat sources to the final storage device (battery). It consisted of the power chain with the TEG, DC/DC boost converter, and energy storage device simulated in the previous
Section 2. Furthermore, a sensing and control system was added, including a Hall effect current sensor, an analog to digital converter, a MOSFET driver, and a digital controller.
The TEG output current was measured with an ACS712 Hall effect current sensor and digitized by an MCP3008 analog-to-digital converter. Another channel of the MCP3008 was instead dedicated to the acquisition of the TEG output voltage with a direct connection. Analog filtering was implemented with two basic low-pass filters for both channels, with R and C equal to 10 kΩ and 500 nF, respectively. An additional voltage attenuator, consisting of a variable resistance partition, was also added to the voltage sensing line.
Considering the driving requirements of the N-MOSFET used as a switch in the DC/DC converter, an MCP14A0305 driver was selected to improve the driving capability of the digital controller.
The digital controller was implemented on a Raspberry Pi model b-plus. This board is able to control up to twenty-six GPIO, giving it the flexibility to manage a complex system with non-uniform temperatures, such as a burner or chimney, wherein several TEGs operating simultaneously in zones with different temperatures need adequate control and optimization. Indeed, compared to the use of several TEGs connected in series or parallel with different performances and operating at different temperatures, the optimization of each TEG led to an increase in the converter power, as shown in [
24].
In addition, the same digital controller could also optimize different energy sources working in parallel, such as TEGs and photovoltaic panels, which can then exploit the same element (battery) for energy storage.
An MPP tracking (MPPT) algorithm based on a perturb-and-observe principle was implemented in the digital controller. Specifically, it operated on the duty cycle of the DC/DC converter control signal in order to reach the maximum power transfer conditions.
This was based on the bisection principle: given an initial value D of the duty cycle, a range − around D was sampled with a suitable interval. The TEG output power was measured at each interval, and a new value of D was chosen for the maximum power. A narrower range was selected around D, and the procedure was iterated until the power difference at the limits of the range was smaller than a fixed value (5% in our case).
In the first phase, when the operating point was far from the MPP, the exploration range was wide, and the perturbation was large. This was designed to ensure that the MPP was within the range. As the operating point approached the MPP, the perturbation size was dynamically reduced to improve accuracy.
4. Experimental Verification
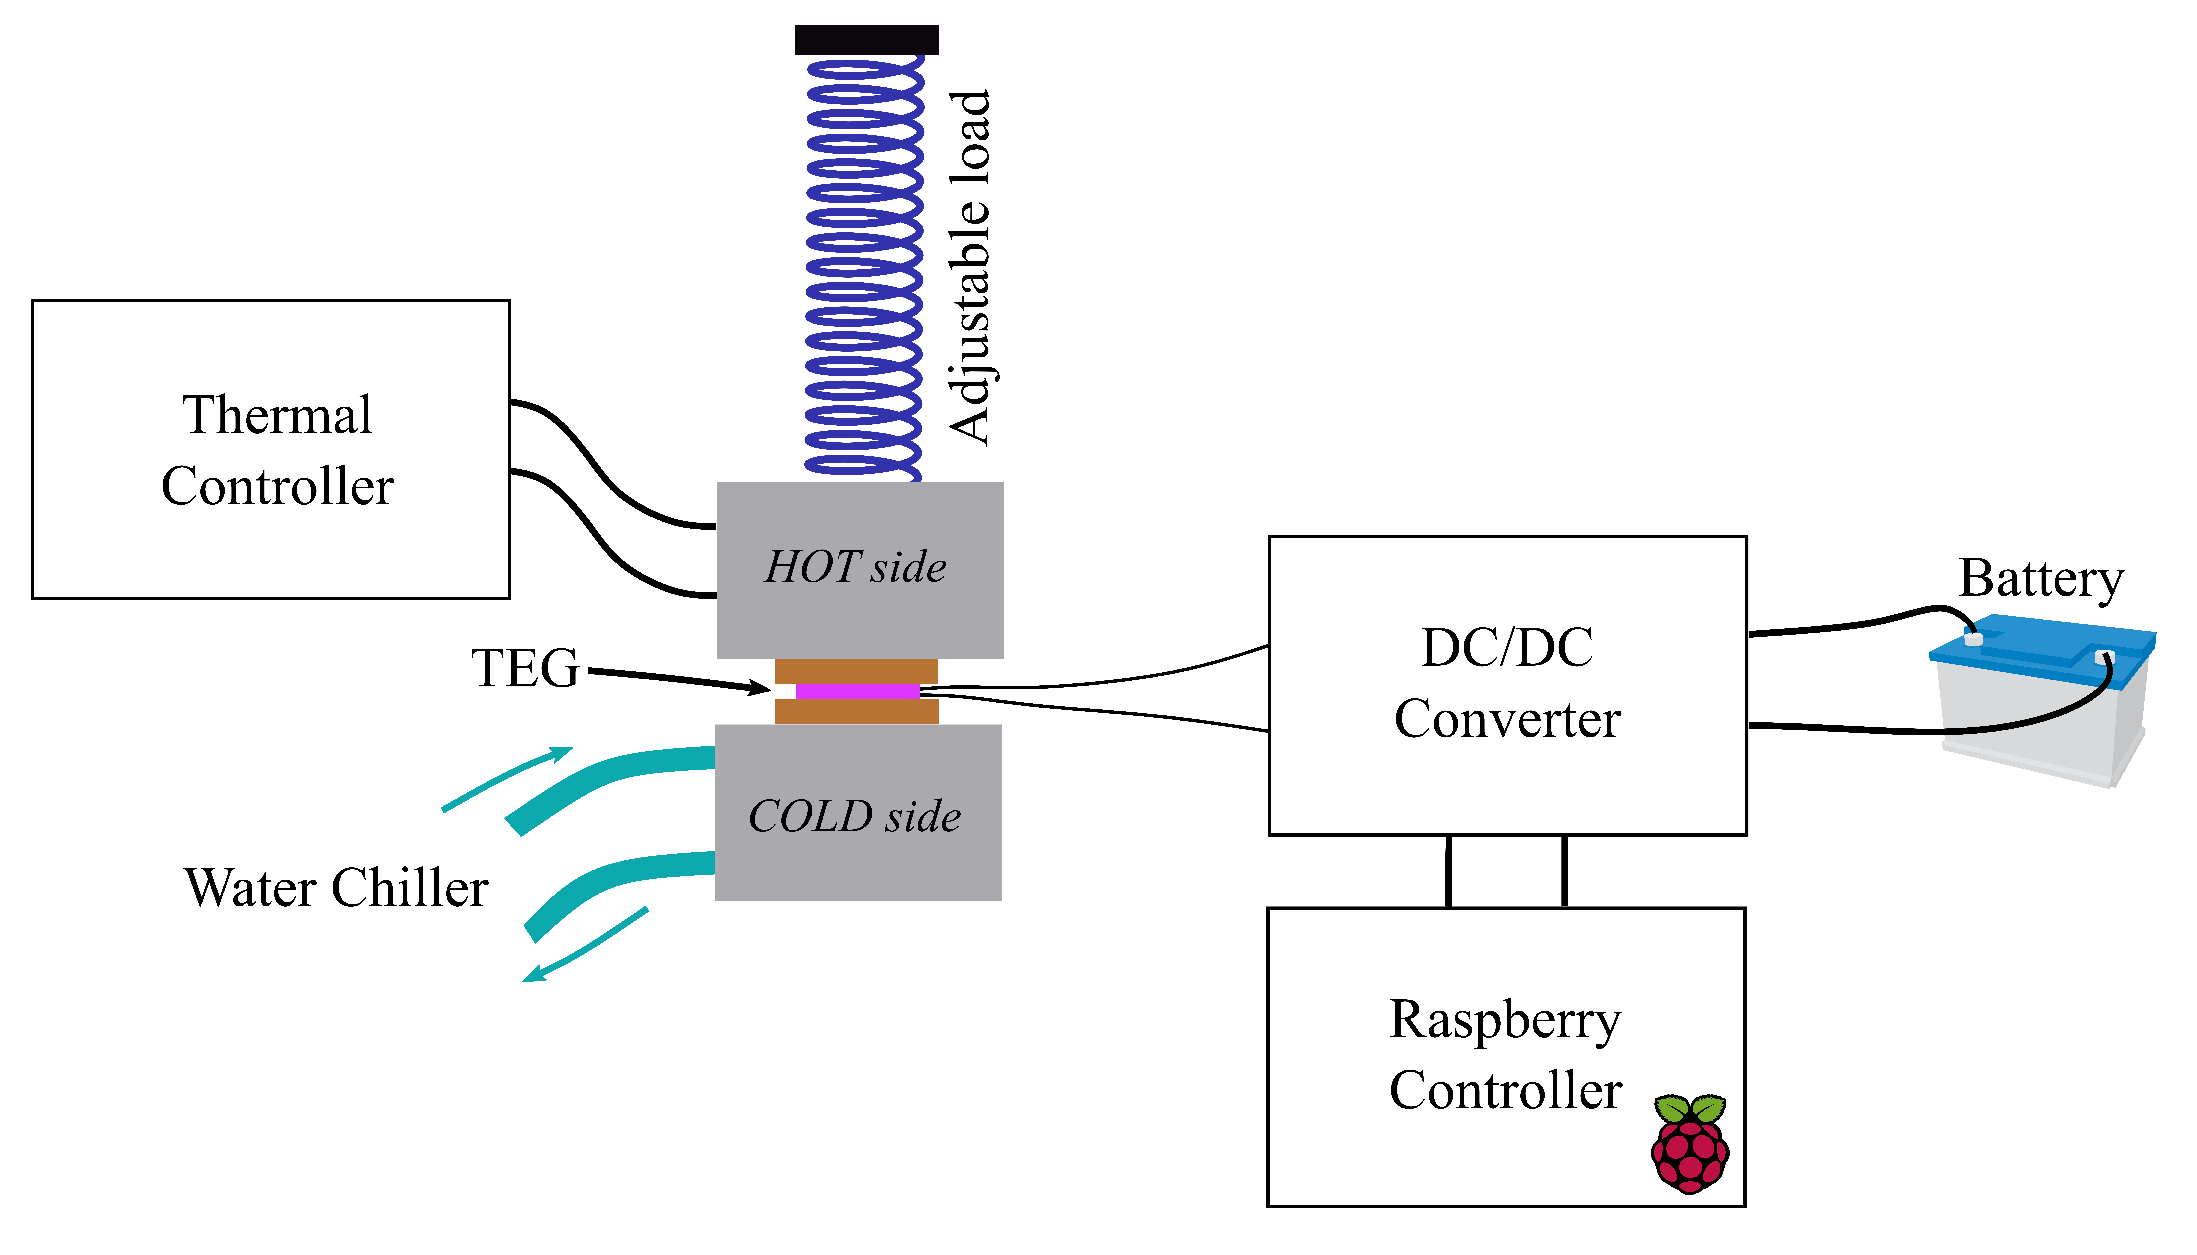
The prototype of this circuit was tested on a
mm
2 commercial TEG, inserted into a characterization system consisting of two aluminum plates. One plate was maintained at an adjustable hot temperature by an electronic heater whose power could be controlled and accurately measured; the other was cooled with water at 16 °C (see
Figure 4). The temperatures were measured by means of Pt100 sensors (three for each plate). The plates were much larger than the TEG, so that, as demonstrated in a previous paper [
25], the measured temperatures were very close (within one degree) to those on the faces of the TEG.
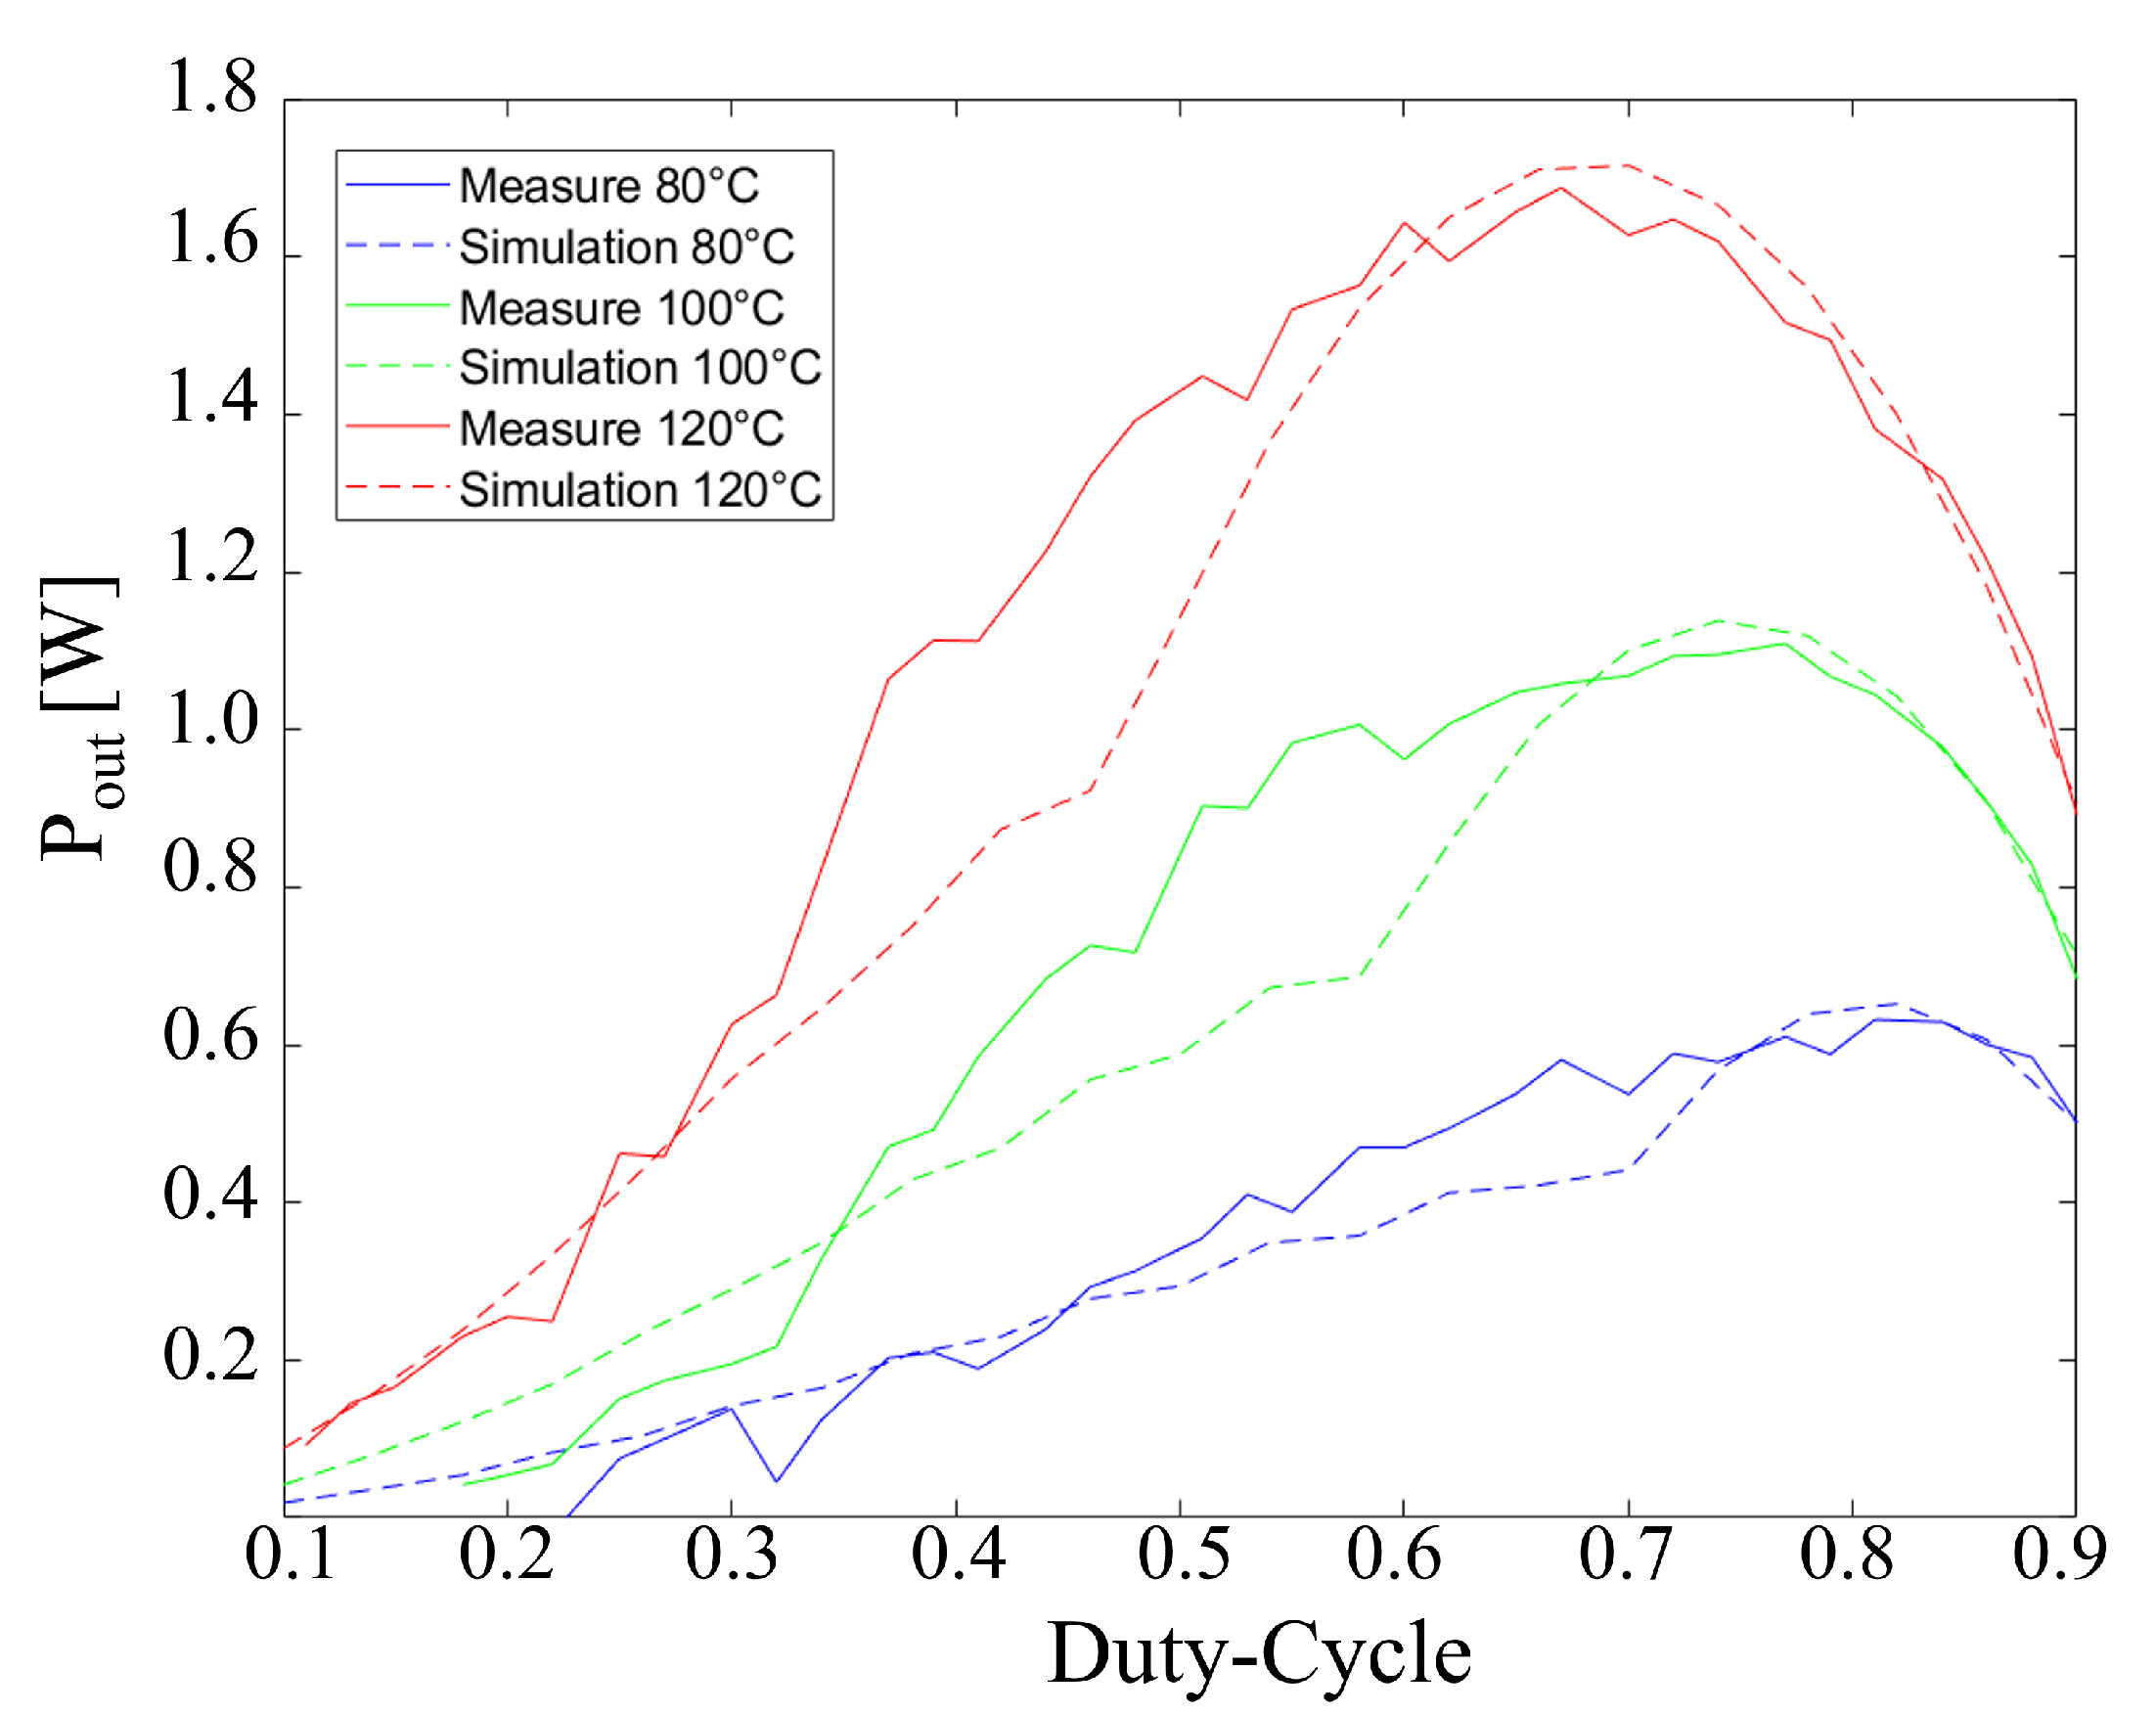
Figure 5 shows the comparison between the experimental and simulation results of the output power from the TEG as a function of the duty cycle for different
temperatures. In particular, good agreement could be seen between the measurement and the simulation results. Furthermore, as expected, when the TEG power increased, the TEG output power also increased, and the MPP was achievable with lower duty cycle values.
Table 1 lists the measured system conditions at the MPPs. The duty cycle, input and output power, and conversion efficiency of the DC/DC converter are reported for
temperatures equal to 80 °C, 100 °C, and 120 °C.
After the experimental verification of the equivalent model developed in LTSPICE and reported in
Figure 1, the MPP tracking algorithm discussed in
Section 3 was applied to the DC/DC converter.
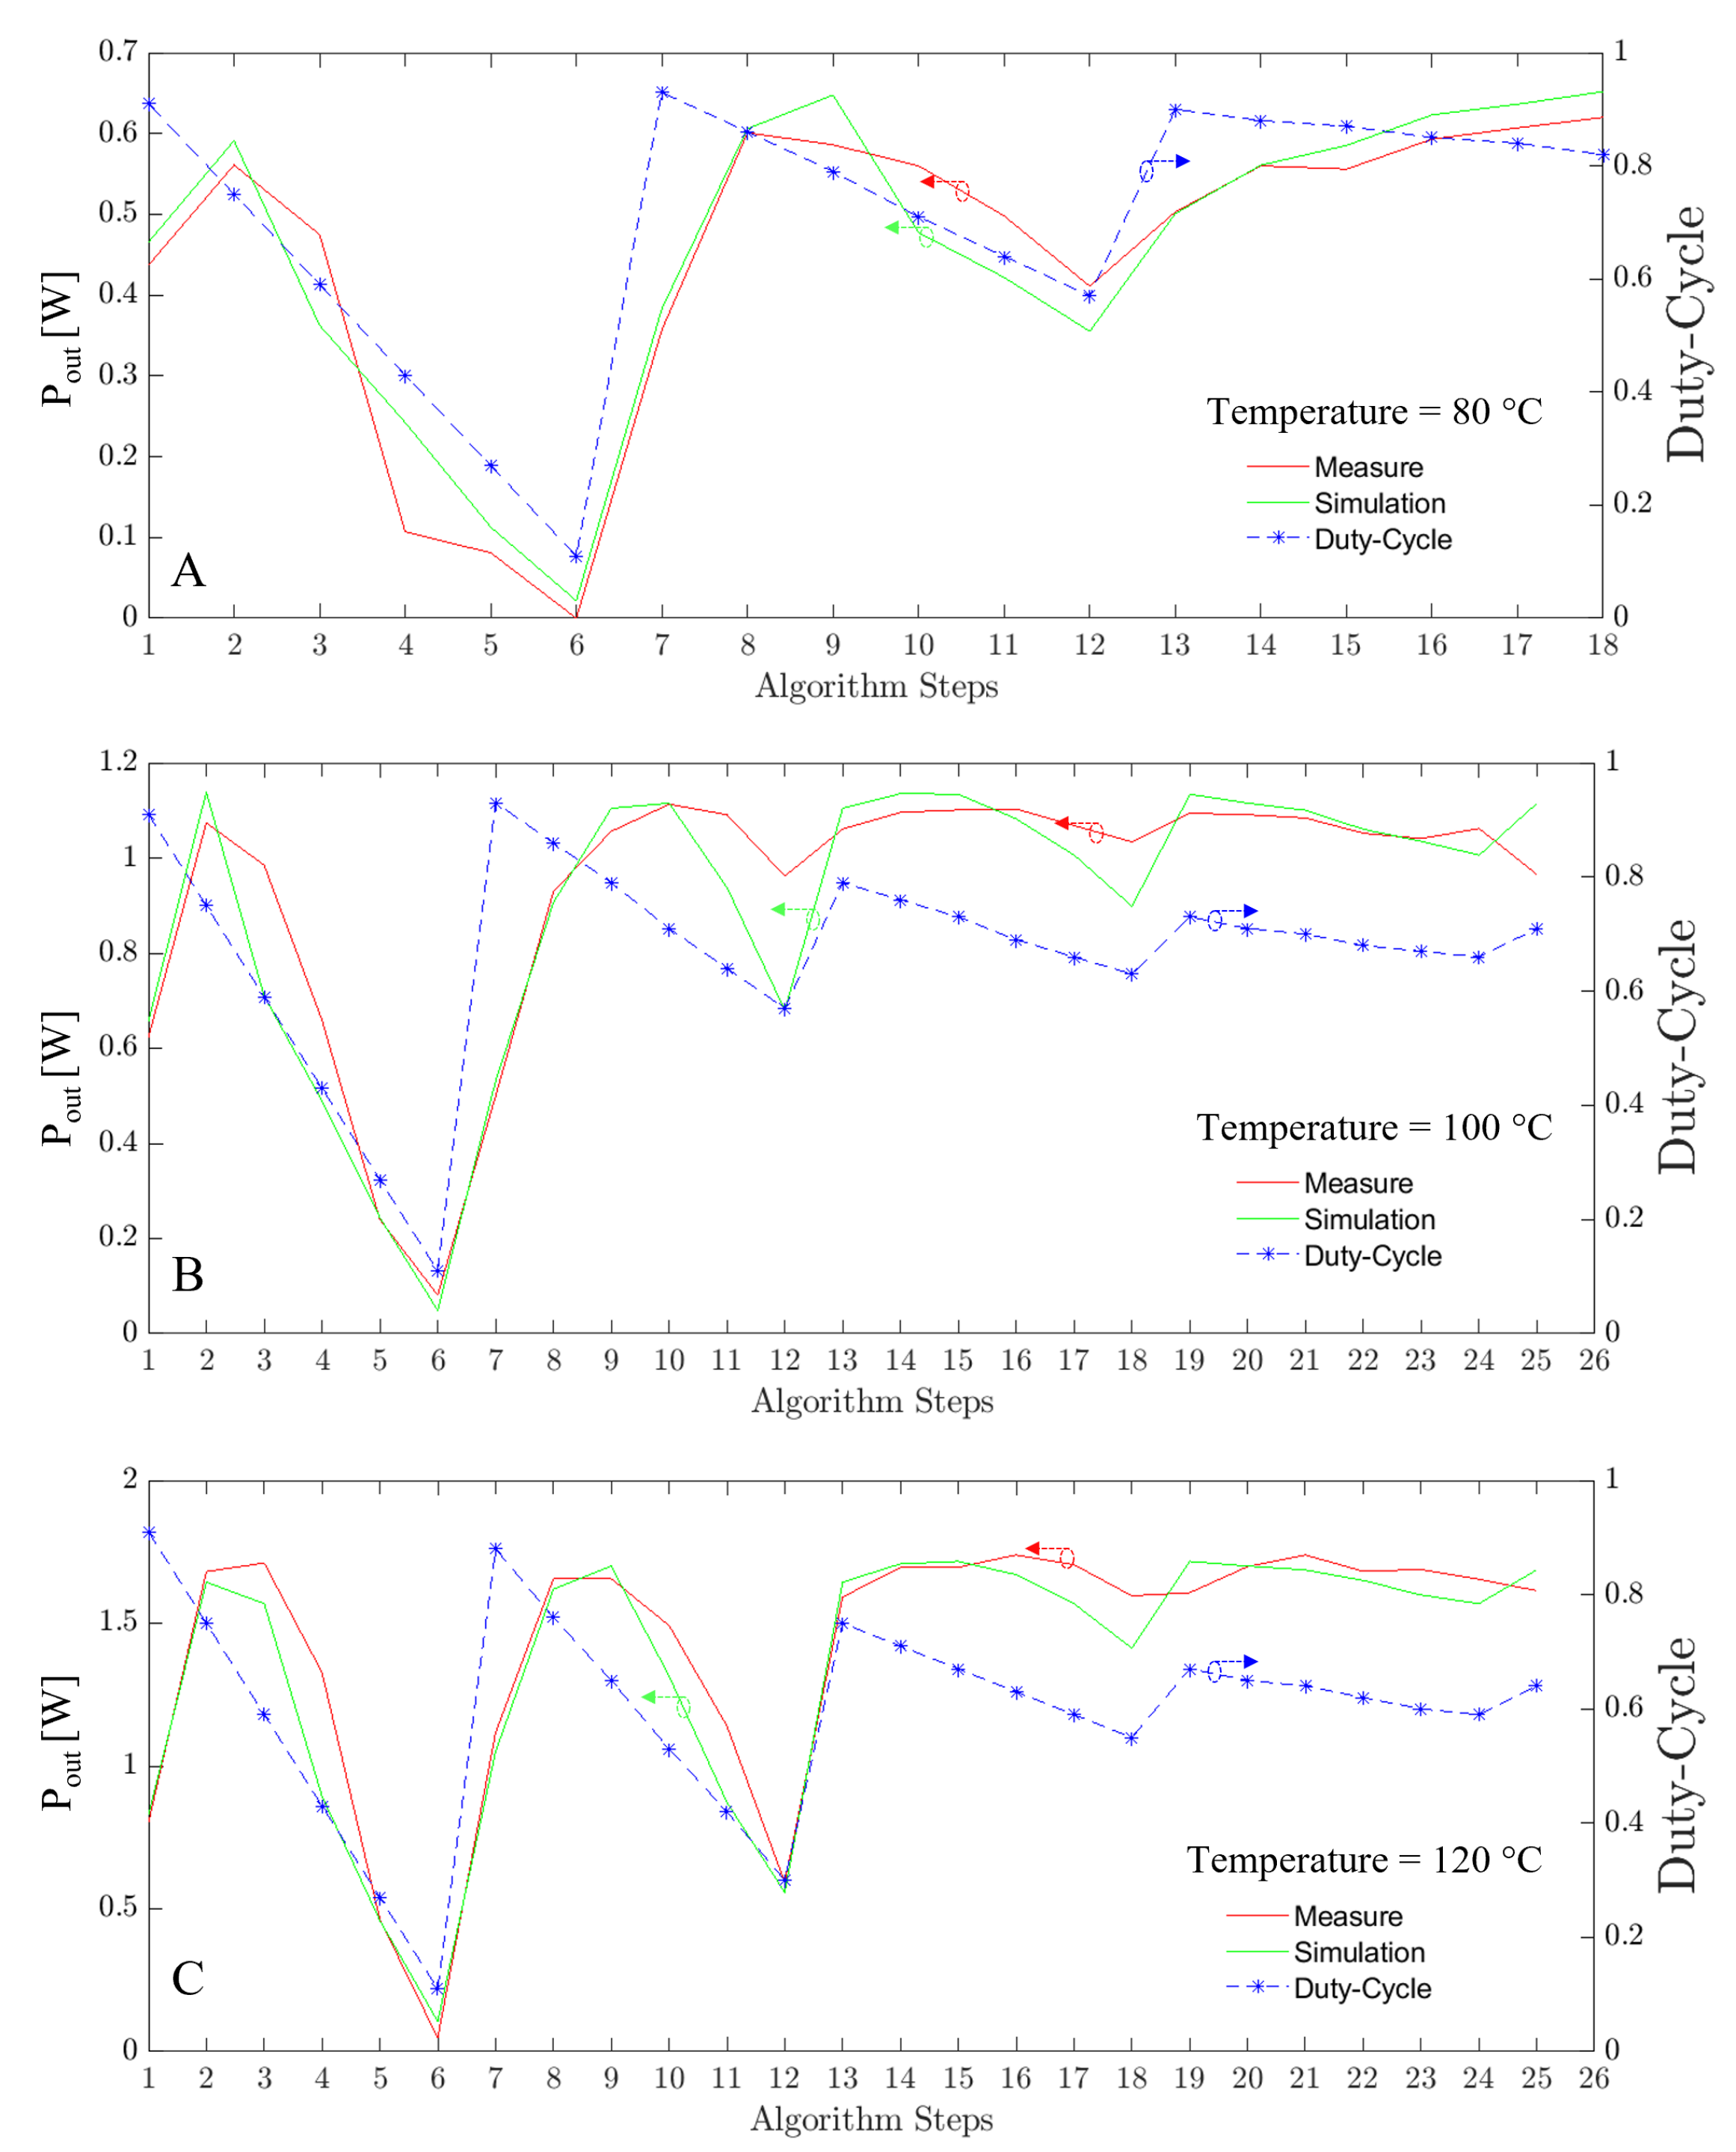
Figure 6 shows the TEG output power for each step of the proposed algorithm for three different
temperatures: 80 °C, 100 °C, and 120 °C. Results from both simulations and measurements are presented for comparison.
In the first phase, the duty cycle swept through the whole range between 0.1 and 0.9 with six steps (dotted blue curve), and the TEG output power was measured. Then, a narrower duty cycle interval around the maximum value of the TEG output power was selected, and the procedure was repeated.
It must be noted that the whole duty cycle range was covered in the first period, even though it has been well-established in the literature that the MPP of TEG-based systems is around 50–70% of the open-circuit voltage of a TEG. Therefore, a lower duty cycle range could be chosen for the first step, such as 50–80% of the interval. However, considering that the aim of this work was to demonstrate the effectiveness and accuracy of the proposed method for predicting the parameters of the whole system, an extended duty cycle range was used. This allowed us to verify the system operation even in extreme cases. In fact, by using the extended duty cycle range between 0.1 and 0.9, we verified the satisfactory agreement between the simulation and measurement results under conditions in which the DC/DC converter operated in discontinuous mode.
As a result of this choice, quite a large number of steps were required to reach the MPP. Considering that the response time of a thermal system is in general quite slow, a waiting period of several seconds (30 s in our case) was necessary for each adjustment of the duty cycle to allow the thermal stabilization of the system. Hence, the initial phase of the algorithm lasted quite a long time. The MPP was achieved in around 15 min.
5. Conclusions
We presented the design and implementation of a system for direct heat to electrical power conversion, exploiting a circuit model that took into account all the relevant aspects, from the thermal generation and exchange through the thermoelectric generator to the performance of the DC/DC converter and the energy storage with a battery.
In contrast to the state-of-the-art TEG models, the adopted model also allowed us to consider the effects that the electrical parameters had on the thermal flux. This method, exploiting the same electrical simulators used for the design of the DC/DC converter, did not require additional software. In addition, modeling the thermal and electrical elements as basic components and using basic simulations enabled the use of open-source software, such as LTSPICE. By estimating the current and voltage in the system, the proposed method reduced the cost of the electrical devices, avoiding their overestimation.
On the basis of the model, a DC/DC boost converter circuit was designed using a low-cost four-element configuration.
Considering the simulation results of the thermoelectric model for increasing the temperature of the TEG hot side, an increase in the electrical power at the TEG output was observed, as expected. In addition, the MPP changed for different TEG hot side temperatures. Therefore, an automatic MPP tracking algorithm was developed, and its ability to achieve the MPP was tested with the LTSPICE.
The system designed herein was manufactured on a custom printable circuit board and tested with a commercial TEG. The MPP tracking algorithm was implemented on a Raspberry Pi board and experimentally tested. The testing results showed good agreement between the measured and simulated results. In order to reduce the system cost, after the MPPT algorithm was validated, it could be implemented on a simpler and less expensive platform.
The use of a general-purpose commercial board for the digital controller enabled us to control and optimize several DC/DC converters connected to the output of TEGs operating with different temperature conditions and/or other energy conversion systems, such as a photovoltaic panel. Hence, the developed system was very flexible and could be used to run a small plant for energy recovery and storage.
As a future development, considering the good agreement between the simulations and experimental results, we will exploit the circuit model for the direct implementation of more efficient MPP tracking algorithms on the simulator before experiments, saving time and reducing development costs.


 ,
, 


