Abstract
In this paper, we propose an improved K_shell algorithm for identifying the key nodes of a power grid. This method is improved on the basis of the original Ks value calculation with the degree as the index. The electrical characteristics in the power grid are weighted to the network measure and then added as the new Ks value. The new key nodes are selected by iteratively refreshing the network. Additionally, combined with an entropy weight method, the comprehensive weights of the above indicators are reported from objective viewpoints to obtain key nodes of the power grid. Then, an IEEE 39-bus system is used for simulation. The results show that the key nodes can be identified more accurately by comprehensively considering the structural and electrical characteristics of the power grid by establishing multidimensional indicators and comparing the results with those of other studies. Finally, taking full account of the electrical information of the grid node and its neighboring nodes, a reasonable load redistribution strategy for faulty nodes is formulated, which more effectively reflects the grid performance by comparing it with the Thiel entropy method and the maximum flow method in the literature. The results show that the proposed method improves the influences of key nodes on the grid load by 5.6%, and improves the network efficiency by 15.7%.
1. Introduction
Due to its access to new energy, the stability and reliability of the power grid are greatly challenged [1,2]. At the same time, the super-scale expansion of the network means that the power grid system shows the characteristics of a complex network. The safe and stable operation of the power system is closely related to the national economy, human lives, and the development of the national energy, science and technology industries [3,4,5]. Therefore, ensuring the security of the power system and enhancing its robustness [6,7,8,9,10,11] are two key issues that must be studied comprehensively. Identifying and protecting the key nodes of the power grid are the most effective protection methods for the existing power grid [12,13,14,15]. A key node is a node that has a greater impact on the whole system than other nodes throughout the network system if it fails or is removed [16,17,18,19]. According to the existing research, when a key node in the power system fails, it usually causes a series of cascading system failures, leading to the occurrence of large-scale power outages [19,20,21,22,23]. To date, the methods used to identify the key nodes of the power grid have been divided into two categories: identifying the key nodes based on the structure and operation characteristics of the power system, and establishing a number of evaluation indicators based on complex network theory by combining the electrical and operation characteristics of the power system to identify the key nodes in the power system with higher accuracy. The method for identifying the key nodes of the power grid mentioned in [24] involves an alternating current (AC) power flow model based on the power grid’s operation; this method proposes an indicator of node electrical centrality to measure the critical degrees of the nodes. However, because the single measurement method only reflects the importance of the grid nodes in terms of a certain characteristic in a one-sided manner, it cannot explain the key nodes in the overall evaluation of the power grid. A new idea was proposed in [25]. Fully considering the node’s own attributes and its local neighbor node’s information, combined with the entropy method, improved the traditional K_shell algorithm, and finally, the set of key nodes of the power grid was obtained. Because it does not combine the indicators that involve electrical characteristics, the algorithm only verifies the key roles of the nodes in the network in terms of the spatial structure.
This paper improves the K_shell algorithm. The kernel value index, which can only be calculated discretely, is continuous, a new meaning of the Ks value is proposed, and the electrical characteristics are weighted to obtain an index with electrical characteristics, which includes the degrees, intermediate numbers, and aggregation coefficients with electrical characteristics. By objectively weighting the above three indicators, we can finally obtain the Ks value ranking, which is the ranking of the key nodes. By comparing the network performance indicators calculated after the implementation and failure, we can find the impact of the key nodes found by different methods on the network. The comparative experiments can reflect the advantages of this method.
2. Application of Complex Network Theory in Power Grids
2.1. Establishment of a Complex Network Topology
A complex network is usually composed of nodes and edges, in which the basic elements of the networks are connected with each other; complex networks describe the relationships between elements, and the weight of an edge reflects its importance.
According to complex network theory, the power grid is divided into a directed weighted graph . Suppose that grid G is composed of n nodes and m lines, where V represents the set of nodes in the grid topology () and E represents the set of edges in the grid topology (). If two points, i and j, in the grid are connected, ; if there is no connection between two points, , where . The current in the power grid is taken as the weight value of the node.
2.2. Measurement of a Complex Network in a Power Grid
In a directed weighted network, the degree of a node refers to the sum of the weights of all other nodes connected to the node in the network multiplied by the weights of their edges. It can also be recorded as the sum of the weights of all edges connected to the node. In the power network, the weight of an edge is the current value.
Therefore, the node degree in the power network is:
where is the weight of admission and is the adjacency matrix element (if nodes and are not connected, then ; if there is a connection, then ). is nodes and . The weight of side j is the current value between power stations.
The aggregation coefficient is a comprehensive reflection of the node degree center and tightness and reflects the importance of nodes to the overall connectivity of the network and the centrality of the node location in the network topology. Its expression is given by Equation (2):
Aggregation coefficient:
is the aggregation coefficient, represents node with a degree of i, and represents the normalized weight. The calculation method of and is similar to that of .
We set node v before calculating the aggregation coefficient. The adjacent nodes of i are divided into inbound and outbound groups, and then the weighted aggregation coefficient formula is used to calculate the inbound and outbound aggregation coefficients.
The aggregation coefficient defined by Onnela is used for calculation because the size of the aggregation coefficient defined by Barrt is only the same as that of the triangle connection node v. The two side weights of i are related, and the size of the latter’s agglomeration coefficient is related to the three side weights, so the calculation result of the latter is better than that of the former.
In complex network theory, the node medium is used to represent the degree of the influence of a node in the network on the overall network connectivity. The medium of a single node mainly depends on the number of times that all the shortest paths or the most effective paths in the network system pass through the node. Therefore, in the electrical network, the path between points is reflected by the current. Therefore, the node medium with electrical characteristics is defined as follows:
Number of nodes:
represents the slave node to . For i shortest paths, represents the slave node to . The number of shortest paths through node is i.
The intermediate nodes are used to measure the number of shortest paths through a node or an edge in the network. The meaning of the shortest path in a weighted network is different from that in an unauthorized network. It refers to one or several paths where the sum of different weights (the sum of the reciprocal values of similar weights) is the smallest among all the connected paths between two points. According to their meaning, border weights can be divided into dissimilarity weights and similarity weights. For a dissimilarity weight, the greater the weight is, the greater the distance between the two points is, and the more distant the relationship is. For the similarity weight, the greater the weight is, the smaller the distance between the two points is, and the closer the relationship is. If we use the current as the edge weight, this edge weight is a similarity weight. Therefore, when calculating the shortest path, we need to use the reciprocal of the current.
3. Improved Ks Algorithm
3.1. K_shell Method
The K_shell node is at the core of the network; even if the degree is small, it has a high influence on the network. The K_shell peels the outer nodes in a layer-by-layer manner and determines the nodes with high influences in the inner layers, which can be sorted in a coarse-grained manner based on the node degree. In Step 1, the nodes with a degree of 1 from the outer layer are found, and then the adjacent edges are removed. A new node with a degree of 1 is generated in the graph. The removal steps are repeated until there is no node with a degree of 1. Step 2 removes the nodes with a degree of 2 from the graph obtained in the above steps until there are no remaining nodes, and Ks = 2. The process of filtering core nodes is shown in Figure 1.
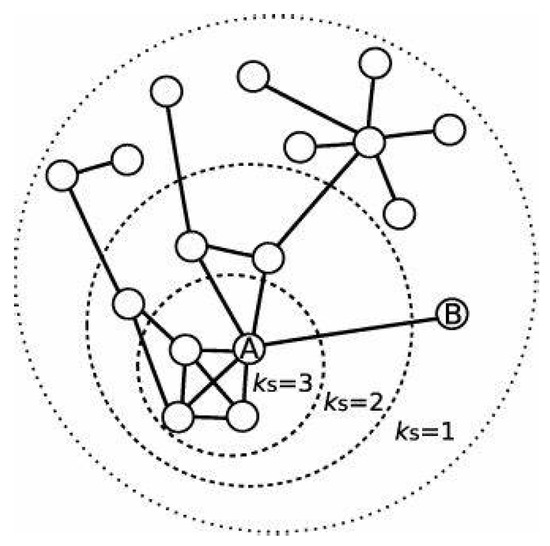
Figure 1.
K_shell algorithm for finding the core nodes.
3.2. Improved Ks Method
The traditional K_shell algorithm is a graph theory algorithm based on the degree of the nodes, which reflects the core degree of nodes in the whole network. Compared with many other key node sorting algorithms, such as the PageRank algorithm and TOPSIS algorithm, the advantage of the K_shell algorithm is that it fully considers the connection between nodes and can reflect the impact of removing nodes on the whole network in the process of gradual layering. However, in the practical application scenario of a power system, the traditional K_shell algorithm has some limitations. The greatest limitation of the algorithm is that most nodes may obtain the same core value. The algorithm also only considers the topology characteristics of the network, and there is no way to take into account the electrical operation characteristics of the grid. Therefore, on the basis of the above multidimensional indicators, this section defines a new node core value calculation method and proposes an interval division method. The shell algorithm is improved. The main steps are as follows:
Step 1: In Section 3, based on the entropy weight method, the comprehensive weight vector of each index is obtained, from which a new formula for calculating the node core value can be defined:
where is the degree of node i, is the aggregation coefficient of the node, and is the electrical permittivity of the node.
The defined Ks value is calculated as follows:
Step 2: The core value of each node is calculated, all the core values are divided according to the reasonable difference zone (), the core values that belong to the minimum interval are removed, and the topology and electrical information of the whole network are updated. The remaining subgraph recalculates the core value of each node. If the subgraph retains the nodes belonging to in the interval, these nodes are continuously deleted, the topology and electrical information of the network are updated simultaneously, and the last subgraph is determined. The core values of all nodes in 1 are not in the interval ; the deleted nodes belong to the set S(1).
Step 3: Similar to Step 1, we delete the core values of all nodes in the interval and synchronously update the network information, where . Finally, we obtain the subgraph . The kernel values of all nodes in the subgraph are greater than the interval value within .
Step 4: The above steps are repeated until all the nodes’ core values are at a maximum interval. The nodes with core values belonging to the interval are the set of key nodes in the network system.
An algorithm flow chart is shown below in Figure 2:
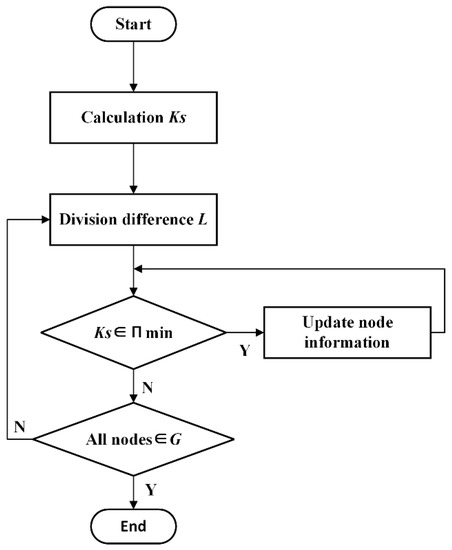
Figure 2.
Flow chart of the improved K_shell algorithm.
4. An Improved K_shell Algorithm for the Identification of Key Nodes in a Power Grid
4.1. Entropy Weight Method
The entropy weight method is a classic objective weighting method. Based on entropy theory, this method calculates the weight value of each index according to the actual value. The specific steps are as follows. The original evaluation data matrix is established, as shown below:
where ij is the value of the jth index of the ith evaluation object, m is the total number of evaluation objects, and n is the total number of evaluation indicators.
The indicators are normalized. The heterogeneous indicators are dimensionalized to obtain standard indicators ω with the following formula:
where max and min represent the maximum and minimum values of the jth index of all evaluation objects, respectively, and they satisfy 0 < ω < 1. The weight of each indicator is calculated. The weights are calculated by simultaneous equations.
Since this paper involves three measures, we calculate the weight of the degree, intermediate number, and aggregation coefficient. The weights are on the order of φ1, φ2 and φ3.
4.2. Evaluation of Key Indicators
First, the Ks values are calculated according to the method of Section 3.2, and the calculated Ks values are sorted to obtain the node sequence ranking at the top. Various indicators of the grid are obtained after node failure by deleting nodes to study the importance of the nodes in the grid. Among the indicators, the connectivity indicators are described as follows:
where N′ is the number of nodes in the most connected subgraph after node i is removed from the grid and N is the number of nodes in the most connected subgraph before grid failure.
The network efficiency is as follows:
where is the shortest distance from i to j.
The formula of the network loss load is as follows:
where is the loss load value and Pi is the node load value.
5. Example Description
5.1. IEEE 39-Node System
In this paper, the IEEE 39-bus system is used to verify the importance of nodes. The system contains 39 nodes, including 10 generators (nodes 30–39, of which node 39 is the only slack node in the system) and 12 transformers. It will also be compared with the methods in [26,27] to demonstrate the feasibility of the methods proposed in this paper. The IEEE-39 system node diagram and topology diagram are shown in Figure 3. The specific experimental environment includes MATLAB 2020a and Gephi.
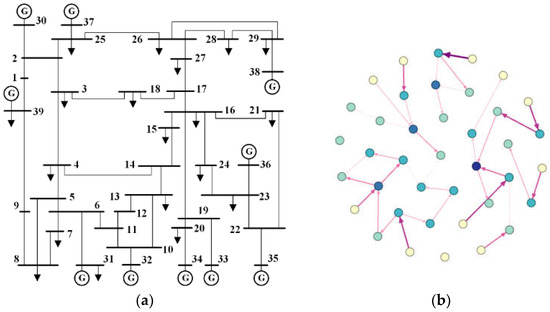
Figure 3.
IEEE 39-node system: (a) IEEE 39-node system diagram and (b) IEEE 39-node system topological graph.
According to the definition of each indicator in Section 3.2, the values of each indicator are calculated and normalized. The results are shown in Figure 4.
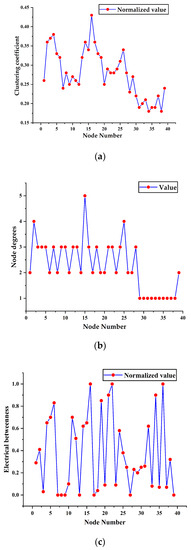
Figure 4.
Distribution of indicators at nodes. (a) Distribution diagram of node degrees with electrical characteristics. (b) Distribution diagram of node aggregation coefficients with electrical characteristics. (c) Dielectric diagram with electrical characteristics.
It can be seen Figure 4a,b that, from the perspective of the topology of the power grid, the node degree and node centrality index value of node 16 are the largest in the whole network, indicating that node 16 is the connecting hub node of the whole network. The index of the node electrical dielectric center is defined by combining the topological characteristics and electrical operation characteristics of the power grid. Figure 4c shows that nodes 16, 22, 35, and 33 have large values in this index. Nodes 35 and 33 are power generation nodes, which provide part of the power for the operation of the power grid. Therefore, the electrical dielectric center values of nodes 35 and 33 are large, and node 16 is very important for maintaining the connectivity of the network. It takes on more power transmission functions, so the central value of the electrical permittivity of the node is the largest. In addition, node 22 plays an important role in both network connectivity and power transmission. It can be seen Figure 4b that, from the electrical operation level of the grid, the comprehensive contribution of nodes is defined based on the transmission power and line impedance of the grid, and nodes 32 to 39 are power generation nodes themselves, so the indicator value of the comprehensive contribution of the nodes will be large. Table 1 lists three methods for conducting comparative experiments.

Table 1.
Method Comparison.
Hereinafter, the method of reference [26] is called Method 1, and the method of reference [27] is called Method 2.
5.2. Measure Computation
The three measures of the complex network defined in Section 3.2 form an improved K_shell method. The following are the normalized values of the IEEE-39 measures.
The degree, dielectric number, and aggregation coefficient with electrical characteristics are calculated according to the entropy weight method. The K_shell weights of are 0.46374, 0.32169, and 0.21457, respectively; therefore, .
5.3. Key Node Sorting Based on the K_shell Algorithm
The method in Section 2.2 is used to iterate through the Ks values. The number of iterations is 4. The iteration results are shown in Table 2.

Table 2.
Node Ks Value Sorting.
According to the ranking results of the node Ks values obtained in Table 2, most of the top 10 nodes with large node Ks values are power generation nodes, indicating the importance of power generation nodes to the overall operation of the grid. Furthermore, several nodes directly connected to the above generation nodes, such as nodes No. 22, No. 19, and No. 29, also have large Ks values in the network, indicating that the transmission lines and nodes connected to the generation nodes are also critical.
In Table 3, it can be seen from the above network decomposition results that there is a large degree of coincidence between the node set with a large number of layers and the node set with the highest Ks value. There is little difference because, in the process of gradually decomposing the network, removing the outer-layer nodes will have a certain impact on the inner-layer nodes.

Table 3.
Network-specific decomposition process.
The Table 4 shows that node 35 ranks first in the criticality of this method in the IEEE 39-node system. Node 35 is the generation node in the system, with a power of 687 MW and the highest output current. Node 35 plays an important role in maintaining the operation and connectivity of the whole power grid; thus, it is the most critical node. Node 16 is the intermediate connection hub node, which plays a large role in the connection of the whole network. Nodes 19 and 20 are the only way for power generation nodes 33 and 34 to transmit power. If these two points fail, the system experiences a large power outage risk.

Table 4.
Sorting of core nodes selected by three methods.
5.4. Calculation of Power Grid Indicators under the Fault Mode
In this paper, we remove the top ten key nodes obtained by each of the three methods, calculate the network benefit index and load loss after node removal to measure the robustness of the power grid in the node removal state, and then determine which of the three methods finds the key nodes that best reflect the vulnerability of the power grid.
The network benefits and grid load losses when removing the top ten nodes individually are shown in Figure 5:
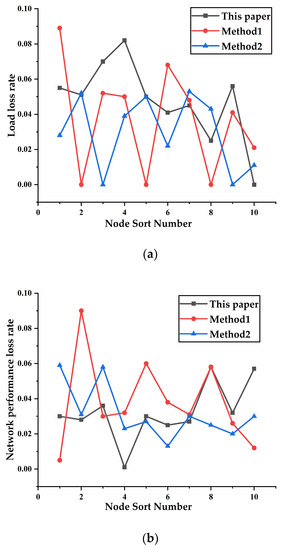
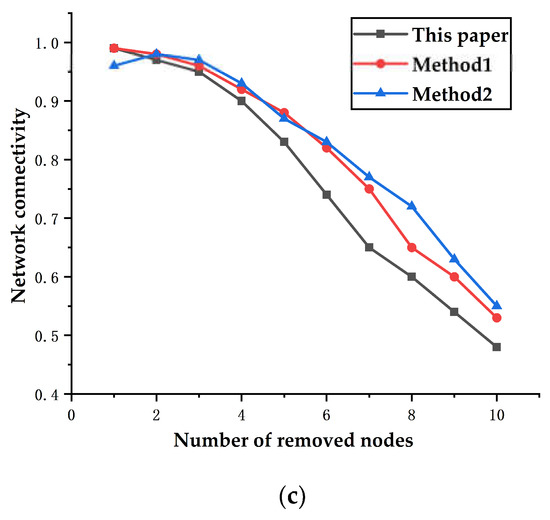
Figure 5.
Fault simulation results: (a) network performance loss rate and (b) load loss rate. (c) Network connectivity.
Figure 5a shows that if the top 10 key nodes fail, the overall load loss to the entire network is higher than that for the sets of key nodes in Method 1 and Method 2. Figure 5b shows that, in terms of network efficiency, only some of the key node sets determined by the method of this paper will cause higher losses than those of the other two methods. The reason is that, compared with the transport lines connected to the key node sets in the other two methods, the lines on which the key nodes are located using the method of this paper carry a smaller power flow. It can be seen Figure 5a,b that when the No. 4 node in this paper fails, the loss of network efficiency caused by the No. 30 node is slightly less than that of the No. 20 node in Method 1 and the No. 34 node in Method 2, but the load loss caused to the network is much higher than that of the No. 20 node in Method 1 and the No. 34 node in Method 2. Similarly, if the last node, 19, in this paper fails, the load loss rate to the entire power network is slightly lower than that of node 27 in Method 1 and node 26 in Method 2, but the loss in network efficiency is far greater than that of node 26 and node 27. The above two examples also show that, although the key nodes of the three methods are ranked differently, the accuracy of the method proposed here is slightly higher than that of the other two methods. Figure 5c shows the connectivity of the network after the cumulative deletion of the top 10 nodes. The connectivity of the network after the removal of the top 10 nodes determined by the method of this paper is lower than that after removing the nodes determined by methods 1 and 2. This indicator also shows that the nodes found by this method are more important.
After deleting the top ten key nodes, the comparison chart of the overall loss of load and network benefits of the power grid is as shown below in Figure 6.
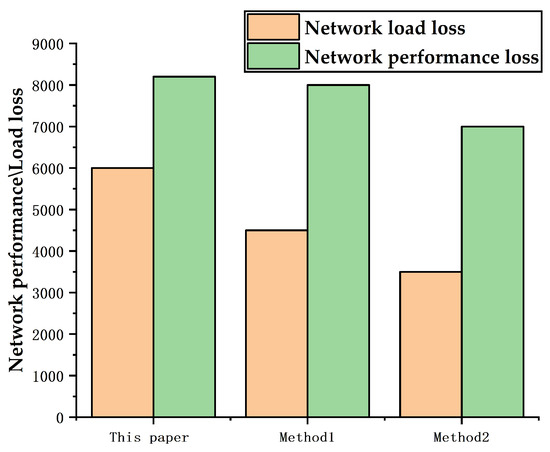
Figure 6.
Comparison chart of network load loss and network efficiency loss after failure for each of the three methods.
It can be seen from Figure 6 above that, if the key node set identified according to the method in this paper is removed, the total load loss rate of the whole network will be higher than that in Method 1 and Method 2, indicating that the total criticality of the key node set in this paper is higher than that of Method 1 and Method 2. However, in terms of the network efficiency loss rate, if the set of key nodes given in this paper fails, the total efficiency loss rate of the network is higher than that for the nodes determined by Method 1 and slightly lower than that for the nodes of Method 2. Considering the overall impact of removing the set of key nodes on the network load and efficiency, the top ten key nodes identified by the method in this paper have a greater impact on the entire network, that is, higher accuracy. In conclusion, the experimental results show that, for the IEEE-39 network node system, the improved key node set obtained by the shell algorithm’s key node identification method not only has a high coincidence with the results of other studies, but also has a greater overall impact on system operation after removing the key node set, which fully verifies the rationality of the method in the paper; the results obtained by the method in the paper are more accurate than those of other studies.
6. Discussion
This paper presents research on key node queries for power grid updates and improves the K_shell algorithm by changing the original core value of degree, which serves as the basic measure, to a weighted degree, weighted intermediate, and weighted aggregation coefficient. All weights are related to the current. The core value is calculated as a range of values. After layer-by-layer filtering, the points with the highest core values can be selected. These points are regarded as key nodes, and the indicators of the power grid can then be verified by removing these nodes.
The method of this paper is compared with Method 1 [26] and Method 2 [27]. Method 1 uses Thiel entropy theory, and Method 2 uses the maximum flow method to find the key nodes of the power grid. Among the compared methods, the method proposed in this paper is shown to have clear advantages in terms of the lost load after a node’s removal and the average network efficiency. To facilitate the analysis of broken lines, the average value of the lost load and the average value of the network efficiency are determined here.
Table 5 shows the average values of the load loss index and the network efficiency index after a node is removed under each of the three methods. The load loss and network efficiency of the key nodes found with the method proposed in this paper are higher than those of the important nodes found by the other two methods, which shows that the proposed method is more accurate than the other methods.

Table 5.
Comparison of the average values of the two indicators.
Nevertheless, there are still some aspects to be improved in the proposed method, such as whether key nodes found by adding further measures to the Ks value will be more important. Detecting the importance of edges in the network is also of interest. When removing nodes to verify the network’s performance, other indicators can also be selected to more comprehensively reflect the importance of the nodes.
One important future direction for power grid research is to use additional measures as Ks values for power grid screening. Thus, future variants of key node identification methods may demonstrate even greater potency. The hope is that the present experimental research results will serve as useful feedback to guide further improvements in power grid operations.
7. Conclusions
This paper proposes a new method based on the improved K_shell algorithm to identify the key nodes of a power grid. This method first establishes multidimensional indicators such as node degree, node centrality, node electrical intermediate number center, and node comprehensive contribution degree, gives the comprehensive weight of the above indicators from two objective perspectives combined with the entropy method, and uses the interval division method to improve the K_shell decomposition algorithm to obtain the set of key nodes of the power grid through network decomposition. Finally, the IEEE-39 node system is used as a simulation example to verify the validity and accuracy of this method by comparing it with other literature and analyzing the impact of key node failures on network load loss and network efficiency. In this paper, the K_shell method has been modified so that it considers electrical characteristics, and the improved K_shell method is more suitable for finding the key nodes in the power grid. Using the IEEE-39 system as an example, this paper compares the method of Tyle entropy in Method 1 to the method of maximum flow in Method 2 to find the key nodes, and shows that the accuracy of this method is improved by 5.6% and 15.7%, respectively, compared with that of Method 1 and Method 2.
Author Contributions
Conceptualization, Y.K.; Data curation, L.J. (Li Ji); Formal analysis, D.Z. and Y.K.; Investigation, D.Z., L.J. (Li Ji) and L.J. (Limin Jia); Methodology, D.Z. and L.J. (Li Ji); Project administration, D.Z., R.S. and L.J. (Limin Jia); Resources, R.S. and L.J. (Limin Jia); Software, Y.K.; Validation, L.J. (Limin Jia); Writing—original draft, D.Z.; Writing—review & editing, L.J. (Limin Jia). All authors have read and agreed to the published version of the manuscript.
Funding
This work was supported by the Science Foundation of China University of Petroleum [No.2462020YJRC008].
Institutional Review Board Statement
Not applicable.
Informed Consent Statement
Not applicable.
Data Availability Statement
The data that support the findings of this study are available from the corresponding author upon reasonable request.
Conflicts of Interest
The authors declare no conflict of interest.
References
- Xie, P.; Tan, S.; Bazmohammadi, N.; Guerrero, J.M.; Vasquez, J.C.; Alcala, J.M.; Carreño, J.E. A distributed real-time power management scheme for shipboard zonal multi-microgrid system. Appl. Energy 2022, 317, 1. [Google Scholar] [CrossRef]
- Nejad, S.A.; Matas, J.; Elmariachet, J.; Martín, H.; de la Hoz, J. SOGI-FLL Grid Frequency Monitoring with an Error-Based Algorithm for a Better Response in Face of Voltage Sag and Swell Faults. Electronics 2021, 10, 1414. [Google Scholar] [CrossRef]
- Pagani, G.A.; Aiello, M. The power grid as a complex network: A survey. Phys. A Stat. Mech. Its Appl. 2013, 392, 2688–2700. [Google Scholar] [CrossRef]
- Jin, J.; Xu, K.; Xiong, N.; Liu, Y.; Li, G. Multi-index evaluation algorithm based on principal component analysis for node importance in complex networks. IET Netw. 2012, 1, 108–115. [Google Scholar] [CrossRef]
- Chen, G.; Zhao, J.; Dong, Z.Y.; Weller, S.R. Complex network theory based power grid vulnerability assessment from past to future. In Proceedings of the 9th IET International Conference on Advances in Power System Control, Operation and Management (APSCOM 2012), Hong Kong, China, 18–21 November 2012; IET: London, UK, 2012; pp. 1–6. [Google Scholar]
- Jha, A.V.; Appasani, B.; Gupta, D.K.; Ustun, T.S. Analytical Design of Synchrophasor Communication Networks with Resiliency Analysis Framework for Smart Grid. Sustainability 2022, 14, 15450. [Google Scholar] [CrossRef]
- Fan, B.; Zheng, C.X.; Tang, L.R.; Wu, R.Z. Critical nodes identification for vulnerability analysis of power communication networks. IET Commun. 2020, 14, 703–713. [Google Scholar] [CrossRef]
- Venegas, F.G.; Meunier, S.; Protopapadaki, C.; Perez, Y.; Saelens, D.; Petit, M. Impact of Distributed Energy Resources and Electric Vehicle Smart Charging on Low Voltage Grid Stability; IET: London, UK, 2021. [Google Scholar]
- Pagani, G.A.; Aiello, M. Power grid complex network evolutions for the smart grid. Phys. A Stat. Mech. Its Appl. 2014, 396, 248–266. [Google Scholar] [CrossRef]
- Xu, T.; Chen, J.; He, Y.; He, D.-R. Complex network properties of Chinese power grid. Int. J. Mod. Phys. B 2004, 18, 2599–2603. [Google Scholar] [CrossRef]
- Krč, R.; Kratochvílová, M.; Podroužek, J.; Apeltauer, T.; Stupka, V.; Pitner, T. Machine Learning-Based Node Characterization for Smart Grid Demand Response Flexibility Assessment. Sustainability 2021, 13, 2954. [Google Scholar] [CrossRef]
- Chaoyang, C.; Yong, Z.; Ming, C.; Binghong, W. Overview of research on large power grid vulnerability based on complex network theory. Control. Decis. 2022, 37, 782798. [Google Scholar] [CrossRef]
- Ming, Z.; Hong, Q.; Yiyi, Z.; Jiejie, D. Design method of ubiquitous power Internet of Things based on complex network. ElectricEngineering 2022, 176180. [Google Scholar] [CrossRef]
- Paul, H.; Sacher, J. Fitted empirical reference cross sections for K-shell ionization by protons. At. Data Nucl. Data Tables 1989, 42, 105–156. [Google Scholar] [CrossRef]
- Parvez, I.; Sarwat, A.I.; Wei, L.; Sundararajan, A. Securing metering infrastructure of smart grid: A machine learning and localization based key management approach. Energies 2016, 9, 691. [Google Scholar] [CrossRef]
- Yan, Z.; Ning, Z. Research on k-shell structure of online social network. Comput. Appl. Res. 2015, 536, 538542. [Google Scholar] [CrossRef]
- Lin, G.; Mo, T.; Ye, X.; Han, C.; Lin, Z.; Wang, Z. Identification of key nodes of power grid based on TOPSIS and CRITIC methods. High Volt. Technol. 2018, 44, 3383–3389. [Google Scholar] [CrossRef]
- Chen, S.; Liang, S.; Li, S.; Zhou, Y.; Yu, X. Power grid vulnerability assessment based on electrical centrality index. Power Supply Consum. 2021, 38, 70–76. [Google Scholar] [CrossRef]
- Dou, B.L.; Wang, X.G.; Zhang, S.Y. Robustness of networks against cascading failures. Phys. A Stat. Mech. Its Appl. 2010, 389, 2310–2317. [Google Scholar] [CrossRef]
- He, M.; Zou, Y.; Liang, M.; Li, Z.; Gao, Z. Power network key node identification based on multi-attribute decision-making. Complex Syst. Complex. Sci. 2020, 17, 27–37. [Google Scholar] [CrossRef]
- Baldick, R.; Chowdhury, B.; Dobson, I.; Dong, Z.; Gou, B.; Hawkins, D.; Huang, Z.; Joung, M.; Kim, J.; Kirschen, D.; et al. Vulnerability assessment for cascading failures in electric power systems. In Proceedings of the 2009 IEEE/PES Power Systems Conference and Exposition, Seattle, WA, USA, 15–18 March 2009; pp. 1–9. [Google Scholar]
- Huang, Z.; Wang, C.; Ruj, S.; Stojmenovic, M.; Nayak, A. Modeling cascading failures in smart power grid using interdependent complex networks and percolation theory. In Proceedings of the 2013 IEEE 8th Conference on Industrial Electronics and Applications (ICIEA), Melbourne, Australia, 19–21 June 2013; pp. 1023–1028. [Google Scholar]
- Wenli, F.; Zhigang, L.; Ping, H.; Shengwei, M. Cascading failure model in power grids using the complex network theory. IET Gener. Transm. Distrib. 2016, 10, 3940–3949. [Google Scholar] [CrossRef]
- Zhu, D.; Wang, R.; Duan, J.; Cheng, W. Comprehensive weight method based on game theory for identify critical transmission lines in power system. Int. J. Electr. Power Energy Syst. 2021, 124, 106362. [Google Scholar] [CrossRef]
- Wang, H. Research on Identification of Key Nodes in Complex Networks Based on Improved K-shell Algorithm; East China Normal University: Shanghai, China, 2019. [Google Scholar]
- Bao, J. Research on Identification of Key Nodes and Key Lines in Power System; North China Electric Power University: Beijing, China, 2018. [Google Scholar]
- Hao, W. Research on Identification of Key Nodes and Key Lines of Power Grid Taking into Account Power Grid Structure and State; Nanchang University: Nanchang, China, 2020. [Google Scholar] [CrossRef]
Disclaimer/Publisher’s Note: The statements, opinions and data contained in all publications are solely those of the individual author(s) and contributor(s) and not of MDPI and/or the editor(s). MDPI and/or the editor(s) disclaim responsibility for any injury to people or property resulting from any ideas, methods, instructions or products referred to in the content. |
© 2022 by the authors. Licensee MDPI, Basel, Switzerland. This article is an open access article distributed under the terms and conditions of the Creative Commons Attribution (CC BY) license (https://creativecommons.org/licenses/by/4.0/).