Article

LSTM-Based IoT-Enabled CO2 Steady-State Forecasting for Indoor Air Quality Monitoring

by
Yingbo Zhu
,
Shahriar Abdullah Al-Ahmed
,
Muhammad Zeeshan Shakir
* and
Joanna Isabelle Olszewska
School of Computing, Engineering and Physical Sciences, University of the West of Scotland, Paisley PA1 2BE, UK
*
Author to whom correspondence should be addressed.
Electronics 2023, 12(1), 107; https://doi.org/10.3390/electronics12010107
Submission received: 6 December 2022 / Revised: 20 December 2022 / Accepted: 22 December 2022 / Published: 27 December 2022
(This article belongs to the Special Issue Enabling Technologies for Internet of Things)

Abstract

:
Whether by habit or necessity, people tend to spend most of their time indoors. Built-up Carbon dioxide (CO 2 ) can lead to a series of negative health effects such as nausea, headache, fatigue, and so on. Thus, indoor air quality must be monitored for a variety of health reasons. Various air quality monitoring systems are available on the market. However, since they are expensive and difficult to obtain, they are not commonly employed by the general population. With the advent of the Internet of Things (IoT), the Indoor Air Quality (IAQ) monitoring system has been simplified, and a number of studies have been conducted in order to monitor the IAQ using IoT. In this paper, we propose an improved IoT-based, low-cost IAQ monitoring system using Artificial Intelligence (AI) to provide recommendations. In our proposed system, the IoT sensors transmit data via Message Queuing Telemetry Transport (MQTT) protocol which can be visualised in real time on a user-friendly dashboard. Furthermore, the AI technique referred to as Long Short-Term Memory (LSTM) is applied to the collected CO 2 data for the purpose of predicting future CO 2 concentrations. Based on the predicted CO 2 concentration, our system can compute CO 2 steady state in advance with an error margin of 5.5%.

1. Introduction

The term ’indoors’ refers to an area inside a building or structure such as a cafe, restaurant, home, office, or even a vehicle. Whether for personal or professional reasons, the weather or other factors, most of us spend the majority of our time indoors. A study by the Environmental Protection Agency (EPA) estimates that Americans spend 93% of their time indoors [1]. The average British citizen spends 53 years of their life indoors, making the British population the largest indoor nation [2]. Since these studies were published prior to the COVID-19 pandemic, the figures may have increased significantly due to influential factors associated with the pandemic [3]. Indeed, it has become apparent to some individuals that they can work from home instead of travelling to their respective workplaces. Due to the fact that people spend most of their time indoors, the quality of air inside buildings and other structures bears a substantial impact on their health, comfort and well-being. Poor Indoor Air Quality (IAQ) can cause or contribute to the development of allergies, asthma, and other respiratory conditions. It can also cause headaches, dizziness, nausea and fatigue [4].
IAQ can be affected by gases, particles, mould, bacteria, and other contaminants. Several sources of pollution are responsible for poor IAQ, both indoors and outdoors. Outdoor sources of air pollution such as traffic and industrial emissions, can enter buildings through doors, windows, and ventilation systems [5]. Indoor sources of pollution include combustion appliances, building materials, cleaning products and office equipment. CO 2 has been considered an important and common indicator for measuring IAQ [6,7]. CO 2 is produced each time an individual exhales. It is also produced by combustion appliances and certain office equipment. The level of CO 2 in indoor air is typically higher than that of outdoor air. Many studies have shown that CO 2 can lead to reduced cognitive performance [8], and high concentrations of CO 2 lead to several health-related issues such as nausea, headache, and fatigue [9]. Recent studies also show that the concentration of CO 2 can affect risk of COVID-19 infection [10]. This is because both pathogens and CO 2 are exhaled by infected individuals, rendering indoor CO 2 levels an effective proxy for identifying potential infection risk. Therefore, monitoring CO 2 levels has been proposed as an indicator to indirectly evaluate the potential risk of respiratory infectious disease transmission [11]. The study of indoor CO 2 levels is also relevant to the issue of occupancy counting, which can further impact building energy consumption [12]. Using CO 2 sensors to determine occupancy presents a promising approach that has been explored in several studies [13,14,15]. Accurately determining building occupancy is important for achieving energy savings, and in some cases can lead to a 30–40% reduction in energy consumption [16]. Understanding indoor CO 2 levels is crucial to ensuring the health and safety of occupants present. Government regulations and industrial guidelines establish different acceptable CO 2 concentration limits for indoor spaces. For instance, a safety boundary of no more than 1000 ppm CO 2 concentration is commonly used in many applications [17], while the European standards establish 1500 ppm as the maximum acceptable concentration of CO 2 for indoor IAQ [18]. Since a substantial amount of CO 2 is emitted by the breathing of occupants, it is necessary to design an efficient CO 2 level monitoring system as well as a forecasting system to effectively prevent associated health risks. With the development of the IoT, low-cost sensors and open-source IoT platforms have become widely available and can be integrated together with AI technologies into IAQ systems. Therefore, this paper proposes not only an IoT-enabled, real-time CO 2 monitoring dashboard, but also the smart forecasting of CO 2 concentration and CO 2 steady state or equilibrium. This paper provides two main contributions:
  • Exploitation of IoT sensors to achieve a real-time indoor air monitoring system.
  • Application of LSTM to predict or forecast future levels of CO 2 concentration based on the collected or historical data. Following that, the indoor steady-state CO 2 value can be calculated in advance to provide health and well-being recommendations.
The remainder of the paper is arranged as follows. Section 2 presents the related works, while Section 3 explains our proposed method for collecting and presenting data. Section 4 describes our methodology. The results are discussed in Section 5. Finally, we provide concluding remarks in Section 6 along with an outline of our future works.

2. Related Work

In the field of buildings, monitoring CO 2 levels is important for a variety of applications, including Heating, Ventilation and Air conditioning (HVAC) system controls, occupancy predictions, building datasets that contain building operations as well as Computational Fluid Dynamics (CFD) analysis. By using CO 2 monitoring in conjunction with these other building data, it is possible to improve building performance and energy efficiency. The authors of [19] employed genetic algorithms and varying CO 2 concentrations to optimize the performance of standard HVAC systems in terms of power savings. By combining genetic algorithms with CO 2 concentrations, they were able to achieve a 21% reduction in chiller costs and reduce the maximum flow of water through the cooling coil by 83%. CO 2 concentrations also play a key role in predicting building occupancy. Additionally, empirical results provided in [20] showed that indoor CO 2 levels were consistently among the top 15 most important features for predicting occupancy across all space types. Accurately determining building occupancy can lead to significant reductions in energy consumption, with potential savings of up to 30–40% [16]. The authors of [21] built comprehensive building operation datasets containing a CO 2 parameter, aimed at providing a unique perspective on the operation of a net-zero energy building and establishing a useful benchmark against existing buildings. In a study by [22], a low-cost CO 2 measurement device was developed to remotely monitor IAQ. In addition, CFD modeling was used to study indoor air flows and identify potential measurement locations.
CO 2 is the most common indoor air parameter related to IAQ, and is widely used for comfort definition and Indoor Environmental Quality (IEQ) detection [23]. Based on IAQ sensors and a machine learning strategy, the authors of [3] proposed a solution for IAQ monitoring, consisting in providing users with access to both a web portal and a mobile app that display a visual representation of the air quality. In their study, a total of five air parameters (CO 2 , CO, NO 2 , CH 4 and PM 2.5 ) were calculated and classified according to the IAQ level. Using neural networks, the authors classified IAQ conditions with a 99.1% accuracy rate. Long Short-Term Memory (LSTM) was also used to predict future CO 2 concentrations. However, the achieved IAQ classification results were based on the outdoor Air Quality Index (AQI) which is influenced by many other parameters and may not be suitable for an indoor environment. Furthermore, their method may pose a challenge due to sensor lifetime and calibration factors. On the other hand, based on LSTM and its variant Gated Recurrent Unit (GRU), in a study by [24], the authors developed an IAQ prediction system. In that work, the authors found that GRU has a better performance than LSTM and achieved an accuracy rate of up to 84.69% when using GRU. However, this model takes 38 h to find the step size of the optimal time step. In addition, an architecture was proposed for collecting data through the IoT network in [23], where two prediction models were also built: one for predicting the comfort conditions in a day regarding temperature, humidity and CO 2 , and another for predicting CO 2 concentration from neural networks. According to their results, the Mean Square Error (MSE) during the test period is around 75 ppm (10.6%) compared to the average concentration of CO 2 . In another study [25], researchers compared two different CO 2 forecasting methods, and found that a decision tree was more efficient than Artificial Neural Network (ANN) in terms of computation and energy consumption. Furthermore, the adoption of one-minute-ahead forecasting time-window strategy has the highest accuracy compared to a ten- or fifteen-minute-ahead time window. However, the addition of other variables such as temperature and humidity does not improve the prediction accuracy. Based on a dynamic mobile window, the authors of [26] proposed a progressively updated CO 2 prediction model. It is possible for this model to improve its accuracy on a daily basis. Using their own CO 2 data, they integrated this model on an edge device that is capable of updating the model and forecasting future levels of CO 2 . In most studies, the focus is on building a data collection system for indoor environments and predicting air parameters as well as classifying the level of air conditions based on predicted air parameters. However, there is no unified standard for the classification of IAQ, and the prediction result of a longer future forecasting time window is poorer than that of a shorter one. In this work, CO 2 is utilized as an indicator of IAQ since it is produced whenever an individual exhales. Based on the authors’ conclusion in [25], a one-minute forecasting time window strategy is adopted to output better performance in our prediction model. We first design a real-time IAQ monitoring system, and then apply a deep learning LSTM model to predict future CO 2 concentration data. Subsequently, the steady state of the concentration is calculated in advance to help guide and protect occupants from negative health effects associated with poor air quality.

3. System Design

The purpose of this study is to monitor IAQ and CO 2 concentration using IoT sensors. We also measured the change of Particulate matter (PM) with an occupant present in the room but found PM level almost unchanged. The experiment result in [27] showed a weak correlation in PM levels between indoor and outdoor environments (Pearson’s r = 0.01, p-value = 0.91). Indoor activities, such as regular desk work or rest, seldom influence the change in PM level, while CO 2 is the most common indoor pollutant related to high people density. From the data we obtained, the change level of CO 2 is significantly higher than that of PM. Therefore, in this work we adopt CO 2 as an IAQ indicator. Our study involves the following hardware and software.

3.1. Hardware Solution

Among the hardware components of this system are the Raspberry Pi 3B single-board computer, the ESP8266 Wi-Fi module, the SCD30 CO 2 sensor and the BME680 IAQ sensor.
Raspberry Pi: is a single-board computer responsible for handling and displaying the dashboard or monitoring system for our study.
SCD30: is a highly accurate nondispersive infrared sensor (NDIR) for detecting CO 2 parameters. This sensor provides two digital interface options: Inter-Integrated Circuit (I2C) and Universal Asynchronous Receiver-Transmitter (UART). The measurement range of SCD30 is from 400 ppm to 10,000 ppm with accuracy of ±(30 ppm + 3%). Because of its high precision and wide measurement range, it is suitable for indoor IoT monitoring to support user well-being.
BME680: is an IoT environment sensor that measures temperature, humidity (±3% r.H. accuracy tolerance), pressure and Volatile Organic Compounds (VOC) gas parameters with high accuracy from BOSCH. Utilising its own algorithm library, it can calculate the air quality index based on four parameters and previous environmental conditions.
ESP8266: is a Wi-Fi module microchip that is integrated with a TCP/IP protocol stack. Both I2C and UART communication are supported by this module. Because of its compatibility with other embedded devices, small size, and ultra-low power consumption, it is widely used in IoT applications [28].

3.2. Software and Protocol Solution

Message Queuing Telemetry Transport (MQTT): MQTT is a lightweight and efficient machine to machine (M2M) network protocol designed for IoT applications due to its reliability of message delivery.
Node-Red: is an open source flow-based tool for connecting hardware devices, APIs and other IoT services. Node-Red’s MQTT node can subscribe data from MQTT, cloud and store it in a database. By utilising the features of visual programming, Node-Red is able to detect system malfunctions such as sensor failure.
Influxdb: is a time-series database developed by influxData organisation. Due to its support by the Node-Red tool and the requirement for a timestamp to record the data, Influxdb was adopted as the database for this design.
Grafana: is a tool for visualising and analysing time-series data. It integrates a rich dashboard plugin that simplifies the presentation of data.
This study’s system design is illustrated in Figure 1. Both sensors are connected to Wi-Fi modules. The sensors and Wi-Fi modules are configured using Arduino programming language to connect to the Wi-Fi gateway. Raspberry Pi is used as a hub which interacts with the IoT software owing to its flexible and powerful processing performance [29]. On the Raspberry Pi, Node-Red, infuxdB and Grafana are installed for retrieving, displaying and processing data from the MQTT server.

4. Methodology

We discuss our data collection and processing method in this section. With the help of sensor library from Arduino programming language, data is collected from the BME680 air quality sensor and SCD30 CO 2 sensors. These data are sent to a cloud server via Wi-Fi gateway using the MQTT protocol. Sensor data were received from MQTT cloud on the Raspberry Pi with Node-Red. The data are then processed in order to be stored in the influxdb database. Here, Node-Red can be considered as a data bridge. The system receives data from the MQTT cloud and links it to the influxdb database. Finally, we used the data imported from influxdb to create a real-time dashboard using Grafana. The dashboard is displaying temperature, humidity, CO 2 as well as IAQ index parameters. Using Grafana, the dashboard can trigger alerts such as emails in response to critical events such as excessively high temperatures or carbon dioxide concentrations which may pose danger to indoor occupants.
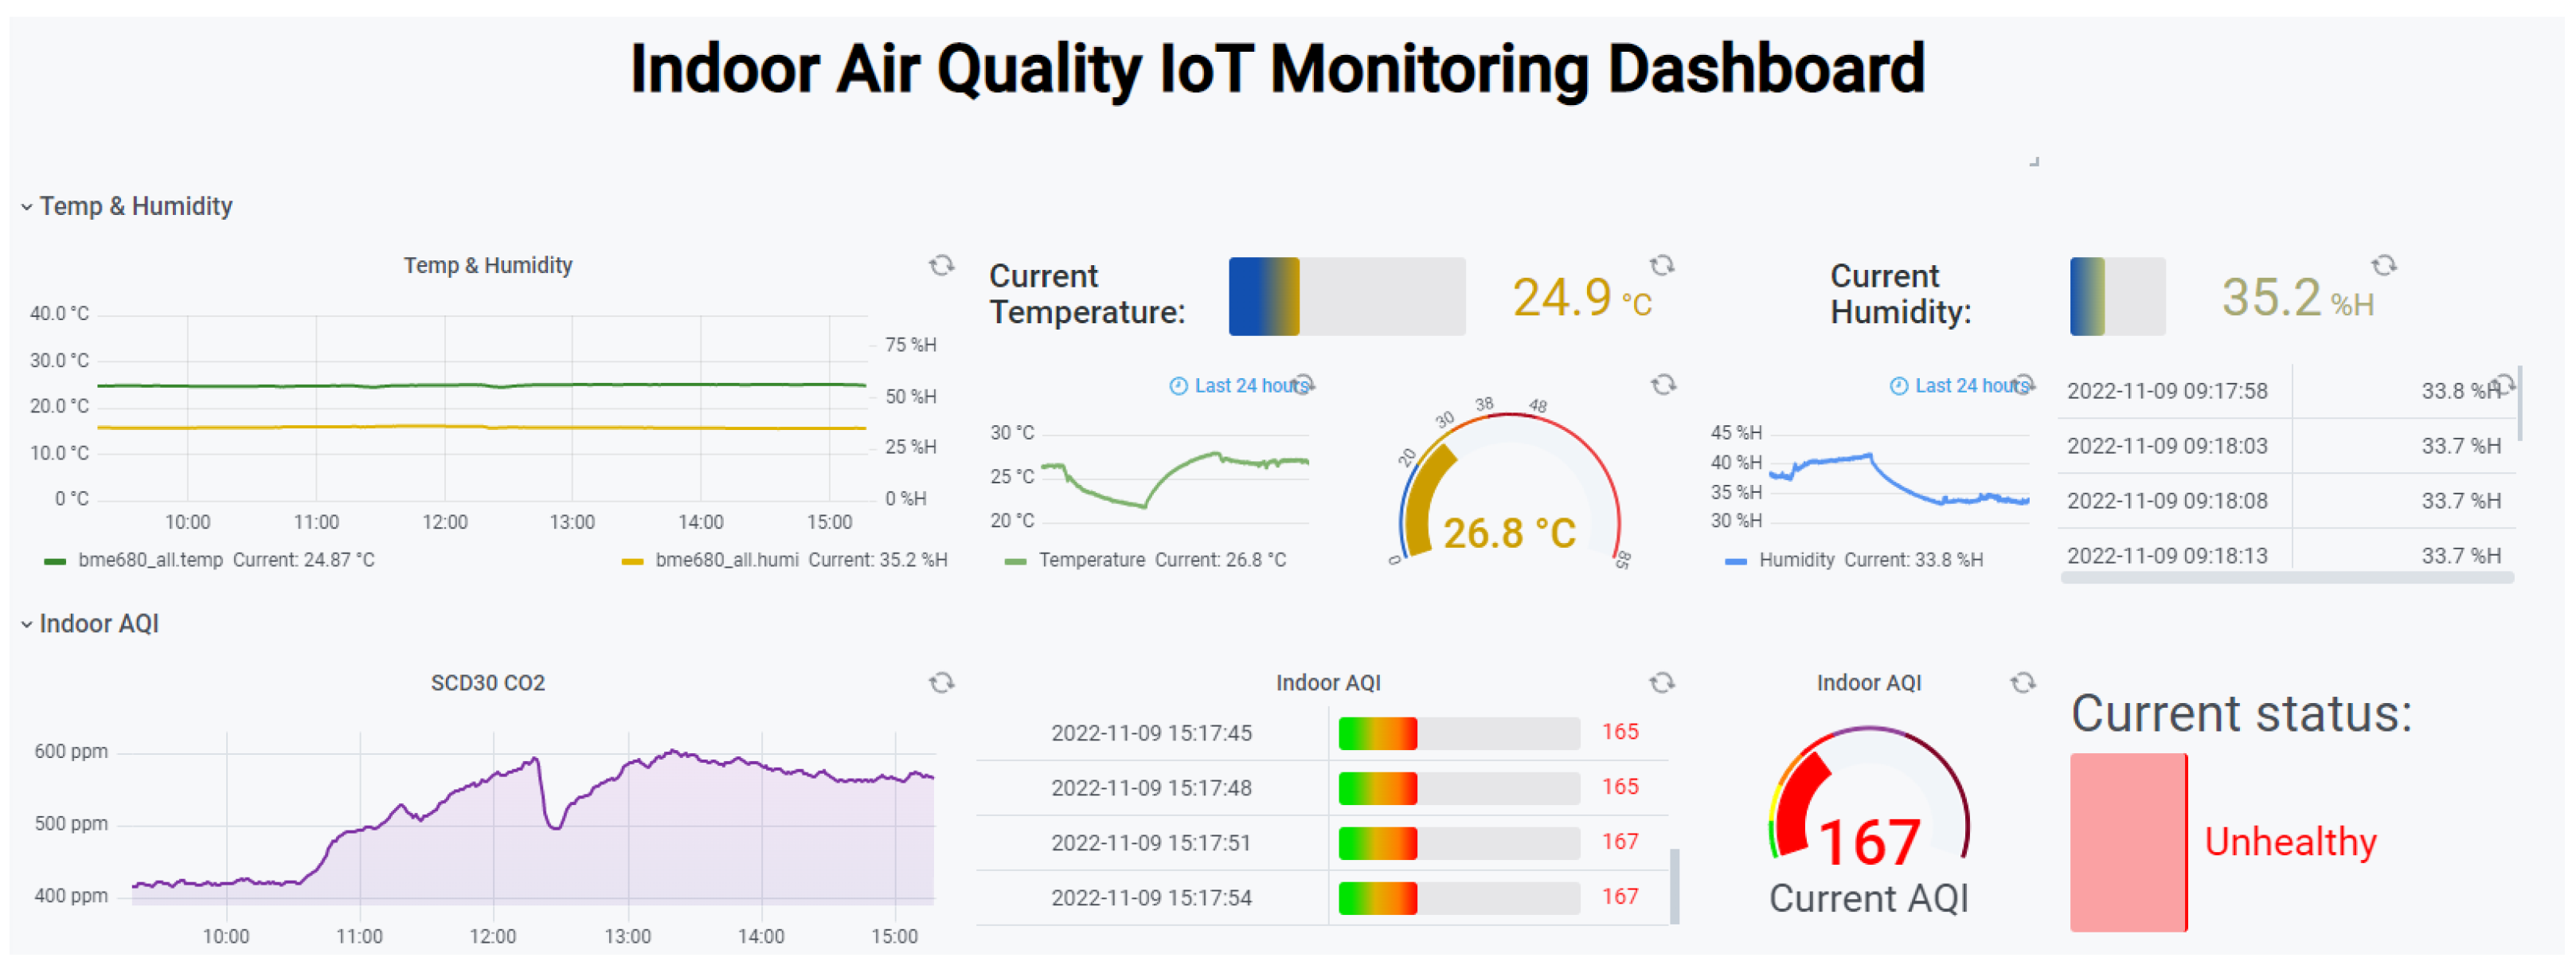
Figure 2 displays an overview of Grafana’s dashboard containing real-time indoor ambient air conditions. It incorporates ambient data from InfluxDB database and displays them as a variety of UI charts to the user. The displayed data include CO 2 concentrations, temperature, humidity as well as the IAQ index.

4.1. LSTM-Based Prediction Model

Recurrent Neural Networks (RNN) is a common time-series forecasting model that provides more advantages than other types of neural networks dealing with time sequence data [23]. The RNN is made up of single layer networks with loops which can pass the time information from one network to the other. It can learn the information from previous data and combine it with current input to make a decision. A historical limitation in RNN is the gradient disappearance issue, particularly when dealing with a massive amount of time series data [30]. However, this issue can be overcome by using LSTM which is an updated version of RNN with additional memory elements. LSTM consists of a cell and four layers, namely, input layer, forget gate layer, updated layer, and output layer. The additional forget gate handles the input information in memory for a longer period of time compared to RNN. By using gates to control the flow of information and prevent gradients from exploding or vanishing, LSTM is able to effectively store information for extended time steps and solve complex time-series problems. This renders them an improvement over traditional RNN, which struggle with these issues [31]. Therefore, LSTM is considered as one of the state-of-the-art algorithms in solving time-series prediction problems [32]. There are many popular LSTM variants proposed. In this work, we used three different variants of LSTM: single cell, stacked and bidirectional, and compared their benchmark scores. Among the popular LSTM variants, in this work we adopted three different ones (i.e., single cell, stacked, and bidirectional LSTM).

4.2. CO 2 Steady-State Model

Steady state is a key factor in the CO 2 mass balance equation which represents the maximum CO 2 level in a room. It is determined by the number of people and ventilation rate. The importance of studying CO 2 steady state is that it is used in the CO 2 mass balance equation to solve the occupancy issue, which is directly related to the energy consumption of residential and office buildings [12,33]. The European standard stipulates that a concentration of 1500 ppm CO 2 is the acceptable upper limit of IAQ [18]. Therefore, if the maximum value of CO 2 can be predicted in advance, the health problems caused by CO 2 can be prevented. Indoor CO 2 is produced primarily by the respiration of occupants according to the CO 2 mass balance theory [34]. CO 2 levels inside the building remain in dynamic equilibrium with the outside air for a sufficient period of time, and these levels are referred to as steady state. Its differential equation is shown in Equation (1):
C ( t ) = C 0 C s s e Q V t + C s s ,
where C 0 is indoor CO 2 concentration at t = 0 ; C s s is CO 2 steady state; V is volume of indoor space; C o t is outdoor CO 2 concentration; Q and G are volumetric flow rate of air into the space and CO 2 generation rate. In general, C o t , Q and G are functions of time but are assumed constant in this model [35]. The C s s can be defined as follows:
C s s = C o t + G Q ,
Figure 3 illustrates the trend of indoor CO 2 concentration levels. Observing the CO 2 trend curve for a sufficient amount of time is one way to obtain steady state values for C s s . However, Equation (2) shows that steady state concentration is normally time consuming, since it depends on respiration rate G and airflow Q. A second method of acquiring steady state values in advance is to solve the equilibrium level from the trend curve [36]. This equation can be expressed as follows:
C s s = C b 2 C a C c 2 C b C a C c ,
where C a , C b and C c are concentrations at evenly spaced time points a, b, and c. Theoretically from Figure 3, steady-state C s s can be calculated from any three evenly spaced time points on the entire time axis. In order to avoid fluctuation errors caused by the actual measurement of CO 2 , the interval distance between C a , C b and C c are ten time points.

4.3. Data Collection and Pre-Processing

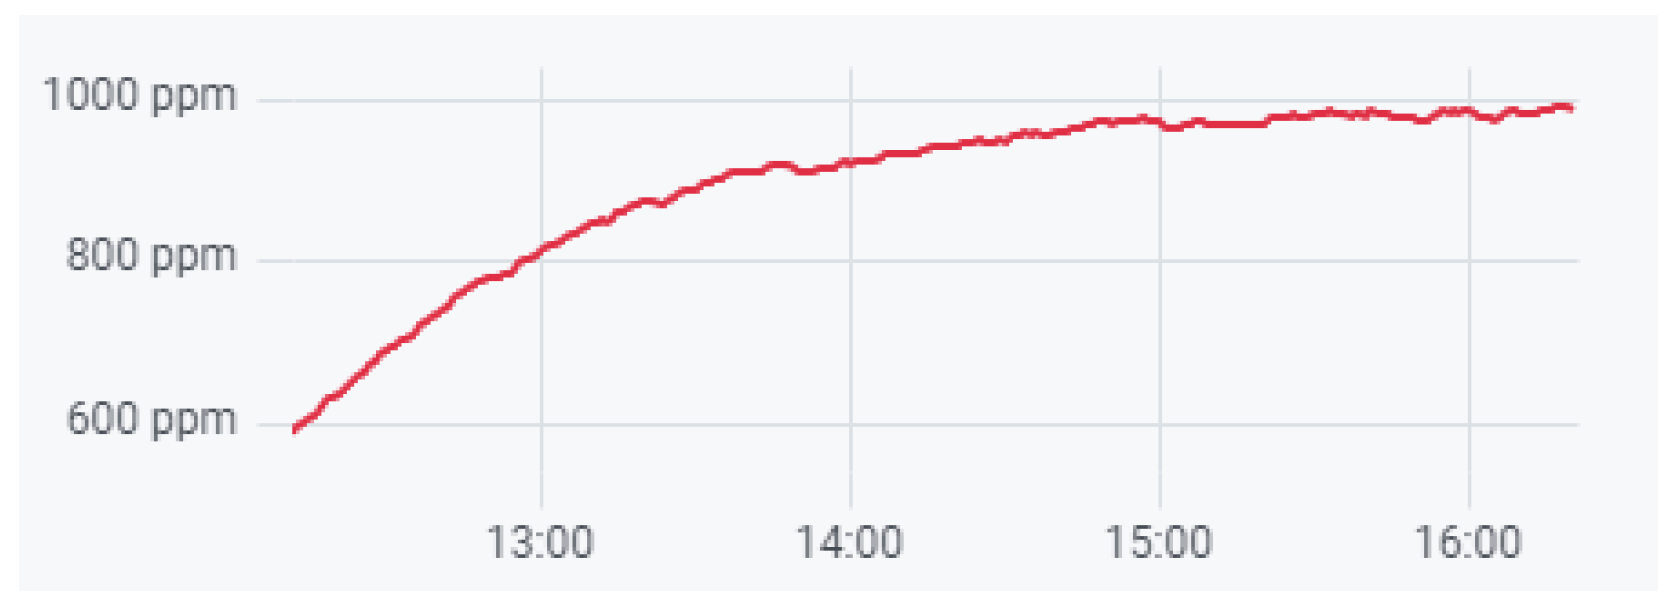
The selected study site was located in the bedroom of an occupant’s two-story residential building. We deployed two sensors in the room, SCD30 and BME680, that measured the CO 2 concentration, and temperature and humidity in the room, respectively. The two sensors were placed on a wall 1.5 m above the ground. The SCD30 sensor recorded the change level of CO 2 in the house for a period of 5 days in which the sampling interval was 1 min and the recording time period spanned from 18 January to 23 January 2022. Thus, a total of 7461 data samples were obtained. The measured changes in CO 2 levels of the room are shown in Figure 4. On the last day of measuring, we experimented with the steady-state value of CO 2 . We kept a person in the room where all doors and windows were closed. The experiment duration was 250 min lasting from 12:12 to 16:21 GMT.
In order to predict the change level of CO 2 in the room, we input the 7461 collected data samples into the LSTM model, of which 6500 served as training data and the rest constituted the test data. The time-step was set to ten steps, and the slide window was one step, which means we used the previous ten-minute CO 2 concentration data to forecast next-minute (step) data. For the data pre-possessing, we used min-max normalization to accelerate the training time and improve the robustness of the model. The model configuration parameters of the three LSTM variants (i.e., single cell, stacked, and bidirectional LSTM) are listed in Table 1.

5. Experimental Results and Discussion

In this section, we present the steady-state CO 2 results derived from our predictive model. It consists of two parts. First, we describe the setup of the experiment for the real-world steady state of CO 2 in a dweller’s bedroom. In the second part, we describe the various variants of the LSTM strategy that we employed to predict future next step data. We also calculate the steady-state concentration of the room.
According to Figure 5, there are several periods of rapid decline in CO 2 concentration during the recording period. The whole measuring period is divided into two parts. For the first four days of recording, changes in CO 2 concentration in the selected room were recorded. The occupants of the room were able to enter and exit the room without any restrictions. During these periods, there were several instances of rapid decline in CO 2 concentration. This phenomenon occurred because an occupant had opened doors or windows for ventilation. As a precautionary measure, we established a 1000 ppm alert boundary to alert occupants of potential danger. In addition, from the figure it can be clearly observed that during this period the concentration of CO 2 exceeded 1000 ppm, with the highest concentration reaching 1170 ppm. On the fifth day, we started to investigate CO 2 steady state. During this time, the occupant had to remain in the room and was not allowed to leave until the experiment was completed. The steady state of the CO 2 experiment did not exceed 1000 ppm. In light of Equation (2), we are able to see that the steady state of indoor CO 2 is not only affected by outdoor CO 2 ; there is a correlation between the CO 2 concentration, air flow rate, and the respiratory rate of an individual. The occupant performed only light intensity activities during steady-state monitoring, such as desk work. For the remainder of the time, the occupant conducted some indoor exercises, such as push-ups. The different activity intensities resulted in different respiratory rates which caused the CO 2 steady-state concentration during the experiment to measure lower than at other times. As the room considered for the experiment was naturally ventilated and the airflow rate was affected by outside wind speed and pressure [36], ventilation rate at different time periods was also a contributor to the CO 2 steady-state change.
Figure 4 shows a change trend curve in CO 2 in a room that fits very well with the CO 2 mass Equation (1). We averaged the last 20 data points of the measured data in order to determine the steady-state value of CO 2 in the room. The calculated result was 983.2 ± 8 ppm.
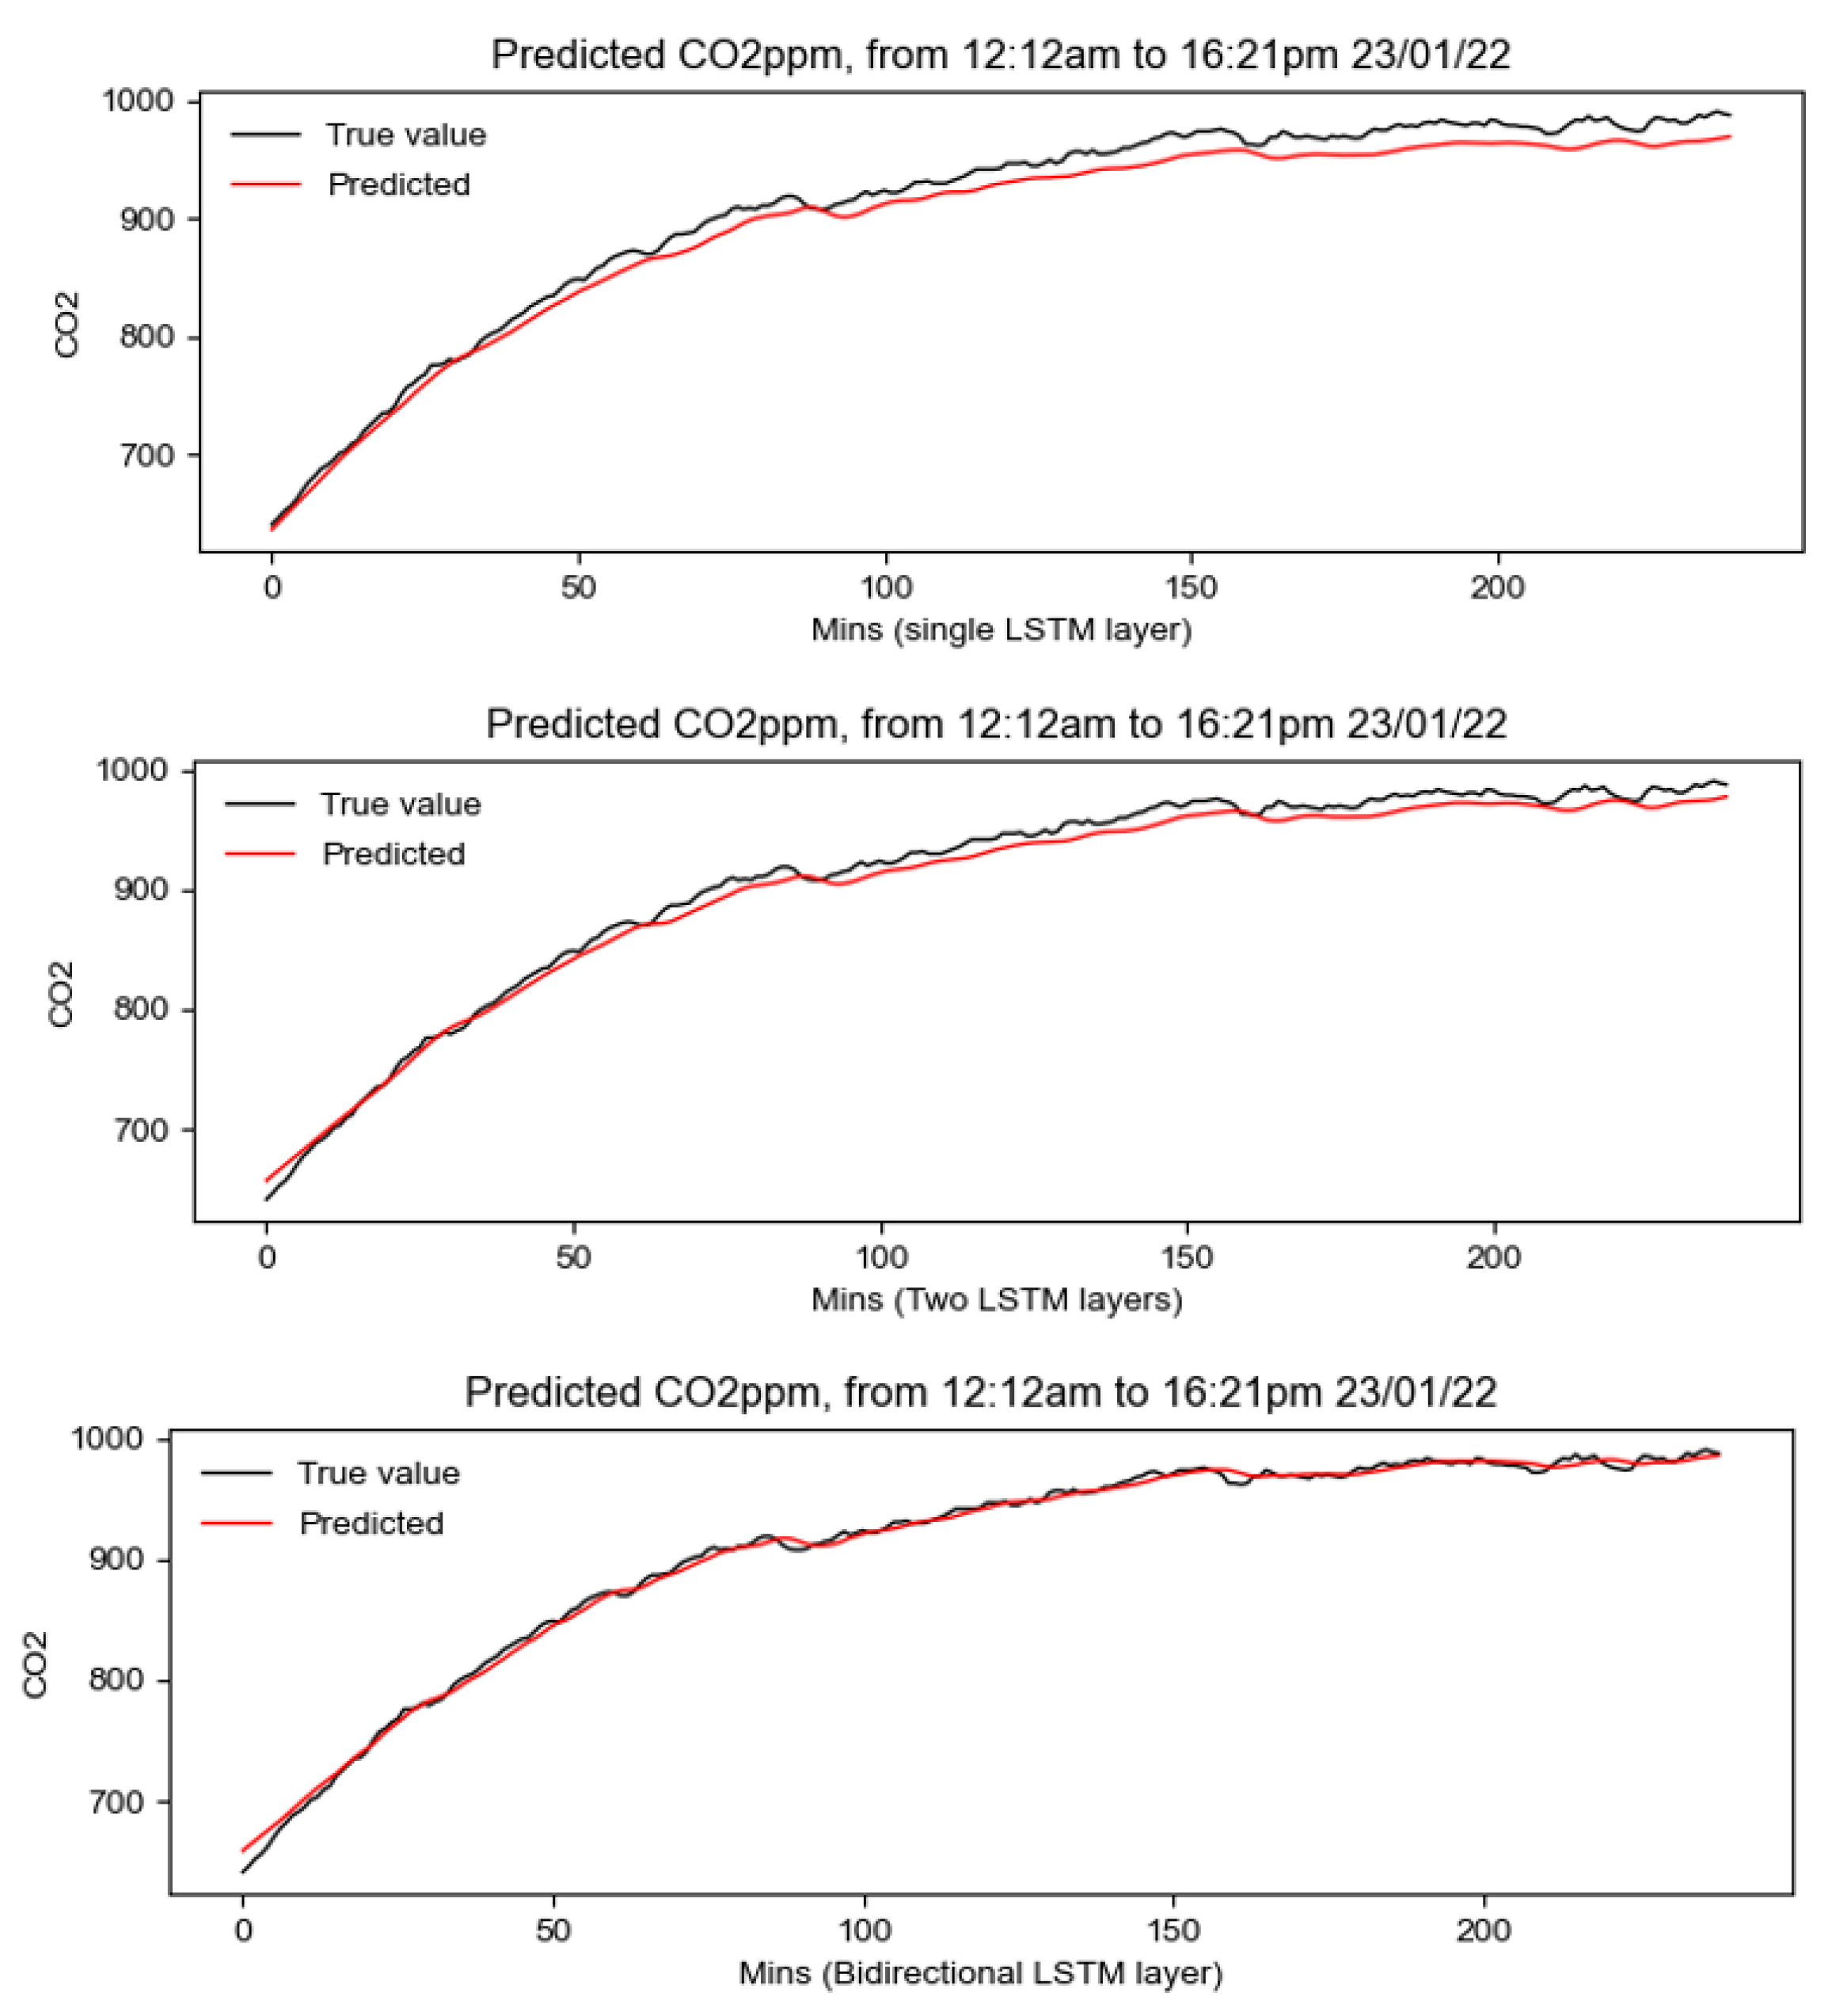
A comparison of the prediction results of the three LSTM models can be seen in Figure 6. In this work, Keras, a high-level, open source deep learning platform was applied to our LSTM prediction model. Table 1 presents the hyperparameters of the training model. Following fine-tuning of the forecasting model, the most successful results were obtained by setting the training period of the three LSTM models to 20 and the batch size to 32. It can be concluded from Figure 6 that the predicted result after applying bidirectional LSTM is closer to the test results, and the benchmark comparison results in Table 2 also indicate that the bidirectional LSTM produces the most effective score performance out of the three LSTM variants.
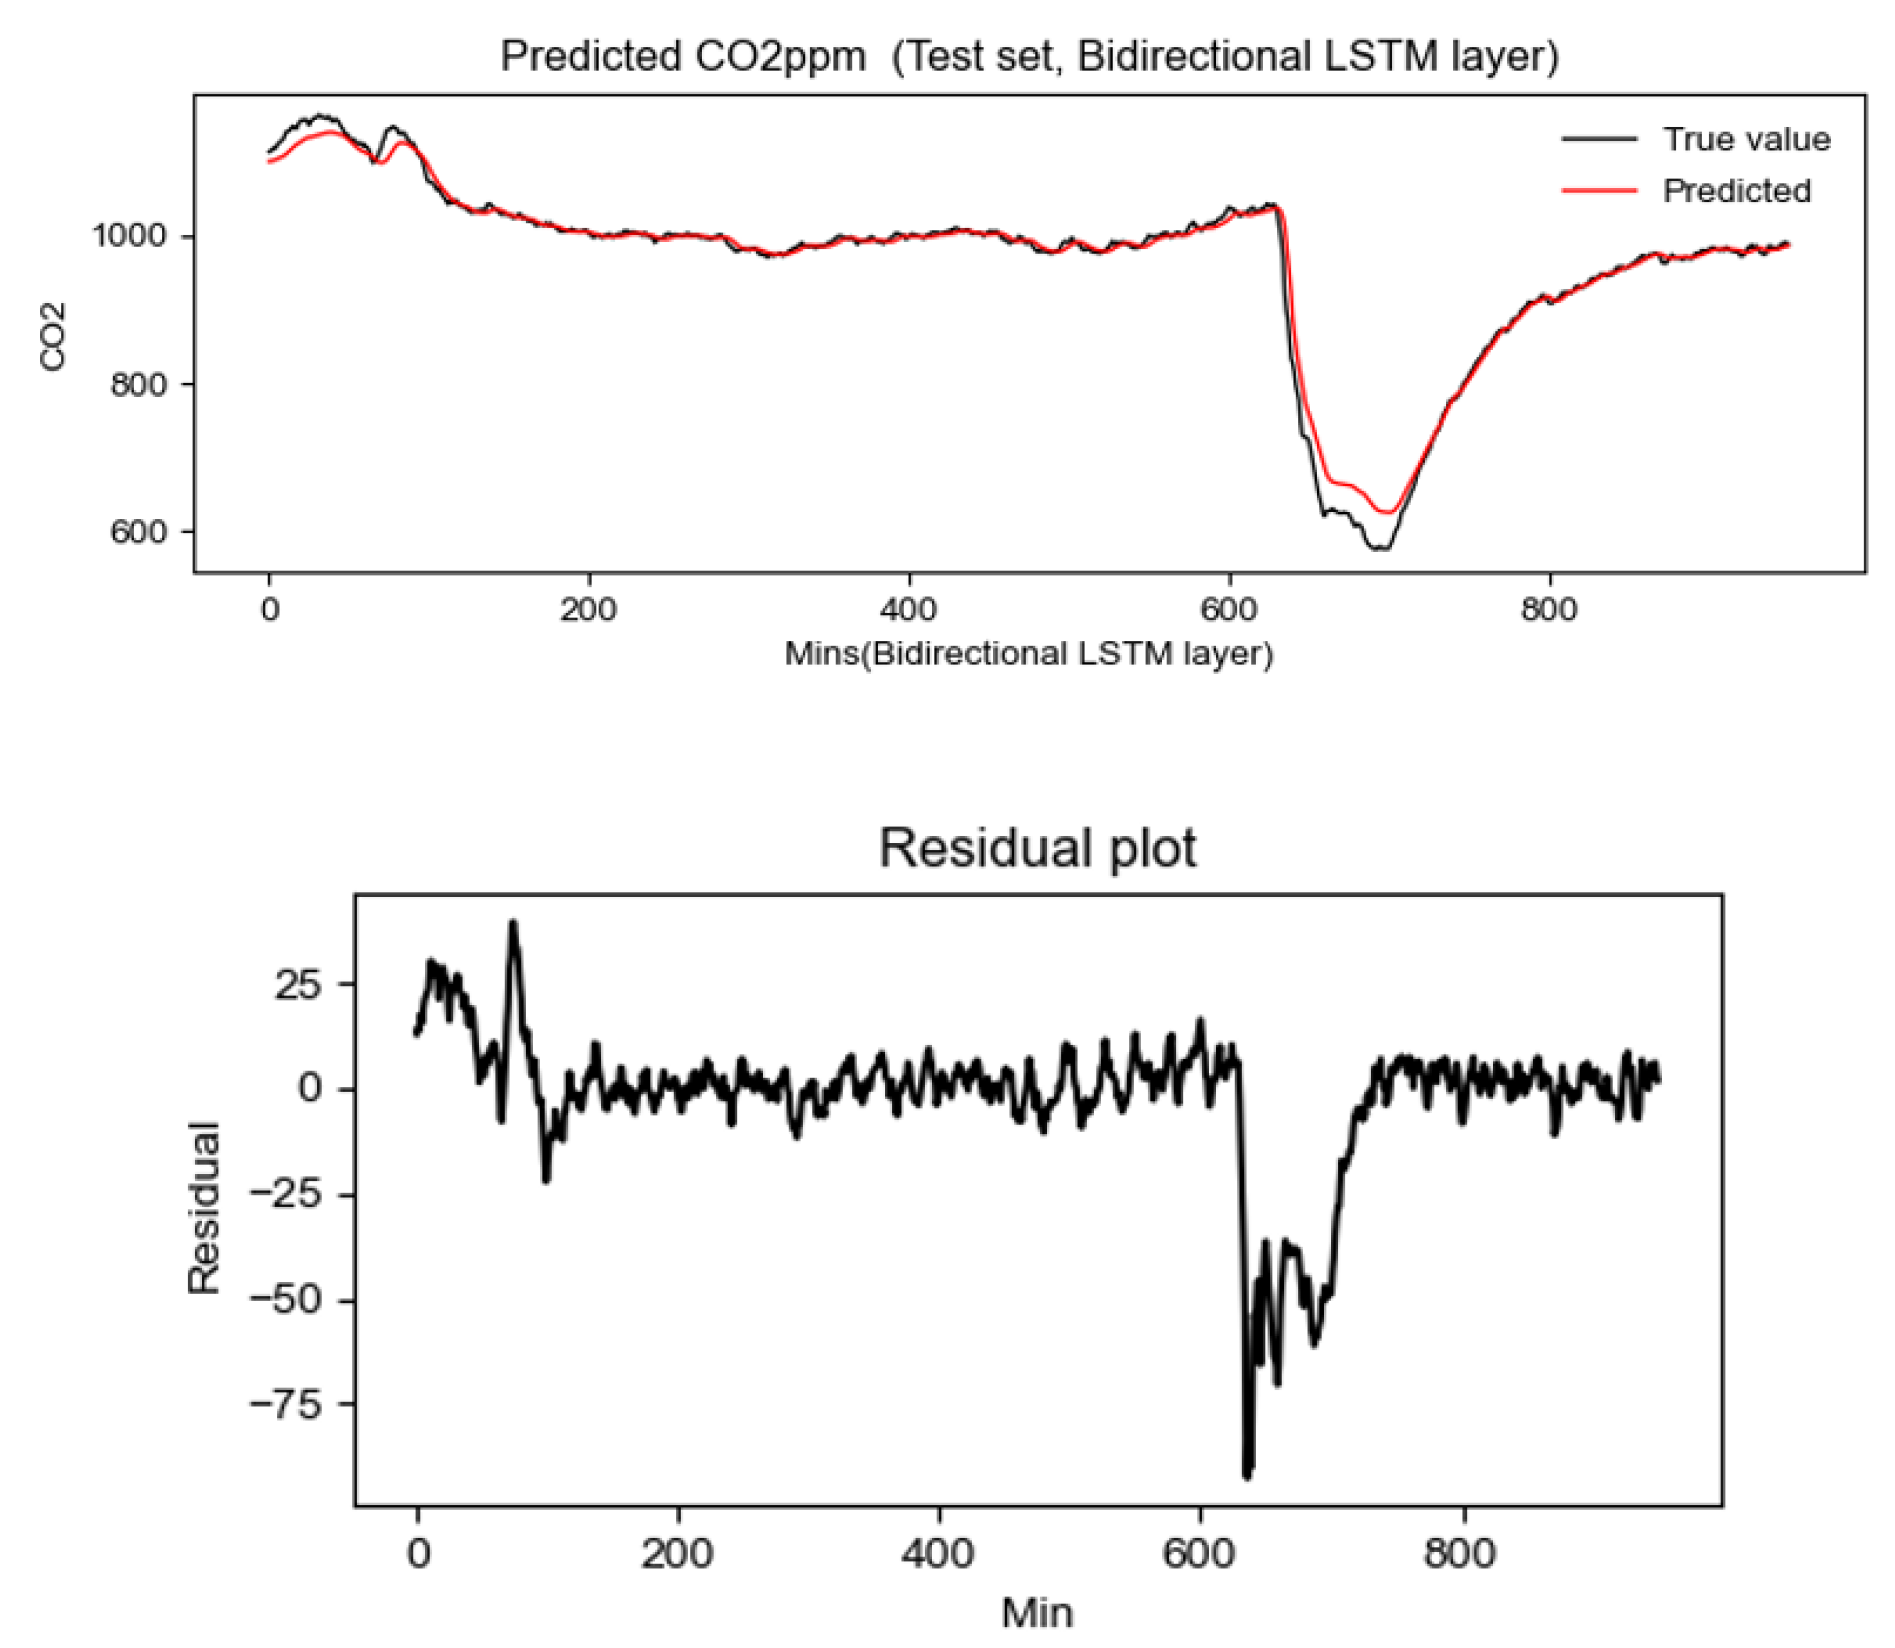
In Figure 7, the result of using bidirectional LSTM is presented. As can be seen in the first 600 data points, the prediction effect is decent; however, there is a noticeable deviation between the predicted value and the test value as a result of the rapid decline in CO 2 concentration. Moreover, the residual value increases rapidly during this time period which indicates that although this LSTM model had reasonable prediction results for stable and slow-changing data, it still has some limitations concerning fast-changing data.
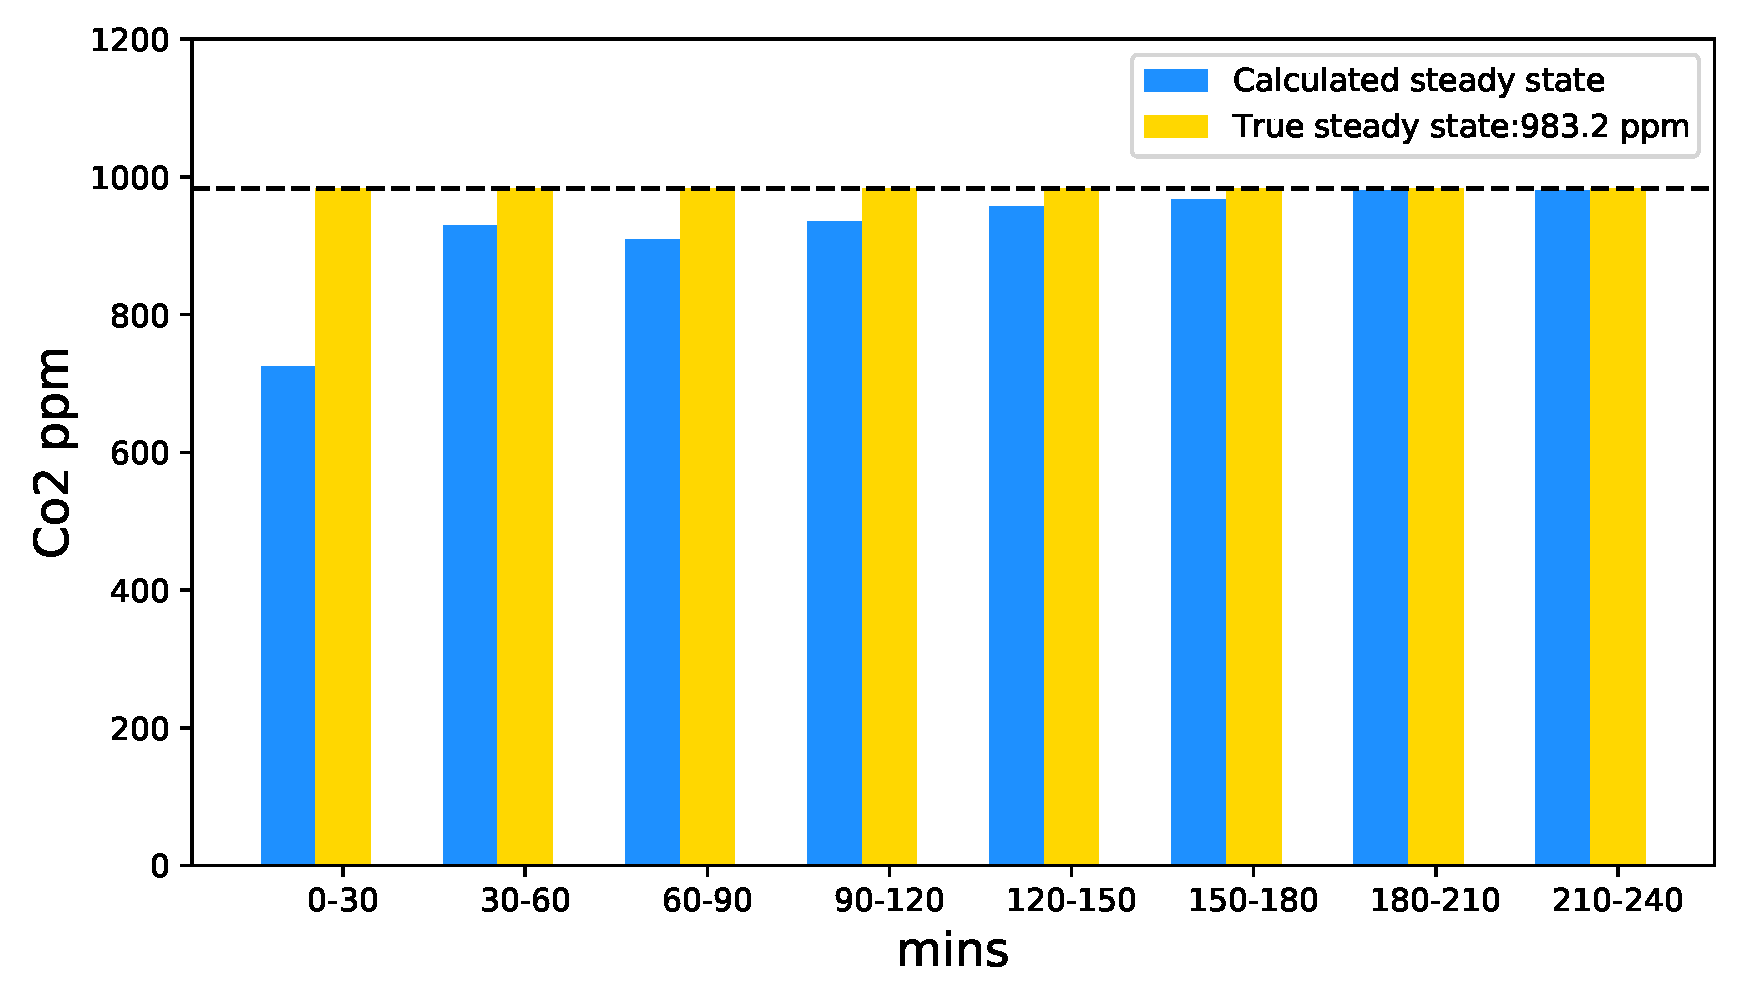
Based on the predicted values from the bidirectional LSTM model, we collected each 21 data points into a group. A moving window with a time step of one was used. A steady-state value of CO 2 can be calculated by selecting the first, eleventh and twenty-first data points in accordance with Equation (3). Because the steady-state value of a single calculation fluctuates greatly, we averaged every 30 steady-state values and calculated the steady-state value every 30 minutes over a total period of 4 hours.
The results are shown in Figure 8 where yellow bars represent the real-world, steady-state value of CO 2 , while blue bars represent the predicted steady-state value. The steady-state value calculated in the first half hour of the experiment differed substantially from the actual value, because CO 2 concentration increased rapidly at the beginning, and the predicted curve did not match the ideal change function of CO 2 . During the second half hour, the calculated steady-state value of CO 2 was 928.7 ppm. This value has a margin of error of 5.5% when compared with the real steady-state value. After the third half hour, the steady-state value was 908.8 ppm and the error rate was 7.6%. In the bar chart, it can be seen that the calculated steady-state value becomes closer to the real-world value over time. The steady-state values calculated in the last two bars were 980.5 ppm and 979.7 ppm, respectively.

6. Conclusions

Monitoring IAQ and CO 2 levels is crucial for ensuring the health and safety of occupants, especially in the wake of the COVID-19 pandemic. Poor IAQ can lead to a range of health problems, including respiratory issues and headaches, while high levels of ambient CO 2 can lead to drowsiness and impaired cognitive function. By applying a prediction model for indoor IAQ monitoring, building managers can ensure in advance that indoor spaces are adequately ventilated and free from harmful pollutants, which can help prevent the spread of COVID-19 and other illnesses. This work presents an implementation of IAQ monitoring in real time integrating both IoT and AI technologies. For this purpose, we employed CO 2 measurement data to conduct our analysis. These data were fed into the deep learning LSTM model to predict the expected concentration level of CO 2 . This prediction was combined with the steady-state equation to achieve CO 2 steady-state concentration.
One limitation of this work is that it relies on regularly calibrating and maintaining the sensors in order to ensure the accuracy and reliability of the measurements. Additionally, the airflow rate G in this model is assumed as a constant parameter; however, it can vary over time in real-world conditions due to factors such as indoor and outdoor pressure and wind pressure. This can lead to changes in the measured steady-state value, which can be significant and require careful control of the airflow rate to ensure accuracy. As a result, this assumption may limit the accuracy of the model. As part of future work, additional parameters will be considered such as temperature and humidity, to better observe their relationship with CO 2 and enhance accuracy. Moreover, multi-step LSTM prediction can be added as a training step to further enhance accuracy.

Author Contributions

Conceptualization, Y.Z. and M.Z.S.; methodology, Y.Z.; software, Y.Z.; validation, Y.Z.; formal analysis, Y.Z.; investigation, Y.Z.; resources, Y.Z. and M.Z.S.; data curation, Y.Z.; writing—original draft preparation, Y.Z. and S.A.A.-A.; writing—review and editing, Y.Z., S.A.A.-A. and J.I.O.; visualization, Y.Z.; supervision, Y.Z. All authors have read and agreed to the published version of the manuscript.

Funding

There is no funding to report regarding the findings of this research.

Data Availability Statement

Data available upon request.

Conflicts of Interest

The authors declare no conflict of interest.

References

  1. Klepeis, N.E.; Nelson, W.C.; Ott, W.R.; Robinson, J.P.; Tsang, A.M.; Switzer, P.; Behar, J.V.; Hern, S.C.; Engelmann, W.H. The National Human Activity Pattern Survey (NHAPS): A resource for assessing exposure to environmental pollutants. J. Expo. Sci. Environ. Epidemiol. 2001, 11, 231–252. [Google Scholar] [CrossRef] [PubMed] [Green Version]
  2. Hazlegreaves, S. Britain Becomes Indoor Nation as Average Brit Spends 53 Years of Their Lives Inside, 2018. Available online: https://www.openaccessgovernment.org/britain-becomes-indoor-nation/49636/ (accessed on 30 October 2022).
  3. Mumtaz, R.; Zaidi, S.M.H.; Shakir, M.Z.; Shafi, U.; Malik, M.M.; Haque, A.; Mumtaz, S.; Zaidi, S.A.R. Internet of things (IoT) based indoor air quality sensing and predictive analytic—A COVID-19 perspective. Electronics 2021, 10, 184. [Google Scholar] [CrossRef]
  4. He, J.; Xu, L.; Wang, P.; Wang, Q. A high precise E-nose for daily indoor air quality monitoring in living environment. Integration 2017, 58, 286–294. [Google Scholar] [CrossRef]
  5. El-Sharkawy, M.F.; Noweir, M.E. Indoor air quality levels in a University Hospital in the Eastern Province of Saudi Arabia. J. Fam. Community Med. 2014, 21, 39. [Google Scholar] [CrossRef] [PubMed] [Green Version]
  6. Maduranga, M.; Kosgahakumbura, K.; Karunarathna, G. Design of an IoT based indoor air quality monitoring system. In Proceedings of the National Engineering Research Symposium (NERS 2020); 2020; Volume 1, pp. 117–122. Available online: http://ir.kdu.ac.lk/handle/345/4437 (accessed on 21 December 2022).
  7. Satish, U.; Mendell, M.J.; Shekhar, K.; Hotchi, T.; Sullivan, D.; Streufert, S.; Fisk, W.J. Is CO2 an indoor pollutant? Direct effects of low-to-moderate CO2 concentrations on human decision-making performance. Environ. Health Perspect. 2012, 120, 1671–1677. [Google Scholar] [CrossRef] [Green Version]
  8. Allen, J.G.; MacNaughton, P.; Satish, U.; Santanam, S.; Vallarino, J.; Spengler, J.D. Associations of cognitive function scores with carbon dioxide, ventilation, and volatile organic compound exposures in office workers: A controlled exposure study of green and conventional office environments. Environ. Health Perspect. 2016, 124, 805–812. [Google Scholar] [CrossRef] [Green Version]
  9. Persily, A. Challenges in developing ventilation and indoor air quality standards: The story of ASHRAE Standard 62. Build. Environ. 2015, 91, 61–69. [Google Scholar] [CrossRef]
  10. Peng, Z.; Jimenez, J.L. Exhaled CO2 as a COVID-19 infection risk proxy for different indoor environments and activities. Environ. Sci. Technol. Lett. 2021, 8, 392–397. [Google Scholar] [CrossRef]
  11. Rudnick, S.; Milton, D. Risk of indoor airborne infection transmission estimated from carbon dioxide concentration. Indoor Air 2003, 13, 237–245. [Google Scholar] [CrossRef] [PubMed]
  12. Franco, A.; Leccese, F. Measurement of CO2 concentration for occupancy estimation in educational buildings with energy efficiency purposes. J. Build. Eng. 2020, 32, 101714. [Google Scholar] [CrossRef]
  13. Wei, Y.; Wang, S.; Jin, L.; Xu, Y.; Ding, T. Indoor occupancy estimation from carbon dioxide concentration using parameter estimation algorithms. Build. Serv. Eng. Res. Technol. 2022, 43, 01436244211060903. [Google Scholar] [CrossRef]
  14. Jiang, C.; Masood, M.K.; Soh, Y.C.; Li, H. Indoor occupancy estimation from carbon dioxide concentration. Energy Build. 2016, 131, 132–141. [Google Scholar] [CrossRef] [Green Version]
  15. Pedersen, T.H.; Nielsen, K.U.; Petersen, S. Method for room occupancy detection based on trajectory of indoor climate sensor data. Build. Environ. 2017, 115, 147–156. [Google Scholar] [CrossRef]
  16. Erickson, V.; Cerpa, O. Occupancy-based system for efficient reduction of HVAC energy. In Proceedings of the 10th International Conference on Information Processing in Sensor Networks (IPSN’11), Stockholm, Sweden, 12–16 April 2010. [Google Scholar]
  17. Persily, A.K. Indoor carbon dioxide concentrations in ventilation and indoor air quality standards. In Proceedings of the 36th AIVC Conference Effective Ventilation in High Performance Buildings, Madrid, Spain, 23–24 September 2015; pp. 810–819. [Google Scholar]
  18. EN 13779; Ventilation for Non-Residential buildings–Performance Requirements for Ventilation and Room-Conditioning Systems. European Committee for Standardization (CEN): London, UK, 2007.
  19. Congradac, V.; Kulic, F. HVAC system optimization with CO2 concentration control using genetic algorithms. Energy Build. 2009, 41, 571–577. [Google Scholar] [CrossRef]
  20. Tekler, Z.D.; Chong, A. Occupancy prediction using deep learning approaches across multiple space types: A minimum sensing strategy. Build. Environ. 2022, 226, 109689. [Google Scholar] [CrossRef]
  21. Tekler, Z.D.; Ono, E.; Peng, Y.; Zhan, S.; Lasternas, B.; Chong, A. ROBOD, room-level occupancy and building operation dataset. In Building Simulation; Springer: Berlin/Heidelberg, Germany, 2022; Volume 15, pp. 2127–2137. [Google Scholar]
  22. Pastor-Fernández, A.; Cerezo-Narváez, A.; Montero-Gutiérrez, P.; Ballesteros-Pérez, P.; Otero-Mateo, M. Use of Low-Cost Devices for the Control and Monitoring of CO2 Concentration in Existing Buildings after the COVID Era. Appl. Sci. 2022, 12, 3927. [Google Scholar] [CrossRef]
  23. Tagliabue, L.C.; Cecconi, F.R.; Rinaldi, S.; Ciribini, A.L.C. Data driven indoor air quality prediction in educational facilities based on IoT network. Energy Build. 2021, 236, 110782. [Google Scholar] [CrossRef]
  24. Ahn, J.; Shin, D.; Kim, K.; Yang, J. Indoor air quality analysis using deep learning with sensor data. Sensors 2017, 17, 2476. [Google Scholar] [CrossRef] [Green Version]
  25. Kallio, J.; Tervonen, J.; Räsänen, P.; Mäkynen, R.; Koivusaari, J.; Peltola, J. Forecasting office indoor CO2 concentration using machine learning with a one-year dataset. Build. Environ. 2021, 187, 107409. [Google Scholar] [CrossRef]
  26. Segala, G.; Doriguzzi-Corin, R.; Peroni, C.; Gazzini, T.; Siracusa, D. A practical and adaptive approach to predicting indoor co2. Appl. Sci. 2021, 11, 10771. [Google Scholar] [CrossRef]
  27. Zusman, M.; Gassett, A.J.; Kirwa, K.; Barr, R.G.; Cooper, C.B.; Han, M.K.; Kanner, R.E.; Koehler, K.; Ortega, V.E.; Paine, R., 3rd; et al. Modeling residential indoor concentrations of PM2. 5, NO2, NOx, and secondhand smoke in the Subpopulations and Intermediate Outcome Measures in COPD (SPIROMICS) Air study. Indoor Air 2021, 31, 702–716. [Google Scholar] [CrossRef] [PubMed]
  28. Singh, P.Y. Internet of Things and Nodemcu A review of use of Nodemcu ESP8266 in IoT products. J. Emerg. Technol. Innov. Res. (JETIR) 2019, 1085, 8. [Google Scholar]
  29. Jolles, J.W. Broad-scale applications of the Raspberry Pi: A review and guide for biologists. Methods Ecol. Evol. 2021, 12, 1562–1579. [Google Scholar] [CrossRef]
  30. Kumari, S.; Singh, S.K. Machine learning-based time series models for effective CO2 emission prediction in India. Environ. Sci. Pollut. Res. 2022, 1–16. [Google Scholar] [CrossRef] [PubMed]
  31. Low, R.; Cheah, L.; You, L. Commercial vehicle activity prediction with imbalanced class distribution using a hybrid sampling and gradient boosting approach. IEEE Trans. Intell. Transp. Syst. 2020, 22, 1401–1410. [Google Scholar] [CrossRef]
  32. Li, Y.; Zhu, Z.; Kong, D.; Han, H.; Zhao, Y. EA-LSTM: Evolutionary attention-based LSTM for time series prediction. Knowl.-Based Syst. 2019, 181, 104785. [Google Scholar] [CrossRef] [Green Version]
  33. Calì, D.; Matthes, P.; Huchtemann, K.; Streblow, R.; Müller, D. CO2 based occupancy detection algorithm: Experimental analysis and validation for office and residential buildings. Build. Environ. 2015, 86, 39–49. [Google Scholar] [CrossRef]
  34. Persily, A. Development of an indoor carbon dioxide metric. In Proceedings of the 39th Air Infiltration and Ventilation Centre (AIVC) Conference “Smart Ventilation for Buildings”, Antibes Juan-Les-Pins, France, 18–19 September 2018. [Google Scholar]
  35. Persily, A.; Polidoro, B.J. Residential application of an indoor carbon dioxide metric. In Proceedings of the 40th AIVC—8th TightVent—6th venticool Conference, Gent, Belgium, 15–16 October 2019; pp. 15–16. [Google Scholar]
  36. Hänninen, O. Novel second-degree solution to single zone mass-balance equation improves the use of build-up data in estimating ventilation rates in classrooms. J. Chem. Health Saf. 2013, 20, 14–19. [Google Scholar] [CrossRef]
Figure 1. Architecture of our deployed IAQ monitoring system.
Electronics 12 00107 g001
Figure 2. IAQ monitoring dashboard.
Electronics 12 00107 g002
Figure 3. Trends in indoor CO 2 concentrations.
Electronics 12 00107 g003
Figure 4. CO 2 concentration trend in the bedroom.
Electronics 12 00107 g004
Figure 5. Indoor CO 2 concentration level over 5-day period.
Electronics 12 00107 g005
Figure 6. Forecasting CO 2 steady-state concentration level.
Electronics 12 00107 g006
Figure 7. Results of the overall prediction and residual plot.
Electronics 12 00107 g007
Figure 8. Steady-state prediction for CO 2 .
Electronics 12 00107 g008
Table 1. LSTM simulation hyperparameters for three variants.
HyperparameterSingle CellStackedBidirectional
Layers121
Timestamps101010
Slide window111
Hidden units3232, 6432
Dropout0.50.50.5
Activation functionrelurelurelu
Loss functionMSEMSEMSE
OptimizerAdamAdamAdam
Table 2. Performance evaluation.
MSERMSER2MAE
Single Layer482.3221.960.96819.46
Two layers371.3519.270.97513.80
Bidirectional281.2416.770.9818.95
Disclaimer/Publisher’s Note: The statements, opinions and data contained in all publications are solely those of the individual author(s) and contributor(s) and not of MDPI and/or the editor(s). MDPI and/or the editor(s) disclaim responsibility for any injury to people or property resulting from any ideas, methods, instructions or products referred to in the content.