
Advanced Intrusion Detection Combining Signature-Based and Behavior-Based Detection Methods †


Abstract
:1. Introduction
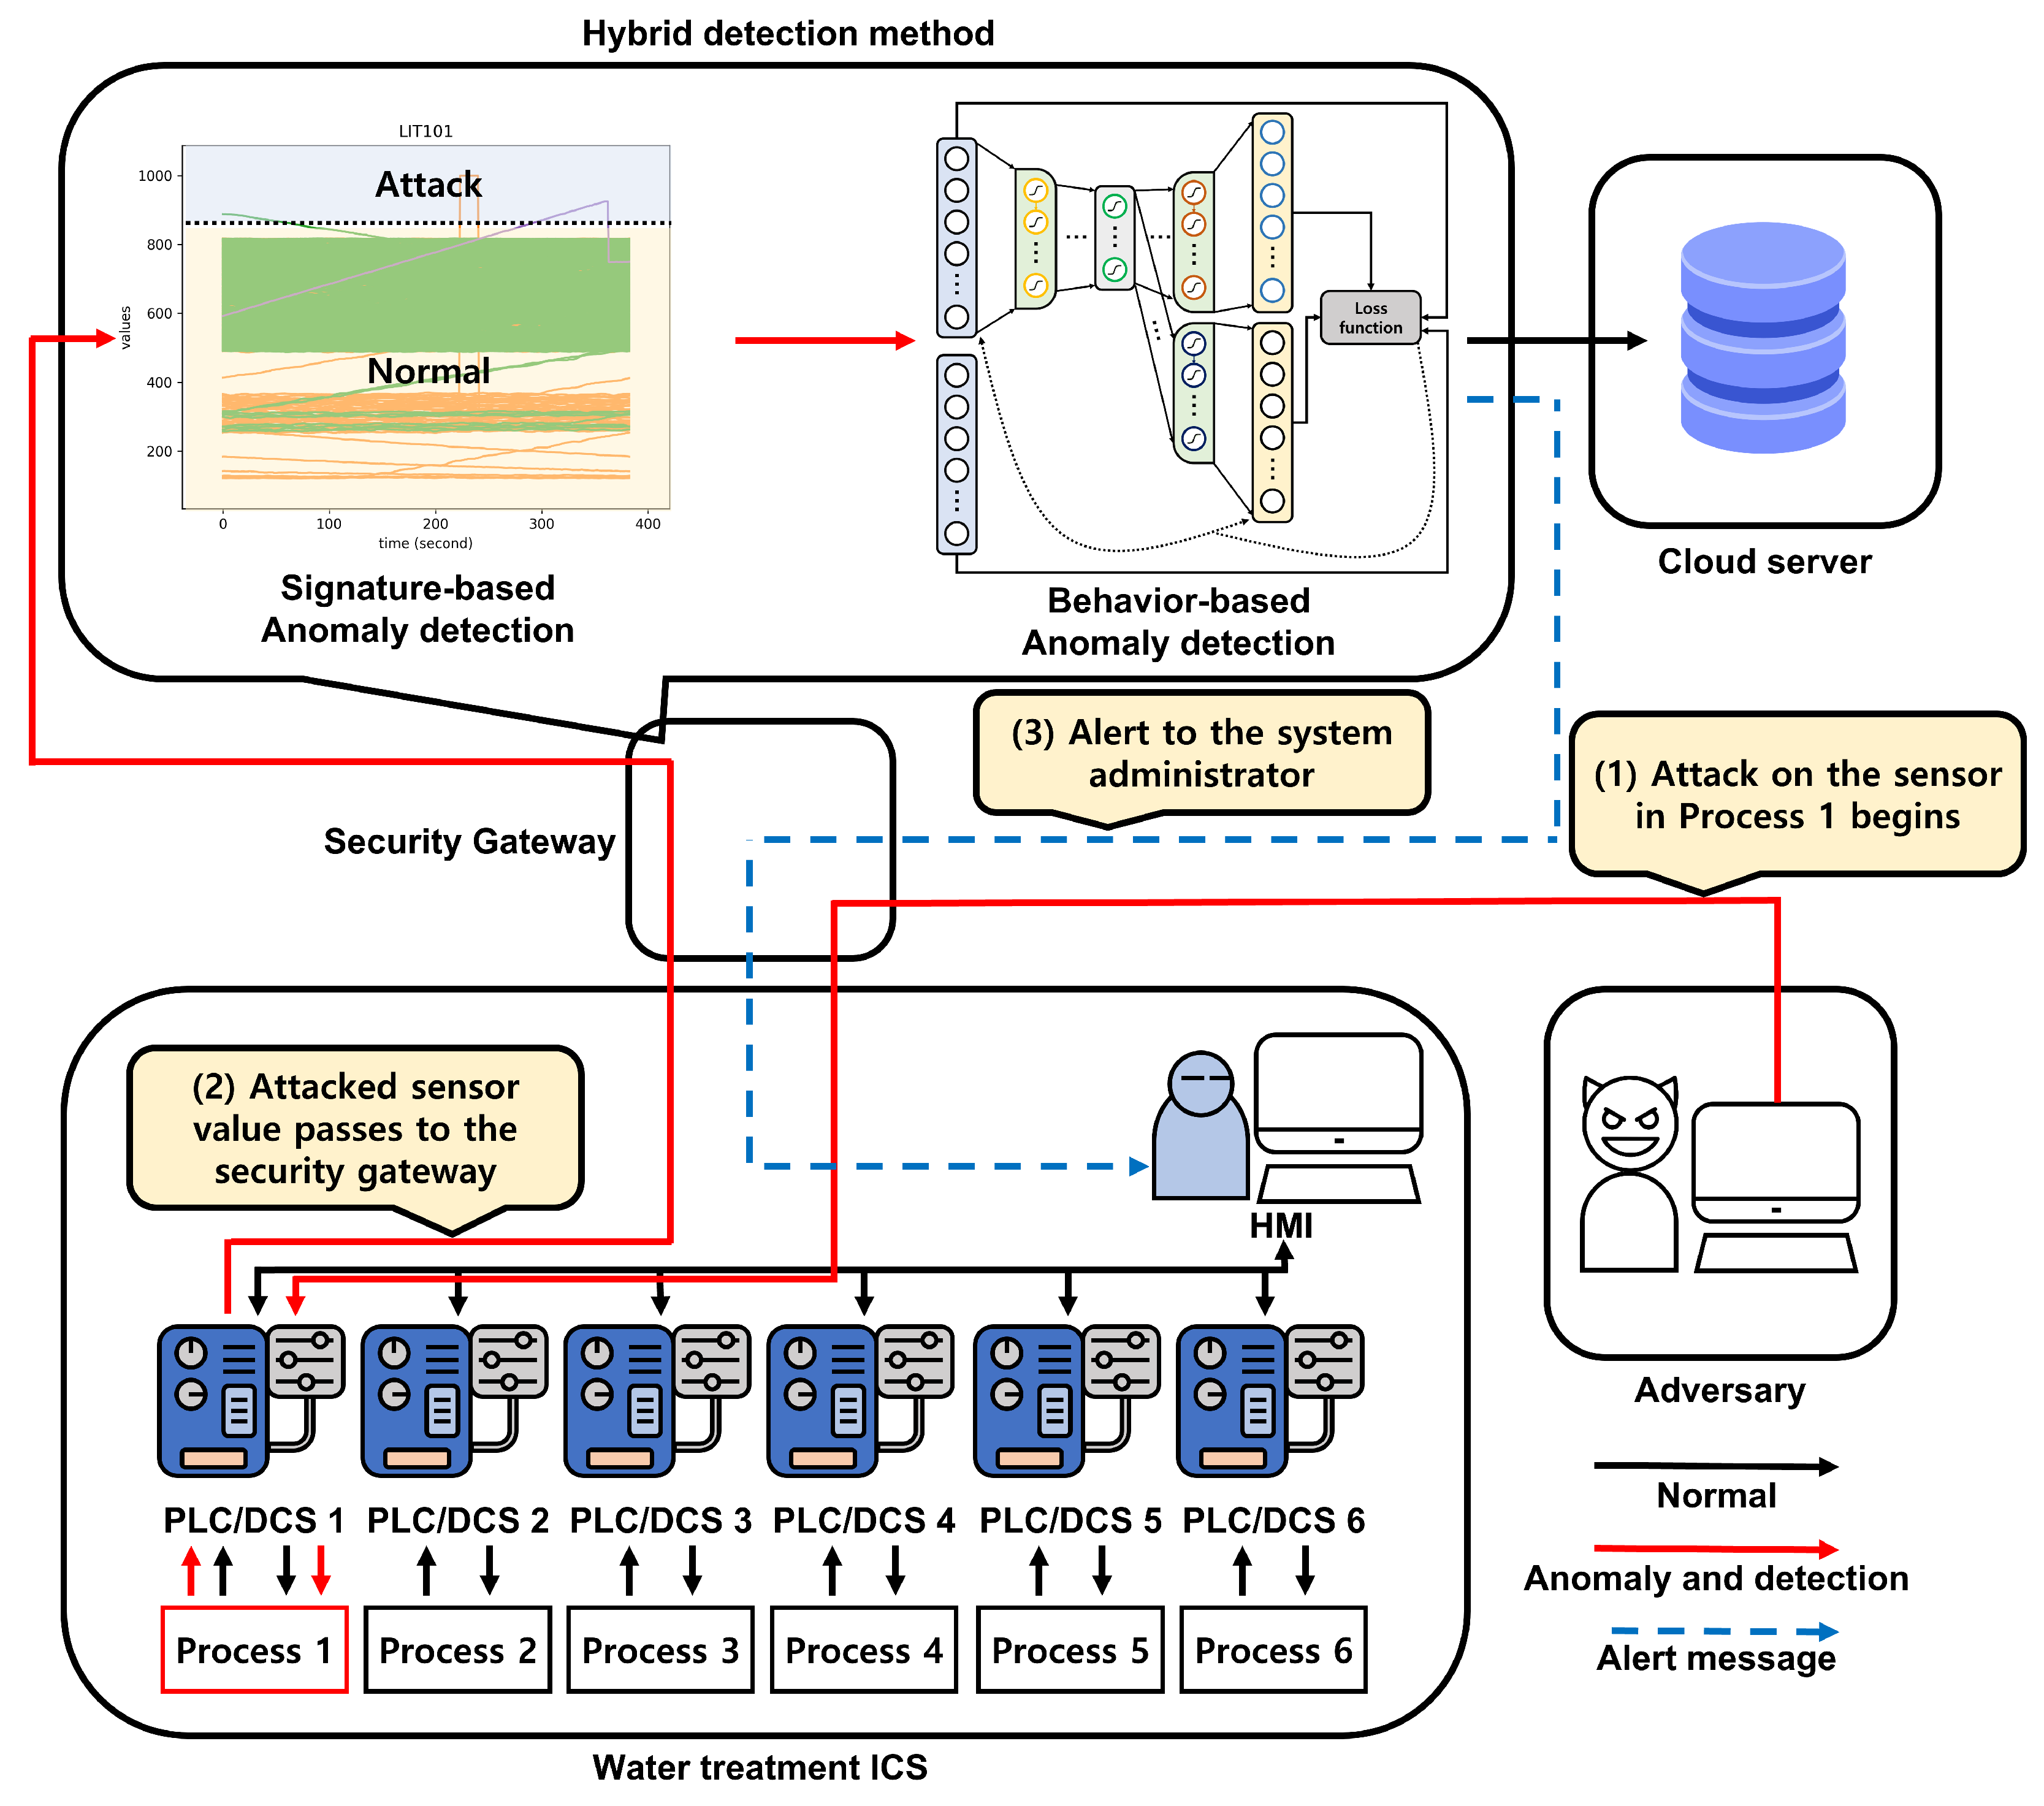
- We propose a hybrid anomaly detection method that combines signature- and behavior-based methods to improve detection performance. For the signature-based detection, we used the standard deviations computed from normal data as the classification criteria;
- We evaluate the detection performance of the proposed method and present experimental results demonstrating that it outperformed the existing autoencoder-only method on the secure water treatment (SWaT) dataset. In addition, we compare the performance of the proposed method to those of previous detection methods that applied various machine learning approaches;
- We evaluate the execution time of the proposed method and demonstrate that it significantly accelerated the detection task compared to the previous autoencoder-only method. We proved the efficiency of the proposed method using a generalized numerical analysis.
2. Related Works
2.1. Network Intrusion Detection
2.2. Network Intrusion Datasets
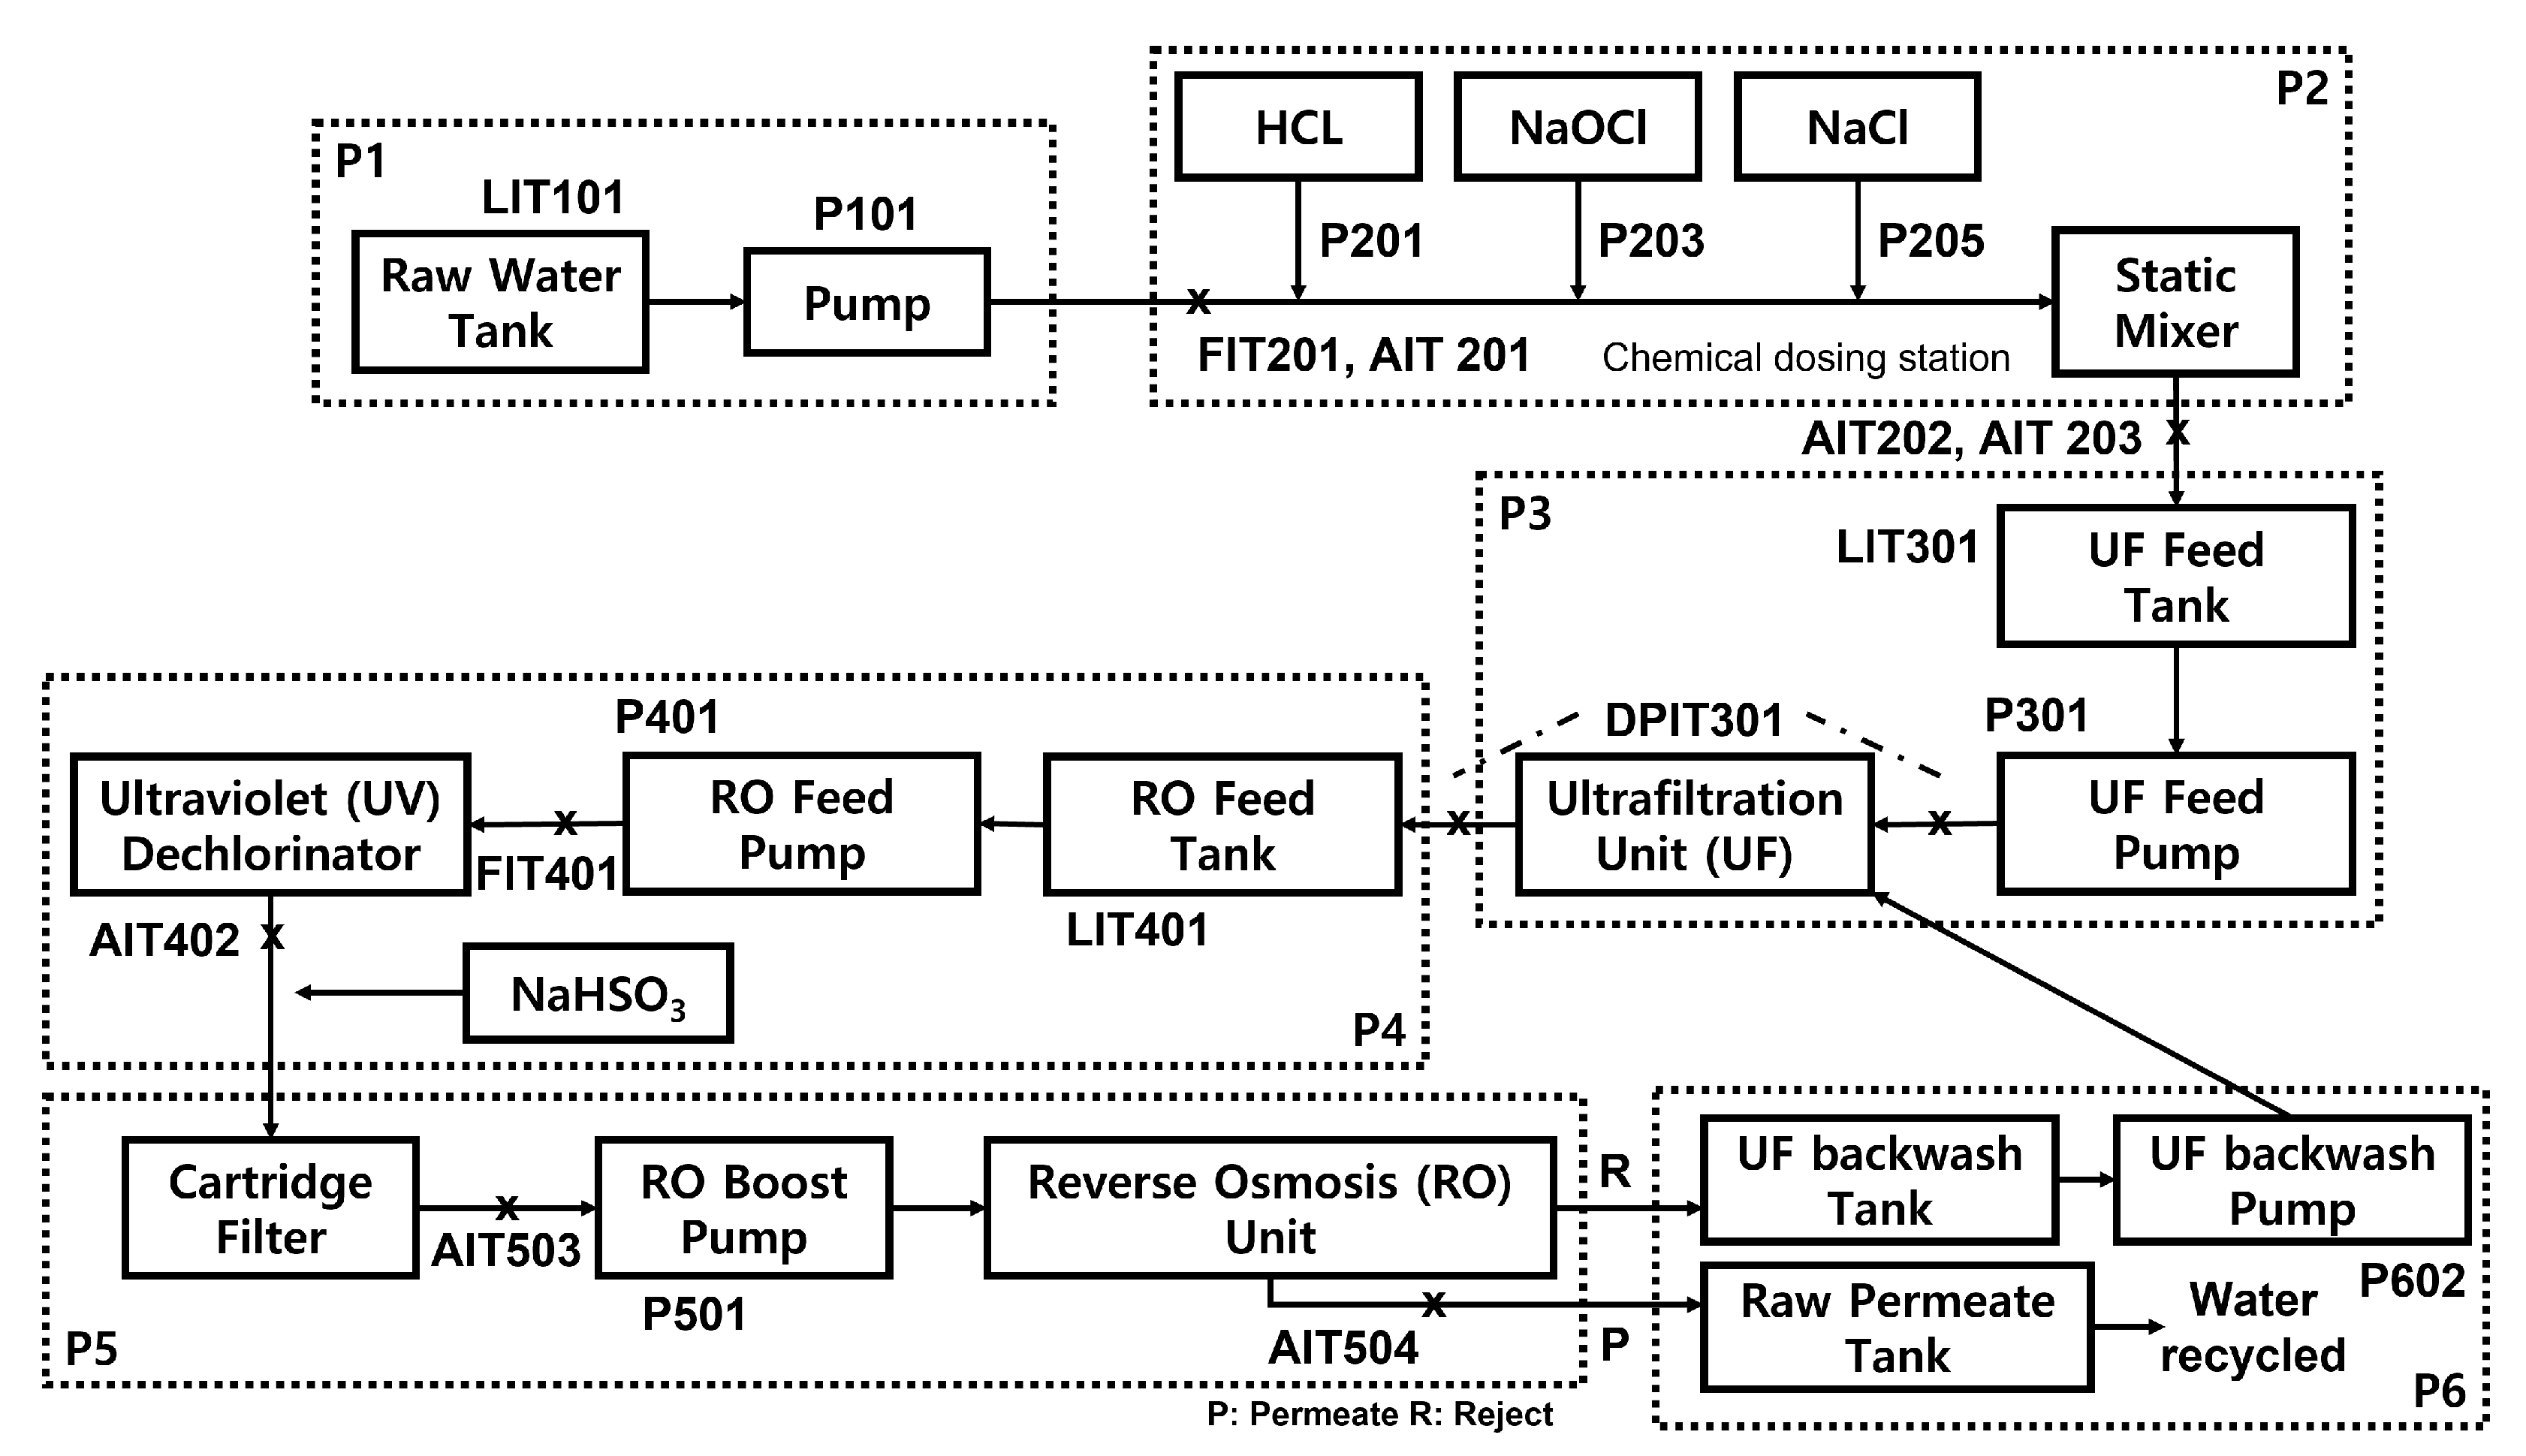
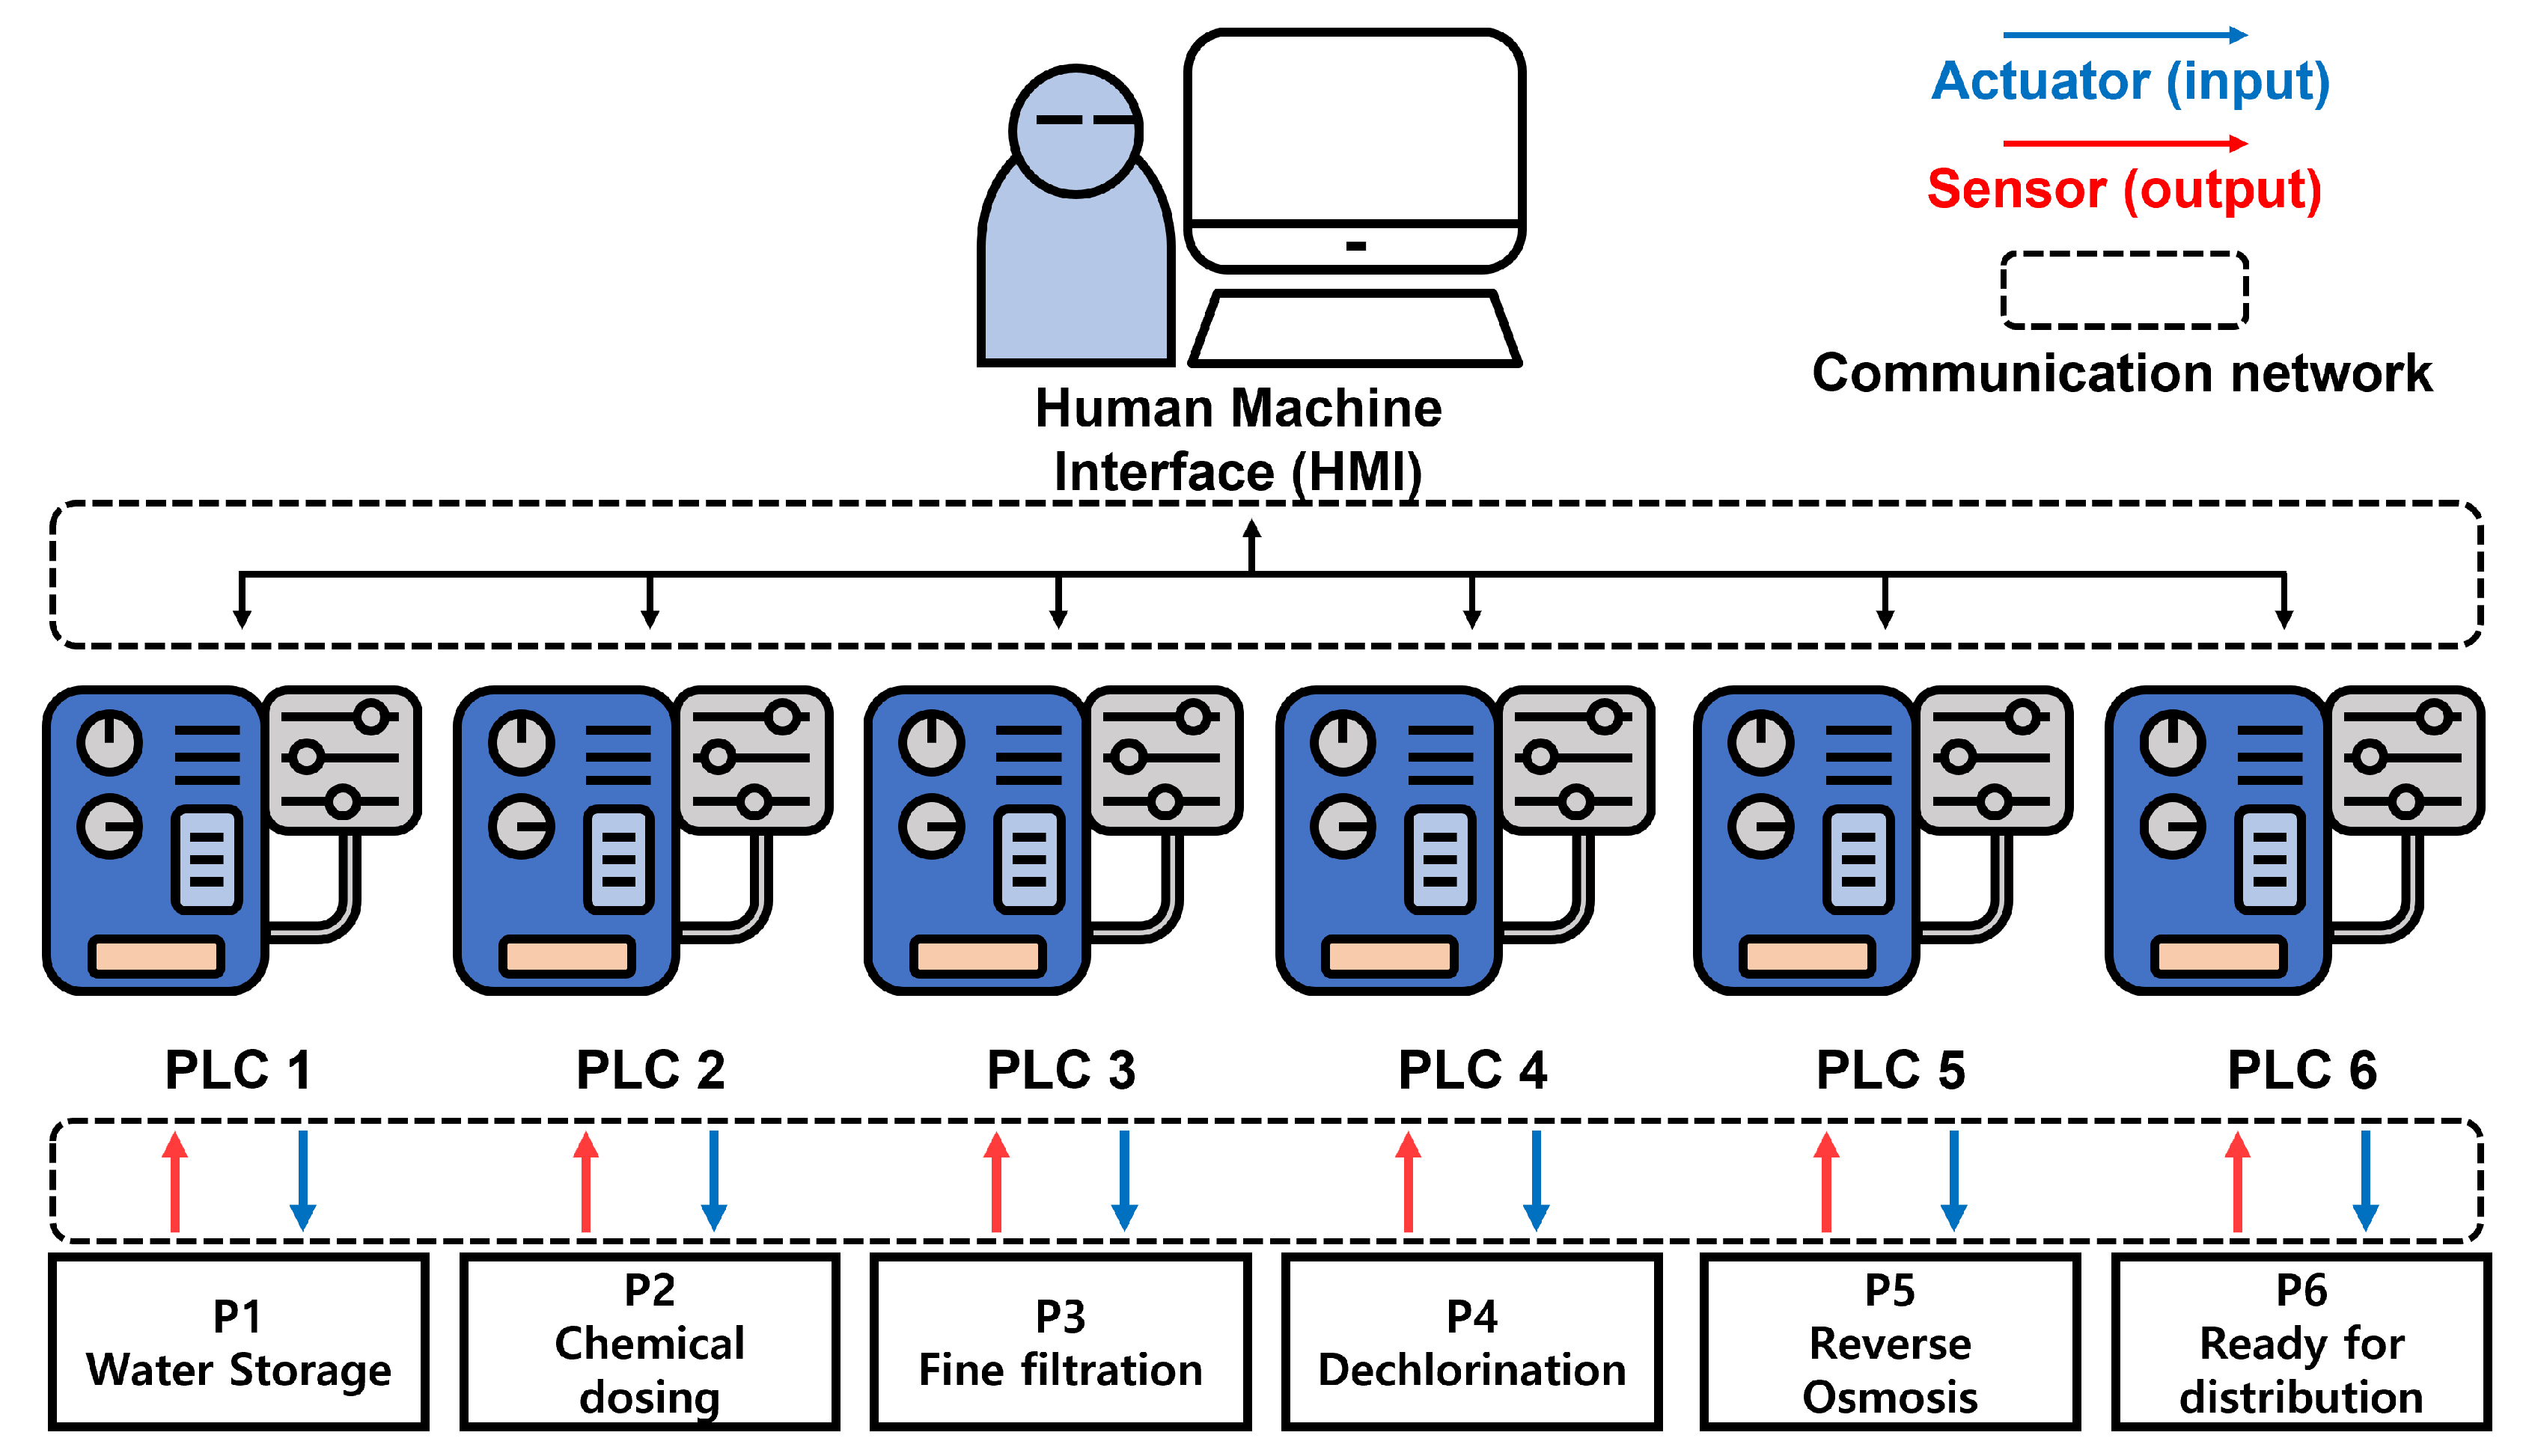
2.3. Water Treatment ICS
- P1: (Water storage) Raw water is collected and stored in a tank;
- P2: (Chemical dosing) When the quality of the water is not within acceptable limits, chemical dosing is performed;
- P3: (Fine filtration) Undesirable materials are removed using fine filtration membranes;
- P4: (Dechlorination) The remaining chlorine is largely destroyed using ultraviolet lamps;
- P5: (Reverse osmosis) Inorganic impurities are reduced using a reverse osmosis system;
- P6: (Ready for distribution) Potable water is stored in a specialized tank and is then ready for distribution.
- Single Stage Single Point (SSSP): an attack on a single sensor/actuator value in any single stage (e.g., Attack 1 on LIT101 in P1 stage);
- Single Stage Multi-Point (SSMP): an attack on multiple sensor/actuator values in any single stage (e.g., Attack 16 on MV101 and LIT101 in P1 stage);
- Multi-Stage Single Point (MSSP): an attack on a single sensor/actuator value over multiple stages (e.g., Attack 21 on P101 in P1 stage and LIT301 in P3 stage);
- Multi-Stage Multi-Point (MSMP): an attack on multiple sensor/actuator values over multiple stages (e.g., Attack 17 on UV401 in P4 stage and AIT502, P501 in P5 stage).
2.4. Composite Autoencoder
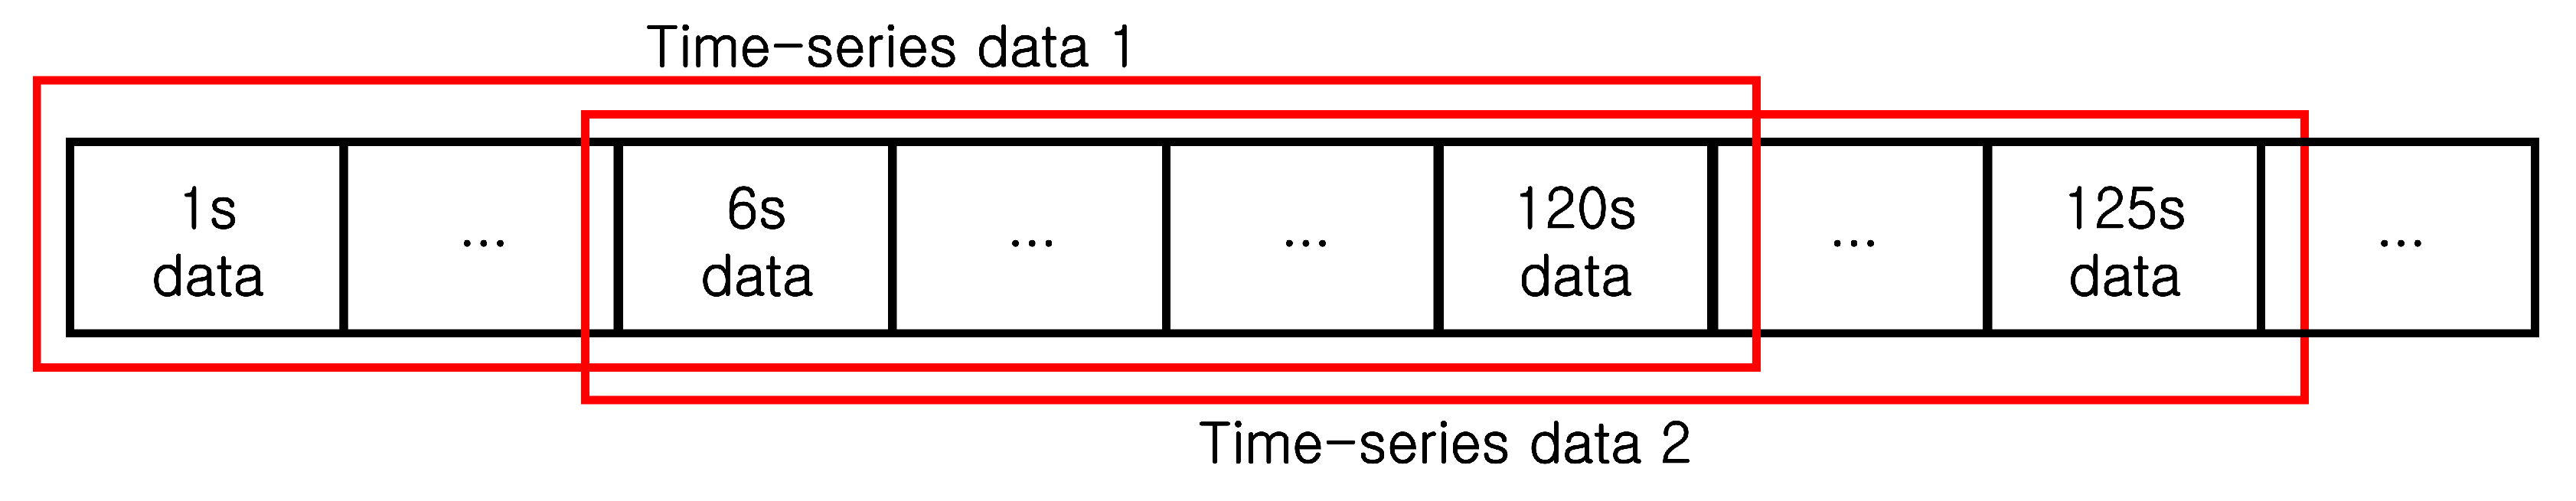
3. Proposed Method
4. Implementation and Validation
- #Neurons in encoder layers 1 and 2: 64 and 32, respectively;
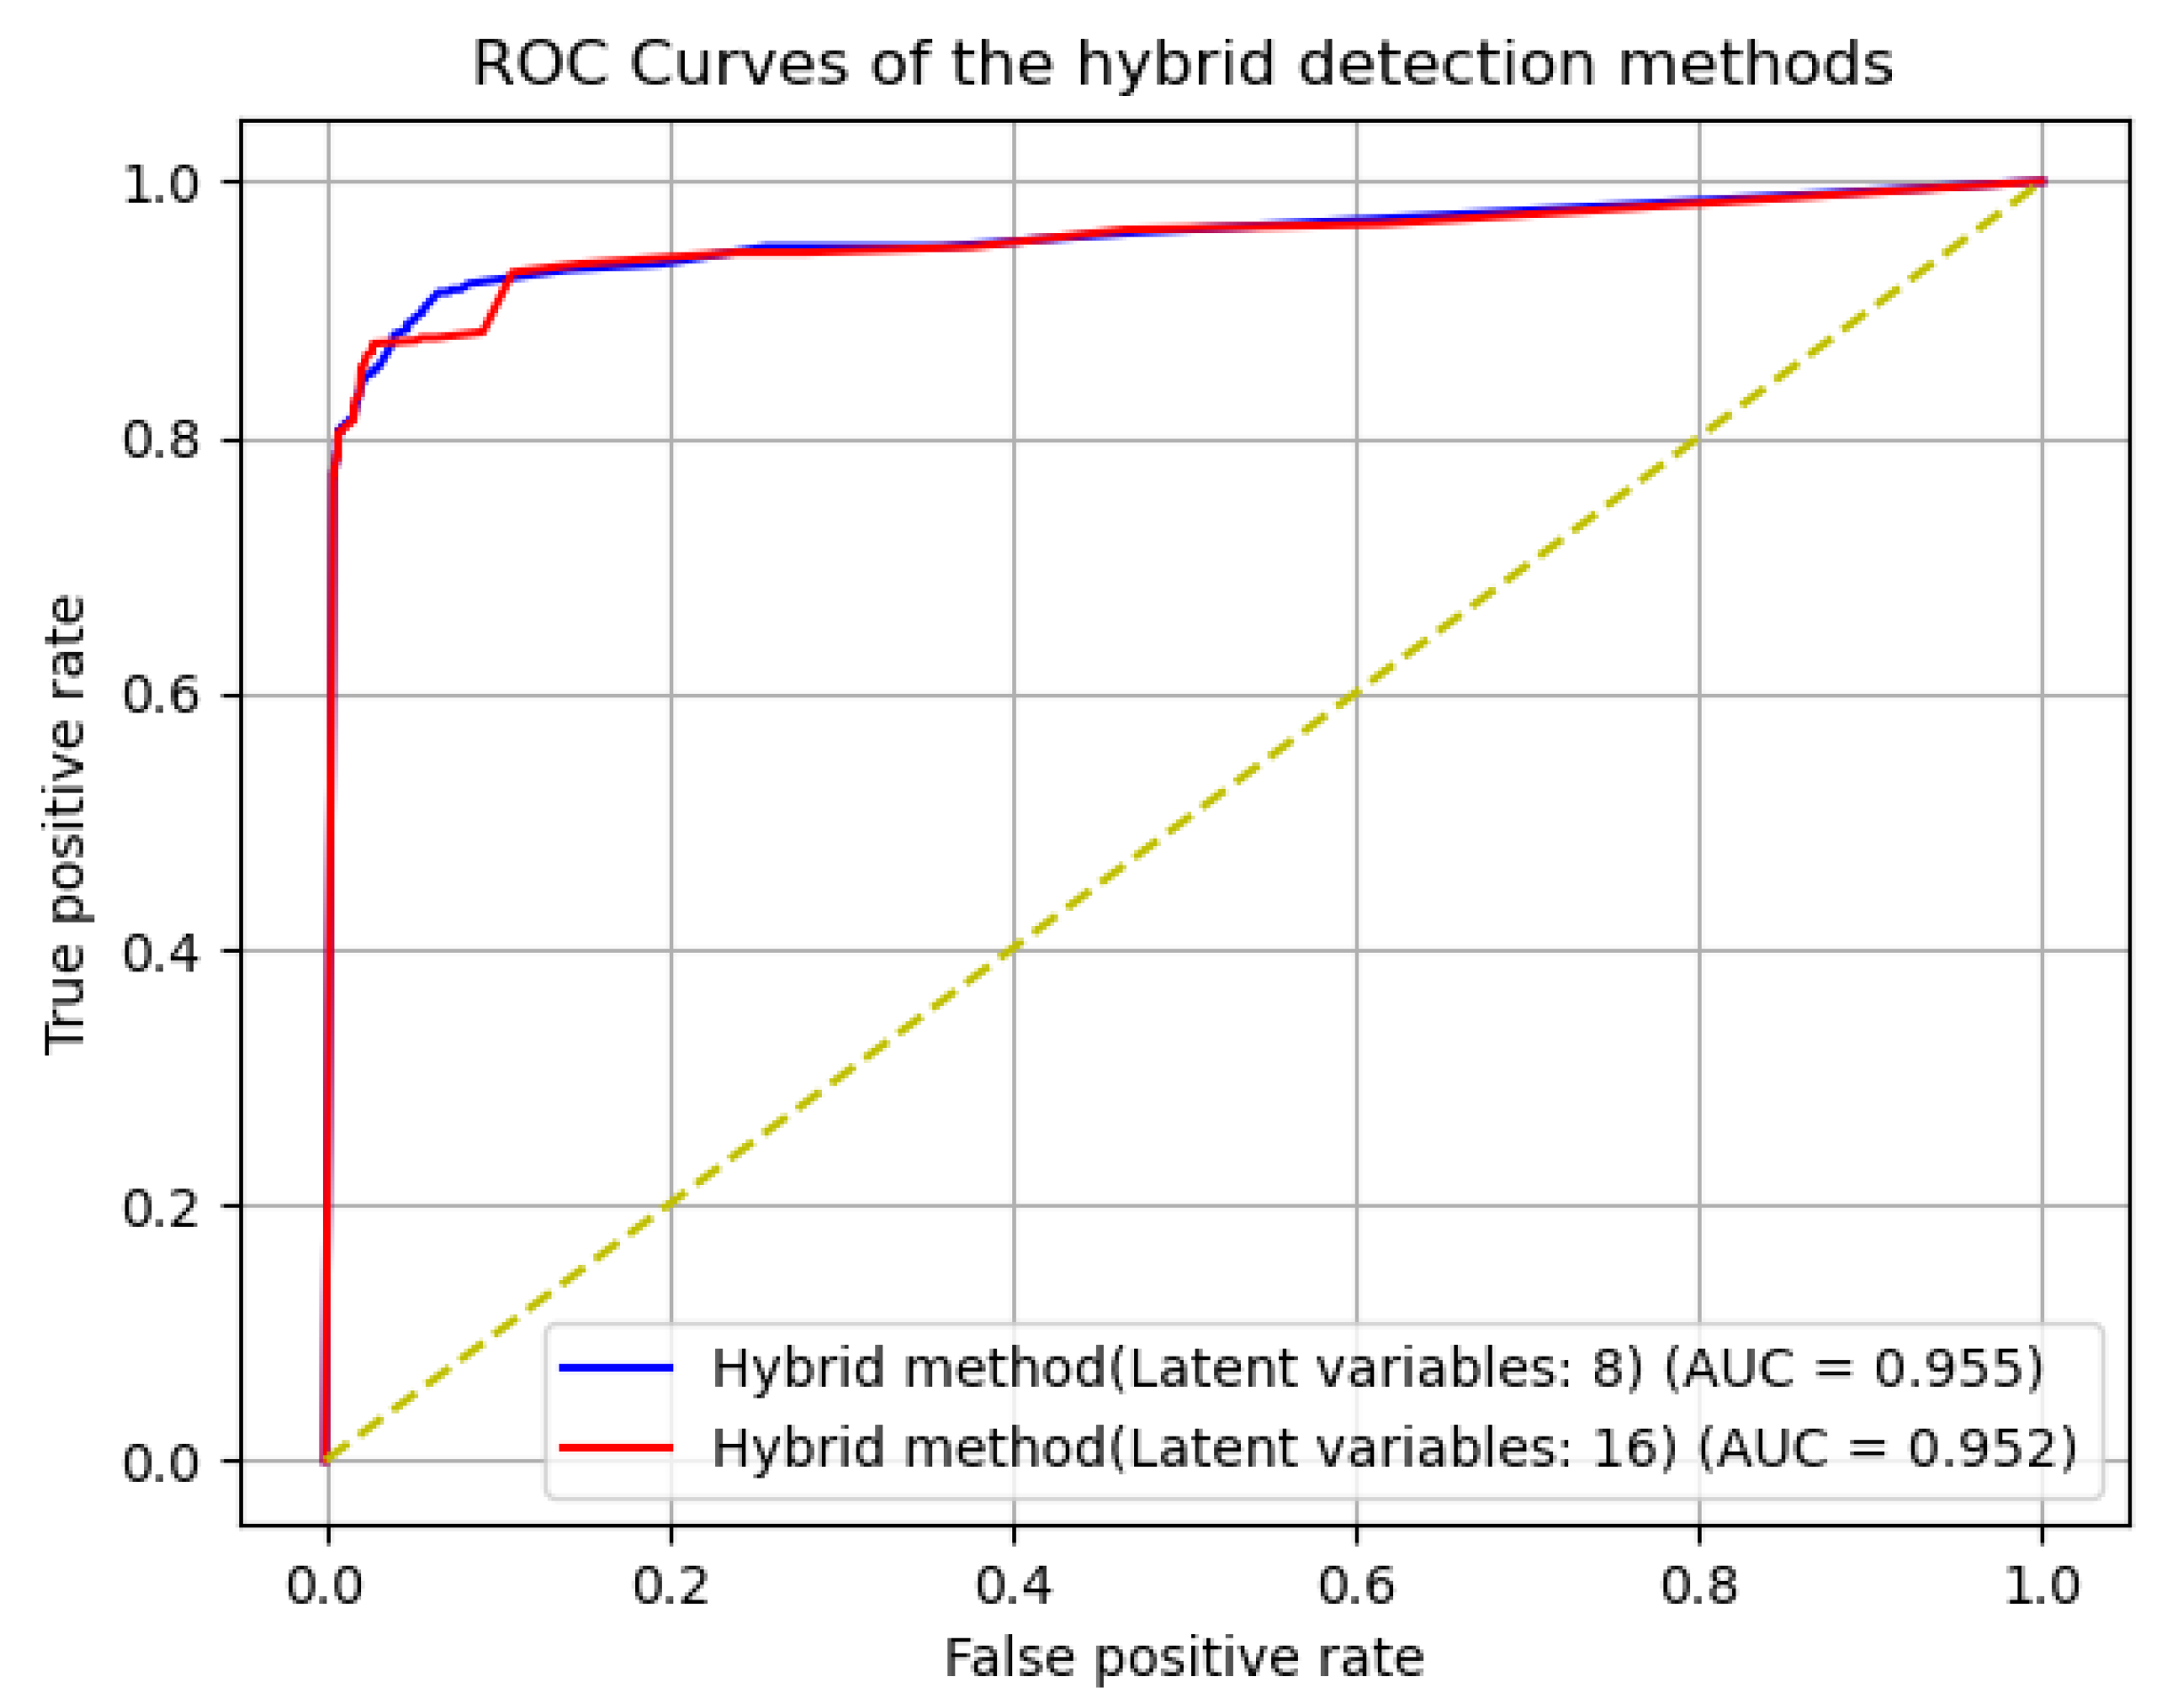
- #Neurons in latent variables: either 8 or 16 (we provided two versions.);
- #Neurons in decoder layers 1 and 2: 32 and 64, respectively;
- Activation function: hyperbolic tangent;
- Loss function: mean squared error;
- Optimizer: Adam optimizer.
5. Discussion and Limitations
6. Conclusions
Author Contributions
Funding
Data Availability Statement
Acknowledgments
Conflicts of Interest
Abbreviations
| AE | Autoencoder |
| APT | Advanced Persistent Threats |
| AUC | Area Under Curve |
| CAE | Composite Autoencoder |
| CPS | Cyber-Physical System |
| DCS | Distributed Control System |
| DNN | Deep Neural Network |
| DoS | Denial of Service |
| EWMA | Exponentially Weighted Moving Average |
| FN | False Negative |
| FP | False Positive |
| GA | Genetic Algorithms |
| HIDS | Host-based Intrusion Detection System |
| HIL | Hardware-in-the-Loop |
| HMI | Human–Machine Interface |
| ICS | Industrial Control System |
| IDS | Intrusion Detection system |
| IoT | Internet of Things |
| LAN | Local Area Network |
| LSTM | Long Short-Term Memory |
| MSMP | Multi-Stage Multi-Point |
| MSSP | Multi-Stage Single Point |
| NIDS | Network-based Intrusion Detection System |
| PCL | Process Control Loop |
| PLC | Programmable Logic Controller |
| ROC | Receiver Operating Characteristic |
| SCADA | Supervisory Control and Data Acquisition |
| SSMP | Single Stage Multi-Point |
| SSSP | Single Stage Single Point |
| SVM | Support Vector Machine |
| SWaT | Secure Water Treatment |
| TCP | Transmission Control Protocol |
| TN | True Negative |
| TP | True Positive |
References
- Farwell, J.P.; Rohozinski, R. Stuxnet and the future of cyber war. Survival 2011, 53, 23–40. [Google Scholar] [CrossRef]
- Greenberg, A. The untold story of NotPetya, the most devastating cyberattack in history. Wired. 22 August 2018. Available online: https://www.wired.com/story/notpetya-cyberattack-ukraine-russia-code-crashed-the-world/ (accessed on 6 January 2022).
- Nardozza, A. Unpacking an Unprecedented Cyberattack: What Is the SolarWinds Breach and How Did It Happen? Available online: https://jost.syr.edu/unpacking-an-unprecedented-cyberattack-what-is-the-solarwinds-breach-and-how-did-it-happen/#_ftn3 (accessed on 6 January 2022).
- DRAGOS. EKANS Ransomware and ICS Operations. Available online: https://www.dragos.com/blog/industry-news/ekans-ransomware-and-ics-operations/# (accessed on 6 January 2022).
- Constantin, L. Ryuk Ransomware Explained: A Targeted, Devastatingly Effective Attack. Available online: https://www.csoonline.com/article/3541810/ryuk-ransomware-explained-a-targeted-devastatingly-effective-attack.html (accessed on 6 January 2022).
- Weston, S. Evidence Suggests REvil Behind Harris Federation Ransomware Attack. Available online: https://www.itpro.co.uk/security/ransomware/359161/evidence-suggests-revil-behind-harris-federation-ransomware-attack (accessed on 6 January 2022).
- Cybersecurity & Infrastructure Security Agency. DarkSide Ransomware: Best Practices for Preventing Business Disruption from Ransomware Attacks. Available online: https://www.cisa.gov/uscert/ncas/alerts/aa21-131a (accessed on 6 January 2022).
- Aminanto, M.E.; Kim, K. Improving detection of Wi-Fi impersonation by fully unsupervised deep learning. In Proceedings of the International Workshop on Information Security Applications, Jeju Island, Korea, 11–13 August 2021; Springer: Berlin/Heidelberg, Germany, 2017; pp. 212–223. [Google Scholar]
- Park, K.H.; Park, E.; Kim, H.K. Unsupervised Intrusion Detection System for Unmanned Aerial Vehicle with Less Labeling Effort. In Proceedings of the International Conference on Information Security Applications, Jeju Island, Korea, 26–28 August 2020; Springer: Berlin/Heidelberg, Germany, 2020; pp. 45–58. [Google Scholar]
- An, J.; Cho, S. Variational autoencoder based anomaly detection using reconstruction probability. Spec. Lect. IE 2015, 2, 1–18. [Google Scholar]
- Wang, C.; Wang, B.; Liu, H.; Qu, H. Anomaly detection for industrial control system based on autoencoder neural network. Wirel. Commun. Mob. Comput. 2020, 2020, 8897926. [Google Scholar] [CrossRef]
- Chang, C.P.; Hsu, W.C.; Liao, I.E. Anomaly detection for industrial control systems using k-means and convolutional autoencoder. In Proceedings of the 2019 International Conference on Software, Telecommunications and Computer Networks (SoftCOM), Split, Croatia, 19–21 September 2019; pp. 1–6. [Google Scholar]
- Kwon, H.Y.; Kim, T.; Lee, M.K. A Hybrid Intrusion Detection Method for Industrial Control Systems. In Proceedings of the 7th International Conference on Next Generation Computing 2021 (ICNGC 2021), Jeju, Korea, 26–27 March 2021; pp. 95–99. [Google Scholar]
- Song, J.Y.; Paul, R.; Yun, J.H.; Kim, H.C.; Choi, Y.J. CNN-based anomaly detection for packet payloads of industrial control system. Int. J. Sens. Netw. 2021, 36, 36–49. [Google Scholar] [CrossRef]
- Liu, F.T.; Ting, K.M.; Zhou, Z.H. Isolation forest. In Proceedings of the 2008 Eighth IEEE International Conference on Data Mining, Pisa, Italy, 15–19 December 2008; pp. 413–422. [Google Scholar]
- Kiss, I.; Haller, P.; Bereş, A. Denial of service attack detection in case of tennessee eastman challenge process. Procedia Technol. 2015, 19, 835–841. [Google Scholar] [CrossRef] [Green Version]
- LinkedIn. LinkedIn’s Anomaly Detection and Correlation Library. Available online: https://github.com/linkedin/luminol (accessed on 17 February 2022).
- Toldinas, J.; Venčkauskas, A.; Damaševičius, R.; Grigaliūnas, Š.; Morkevičius, N.; Baranauskas, E. A novel approach for network intrusion detection using multistage deep learning image recognition. Electronics 2021, 10, 1854. [Google Scholar] [CrossRef]
- Malhotra, P.; Vig, L.; Shroff, G.; Agarwal, P. Long short term memory networks for anomaly detection in time series. In Proceedings of the 23rd European Symposium on Artificial Neural Networks, ESANN 2015, Bruges, Belgium, 22–24 April 2015; Volume 89, pp. 89–94. [Google Scholar]
- Malhotra, P.; Ramakrishnan, A.; Anand, G.; Vig, L.; Agarwal, P.; Shroff, G. LSTM-based encoder-decoder for multi-sensor anomaly detection. arXiv 2016, arXiv:1607.00148. [Google Scholar]
- Lee, T.J.; Gottschlich, J.; Tatbul, N.; Metcalf, E.; Zdonik, S. Greenhouse: A zero-positive machine learning system for time-series anomaly detection. arXiv 2018, arXiv:1801.03168. [Google Scholar]
- Martí, L.; Sanchez-Pi, N.; Molina, J.M.; Garcia, A.C.B. Anomaly detection based on sensor data in petroleum industry applications. Sensors 2015, 15, 2774–2797. [Google Scholar] [CrossRef] [PubMed] [Green Version]
- Filonov, P.; Lavrentyev, A.; Vorontsov, A. Multivariate industrial time series with cyber-attack simulation: Fault detection using an lstm-based predictive data model. arXiv 2016, arXiv:1612.06676. [Google Scholar]
- Kim, J.; Yun, J.H.; Kim, H.C. Anomaly detection for industrial control systems using sequence-to-sequence neural networks. In Computer Security; Springer: Berlin/Heidelberg, Germany, 2019; pp. 3–18. [Google Scholar]
- Goh, J.; Adepu, S.; Junejo, K.N.; Mathur, A. A dataset to support research in the design of secure water treatment systems. In Proceedings of the International Conference on Critical Information Infrastructures Security, Paris, France, 10–12 October 2016; Springer: Berlin/Heidelberg, Germany, 2016; pp. 88–99. [Google Scholar]
- Hettich, S.; Bay, S.D. The UCI KDD Archive. 1999. Available online: http://kdd.ics.uci.edu (accessed on 6 January 2022).
- Lemay, A.; Fernandez, J.M. Providing SCADA network data sets for intrusion detection research. In Proceedings of the 9th Workshop on Cyber Security Experimentation and Test (CSET 16), Austin, TX, USA, 8 August 2016. [Google Scholar]
- Morris, T.; Gao, W. Industrial control system traffic data sets for intrusion detection research. In Proceedings of the International Conference on Critical Infrastructure Protection, Arlington, VA, USA, 17–19 March 2014; Springer: Berlin/Heidelberg, Germany, 2014; pp. 65–78. [Google Scholar]
- Morris, T.H.; Thornton, Z.; Turnipseed, I. Industrial control system simulation and data logging for intrusion detection system research. In Proceedings of the 7th Annual Southeastern Cyber Security Summit, Huntsville, AL, USA, 3–4 June 2015; pp. 3–4. [Google Scholar]
- Shin, H.K.; Lee, W.; Yun, J.H.; Kim, H. HAI 1.0:HIL-based Augmented ICS Security Dataset. In Proceedings of the 13th USENIX Workshop on Cyber Security Experimentation and Test (CSET 20), Boston, MA, USA, 10 August 2020. [Google Scholar]
- Goh, J.; Adepu, S.; Tan, M.; Lee, Z.S. Anomaly detection in cyber physical systems using recurrent neural networks. In Proceedings of the 2017 IEEE 18th International Symposium on High Assurance Systems Engineering (HASE), Singapore, 12–14 January 2017; pp. 140–145. [Google Scholar]
- Lin, Q.; Adepu, S.; Verwer, S.; Mathur, A. TABOR: A graphical model-based approach for anomaly detection in industrial control systems. In Proceedings of the 2018 on Asia Conference on Computer and Communications Security, Incheon, Korea, 4 June 2018; pp. 525–536. [Google Scholar]
- Mieden, P.; Beltman, R. Network Anomaly Detection in Modbus TCP Industrial Control Systems. Available online: https://dreadl0ck.net/papers/RP1_paper.pdf (accessed on 6 January 2022).
- Li, D.; Chen, D.; Jin, B.; Shi, L.; Goh, J.; Ng, S.K. MAD-GAN: Multivariate anomaly detection for time series data with generative adversarial networks. In Proceedings of the International Conference on Artificial Neural Networks, Munich, Germany, 17–19 September 2019; Springer: Berlin/Heidelberg, Germany, 2019; pp. 703–716. [Google Scholar]
- Kravchik, M.; Shabtai, A. Detecting cyber attacks in industrial control systems using convolutional neural networks. In Proceedings of the 2018 Workshop on Cyber-Physical Systems Security and PrivaCy, Toronto, ON, Canada, 15–19 October 2018; pp. 72–83. [Google Scholar]
- Wang, Y.; Yao, H.; Zhao, S. Auto-encoder based dimensionality reduction. Neurocomputing 2016, 184, 232–242. [Google Scholar] [CrossRef]
- Fournier, Q.; Aloise, D. Empirical comparison between autoencoders and traditional dimensionality reduction methods. In Proceedings of the 2019 IEEE Second International Conference on Artificial Intelligence and Knowledge Engineering (AIKE), Sardinia, Italy, 3–5 June 2019; pp. 211–214. [Google Scholar]
- LeCun, Y.; Cortes, C. MNIST Handwritten Digit Database. 2010. Available online: http://yann.lecun.com/exdb/mnist (accessed on 6 January 2022).
- Jones, C.B.; Chavez, A.R.; Darbali-Zamora, R.; Hossain-McKenzie, S. Implementation of intrusion detection methods for distributed photovoltaic inverters at the grid-edge. In Proceedings of the 2020 IEEE Power & Energy Society Innovative Smart Grid Technologies Conference (ISGT), Washington, DC, USA, 17–20 February 2020; pp. 1–5. [Google Scholar]
- Srivastava, N.; Mansimov, E.; Salakhudinov, R. Unsupervised learning of video representations using lstms. PMLR 2015, 37, 843–852. [Google Scholar]
- Bank, D.; Koenigstein, N.; Giryes, R. Autoencoders. arXiv 2020, arXiv:2003.05991. [Google Scholar]
- Huang, L.; Zhu, Q. A dynamic games approach to proactive defense strategies against advanced persistent threats in cyber-physical systems. Comput. Secur. 2020, 89, 101660. [Google Scholar] [CrossRef] [Green Version]
- Xiang, Y.; Ding, Z.; Zhang, Y.; Wang, L. Power system reliability evaluation considering load redistribution attacks. IEEE Trans. Smart Grid 2016, 8, 889–901. [Google Scholar] [CrossRef]
- Tatbul, N.; Lee, T.J.; Zdonik, S.; Alam, M.; Gottschlich, J. Precision and recall for time series. Adv. Neural Inf. Process. Syst. 2018, 31, 1924–1934. [Google Scholar]
- Hwang, W.S.; Yun, J.H.; Kim, J.; Kim, H.C. Time-series aware precision and recall for anomaly detection: Considering variety of detection result and addressing ambiguous labeling. In Proceedings of the 28th ACM International Conference on Information and Knowledge Management, Beijing, China, 3–7 November 2019; pp. 2241–2244. [Google Scholar]
- Shalyga, D.; Filonov, P.; Lavrentyev, A. Anomaly detection for water treatment system based on neural network with automatic architecture optimization. arXiv 2018, arXiv:1807.07282. [Google Scholar]
- Jin, H.; Song, Q.; Hu, X. Auto-keras: An efficient neural architecture search system. In Proceedings of the 25th ACM SIGKDD International Conference on Knowledge Discovery & Data Mining, Anchorage, AK, USA, 4–8 August 2019; pp. 1946–1956. [Google Scholar]
- Alharbi, A.; Alosaimi, W.; Alyami, H.; Rauf, H.T.; Damaševičius, R. Botnet attack detection using local global best bat algorithm for industrial internet of things. Electronics 2021, 10, 1341. [Google Scholar] [CrossRef]


| True Class | Classified as Anomaly | Classified as Normal |
|---|---|---|
| Anomaly | True Positive (TP) | False Negative (FN) |
| Normal | False Positive (FP) | True Negative (TN) |
| #Neurons of Layers | Anomaly Detection Method | Precision | Recall | F1-Score |
|---|---|---|---|---|
| (64, 32), 8, (32, 64) | CAE-only method | 0.833 | 0.778 | 0.805 |
| Hybrid method 1 [13] | 0.805 | 0.856 | 0.830 | |
| Hybrid method 2 | 0.841 | 0.844 | 0.843 | |
| (64, 32), 16, (32, 64) | CAE-only method | 0.879 | 0.762 | 0.817 |
| Hybrid method 1 [13] | 0.812 | 0.836 | 0.824 | |
| Hybrid method 2 | 0.886 | 0.829 | 0.856 |
| Method | Precision | Recall | F1-Score |
|---|---|---|---|
| Hybrid Method 2 (Latent variables: 16) | 0.886 | 0.829 | 0.856 |
| Deep Neural Network (DNN) | 0.983 | 0.678 | 0.803 |
| Support Vector Machine (SVM) | 0.925 | 0.699 | 0.796 |
| TABOR | 0.862 | 0.788 | 0.823 |
| #Neurons of Layers | Multiplier | Precision | Recall | F1-Score |
|---|---|---|---|---|
| (64, 32), 8, (32, 64) | 1.0 (Baseline) | 0.841 | 0.844 | 0.843 |
| 1.2 | 0.844 | 0.844 | 0.844 | |
| 1.5 | 0.844 | 0.844 | 0.844 | |
| (64, 32), 16, (32, 64) | 1.0 (Baseline) | 0.886 | 0.829 | 0.856 |
| 1.2 | 0.892 | 0.829 | 0.859 | |
| 1.5 | 0.890 | 0.829 | 0.858 |
| #Neurons of Layers | Anomaly Detection Method | Average Time (ms) |
|---|---|---|
| (64, 32), 8, (32, 64) | CAE-only method | 150.082 |
| Hybrid method | 141.812 | |
| (64, 32), 16, (32, 64) | CAE-only method | 149.143 |
| Hybrid method | 137.163 |
Publisher’s Note: MDPI stays neutral with regard to jurisdictional claims in published maps and institutional affiliations. |
© 2022 by the authors. Licensee MDPI, Basel, Switzerland. This article is an open access article distributed under the terms and conditions of the Creative Commons Attribution (CC BY) license (https://creativecommons.org/licenses/by/4.0/).
Share and Cite
Kwon, H.-Y.; Kim, T.; Lee, M.-K. Advanced Intrusion Detection Combining Signature-Based and Behavior-Based Detection Methods. Electronics 2022, 11, 867. https://doi.org/10.3390/electronics11060867
Kwon H-Y, Kim T, Lee M-K. Advanced Intrusion Detection Combining Signature-Based and Behavior-Based Detection Methods. Electronics. 2022; 11(6):867. https://doi.org/10.3390/electronics11060867
Chicago/Turabian StyleKwon, Hee-Yong, Taesic Kim, and Mun-Kyu Lee. 2022. "Advanced Intrusion Detection Combining Signature-Based and Behavior-Based Detection Methods" Electronics 11, no. 6: 867. https://doi.org/10.3390/electronics11060867
APA StyleKwon, H.-Y., Kim, T., & Lee, M.-K. (2022). Advanced Intrusion Detection Combining Signature-Based and Behavior-Based Detection Methods. Electronics, 11(6), 867. https://doi.org/10.3390/electronics11060867