Article

Anomaly Detection on Natural Language Processing to Improve Predictions on Tourist Preferences

by
Jorge Meira
1,2,*,†,
João Carneiro
1,†,
Verónica Bolón-Canedo
2,†,
Amparo Alonso-Betanzos
2,†,
Paulo Novais
3 and
Goreti Marreiros
1
1
GECAD—Research Group on Intelligent Engineering and Computing for Advanced Innovation and Development, Institute of Engineering, Polytechnic of Porto, 4200-072 Porto, Portugal
2
CITIC—Centro de Investigación en Tecnologías de la Información y las Comunicaciones, University of A Coruna, 15071 A Coruna, Spain
3
ALGORITMI Centre, University of Minho, 4800-058 Guimaraes, Portugal
*
Author to whom correspondence should be addressed.
These authors contributed equally to this work.
Electronics 2022, 11(5), 779; https://doi.org/10.3390/electronics11050779
Submission received: 31 January 2022 / Revised: 19 February 2022 / Accepted: 1 March 2022 / Published: 3 March 2022

Abstract

:
Argumentation-based dialogue models have shown to be appropriate for decision contexts in which it is intended to overcome the lack of interaction between decision-makers, either because they are dispersed, they are too many, or they are simply not even known. However, to support decision processes with argumentation-based dialogue models, it is necessary to have knowledge of certain aspects that are specific to each decision-maker, such as preferences, interests, and limitations, among others. Failure to obtain this knowledge could ruin the model’s success. In this work, we sought to facilitate the information acquisition process by studying strategies to automatically predict the tourists’ preferences (ratings) in relation to points of interest based on their reviews. We explored different Machine Learning methods to predict users’ ratings. We used Natural Language Processing strategies to predict whether a review is positive or negative and the rating assigned by users on a scale of 1 to 5. We then applied supervised methods such as Logistic Regression, Random Forest, Decision Trees, K-Nearest Neighbors, and Recurrent Neural Networks to determine whether a tourist likes/dislikes a given point of interest. We also used a distinctive approach in this field through unsupervised techniques for anomaly detection problems. The goal was to improve the supervised model in identifying only those tourists who truly like or dislike a particular point of interest, in which the main objective is not to identify everyone, but fundamentally not to fail those who are identified in those conditions. The experiments carried out showed that the developed models could predict with high accuracy whether a review is positive or negative but have some difficulty in accurately predicting the rating assigned by users. Unsupervised method Local Outlier Factor improved the results, reducing Logistic Regression false positives with an associated cost of increasing false negatives.

1. Introduction

Argumentation-based dialogue models are extremely useful in contexts where a group of agents is intended to find solutions for complex decision problems using negotiation and deliberation mechanisms [1,2,3]. In addition, they allow human decision-makers to understand the reasons that led to a given decision (enhancing the acceptance of decisions) and to define mechanisms for intelligent explanations [4,5]. These models receive the decision-makers’ preferences as input (for instance, regarding criteria and alternatives), which are typically used to model the agents that represent them [6]. However, obtaining these preferences is not a simple process: first, in the contemporary and highly dynamic world in which we live, it is less and less comfortable for decision-makers to answer questionnaires and, second, it is sometimes difficult to express preferences through questionnaires [7,8]. To facilitate this task, strategies that aim to automatically identify the users’ preferences have been proposed. One of these strategies consists in using Machine Learning (ML) algorithms and Natural Language Processing (NLP) to automatically extract from a text corpus the users’ opinions through different strategies such as text wrangling and pre-processing, named entity recognition and sentiment analysis [9,10]. However, there are many algorithms and strategies that can be applied. Therefore, it is mandatory to develop specific procedures according to the application topic, to achieve the best results.
In this work, we studied the problem previously described under the topic of group recommendation systems, more specifically in the context of tourism, in which there has been an increased interest in the development of technologies capable of making recommendations according to the interests of each group member. We assumed as habitual that users/tourists express their opinions regarding points of interest (POI) on social networks (such as TripAdvisor, Facebook, or Booking.com accessed on 3 January 2022) and we sought to take advantage of this to automatically predict their preferences non-intrusively. For this, we used a public dataset (available in Kaggle) and applied the development lifecycle for intelligent systems using concepts of NLP defined in [11]. More specifically, we developed forecast models using five supervised ML algorithms (Logistic Regression [12], Random Forest [13], Decision Trees [14], K-Nearest Neighbors [15], and Long/Short-Term Memory [16]), using them both as classification and regression methods. We also applied three unsupervised ML algorithms (One-Class Nearest Neighbor [17], Isolation Forest [18], and Local Outlier Factor [19]) used for anomaly detection to improve the supervised ML methods’ results. In addition, we used NLP to extract more knowledge from the users’ reviews and various libraries of Sentiment Analysis (Vader, TextBlob and Flair) to find those that best fit this context.
The rest of the paper is organized in the following order: Section 2 reviews state-of-the-art works in the field of recommendation systems. Section 3 presents the methodology. In the last section, some conclusions are put forward, alongside suggestions of work to be done hereafter.

2. Related Work

Several works have been conducted and proposed for the development of recommended systems in the tourism context. Nilashi et al. [20] applied multi-criteria ratings in developing a new method for hotel recommendations in e-tourism platforms. The authors used supervised and unsupervised ML techniques to analyze the customers’ online reviews. Cenni and Goethals [21] examined 100 reviews for languages written in English, Dutch, and Italian and analyzed three features, namely the types of speech acts that users used, the specific topics that they evaluated, and the extent to which they up-scaled or down-scaled their evaluative statements. The authors found a general trend towards similarity between the three language user groups under examination.
Valvida et al. [22] propose TripAdvisor as a source of data for sentiment analysis tasks. The authors develop an analysis for studying the matching between users’ sentiments and automatic sentiment-detection algorithms. They provide some of the challenges regarding sentiment analysis on TripAdvisor. In [23], the authors present a review focused on the multi-criteria review-based recommender system (RS), where they explain the user reviews’ elements in detail and how these can be integrated into the RS to help develop their criteria to enhance its performance. The authors presented four future trends to support researchers who wish to pursue studies in this field based on the survey.
The work of Kbaier et al. [24] focused on building personalized RS in the tourism field. They proposed a hybrid RS that combines the three best-known recommender methods: the collaborative filtering (CF), the content-based filtering (CB), and the demographic filtering (DF). In order to implement these recommender methods, the authors applied different ML algorithms, which were the K-Nearest Neighbors (K-NN) for both CB and CF and the Decision Tree for the DF. They conducted an extensive experimental study based on different evaluation metrics using extracted data from TripAdvisor.
In the work of Logesh et al. [25], they proposed an Activity and Behavior-Induced Personalized RS (ABiPRS) as a hybrid approach to predict persuasive POI recommendations. Their RS is designed to support travelling users by providing a compelling list of POIs as recommendations. As an extension, the authors designed a new group recommendation model to meet the requirements of the group of users by exploiting relationships between them. They also have developed a novel hybridization approach for aggregating recommendations from multiple RSs to improve the effectiveness of recommendations. The authors evaluated their approach on real-time large-scale datasets of Yelp and TripAdvisor.
In [26], the authors provided a fascinating study of users’ evaluations of serendipity in urban recommender systems through a survey among 1641 citizens. They studied which characteristics of recommended items contribute to serendipitous experiences and to what extent this increases user satisfaction and conversion. Their results are aligned with findings in other application domains in the sense that there is a strong relation between the relevance and novelty of recommendations and the corresponding experienced serendipity. They found that serendipitous recommendations increase the chance of users following up on these recommendations.

3. Methods

In this section, we describe the methodology in detail. We start by illuminating the problem that we intend to address. Next, we justify the choice of the dataset, and carry out its analysis, covering preprocessing and feature engineering. Finally, we approach the used computational techniques and describe the tests and results obtained.

3.1. Understanding the Problem Statement

The problem we want to overcome is to predict, non-intrusively and with a high level of accuracy, how much a tourist likes/dislikes a given POI. Subsequently, we intend to use the predicted preferences to model intelligent agents that represent tourists in a group recommendation system, who seek to jointly decide (using an argumentation-based dialogue model) and recommend to the group of tourists the set of POIs to visit. For this, we chose to use the reviews that tourists wrote on social media (TripAdvisor) to predict their preferences.

3.2. Collecting Dataset

The chosen dataset was selected based on 2 criteria: it needed to be a public dataset and should best represent the context in which this work intends to be applied. Therefore, a dataset available at Kaggle [27] and which is composed of more than 20 thousand hotel reviews extracted from TripAdvisor was selected. The fact that there are already many works on Kaggle’s repository that use this dataset allowed us to know beforehand that it would be very difficult to obtain good results, since, for example, for predicting 5 classes, the presented accuracy of the vast majority varies between 30% and 60%.

3.3. Analyzing Dataset, Preprocessing, and Feature Engineering

The dataset is composed of the attributes “Review” and “Rating”. Table 1 shows some examples of the type of records that make up the dataset. The “Rating” is between 1 and 5, where 1 is the worst and 5 is the best possible evaluation.
The dataset consisted of 20,491 records and 2 attributes, and it did not have any missing data. 
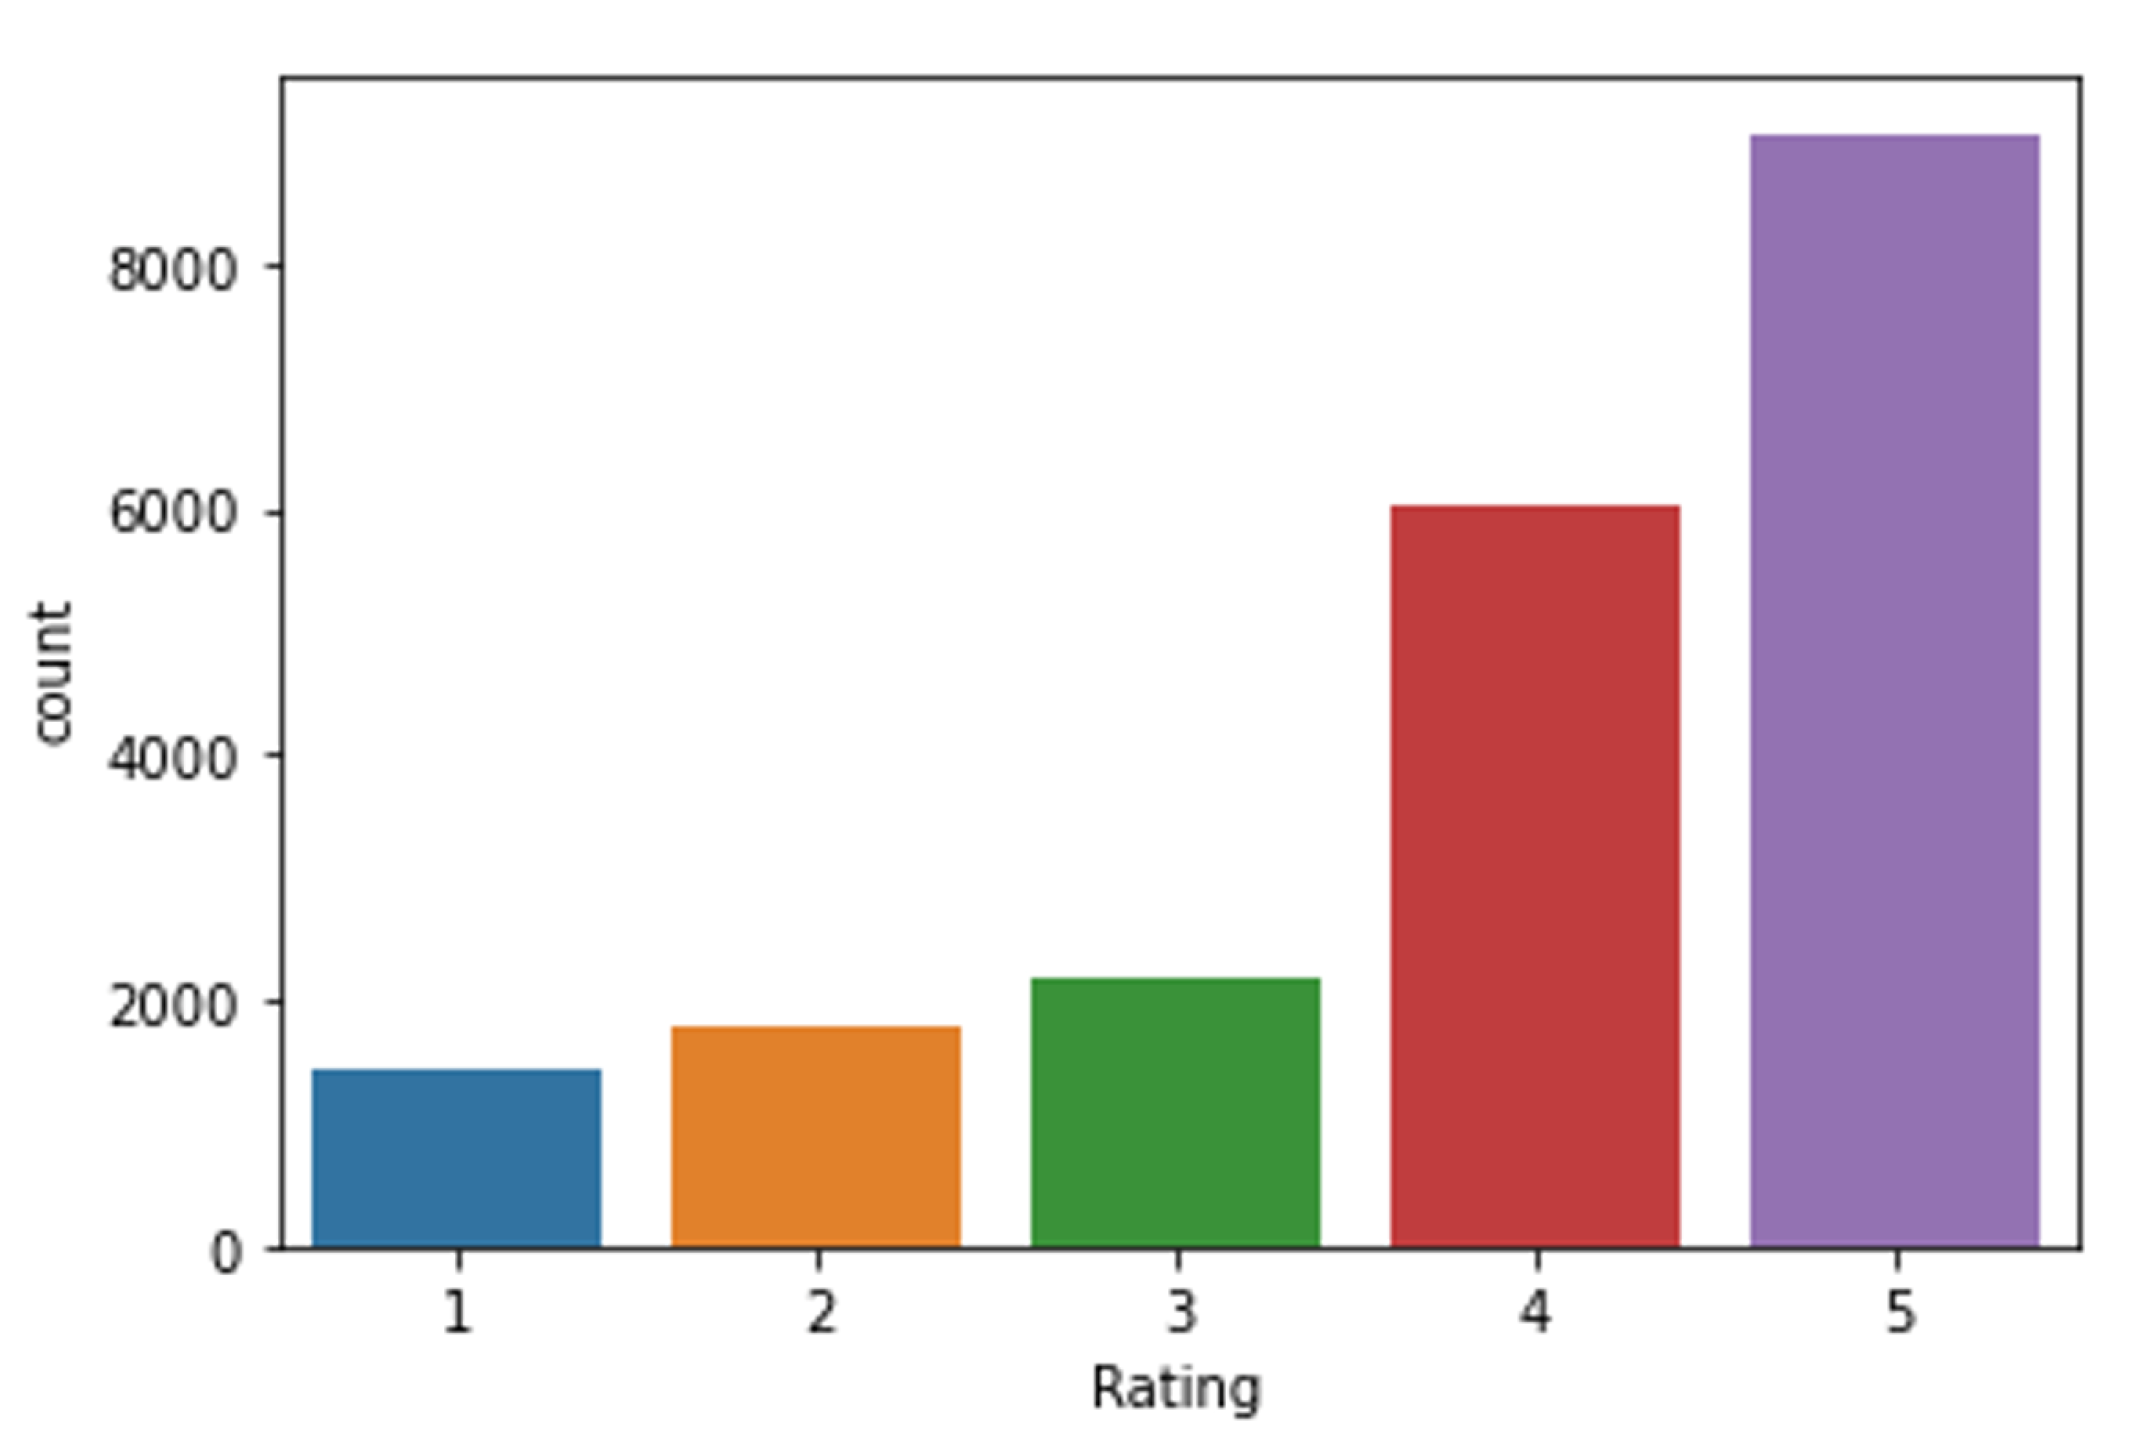
Figure 1 shows the distribution by “Rating”. As can be seen, the dataset is quite unbalanced, with many more records with a positive evaluation (Rating 5:9054; Rating 4:6039) than with a negative evaluation (Rating 2:1793; Rating 1:1421). Furthermore, the number of records with an intermediate evaluation is also much lower than the number of records with a positive evaluation (Rating 3:2184).
To study possible correlations between the “Review” and the assigned “Rating”, we created 3 new attributes: “Word_Count”, “Char_Count”, and “Average_Word_Length”. The “Word_Count” stands for the number of words used in the “Review”, the “Char_Count” stands for the number of characters used in the “Review”, and the “Average_Word_Length” stands for the average size of the words used in the “Review”. The “Average_Word_Length” did not show statistical relevance, but we found that the most negative reviews tended to be composed of more words than the most positive reviews (Figure 2), which made us believe that the attribute “Word_Count” would be very relevant for the creation of the model.
In the next step, we analyzed which words were most used in the reviews. In addition, we analyzed which words were most used in negative reviews (Rating 1 and 2) and in positive reviews (Rating 3, 4, and 5). We found that many of the most used words were the same, both in positive and in negative reviews. In Table 2 are presented the most used words considering all the reviews. The fact that many of the most used words are the same, in both positive and negative reviews, made us wonder if eliminating these words would be a good strategy in creating the model.
Then, we used some libraries to perform sentiment analysis. Sentiment analysis techniques allow the identification of people’s opinions, feelings, or attitudes through their comments. These techniques make it possible to determine a sentiment in a given sentence being classified as positive, negative, or neutral, using scalar values, and also through polarity (quantifying the sentiment as positive or negative through a value). These techniques are widely used in domains such as social networks, and their application is an excellent exercise to aid in interpreting and analyzing data from this particular field. Therefore, we applied 3 different libraries: Textblob, Vader, and Flair. Textblob and Vader presented similar results, while Flair did not obtain results that correlated with the “Rating”. With Textblob, we obtained 2 new attributes (Polarity and Subjectivity), and with Vader, we obtained 3 new attributes Positive_Sentiment, Negative_Sentiment, and Neutral_Sentiment. 
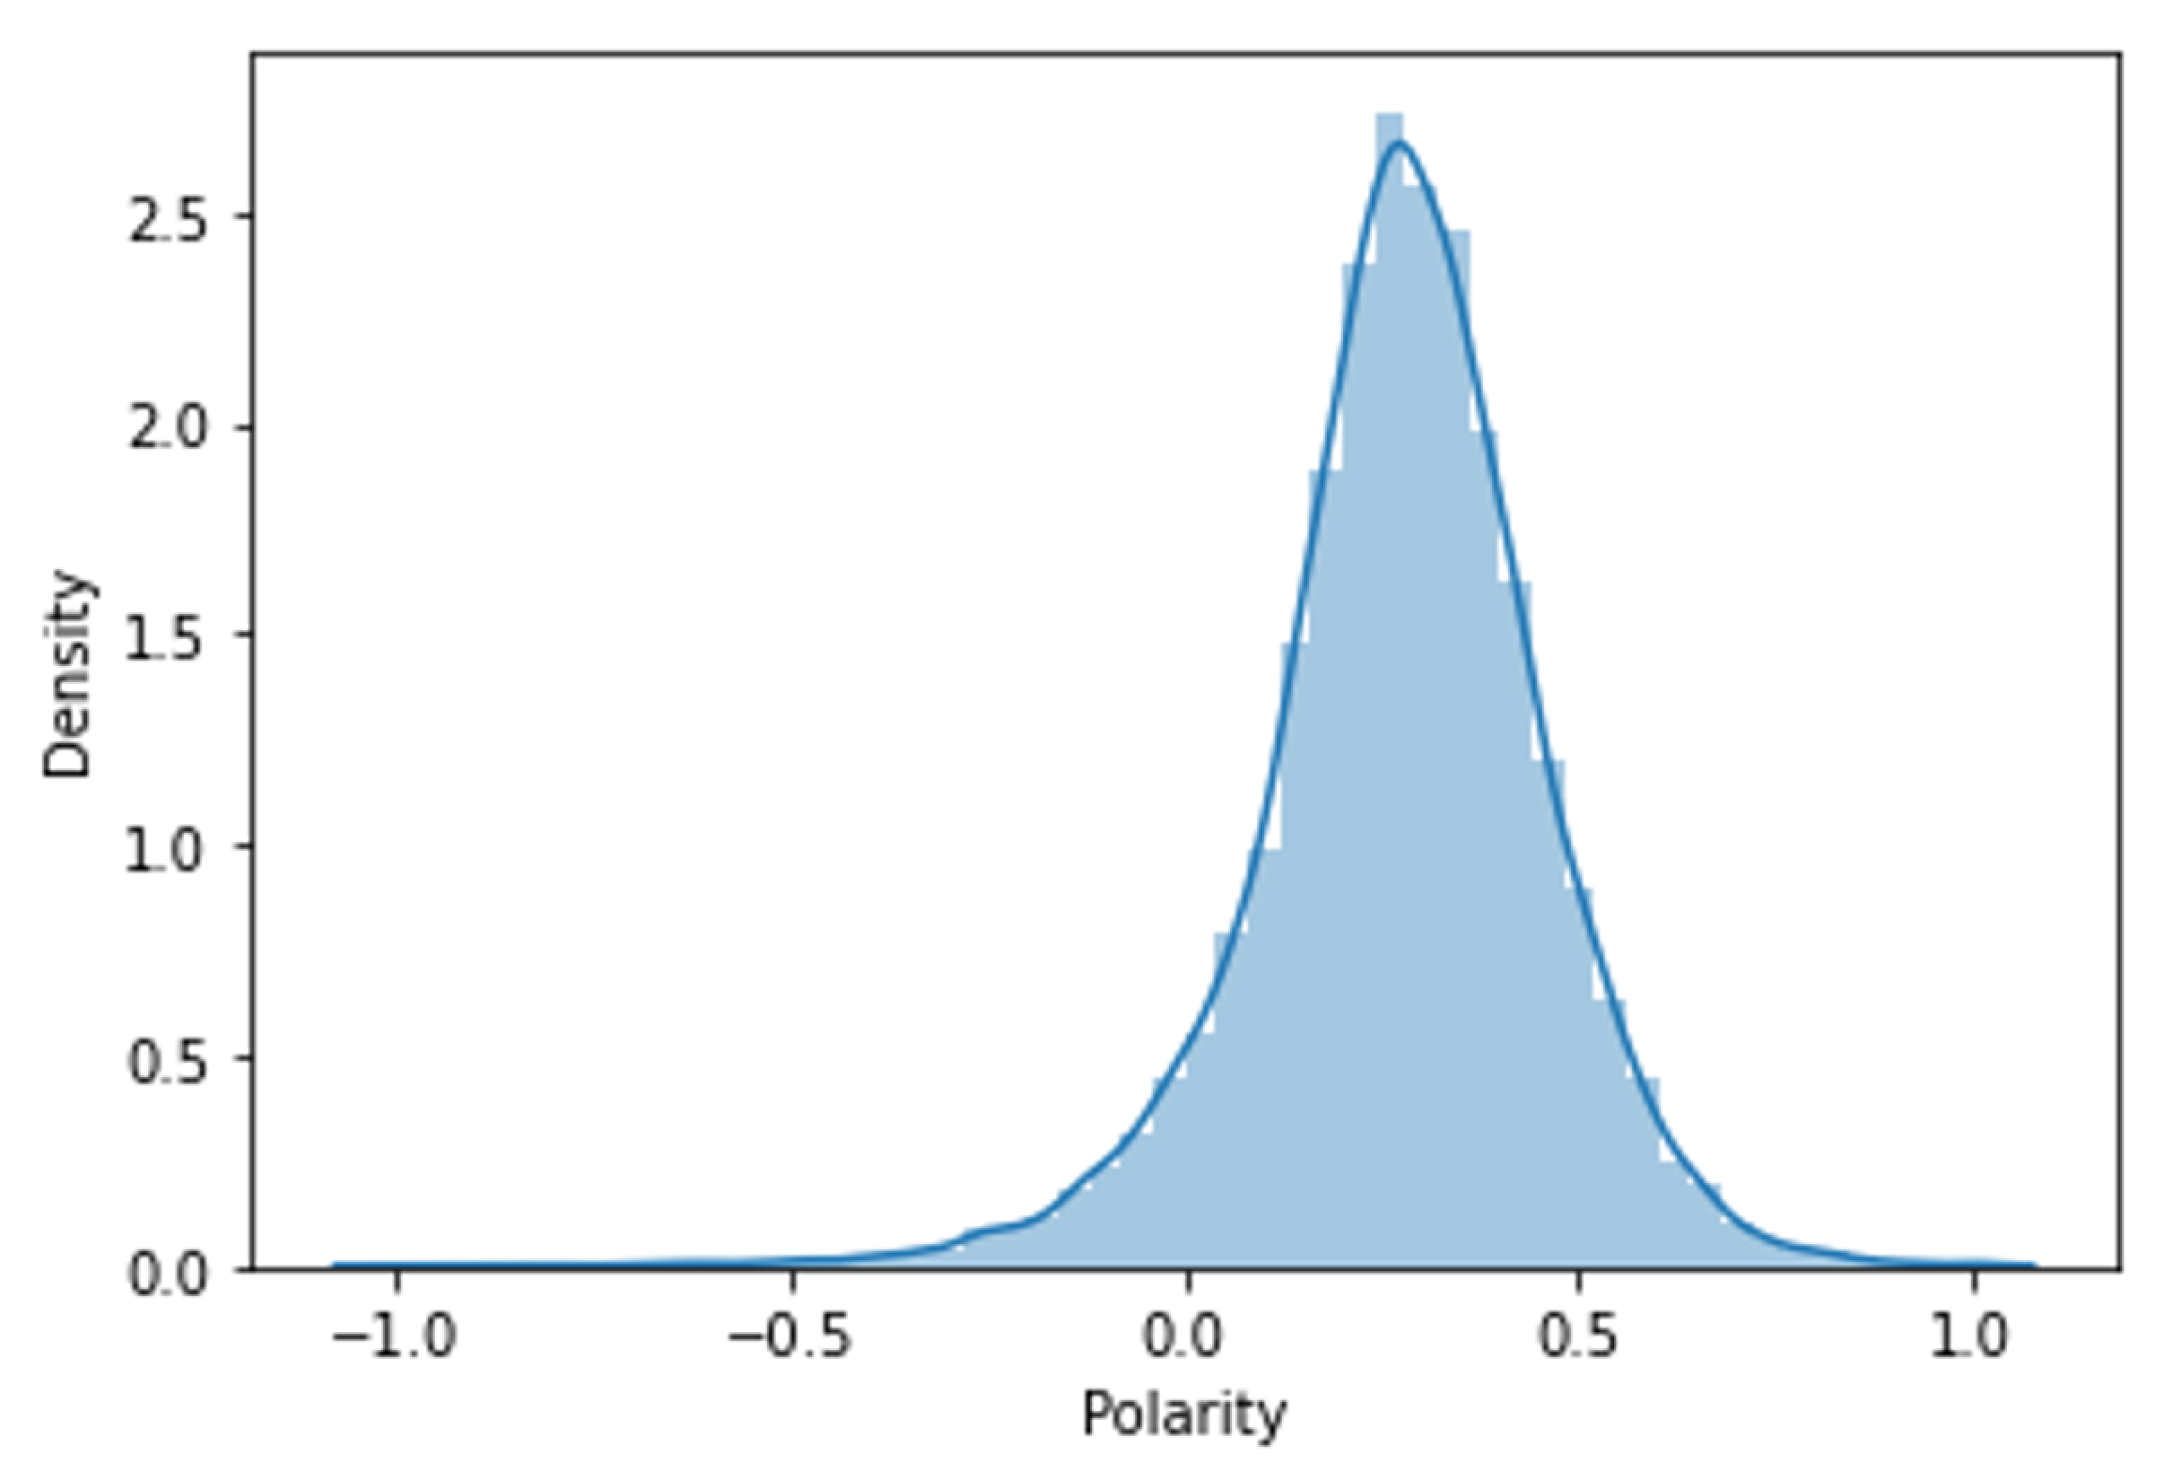
Figure 3 presents the density of the “Polarity” attribute obtained with Textblob. We found that the “Polarity” is mostly positive, which makes sense since, as we saw earlier, most reviews are also positive.
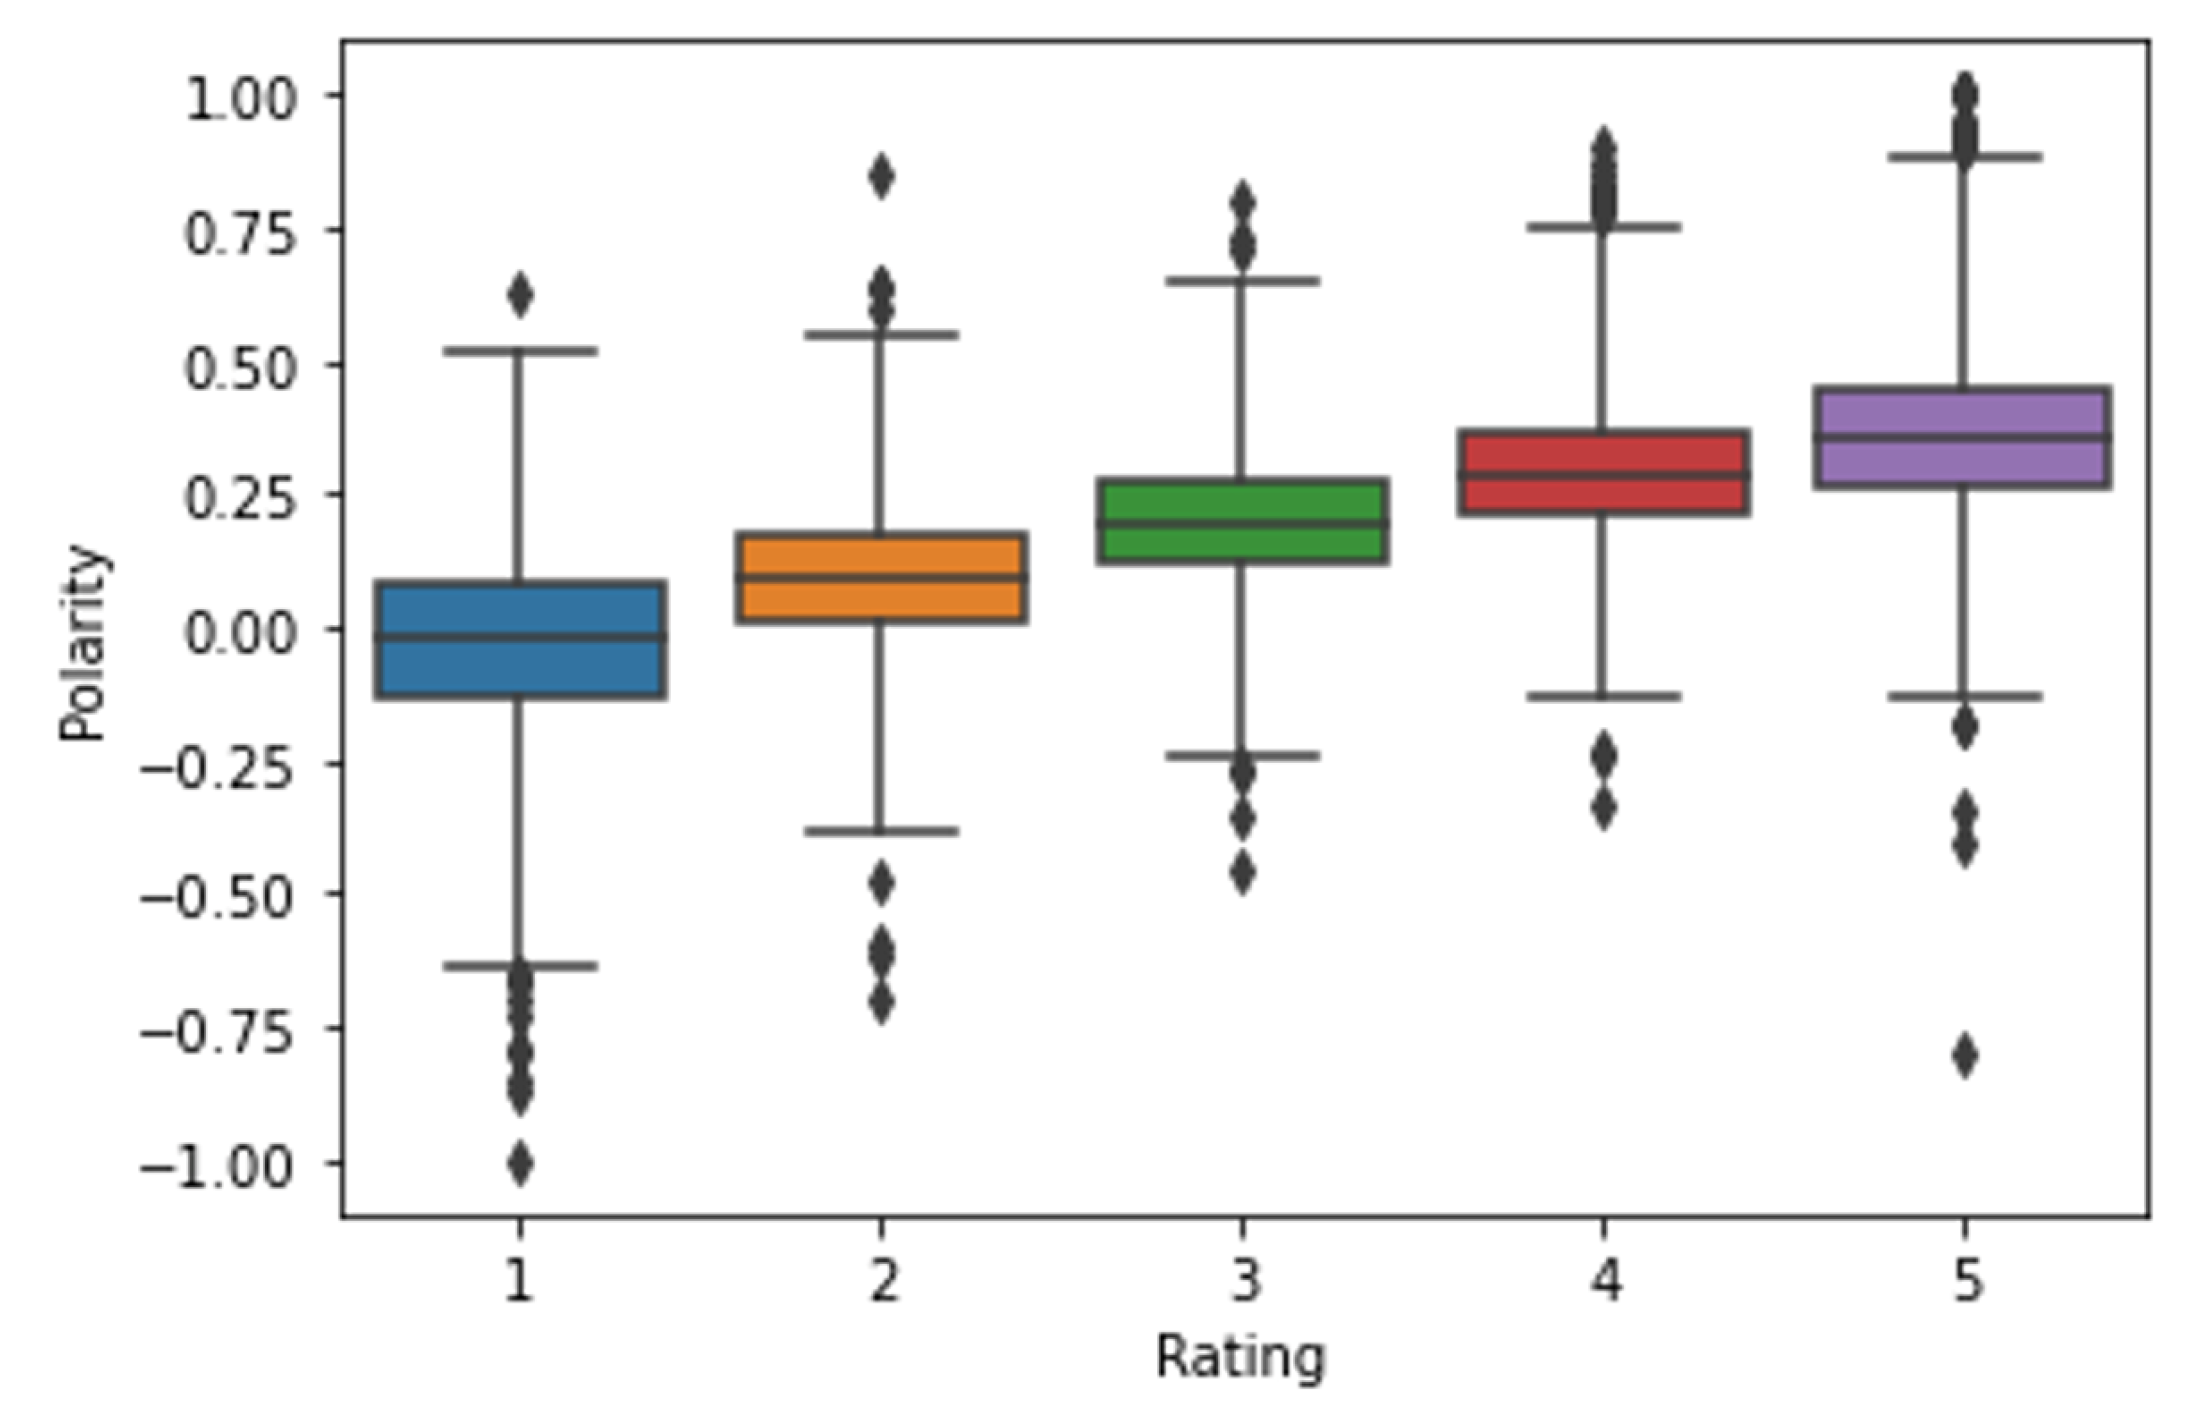
Figure 4 presents the correlation between “Polarity” and “Rating”. We can see that the polarity rises as the rating increases, which clearly demonstrates the existence of a correlation. However, we also found that the boxplots of each rating level are superimposed, which is a strong indicator of the difficulty in achieving success in creating classification models. In addition, we verified the existence of many outliers, which may not actually be accurate, as is the case for “Rating” equal to 1, in which we verified the existence of many records with polarity between −1 and −0.65. 
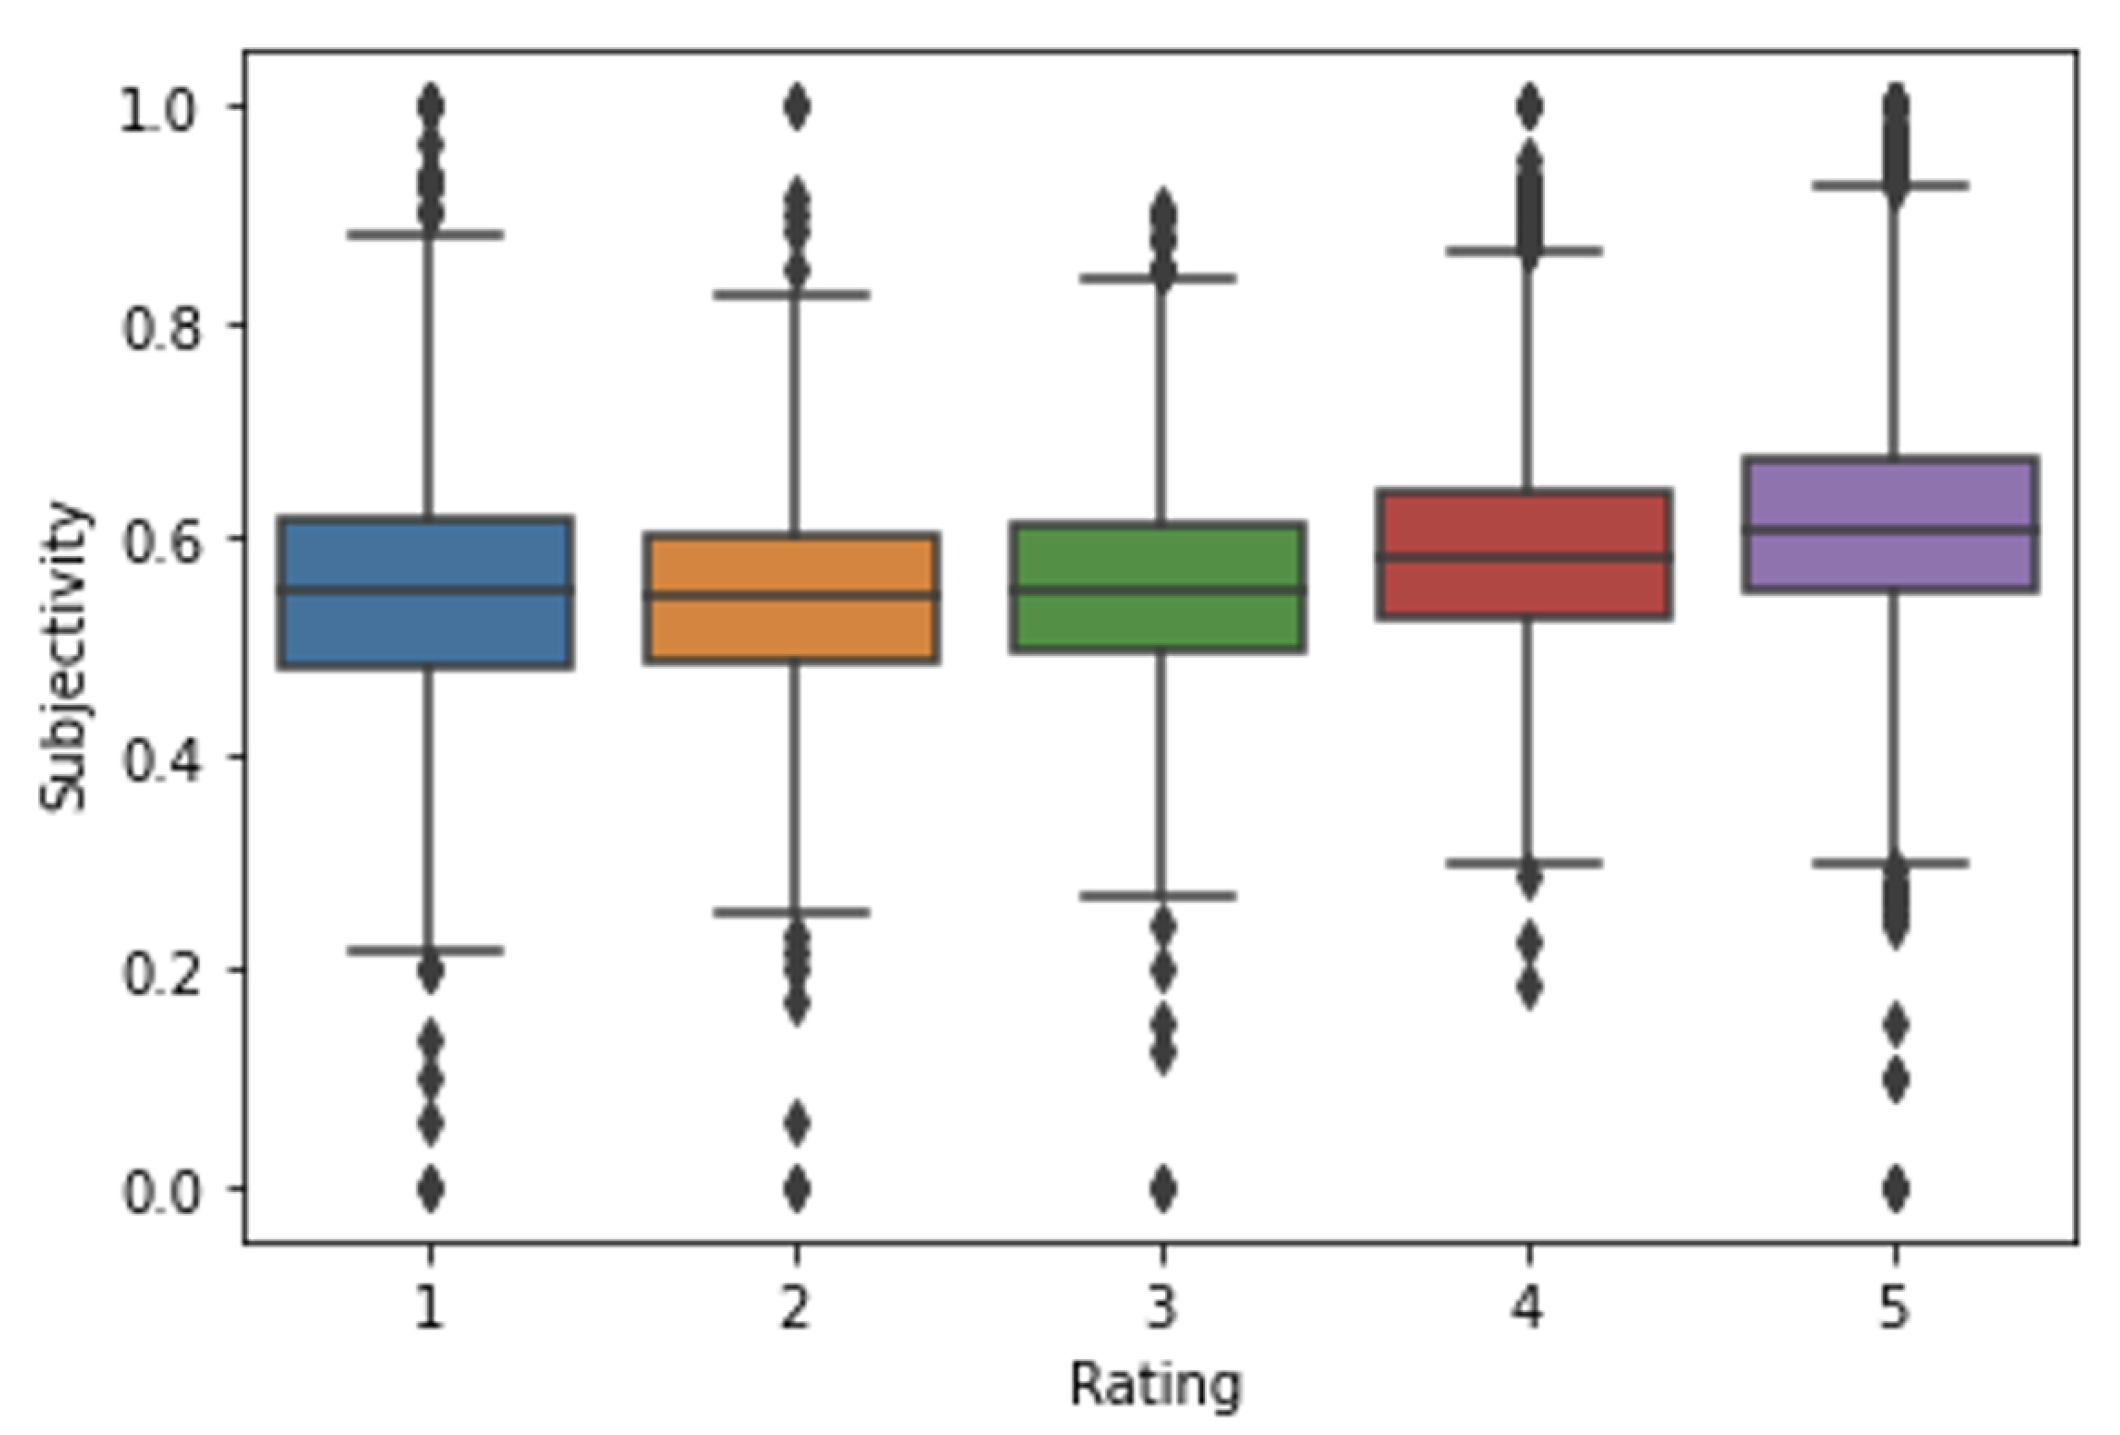
Figure 5 presents the correlation between “Subjectivity” and “Rating”. As we can see, there does not seem to exist any kind of correlation between subjectivity and rating.
To create a more simplified version of the assessment made by tourists, we generated a new attribute called “Sentiment”, with a value equal to 1 for records where the “Rating” was equal to or greater than 3 and with a value equal to 0 for records where the “Rating” was less than 3. This attribute will allow us to distinguish positive ratings from negative ratings.
We also carried out important preprocessing activities that allowed us to prepare the dataset and discover some important aspects. First, we put all the corpus in lowercase. Then, we tokenized the corpus and performed lemmatization and removed all the punctuation. In addition, we used other techniques, such as removing stopwords, stemming, and considering only the characters of the alphabet; however, these did not allow us to obtain better results. Finally, we used the MinMaxScaler to normalize the data.

3.4. Computational Techniques

Considering the objective of this work, we believed that it would be important to test the results that would be possible to obtain with different algorithms, both as classification methods and as regression methods for supervised learning. We anticipated that if algorithms as classification methods failed due to previously identified limitations, algorithms as regression methods could be an acceptable alternative in the context of the objective of this work. Due to the vast number of existing methods, we decided to choose the classic and the most widely used in the literature. Our main criterion was the diversity of the mechanics with which these methods are structured. Hence, we chose methods from different categories based on decision trees, distances, neural networks, and decision boundaries. The algorithms used were: Logistic Regression, Random Forest, Decision Tree, K-Nearest Neighbors, and Bidirectional Long/Short-Term Memory (biLSTM). The first 4 used the Scikit-learn library and the last one used the Keras library.
We also considered applying unsupervised techniques used in anomaly detection problems. These methods are present in numerous domains and research fields. These can be found in industrial machinery failure [28,29,30], credit card fraud [31,32,33], image processing [34,35], medical and public health [36,37,38], network intrusion [39,40,41,42], and others [43,44,45,46,47]. We focused on One-Class Classification (OCC) [17] methods to understand whether we could improve the results of the best classification algorithm. To do so, we selected three unsupervised methods from the Scikit-learn library: Isolation Forest, One-Class K-Nearest Neighbor (OCKNN), and Local Outlier Factor (LOF).

3.5. Tests and Evaluation

Several experiments were carried out with the selected algorithms to tune parameters for optimization. However, as no significant differences were found, the default configuration provided by the used libraries was employed for all algorithms. For estimating the performance of the ML models, we performed cross-validation with five repetitions.
We defined six different scenarios to create models. In the first three scenarios (#1, #2 and #3), the set of most used words that did not express feelings were removed (hotel, room, staff, did, stay, rooms, stayed, location, service, breakfast, beach, food, night, day, hotel, pool, place, people, area, restaurant, bar, went, water, bathroom, bed, restaurants, trip, desk, make, floor, room, booked, nights, hotels, say, reviews, street, lobby, took, city, think, days, husband, arrived, check, and told), and in the other 3 (#4, #5 and #6), all words were kept.
For all scenarios, we used the TfidfVectorizer class from the Scikit-learn library to transform the “Review_new” feature to feature vectors, and we defined max_features equal to 5000. In addition, in scenarios #1 and #4, the features considered were: “Review_new”, “Polarity”, “Word_Count”, “Char_Count”, “Average_Word_Length”, “Positive_Vader_Sentiment”, and “Negative_Vader_Sentiment”; in scenarios #2 and #5, the features considered were “Review_new” and “Polarity”; and in scenarios #3 and #6, only the feature “Review_new” was considered. We applied each supervised learning algorithm to each scenario with both the classification and regression methods. Thus, all combinations were used for a 5-class problem (Y = “Rating”) and a 2-class problem (Y = “Sentiment”). Finally, we applied three anomaly detection methods to the output of the best classification model (2-class problem).

3.5.1. Classification and Regression Results with Supervised Methods

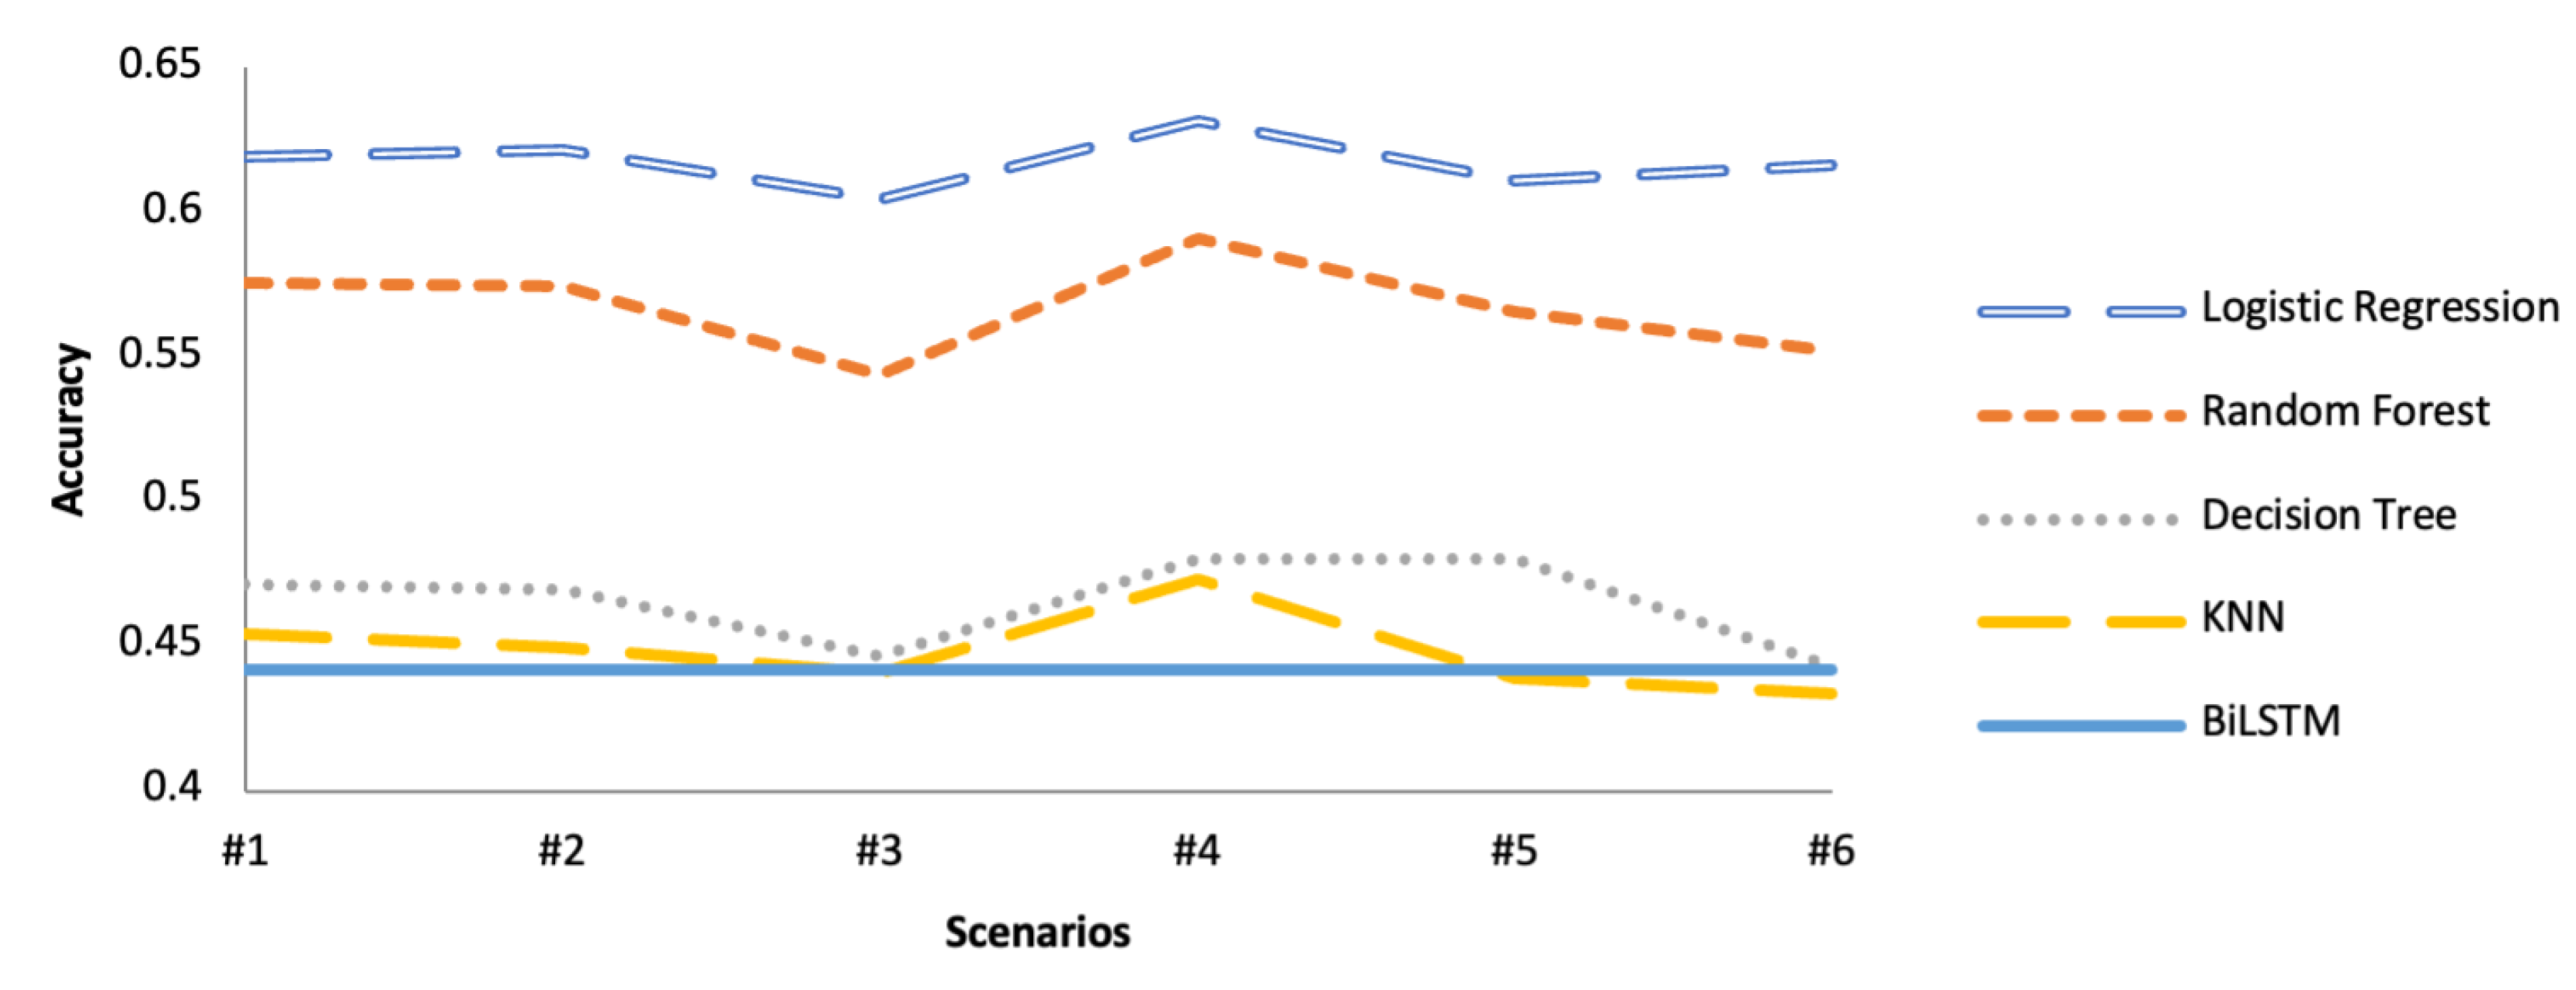
Figure 6 presents the results obtained with the five algorithms for each of the scenarios defined with the classification method for the 5-class problem (Y = “Rating”). Note that the Logistic Regression method is limited to two-class classification problems by default. However, with the Scikit-learn library, Logistic Regression can handle multi-class classification problems using the approach one-vs-rest [48]. Analyzing Figure 6, the Logistic Regression algorithm obtained the best results for all scenarios, with an accuracy always higher than 0.6, followed by the Random Forest algorithm. The other three algorithms obtained considerably lower results, and in the case of the BiLSTM algorithm, the results were very poor, as it classified all cases with a “Rating” of 4.
Since scenario 4 was the one that allowed us to achieve the best results, in terms of accuracy, Table 3 presents precision and recall for each of the algorithms in scenario 4 with the classification method for the 5-class problem. We verified that the Logistic Regression and Random Forest algorithms presented interesting results. It is possible to verify that relatively high values were obtained for the extreme cases (“Rating” = 1 and “Rating” = 5), but the quality was quite low in the classification of intermediate values.
Figure 7 presents the results obtained with the 5 algorithms for each of the scenarios defined with the classification method for the 2-class problem (Y = “Sentiment”). As can be seen, the results were quite good. Once again, the Logistic Regression and Random Forest algorithms obtained the best results, with the Logistic Regression algorithm showing an accuracy very close to 0.95. The Decision Tree and K-Nearest Neighbors algorithms obtained reasonable results, mainly in scenarios where more features were considered. The BiLSTM algorithm returned the worst results.
Table 4 presents precision and recall for each of the algorithms in scenario 4 with the classification method for the 2-class problem. The results presented by the Logistic Regression algorithm are quite solid. It is verified that the recall for L 1 (Sentiment = 0) is lower than desirable, but this is probably explained by the dataset being unbalanced.
The next experiences concern the application of the algorithms to the previously presented scenarios with the regression method. Figure 8 presents the Mean Absolute Error obtained with the 5 algorithms for each of the scenarios defined with the regression method for the 5-class problem (Y = “Rating”). We found that most algorithms obtained poor results. However, the Random Forest algorithm presented very interesting results, obtaining a Mean Absolute Error of 0.69 in scenario 4 (which is quite good considering the problem in question).
Table 5 presents the Mean Squared Error, Root Mean Square Error, and Mean Absolute Error for each of the algorithms in scenario 4 with the regression method for the 5-class problem. Once again, it is possible to verify that the Random Forest algorithm obtained very good results, unlike the other algorithms. Although the BiLSTM algorithm seems to give reasonable results, this only happens due to the fact that it always generates the same output and most reviews are positive.
Figure 9 presents the Mean Absolute Error obtained with the 5 algorithms for each of the scenarios defined with the regression method for the 2-class problem (Y = “Sentiment”). We verified that, in this case, all algorithms, with the exception of the BiLSTM algorithm, obtained very good results.
Table 6 presents the Mean Squared Error, Root Mean Square Error, and Mean Absolute Error for each of the algorithms in scenario 4 with the regression method for the 2-class problem. The Logistic Regression algorithm again presented very good results that were consistent across all experiments. In this scenario, the K-Nearest Neighbors algorithm also presented interesting results.

3.5.2. Anomaly Detection Results

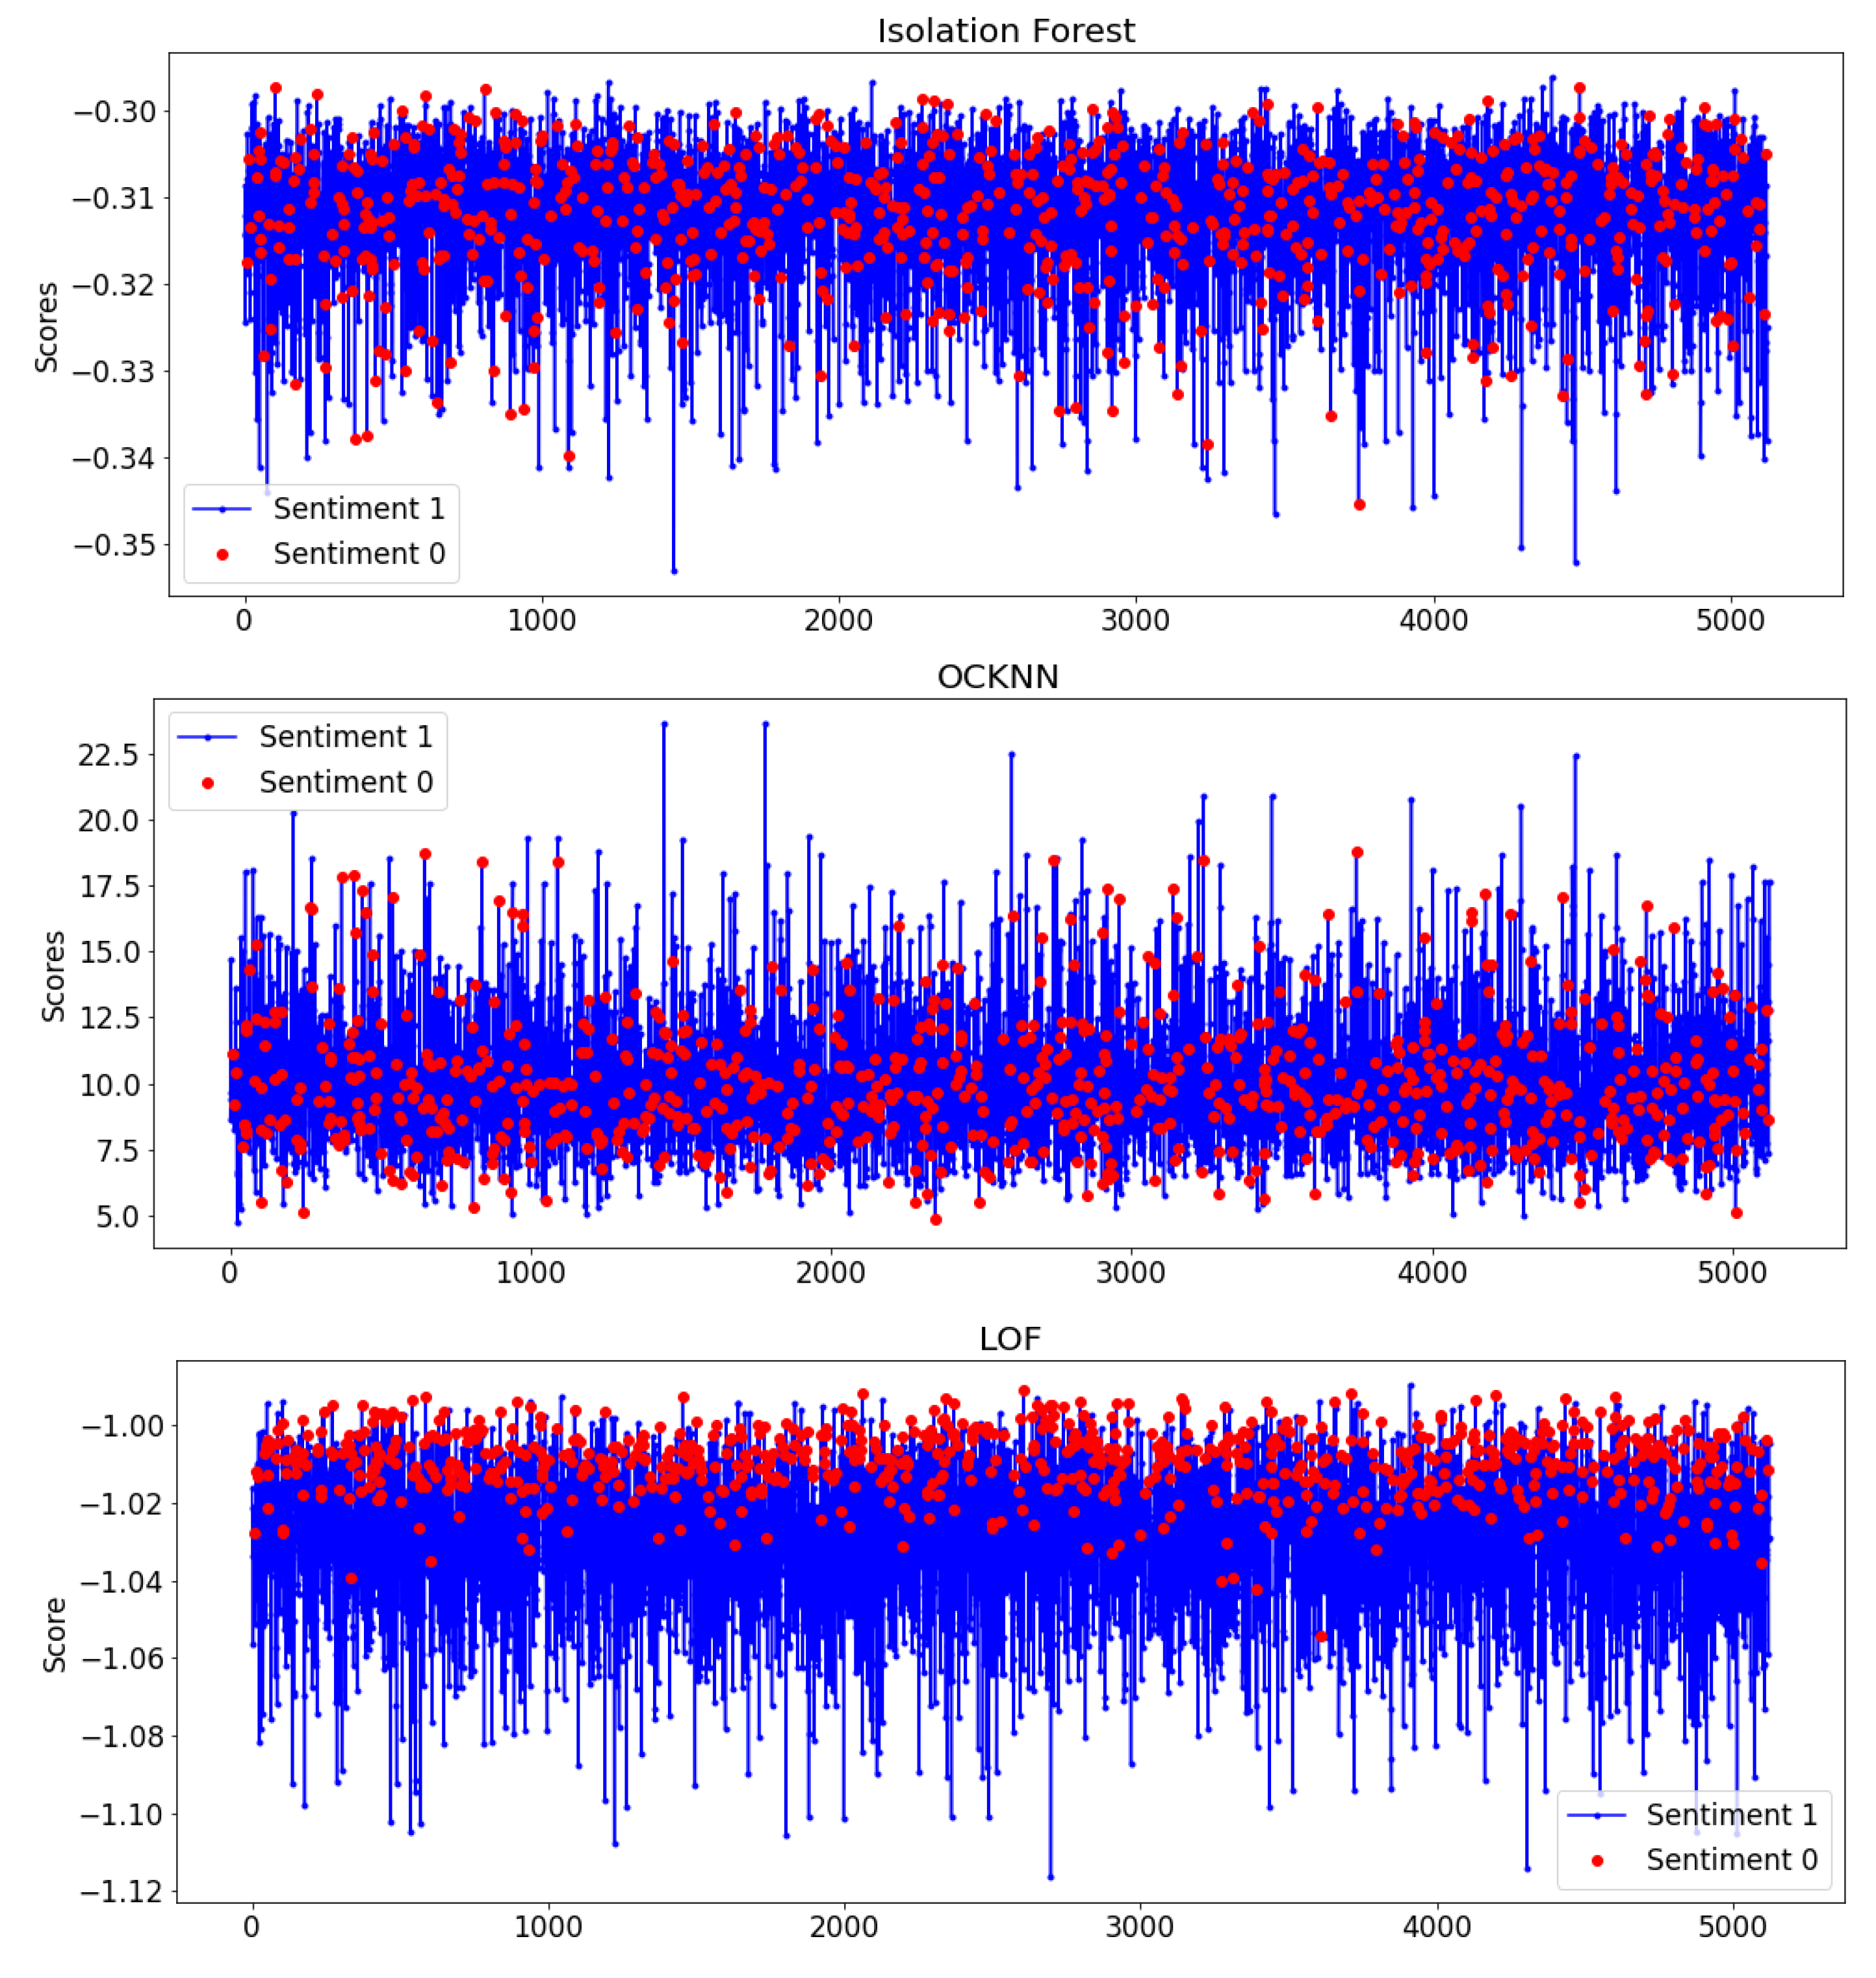
Through our next experiments, we selected OCC methods used in anomaly detection problems. We applied them to score the predicted output of the best classification algorithm—in this case, the Logistic Regression. These anomaly detectors are trained with normal data, identifying patterns that deviate from normality, which are considered anomalies. The main goal is to analyze whether these techniques can help the recommendation system that we intend to develop to correctly classify as many users as possible—that is, to detect whether they like a POI, improving the Logistic Regression performance.Therefore, as we can observe in Figure 10, the class 0 (showed as red dots), which we have considered as the anomalous one in this scenario, is dispersed through the graph in the Isolation Forest and OCKNN methods. We can also visualize that users with negative sentiments are at the top for the LOF method, with the highest scores. However, some of them are overlapped with users with positive sentiments, which means that although improvements in reducing false positives are possible, they come with the cost of increasing false negatives. We identified LOF as the best method to apply for this purpose as it was shown to better separate the Y = “Sentiment” classes through its score compared to the other methods.
We then performed four different experiments with this technique, analyzing the precision and recall metrics, as we intended to reduce false positives (increase precision), taking the increase in false negatives (decrease recall) into account. Thus, in the first two experiments, we applied LOF to separate Y = “Sentiment” classes by training with users with positive sentiments to isolate users with negative sentiments in the first experiment, while in the second experiment, we did the same, switching the classes (training with users with negative sentiment to isolate users with positive sentiment). We repeated the process for experiments three and four, this time using Y = “Ranking” to isolate the extreme ranking values, meaning that, in experiment three, we used users who rated 5 to train in order to isolate users who rated 1 and vice versa for the fourth experiment.
To visualize the experiments, we built different graphics (Figure 11, Figure 12, Figure 13 and Figure 14). The 
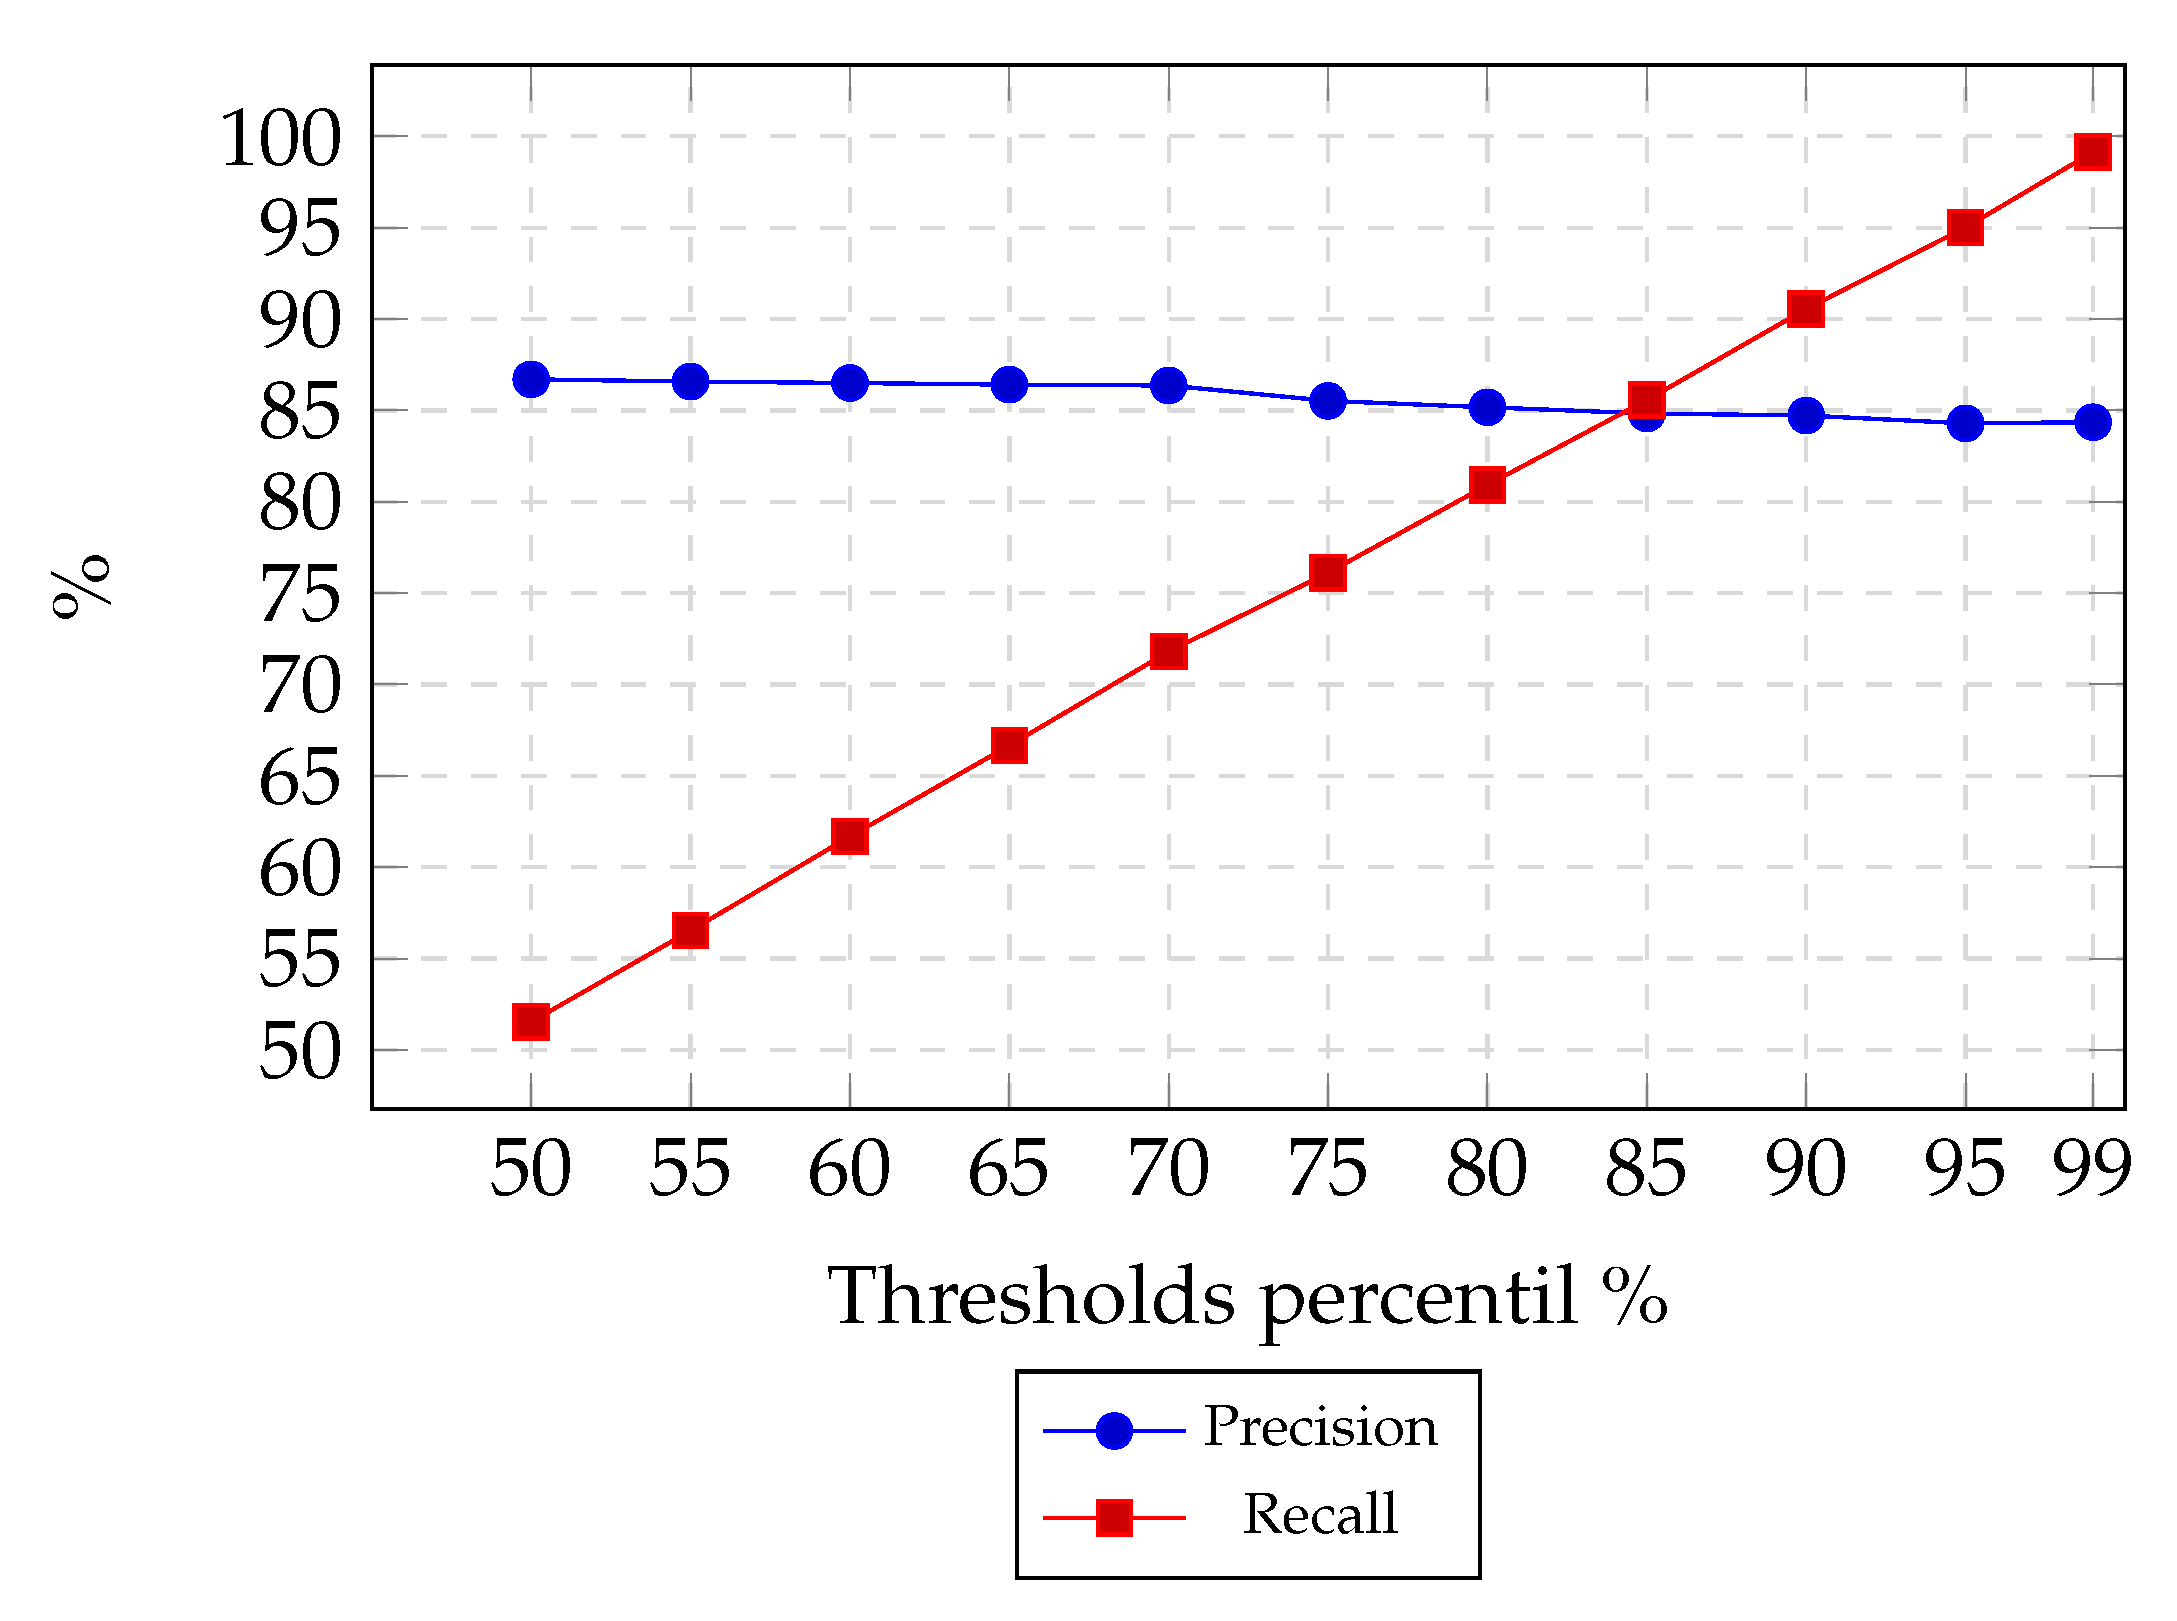
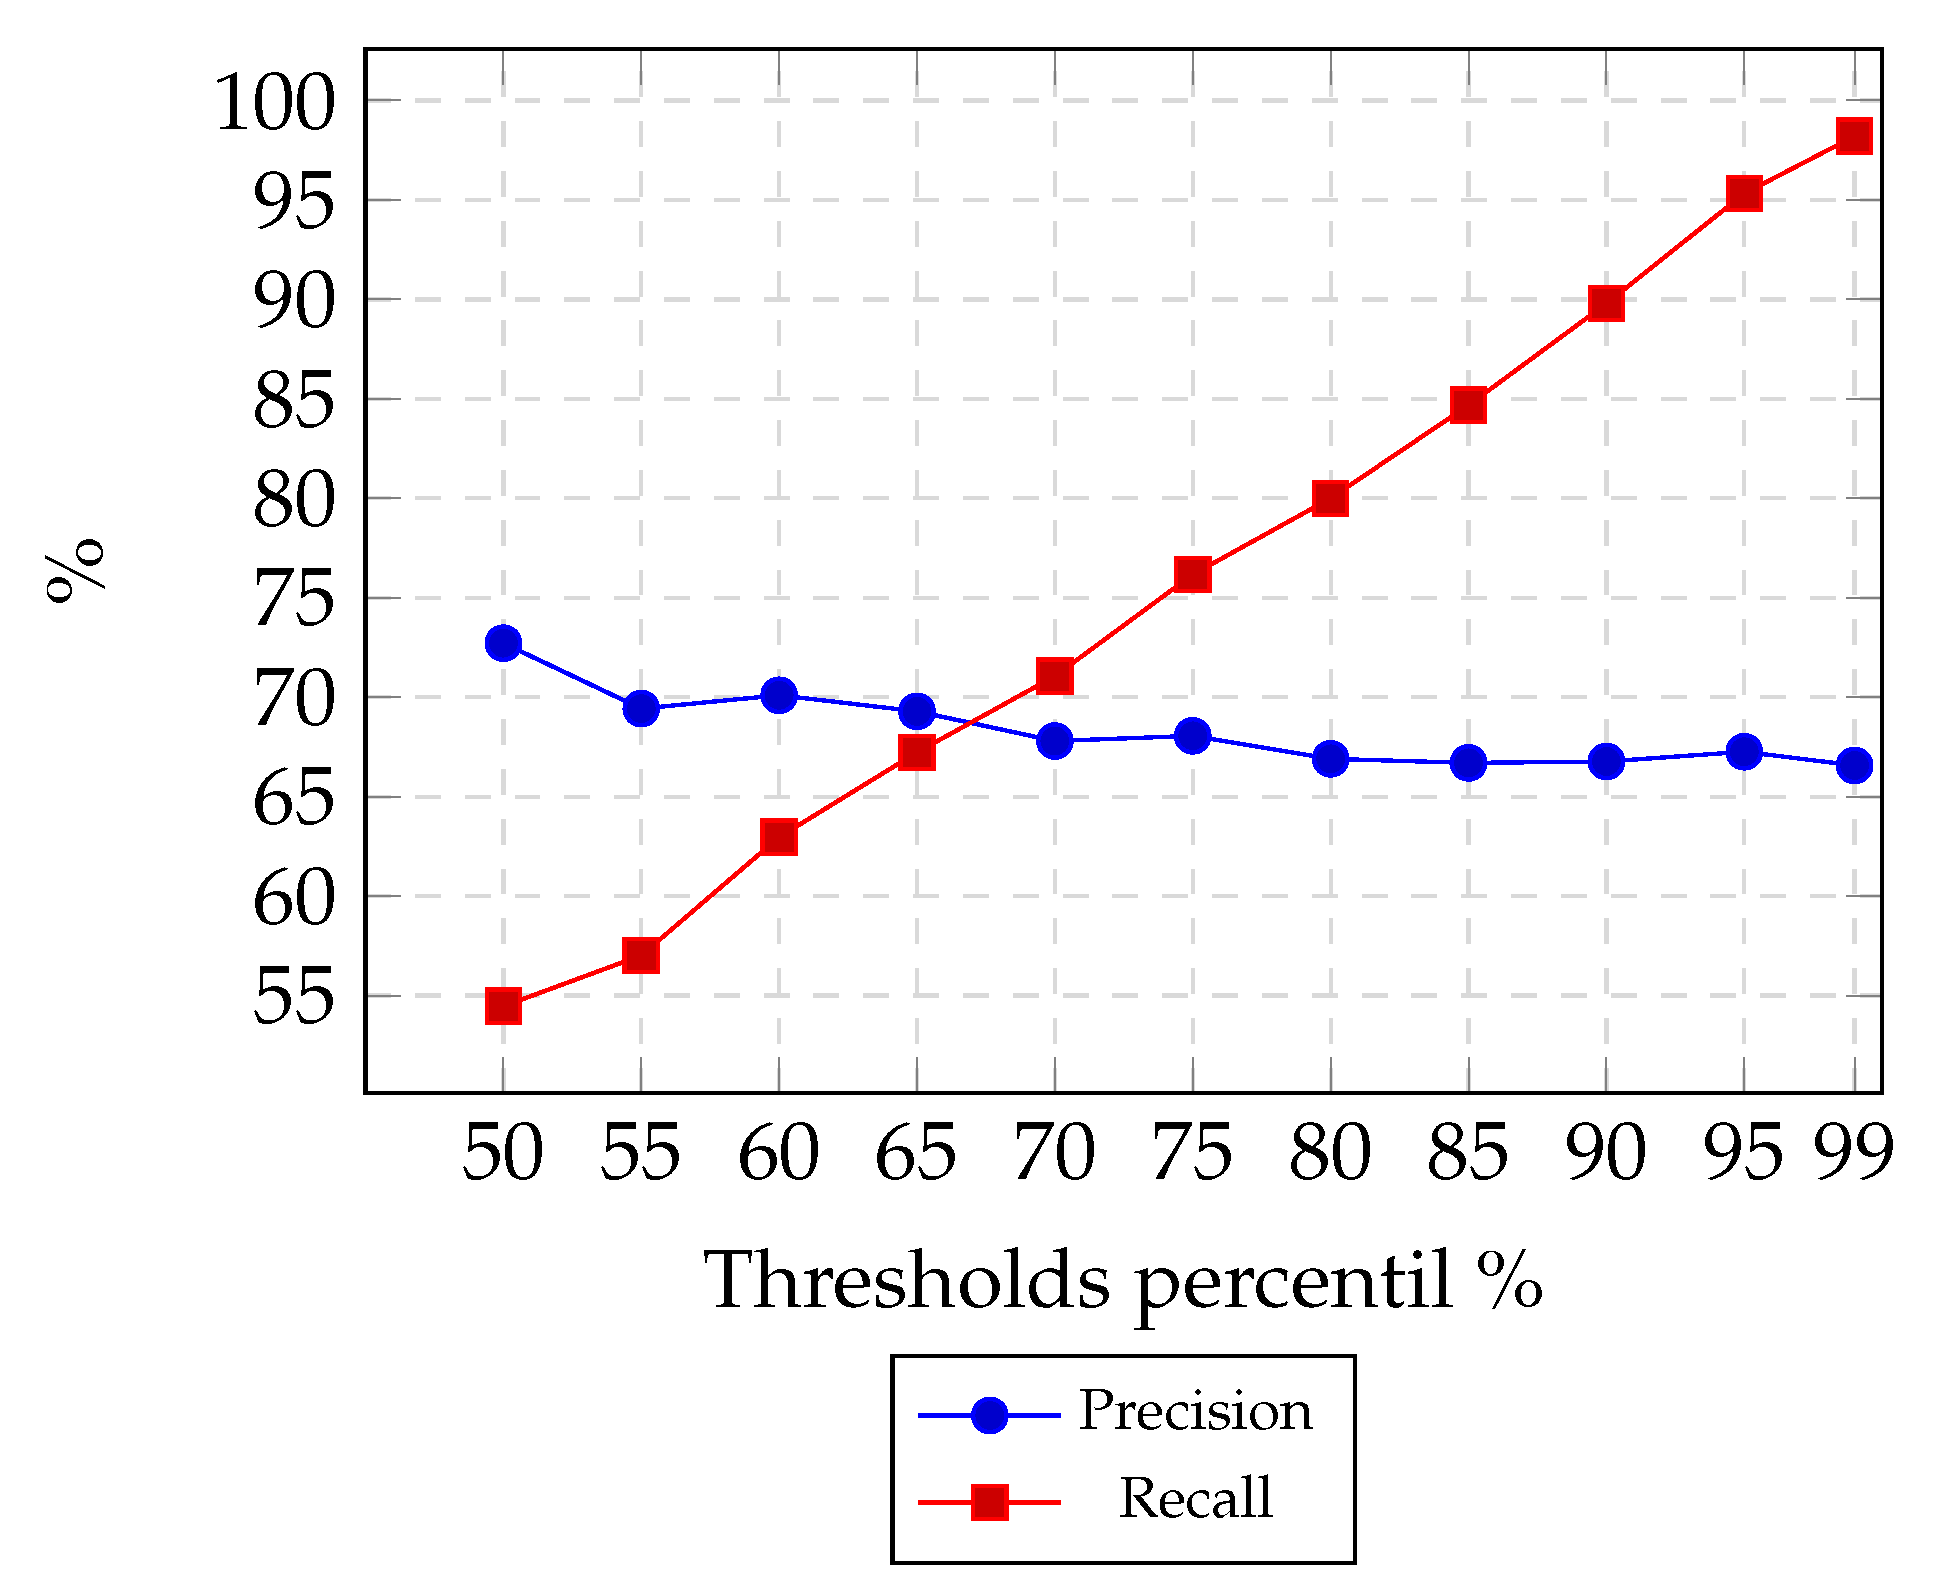
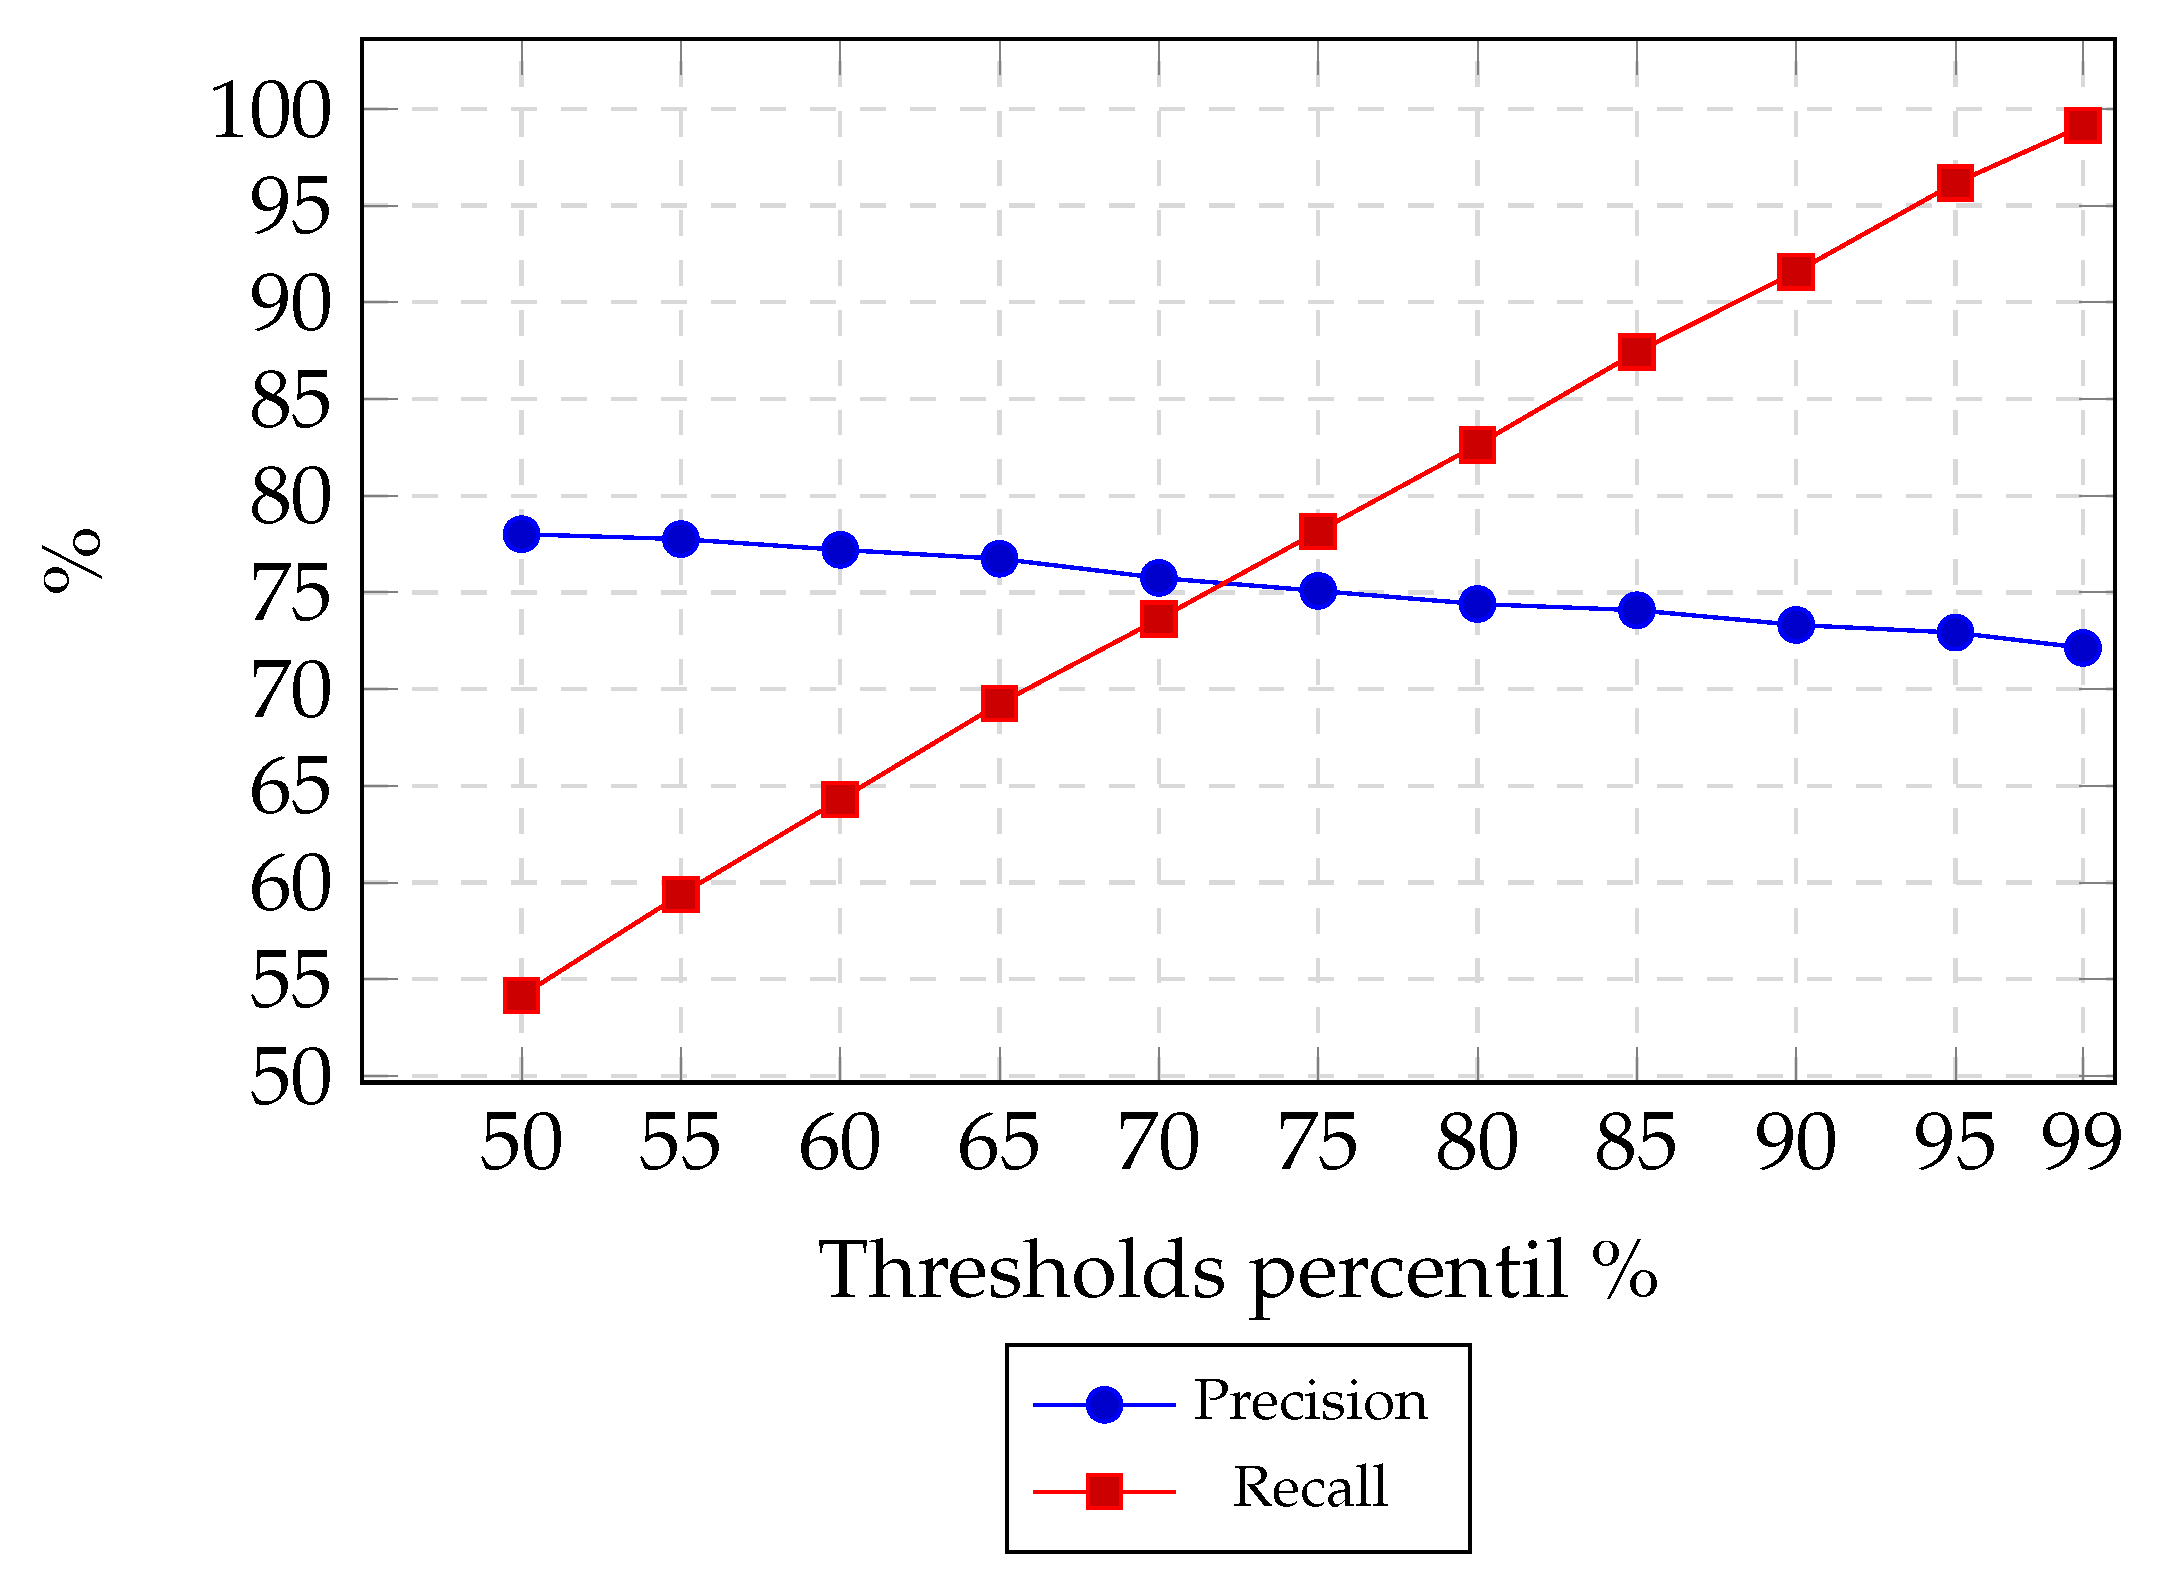
y-axis represents precision and recall percentage values, and in the x-axis, the percentile thresholds from LOF are given. That is, the percentage instances with the highest score from LOF output are considered the isolated class. For example, threshold percentile 95% means that instances that have a score value greater than 95% of the highest score output are considered as the isolated class.
We can observe in all experiments that recall presents a linear increase when threshold values also increase, while precision shows a slight decrease for high threshold values. It is essential to mention that threshold percentile 100% represents the output of Logistic Regression without cuts, which is why recall is always 100%, which means the absence of false negatives since we are using the values predicted by the Logistic Regression method of only a specific class.
In the first experiment (Figure 11), we aimed to discard class 0 from the Logistic Regression output, reducing the population from class 1 in order to obtain the maximum users who liked a POI. We can see that if using a threshold percentile of 50%, we obtain approximately 99% precision, but with a high cost for the recall value (52%). In this experiment, precision has a slight increase when reducing the class 1 population in 20% (threshold percentile 80%), achieving precision of 98%, while recall decreases at 82%. It obtains an acceptable recall value while precision converges to its highest value.
In Figure 12, it is possible to observe the experiment in which we intended to hit the highest number of users who did not like a POI. In this scenario, LOF shows poor performance since it could not separate adequately class 1 from class 0. In order to be able to increase precision in only 2% (from 84% to 86%), recall drops from 99% to 51%.
Regarding the third experiment, shown in Figure 13, our goal was to discard users who rated a POI as 1, while reaching the maximum number of users who rated a specific POI as 5. Regarding the third experiment, shown in Figure 13, we wanted to discard users who rated a POI as 1 while reaching the maximum number of users who rated a specific POI as 5; it can be seen that precision can increase from 73% to 78% when reducing the population from users who rate 5 in 50%. This increase of 5% is the same, visible in the first (Figure 11) and last experiment (Figure 14); however, the highest precision value is much higher in the first scenario.

3.6. Discussion

In this work, we carried out several experiments to understand the ability of Machine Learning models to predict user reviews on the TripAdvisor platform. We started with the classification and regression of two problems, multi-class (Y = “Rating”) and binary (Y = “Sentiment”), to observe the models’ behavior. The results in the multi-class problems were not very high, especially in identifying the intermediate classes (Rating 2, 3, 4) due to the composition of the dataset. In the dataset analysis, we verified that, in addition to the classes being unbalanced (Figure 1), there is an overlap in the user evaluations (Figure 4). On the one hand, the dataset may not be sufficiently representative—for example, in comments with a level 3 rating—and, on the other hand, the fact that users are different can also have a large impact on a scale from 1 to 5, i.e., the same words have different meanings/weights for different people and people who evaluate a POI with the same rating may express it in a completely different way. As expected, the binary problem (Y = Sentiment) results were higher since the data were aggregated by the extreme ratings (1, 5), where the overlapped observations were minor compared to intermediate ratings. Since our goal was to identify those ratings classified as positive, which actually obtained a positive rating from the user (and vice versa), we applied anomaly detection techniques to improve the Logistic Regression precision. We verified that the LOF was the best anomaly detection method to better differentiate classes from the Logistic Regression output compared to OCKNN and Isolation Forest. The LOF algorithm could reduce false positives but with an associated cost (with linear growth derived from the noise present in the dataset) of increasing false negatives, which is excellent since it is essential that the recommendation system we intend to develop can identify POIs that users will like or not like with certainty.

4. Conclusions

This work aimed to study strategies to automatically predict tourists’ preferences regarding tourism points of interest. The method consisted in using Machine Learning algorithms and Natural Language Processing techniques on reviews that tourists posted on TripAdvisor® to predict their assigned ratings. The chosen dataset had a lot of issues, making it difficult to achieve better results (the top three were being unbalanced, having comments that were not about the POI, and having comments with very poor writing quality). Since this was a public dataset, we already knew it would be extremely challenging because most existing works present accuracy rates between 30% and 60%. However, we decided to use this dataset as it is a good example of the reality and type of problems that exist in the context of the topic of this work.
The work carried out allowed us to reach important conclusions. First, the inclusion of sentiment analysis had a much smaller positive impact than expected. Furthermore, it was possible to notice that, for this dataset, the Vader and TextBlob models obtained a good correlation with the ratings associated with comments, while Flair did not. Second, although negative comments are usually longer, the inclusion of the “Word_Count” attribute did not prove to be relevant. Third, the Logistic Regression algorithm proved to be, for classification, the one that achieved greater accuracy, while the Random Forest algorithm, for regression, proved to be the one that obtained the smallest error. The Bidirectional LSTM algorithm obtained poor results for both classification and regression, most likely because the dataset was not large enough and contained several outliers, making it difficult for LSTM to extract patterns and generalize the data. Finally, we verified that we can improve the precision of a model using anomaly detection techniques, albeit with a certain decrease in recall. The cost of increasing false negatives is defined by the anomalous threshold, which is a user-specified parameter. Therefore, the threshold can be adjustable so that there is a beneficial trade-off between precision and recall. We intended to create a model to identify only those tourists who truly like or dislike a particular point of interest, in which the main objective is not to identify everyone, but fundamentally not to fail those who are identified in those conditions. Our experiments provide valuable information as they give an idea of the behavior of Machine Learning models in a real scenario, helping to develop approaches for those who intend to create a recommendation system for decision support systems in the tourism field. As future work, we intend to replicate this study with a much larger dataset and in which comments/evaluations are about different points of interest.

Author Contributions

Conceptualization, J.M. and J.C.; software, J.M. and J.C.; methodology, J.M. and J.C.; writing—original draft preparation J.M.; writing—review and editing, J.C., V.B.-C., A.A.-B., P.N. and G.M.; validation, V.B.-C., A.A.-B., P.N. and G.M.; supervision, V.B.-C., A.A.-B., P.N. and G.M. All authors have read and agreed to the published version of the manuscript.

Funding

This work was supported by the GrouPlanner Project under the European Regional Development Fund POCI-01-0145-FEDER-29178 and by National Funds through the FCT—Fundação para a Ciência e a Tecnologia (Portuguese Foundation for Science and Technology) within the Projects UIDB/00319/2020 and UIDP/00760/2020.

Data Availability Statement

Publicly available datasets were analyzed in this study. The data can be found here: https://www.kaggle.com/andrewmvd/trip-advisor-hotel-reviews (accessed on 1 October 2021).

Conflicts of Interest

The authors declare no conflict of interest.

Abbreviations

The following abbreviations are used in this manuscript:
MLMachine Learning
NLPNatural Language Processing
POIPoints of Interest
RSrecommender system
OCCOne-Class Classification
biLSTMBidirectional Long/Short-Term Memory
LOFLocal Outlier Factor

References

  1. Carneiro, J.; Martinho, D.; Marreiros, G.; Jimenez, A.; Novais, P. Dynamic argumentation in UbiGDSS. Knowl. Inf. Syst. 2018, 55, 633–669. [Google Scholar] [CrossRef]
  2. Carneiro, J.; Martinho, D.; Marreiros, G.; Novais, P. Arguing with behavior influence: A model for web-based group decision support systems. Int. J. Inf. Technol. Decis. Mak. 2019, 18, 517–553. [Google Scholar] [CrossRef]
  3. Carneiro, J.; Alves, P.; Marreiros, G.; Novais, P. A multi-agent system framework for dialogue games in the group decision-making context. In Proceedings of the World Conference on Information Systems and Technologies, Galicia, Spain, 16–19 April 2019; pp. 437–447. [Google Scholar]
  4. Thimm, M. Strategic argumentation in multi-agent systems. KI-Künstliche Intell. 2014, 28, 159–168. [Google Scholar] [CrossRef]
  5. McBurney, P.; Parsons, S. Dialogue games for agent argumentation. In Argumentation in Artificial Intelligence; Springer: Berlin/Heidelberg, Germany, 2009; pp. 261–280. [Google Scholar]
  6. Carneiro, J.; Andrade, R.; Alves, P.; Conceição, L.; Novais, P.; Marreiros, G. A consensus-based group decision support system using a multi-agent MicroServices approach. In Proceedings of the 19th International Conference on Autonomous Agents and MultiAgent Systems, Auckland, New Zealand, 9–13 May 2020; pp. 2098–2100. [Google Scholar]
  7. Carneiro, J.; Alves, P.; Marreiros, G.; Novais, P. Group decision support systems for current times: Overcoming the challenges of dispersed group decision-making. Neurocomputing 2021, 423, 735–746. [Google Scholar] [CrossRef]
  8. Carneiro, J.; Saraiva, P.; Conceição, L.; Santos, R.; Marreiros, G.; Novais, P. Predicting satisfaction: Perceived decision quality by decision-makers in web-based group decision support systems. Neurocomputing 2019, 338, 399–417. [Google Scholar] [CrossRef]
  9. Sun, S.; Luo, C.; Chen, J. A review of natural language processing techniques for opinion mining systems. Inf. Fusion 2017, 36, 10–25. [Google Scholar] [CrossRef]
  10. Chen, X.; Xie, H.; Cheng, G.; Poon, L.K.; Leng, M.; Wang, F.L. Trends and features of the applications of natural language processing techniques for clinical trials text analysis. Appl. Sci. 2020, 10, 2157. [Google Scholar] [CrossRef] [Green Version]
  11. Thanaki, J. Python Natural Language Processing; Packt Publishing Ltd.: Birmingham, UK, 2017. [Google Scholar]
  12. Wright, R.E. Logistic Regression; APA: Washington, DC, USA, 1995. [Google Scholar]
  13. Breiman, L. Random forests. Mach. Learn. 2001, 45, 5–32. [Google Scholar] [CrossRef] [Green Version]
  14. Quinlan, J.R. Probabilistic decision trees. In Machine Learning; Elsevier: Amsterdam, The Netherlands, 1990; pp. 140–152. [Google Scholar]
  15. Fix, E.; Hodges, J.L. Discriminatory analysis. Nonparametric discrimination: Consistency properties. Int. Stat. Rev. Int. Stat. 1989, 57, 238–247. [Google Scholar] [CrossRef]
  16. Hochreiter, S.; Schmidhuber, J. Long short-term memory. Neural Comput. 1997, 9, 1735–1780. [Google Scholar] [CrossRef]
  17. Tax, D.M.J. One-Class Classification: Concept Learning in the Absence of Counter-Examples. 2002. Available online: https://www.proquest.com/docview/304771559 (accessed on 1 October 2021).
  18. Liu, F.T.; Ting, K.M.; Zhou, Z.H. Isolation forest. In Proceedings of the 2008 Eighth IEEE International Conference on Data Mining, Pisa, Italy, 15–19 December 2008; pp. 413–422. [Google Scholar]
  19. Breunig, M.M.; Kriegel, H.P.; Ng, R.T.; Sander, J. LOF: Identifying density-based local outliers. In Proceedings of the 2000 ACM SIGMOD International Conference on Management of Data, Dallas, TX, USA, 16–18 May 2000; pp. 93–104. [Google Scholar]
  20. Nilashi, M.; Ibrahim, O.; Yadegaridehkordi, E.; Samad, S.; Akbari, E.; Alizadeh, A. Travelers decision making using online review in social network sites: A case on TripAdvisor. J. Comput. Sci. 2018, 28, 168–179. [Google Scholar] [CrossRef]
  21. Cenni, I.; Goethals, P. Negative hotel reviews on TripAdvisor: A cross-linguistic analysis. Discourse Context Media 2017, 16, 22–30. [Google Scholar] [CrossRef]
  22. Valdivia, A.; Luzón, M.V.; Herrera, F. Sentiment analysis in tripadvisor. IEEE Intell. Syst. 2017, 32, 72–77. [Google Scholar] [CrossRef]
  23. Al-Ghuribi, S.M.; Noah, S.A.M. Multi-criteria review-based recommender system–the state of the art. IEEE Access 2019, 7, 169446–169468. [Google Scholar] [CrossRef]
  24. Kbaier, M.E.B.H.; Masri, H.; Krichen, S. A personalized hybrid tourism recommender system. In Proceedings of the 2017 IEEE/ACS 14th International Conference on Computer Systems and Applications (AICCSA), Hammamet, Tunisia, 30 October–3 November 2017; pp. 244–250. [Google Scholar]
  25. Logesh, R.; Subramaniyaswamy, V.; Vijayakumar, V.; Li, X. Efficient user profiling based intelligent travel recommender system for individual and group of users. Mob. Netw. Appl. 2019, 24, 1018–1033. [Google Scholar] [CrossRef]
  26. Smets, A.; Vannieuwenhuyze, J.; Ballon, P. Serendipity in the city: User evaluations of urban recommender systems. J. Assoc. Inf. Sci. Technol. 2022, 73, 19–30. [Google Scholar] [CrossRef]
  27. Alam, M.H.; Ryu, W.J.; Lee, S. Joint multi-grain topic sentiment: Modeling semantic aspects for online reviews. Inf. Sci. 2016, 339, 206–223. [Google Scholar] [CrossRef]
  28. Aydemir, G.; Acar, B. Anomaly monitoring improves remaining useful life estimation of industrial machinery. J. Manuf. Syst. 2020, 56, 463–469. [Google Scholar] [CrossRef]
  29. Souza, R.M.; Nascimento, E.G.; Miranda, U.A.; Silva, W.J.; Lepikson, H.A. Deep learning for diagnosis and classification of faults in industrial rotating machinery. Comput. Ind. Eng. 2021, 153, 107060. [Google Scholar] [CrossRef]
  30. Ruiz-Sarmiento, J.R.; Monroy, J.; Moreno, F.A.; Galindo, C.; Bonelo, J.M.; Gonzalez-Jimenez, J. A predictive model for the maintenance of industrial machinery in the context of industry 4.0. Eng. Appl. Artif. Intell. 2020, 87, 103289. [Google Scholar] [CrossRef]
  31. Carcillo, F.; Le Borgne, Y.A.; Caelen, O.; Kessaci, Y.; Oblé, F.; Bontempi, G. Combining unsupervised and supervised learning in credit card fraud detection. Inf. Sci. 2019, 557, 317–331. [Google Scholar] [CrossRef]
  32. John, H.; Naaz, S. Credit card fraud detection using local outlier factor and isolation forest. Int. J. Comput. Sci. Eng. 2019, 7, 1060–1064. [Google Scholar] [CrossRef]
  33. Rtayli, N.; Enneya, N. Enhanced credit card fraud detection based on SVM-recursive feature elimination and hyper-parameters optimization. J. Inf. Secur. Appl. 2020, 55, 102596. [Google Scholar] [CrossRef]
  34. Gong, D.; Liu, L.; Le, V.; Saha, B.; Mansour, M.R.; Venkatesh, S.; Hengel, A.V.d. Memorizing normality to detect anomaly: Memory-augmented deep autoencoder for unsupervised anomaly detection. In Proceedings of the IEEE/CVF International Conference on Computer Vision, Seoul, Korea, 27–28 October 2019; pp. 1705–1714. [Google Scholar]
  35. Chow, J.K.; Su, Z.; Wu, J.; Tan, P.S.; Mao, X.; Wang, Y.H. Anomaly detection of defects on concrete structures with the convolutional autoencoder. Adv. Eng. Inform. 2020, 45, 101105. [Google Scholar] [CrossRef]
  36. Jombart, T.; Ghozzi, S.; Schumacher, D.; Taylor, T.J.; Leclerc, Q.J.; Jit, M.; Flasche, S.; Greaves, F.; Ward, T.; Eggo, R.M.; et al. Real-time monitoring of COVID-19 dynamics using automated trend fitting and anomaly detection. Philos. Trans. R. Soc. 2021, 376, 20200266. [Google Scholar] [CrossRef]
  37. Naidoo, K.; Marivate, V. Unsupervised anomaly detection of healthcare providers using generative adversarial networks. Responsible Des. Implement. Use Inf. Commun. Technol. 2020, 12066, 419. [Google Scholar]
  38. Yuan, M.; Boston-Fisher, N.; Luo, Y.; Verma, A.; Buckeridge, D.L. A systematic review of aberration detection algorithms used in public health surveillance. J. Biomed. Inform. 2019, 94, 103181. [Google Scholar] [CrossRef]
  39. Shone, N.; Ngoc, T.N.; Phai, V.D.; Shi, Q. A deep learning approach to network intrusion detection. IEEE Trans. Emerg. Top. Comput. Intell. 2018, 2, 41–50. [Google Scholar] [CrossRef] [Green Version]
  40. Vinayakumar, R.; Soman, K.; Poornachandran, P. Applying convolutional neural network for network intrusion detection. In Proceedings of the 2017 International Conference on Advances in Computing, Communications and Informatics (ICACCI), Udupi, India, 13–16 September 2017; pp. 1222–1228. [Google Scholar]
  41. Van, N.T.; Thinh, T.N. An anomaly-based network intrusion detection system using deep learning. In Proceedings of the 2017 International Conference on System Science and Engineering (ICSSE), Ho Chi Minh City, Vietnam, 21–23 July 2017; pp. 210–214. [Google Scholar]
  42. Althubiti, S.A.; Jones, E.M.; Roy, K. Lstm for anomaly-based network intrusion detection. In Proceedings of the 2018 28th International Telecommunication Networks and Applications Conference (ITNAC), Sydney, Australia, 21–23 November 2018; pp. 1–3. [Google Scholar]
  43. Chen, T.; Liu, X.; Xia, B.; Wang, W.; Lai, Y. Unsupervised anomaly detection of industrial robots using sliding-window convolutional variational autoencoder. IEEE Access 2020, 8, 47072–47081. [Google Scholar] [CrossRef]
  44. Pourhabibi, T.; Ong, K.L.; Kam, B.H.; Boo, Y.L. Fraud detection: A systematic literature review of graph-based anomaly detection approaches. Decis. Support Syst. 2020, 133, 113303. [Google Scholar] [CrossRef]
  45. Santhosh, K.K.; Dogra, D.P.; Roy, P.P. Anomaly detection in road traffic using visual surveillance: A survey. ACM Comput. Surv. (CSUR) 2020, 53, 1–26. [Google Scholar] [CrossRef]
  46. Fenza, G.; Gallo, M.; Loia, V. Drift-aware methodology for anomaly detection in smart grid. IEEE Access 2019, 7, 9645–9657. [Google Scholar] [CrossRef]
  47. Meira, J.; Andrade, R.; Praça, I.; Carneiro, J.; Bolón-Canedo, V.; Alonso-Betanzos, A.; Marreiros, G. Performance evaluation of unsupervised techniques in cyber-attack anomaly detection. J. Ambient. Intell. Humaniz. Comput. 2019, 11, 4477–4489. [Google Scholar] [CrossRef]
  48. Bishop, C.M.; Nasrabadi, N.M. Pattern Recognition and Machine Learning; Springer: Berlin/Heidelberg, Germany, 2006; Volume 4. [Google Scholar]
Figure 1. Distribution by “Rating”.
Electronics 11 00779 g001
Figure 2. Correlation between the average number of words in the “Review” with the assigned “Rating”.
Electronics 11 00779 g002
Figure 3. Density of the “Polarity” attribute obtained with Textblob.
Electronics 11 00779 g003
Figure 4. Correlation between “Polarity” and “Rating”.
Electronics 11 00779 g004
Figure 5. Correlation between “Subjectivity” and “Rating”.
Electronics 11 00779 g005
Figure 6. Algorithms’ accuracy for the classification method (Y = “Rating”).
Electronics 11 00779 g006
Figure 7. Algorithms’ accuracy for the classification method (Y = “Sentiment”).
Electronics 11 00779 g007
Figure 8. Algorithms’ Mean Absolute Error for the regression method (Y = “Rating”).
Electronics 11 00779 g008
Figure 9. Algorithms’ Mean Absolute Error for the regression method (Y = “Sentiment”).
Electronics 11 00779 g009
Figure 10. Anomaly scores distinguishing sentiment 1 from sentiment 0. First graphic represents the Isolation Forest results, second shows OCKNN results, and third shows LOF results. The y-axis represents the scores and the x-axis represents the sample indices.
Electronics 11 00779 g010
Figure 11. First experiment—isolating class 0 from Y = “Sentiment” in Logistic Regression output using LOF.
Electronics 11 00779 g011
Figure 12. Second experiment—isolating class 1 from Y = “Sentiment” feature in Logistic Regression output using LOF.
Electronics 11 00779 g012
Figure 13. Third experiment—isolating class 1 from Y = “Ranking” in Logistic Regression output using LOF.
Electronics 11 00779 g013
Figure 14. Fourth experiment—isolating class 5 from Y = “Ranking” in Logistic Regression output using LOF.
Electronics 11 00779 g014
Table 1. Small example of the used dataset.
ReviewRating
nice hotel expensive parking got good deal sta…4
ok nothing special charge diamond member hilto…2
nice rooms not 4* experience hotel monaco seat…3
unique, great stay, wonderful time hotel monac…5
great stay great stay, went seahawk game aweso…5
Table 2. List of the most used words in reviews.
Word#Word#Word#Word#Word#
hotel42,079not30,750room30,532great18,732n’t18,436
staff14,950good14,791did13,433just12,458stay11,376
no11,360rooms10,935nice10,918stayed10,022location9515
service8549breakfast8407beach8218food8026like7677
clean7658time7615really7612night7596
Table 3. Precision and recall for scenario 4 with the classification method (Y = “Rating”).
PrecisionRecall
L 1L 2L 3L 4L 5L 1L 2L 3L 4L 5
Logistic Regression0.660.470.460.530.720.650.400.270.520.82
Random Forest0.630.480.420.470.640.700.270.040.390.90
Decision Tree0.490.330.230.390.620.500.320.230.390.62
KNN0.370.200.190.400.640.600.220.180.310.67
BiLSTM0000.29000010
Table 4. Precision and recall for scenario 4 with the classification method (Y = “Sentiment”).
PrecisionRecall
L 1L 2L 1L 2
Logistic Regression0.8496240.9463890.7027360.976846
Random Forest0.8735410.9229770.5584580.98495
Decision Tree0.6574310.9348580.6492540.937022
KNN0.7351520.9231110.5696520.96179671
BiLSTM00.84306101
Table 5. Mean Squared Error (MSE), Root Mean Square Error (RMSE), and Mean Absolute Error (MAE) for scenario 4 with the regression method (Y = “Rating”).
MSERMSEMAE
Logistic Regression4.1408722.0349131.77198
Random Forest0.7337710.8566040.694623
Decision Tree8.0185442.8317031.942417
KNN5.8189652.4122532.007092
BiLSTM1.5224141.2338620.978359
Table 6. Mean Squared Error (MSE), Root Mean Square Error (RMSE), and Mean Absolute Error (MAE) for scenario 4 with the regression method (Y = “Sentiment”).
MSERMSEMAE
Logistic Regression0.0978120.3127490.154837
Random Forest0.073460.2710340.146088
Decision Tree0.1549870.3936840.154987
KNN0.0954740.3089880.143406
BiLSTM0.1323270.3637680.267391
Publisher’s Note: MDPI stays neutral with regard to jurisdictional claims in published maps and institutional affiliations.

