
Towards a Digital Twin of Coronary Stenting: A Suitable and Validated Image-Based Approach for Mimicking Patient-Specific Coronary Arteries

 , ,
, ,  ,
,  ,
,  and
and
Abstract
: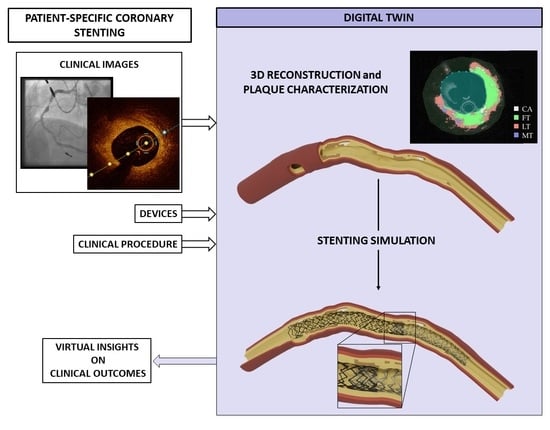
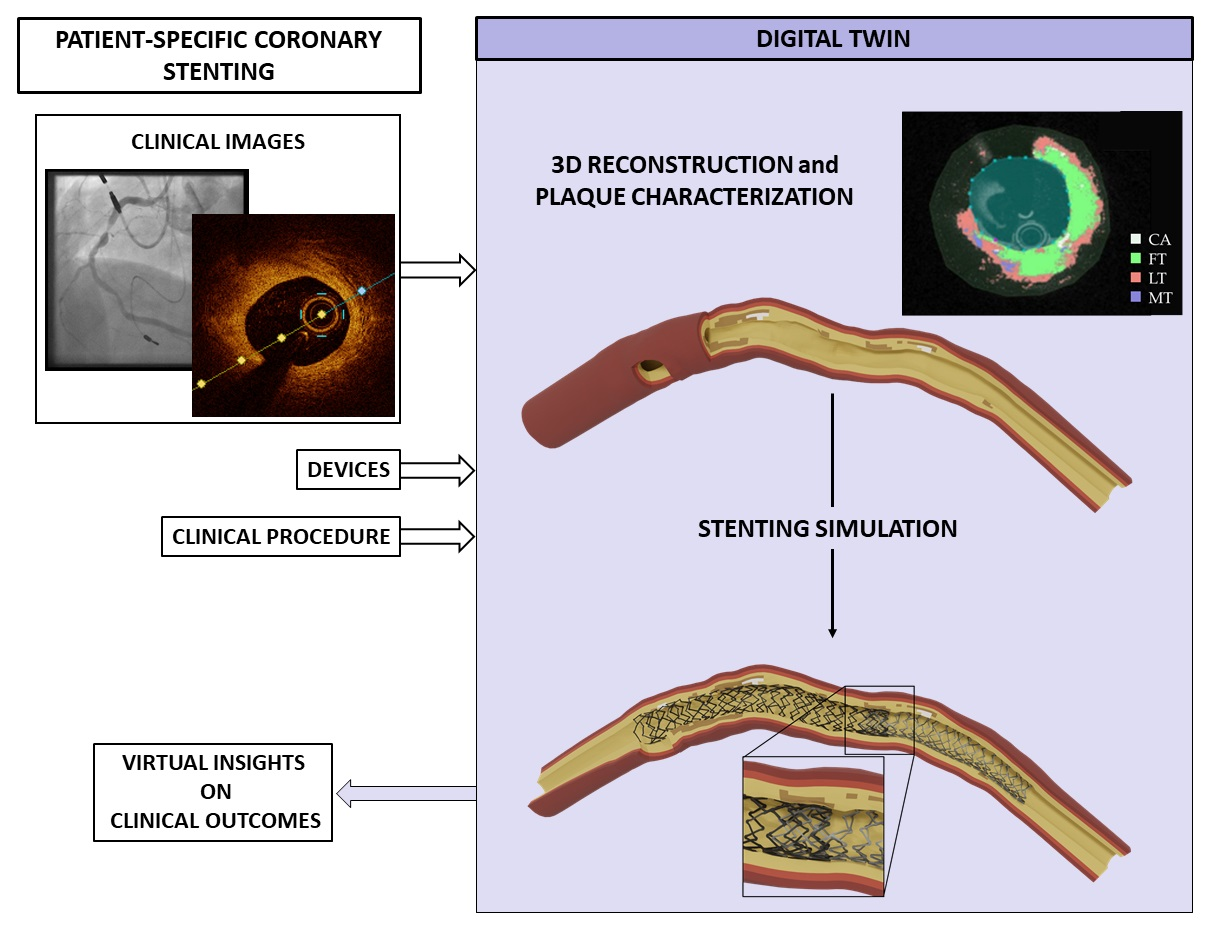
1. Introduction
2. Materials and Methods
2.1. Finite Element Model of Patient-Specific Coronary Arteries
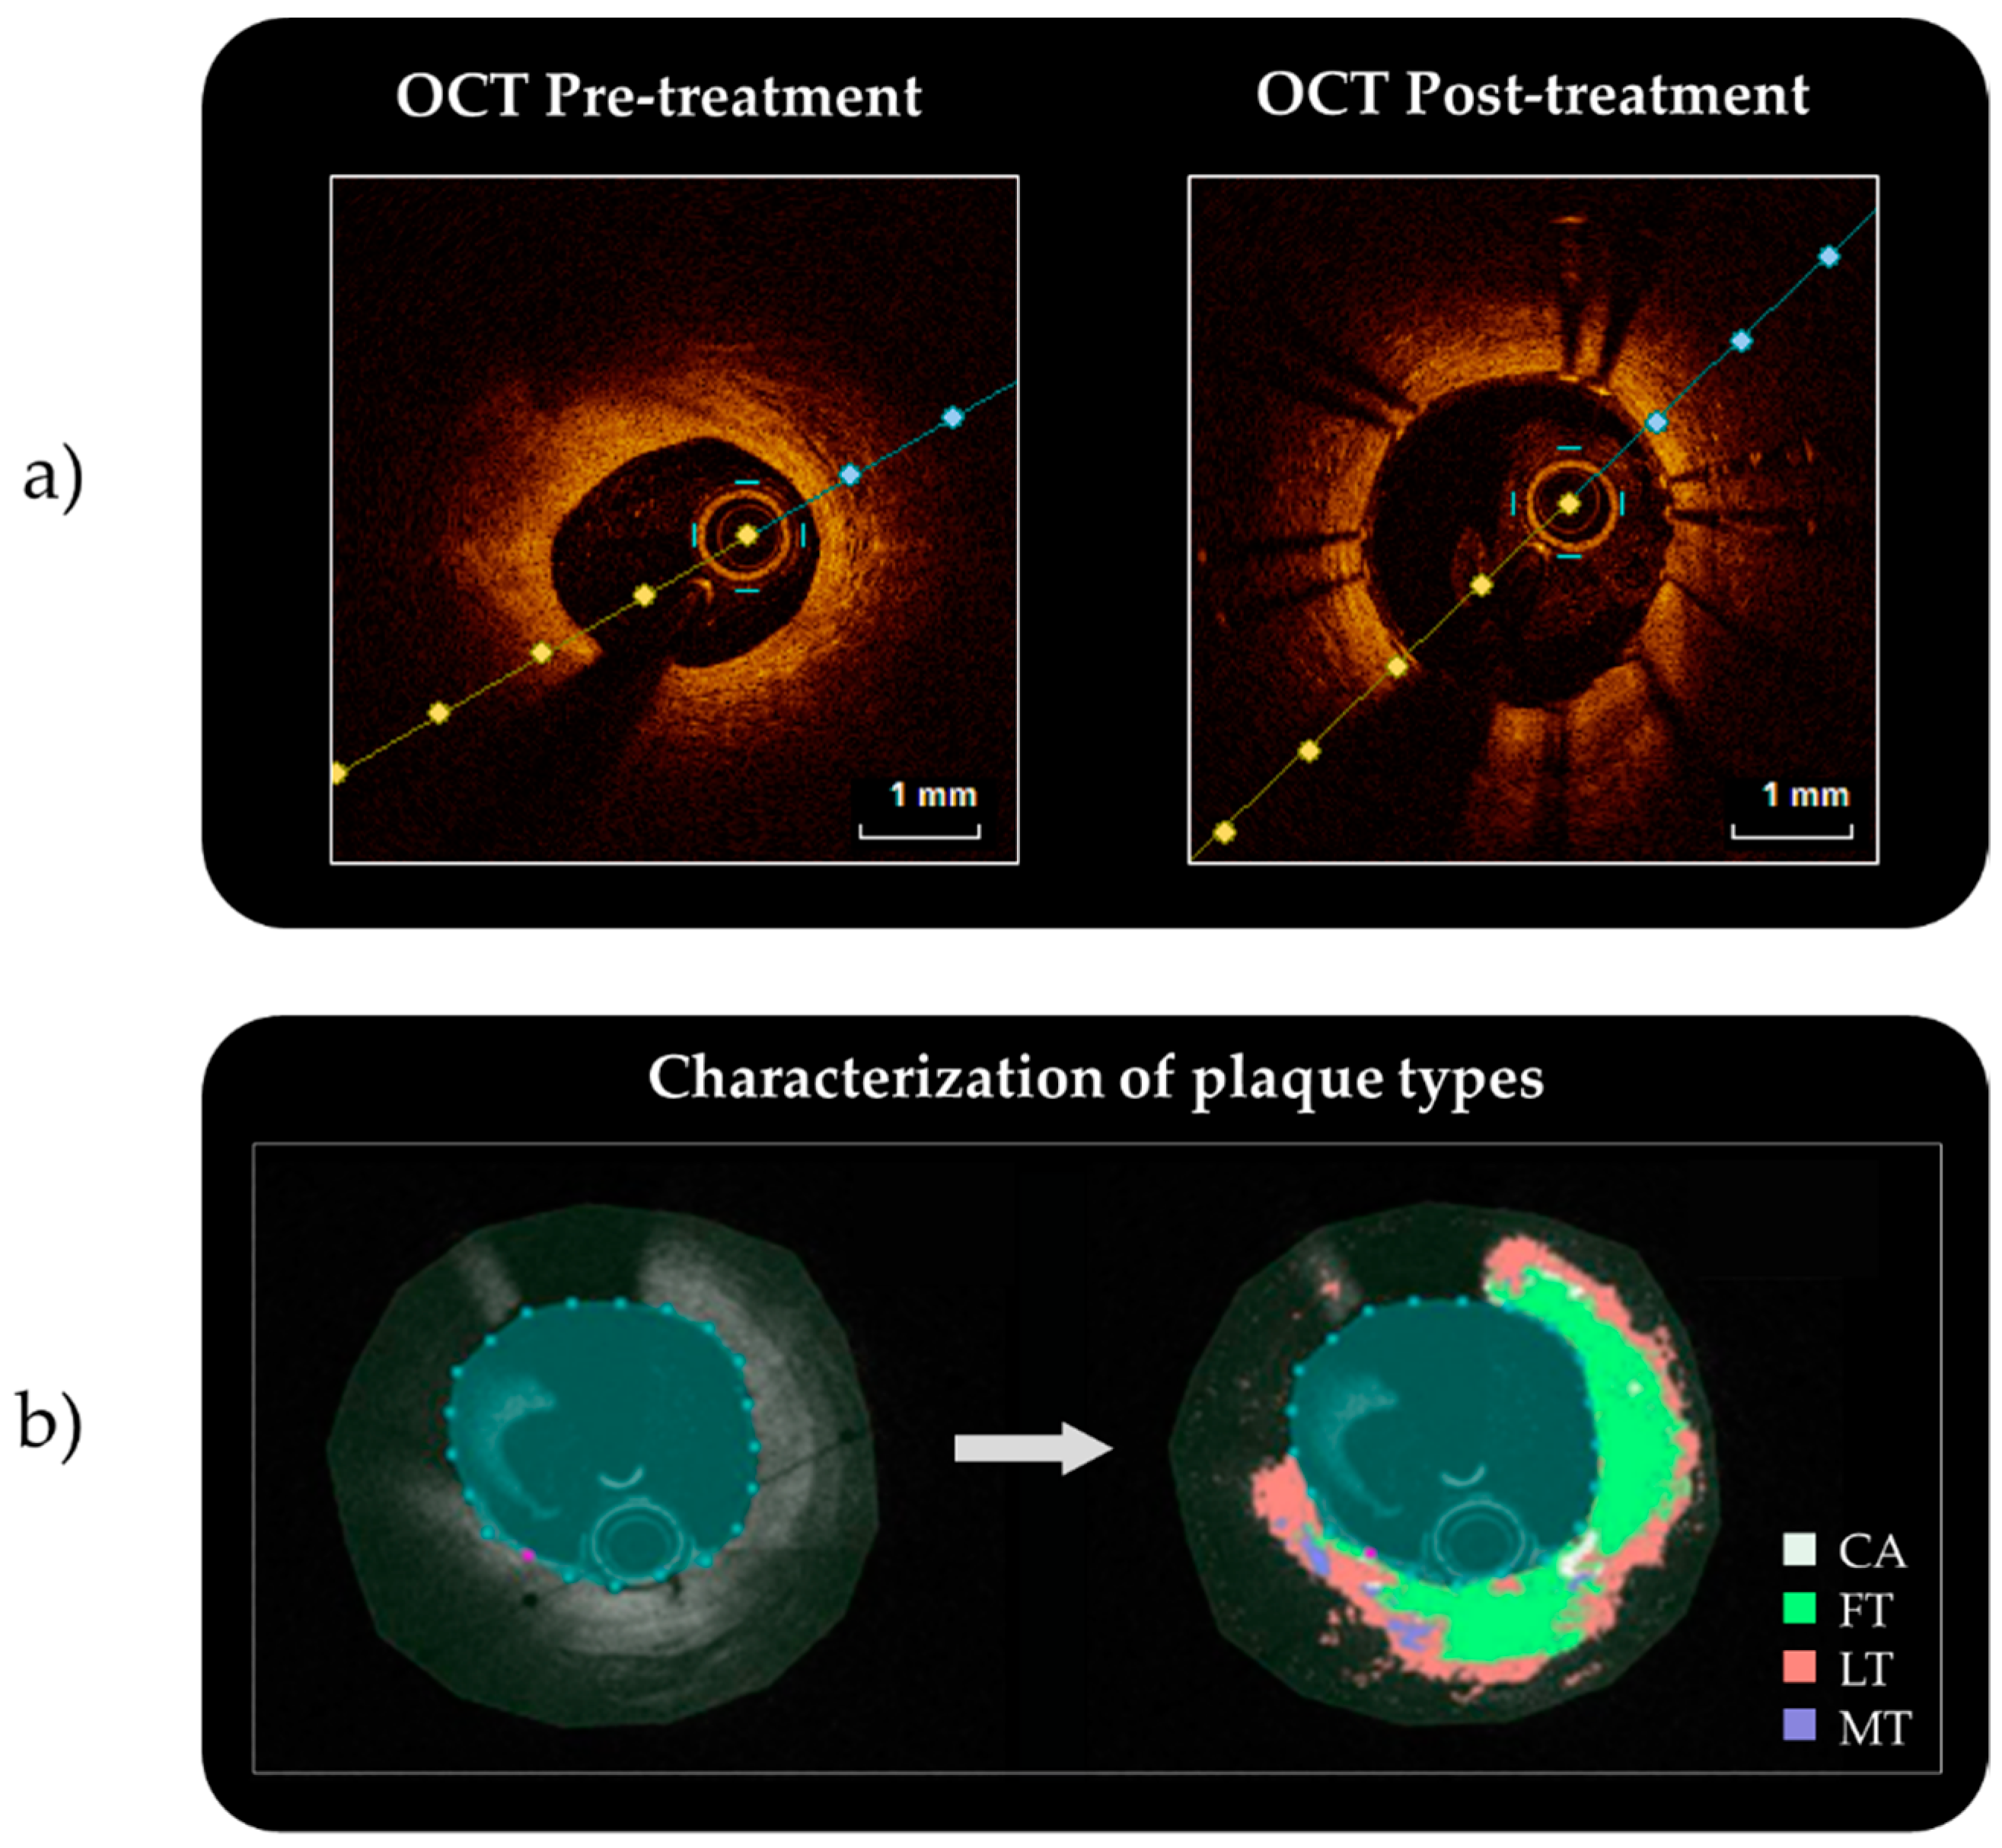
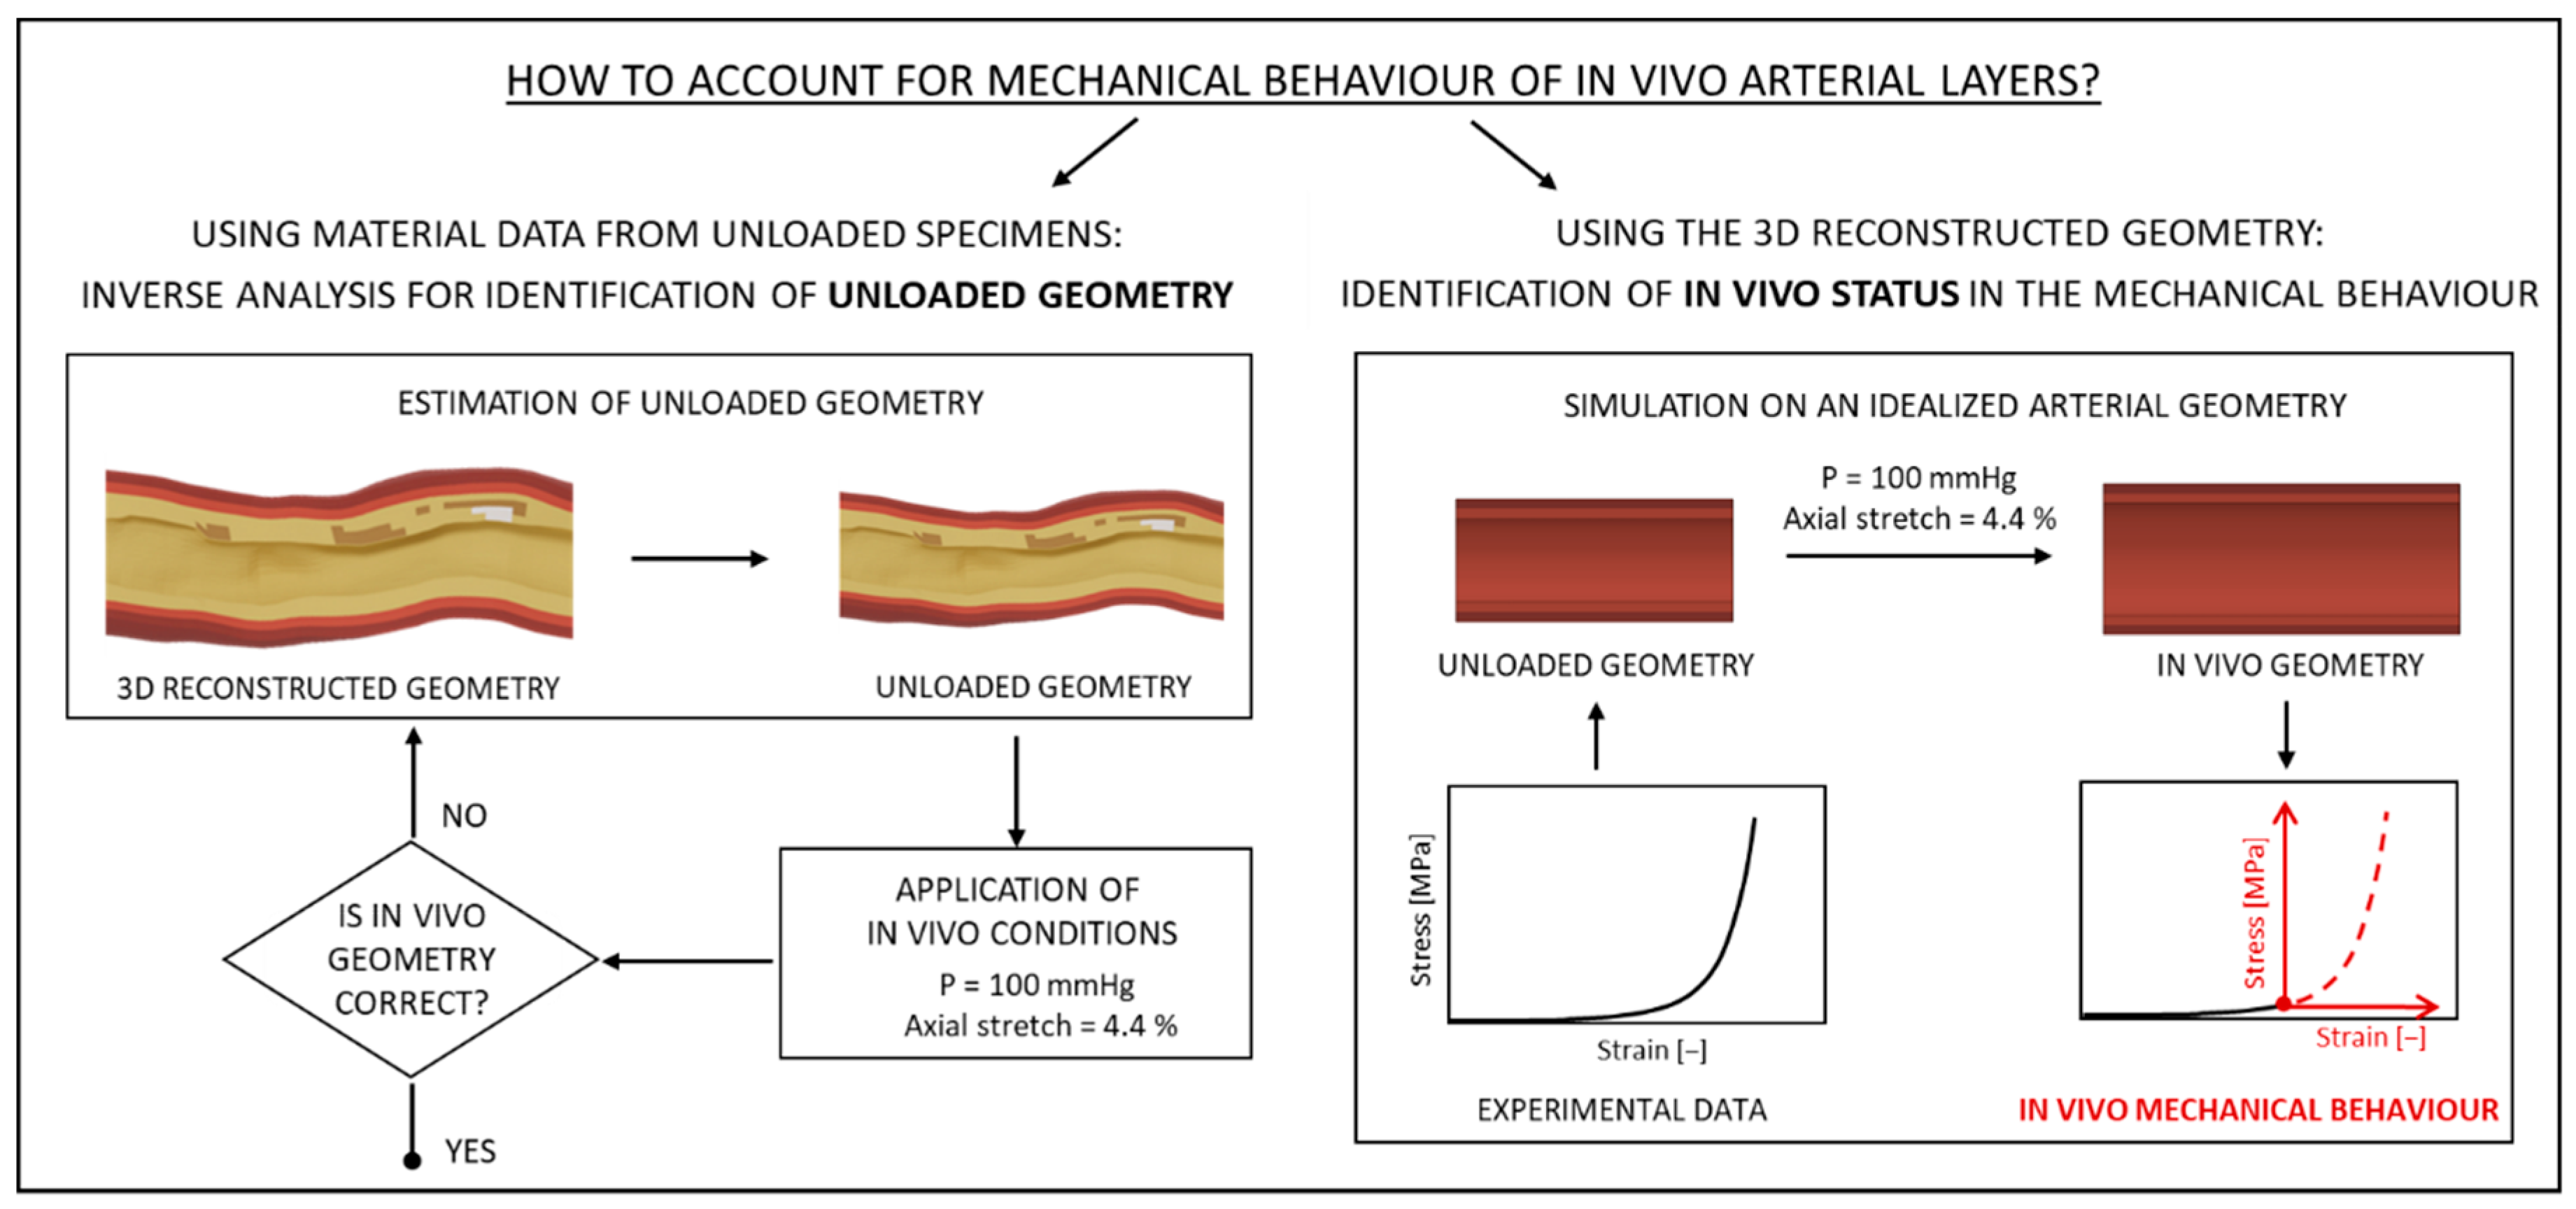
2.1.1. From the Clinical Images to the 3D Reconstruction
2.1.2. Discretization of the 3D Reconstructed Geometries
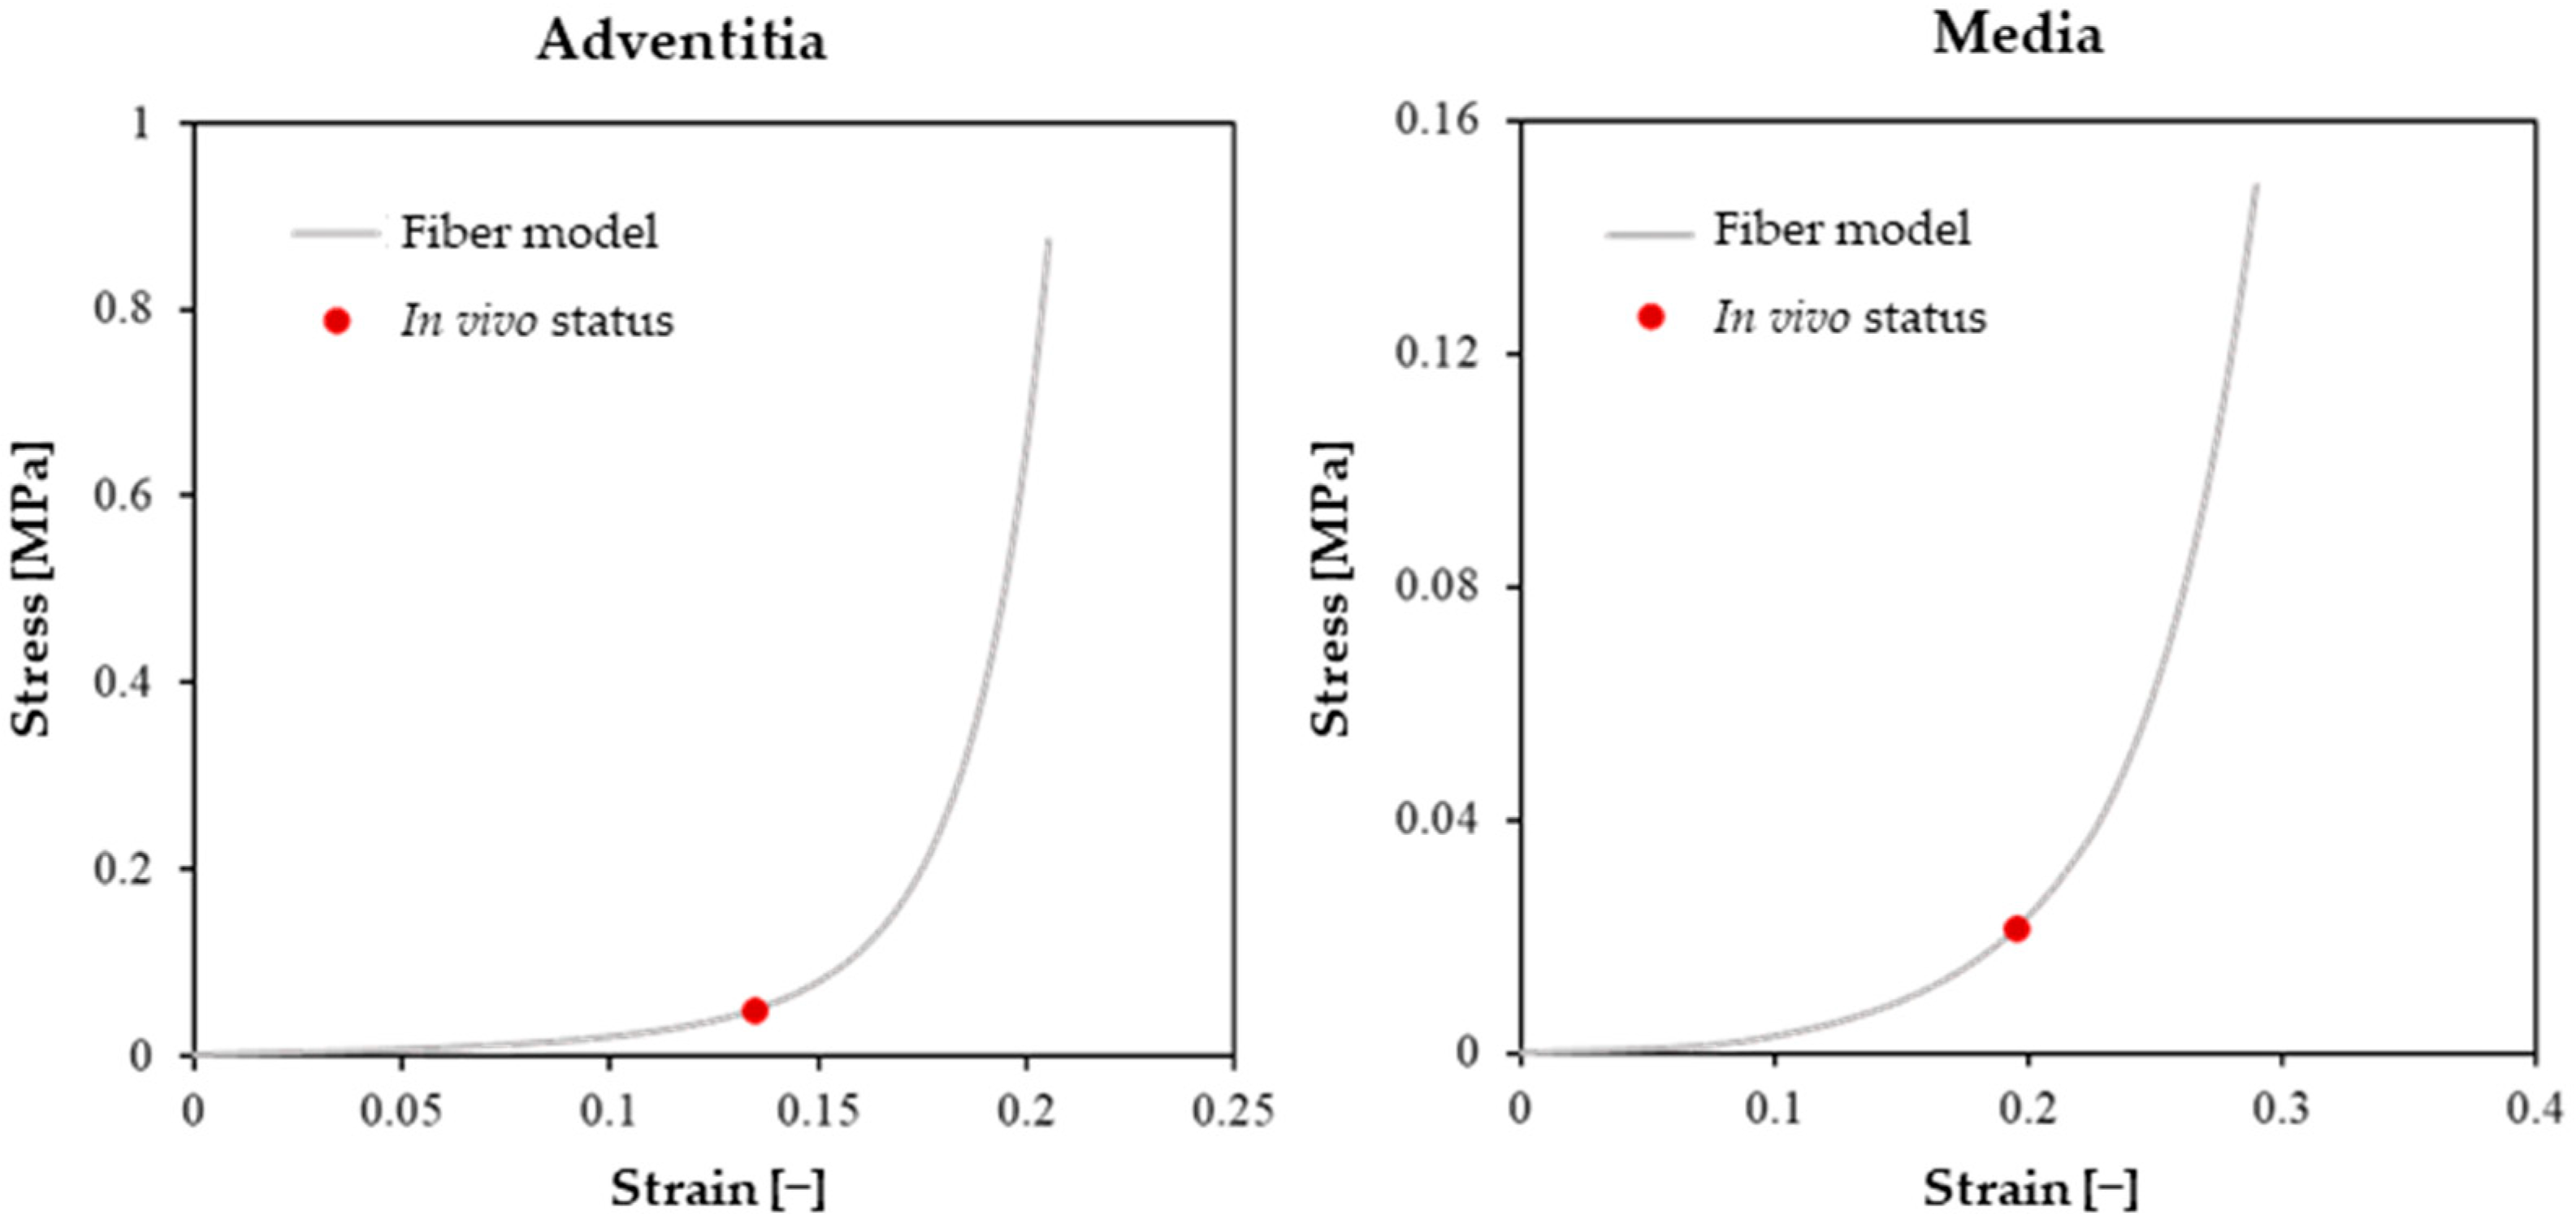
2.1.3. Mechanical Description of the Different Considered Tissues
2.2. In Silico Replication of the Treatment of the Two Patient-Specific Cases
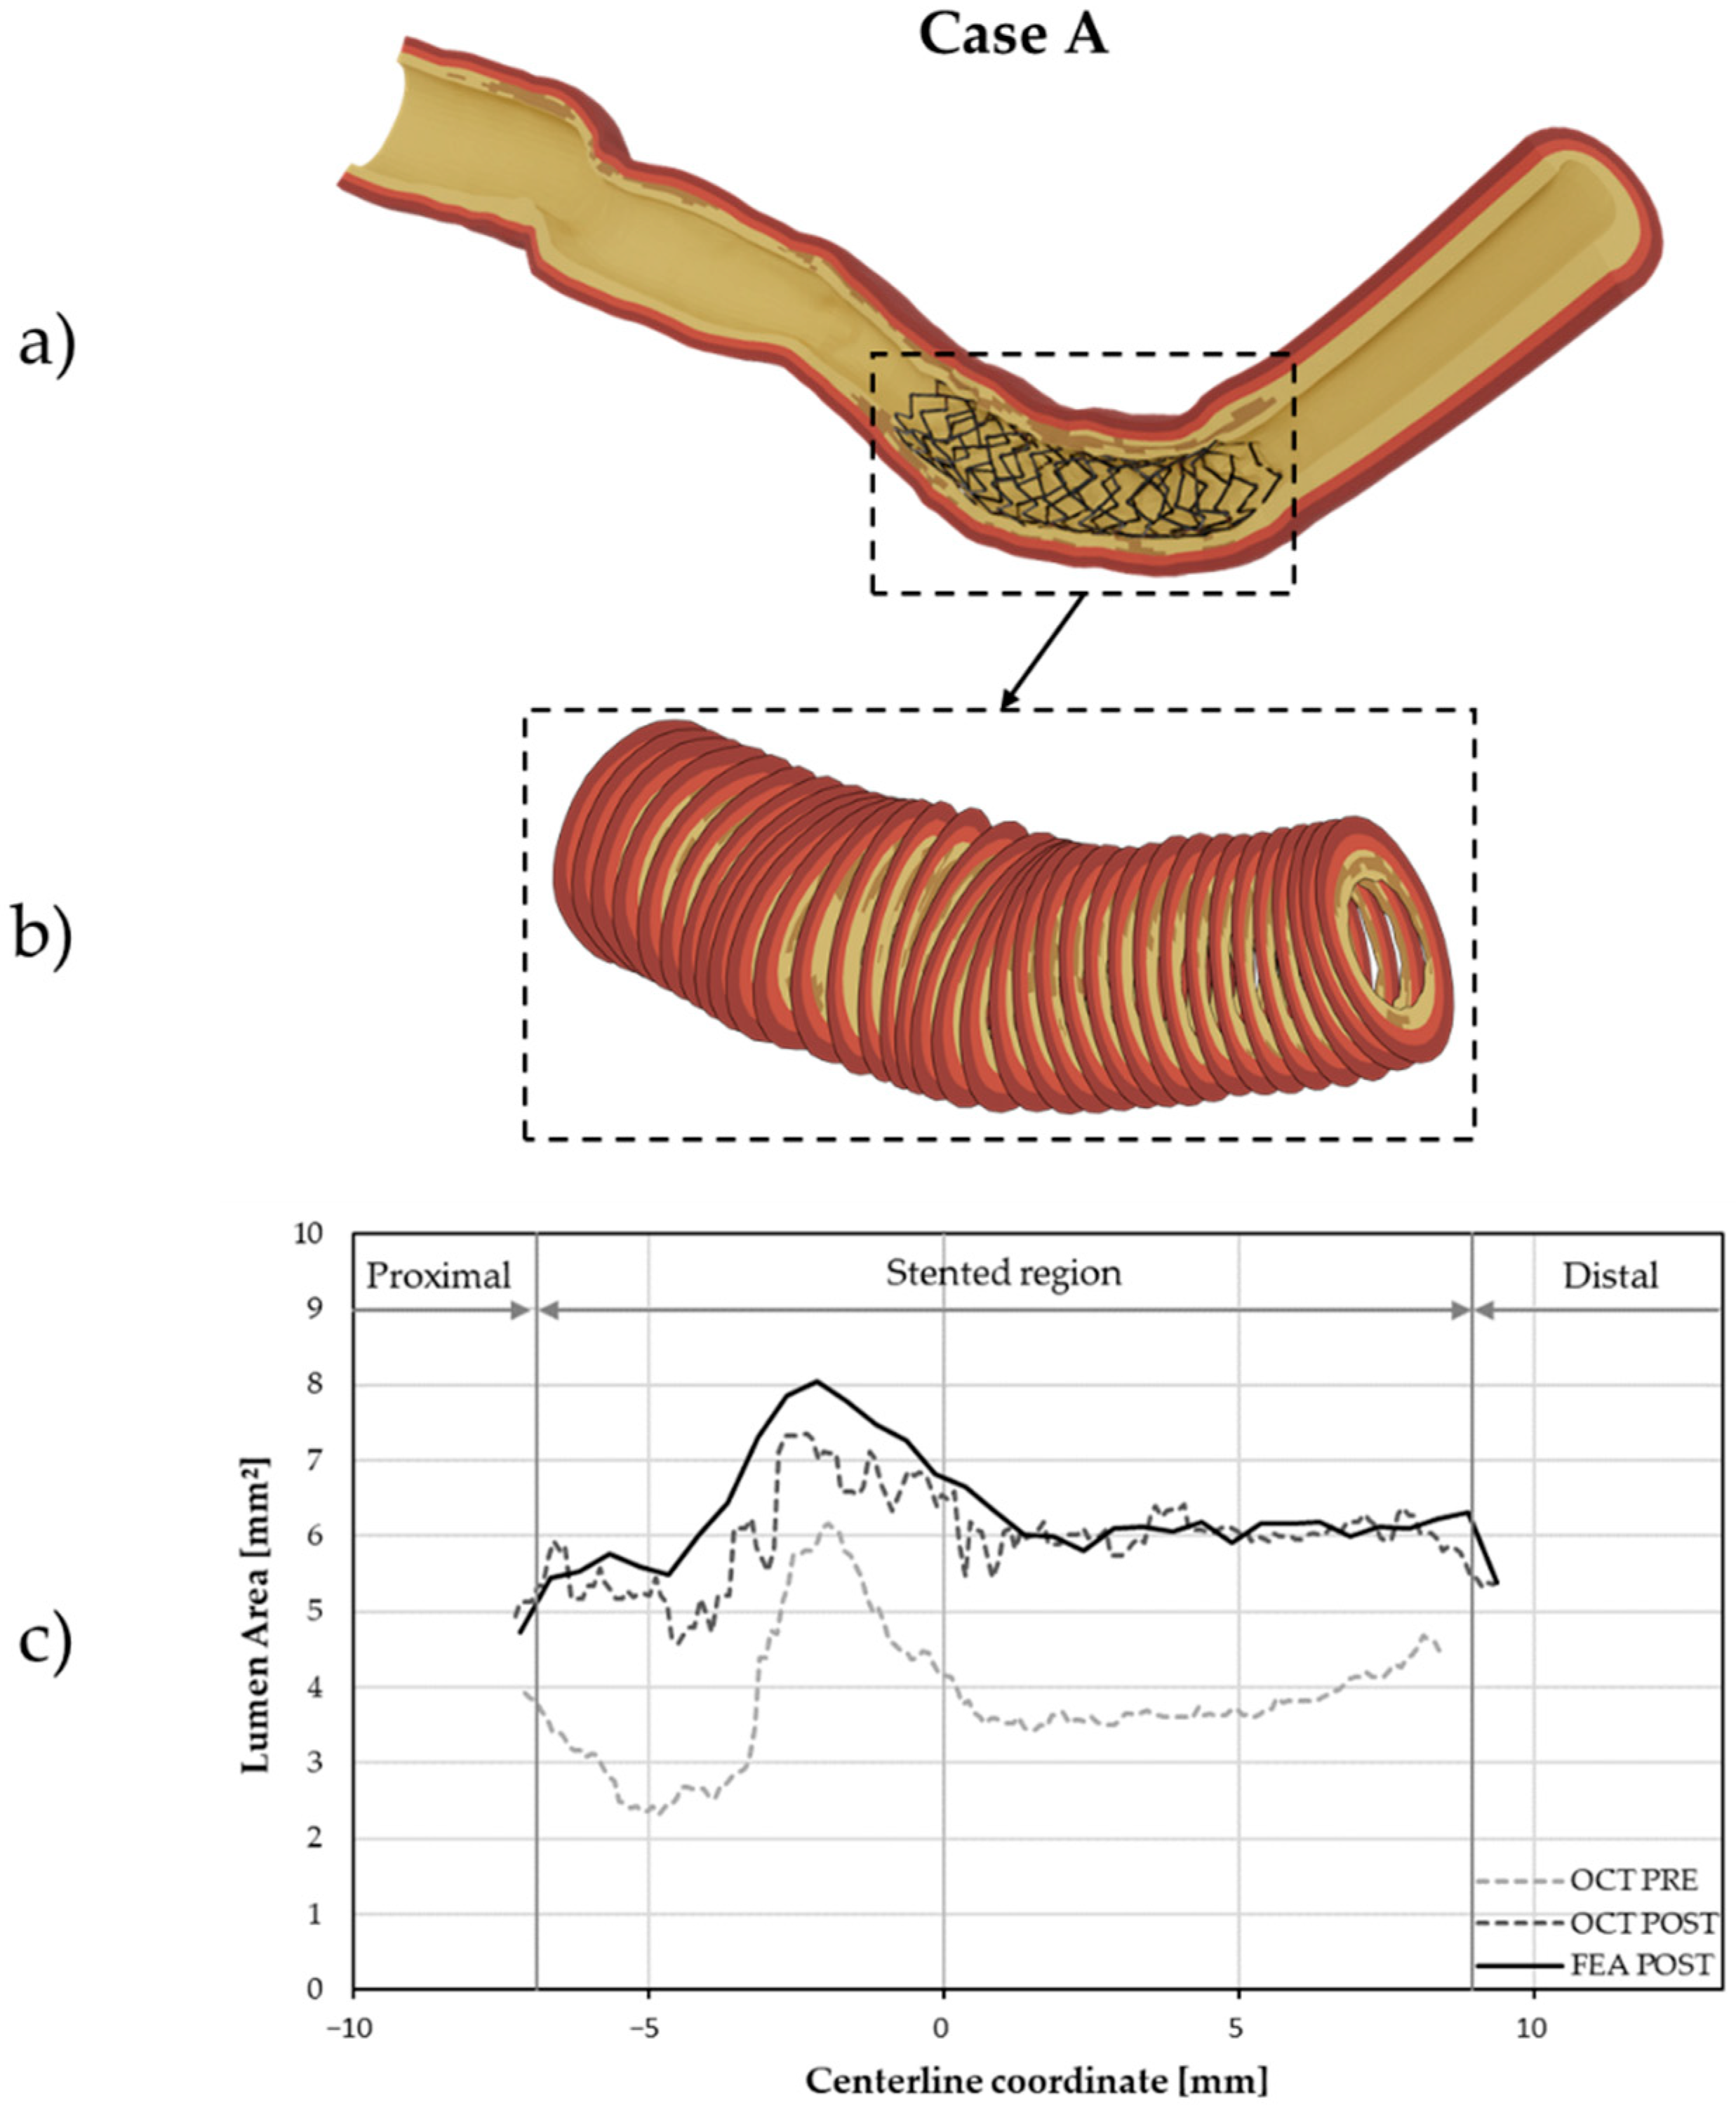
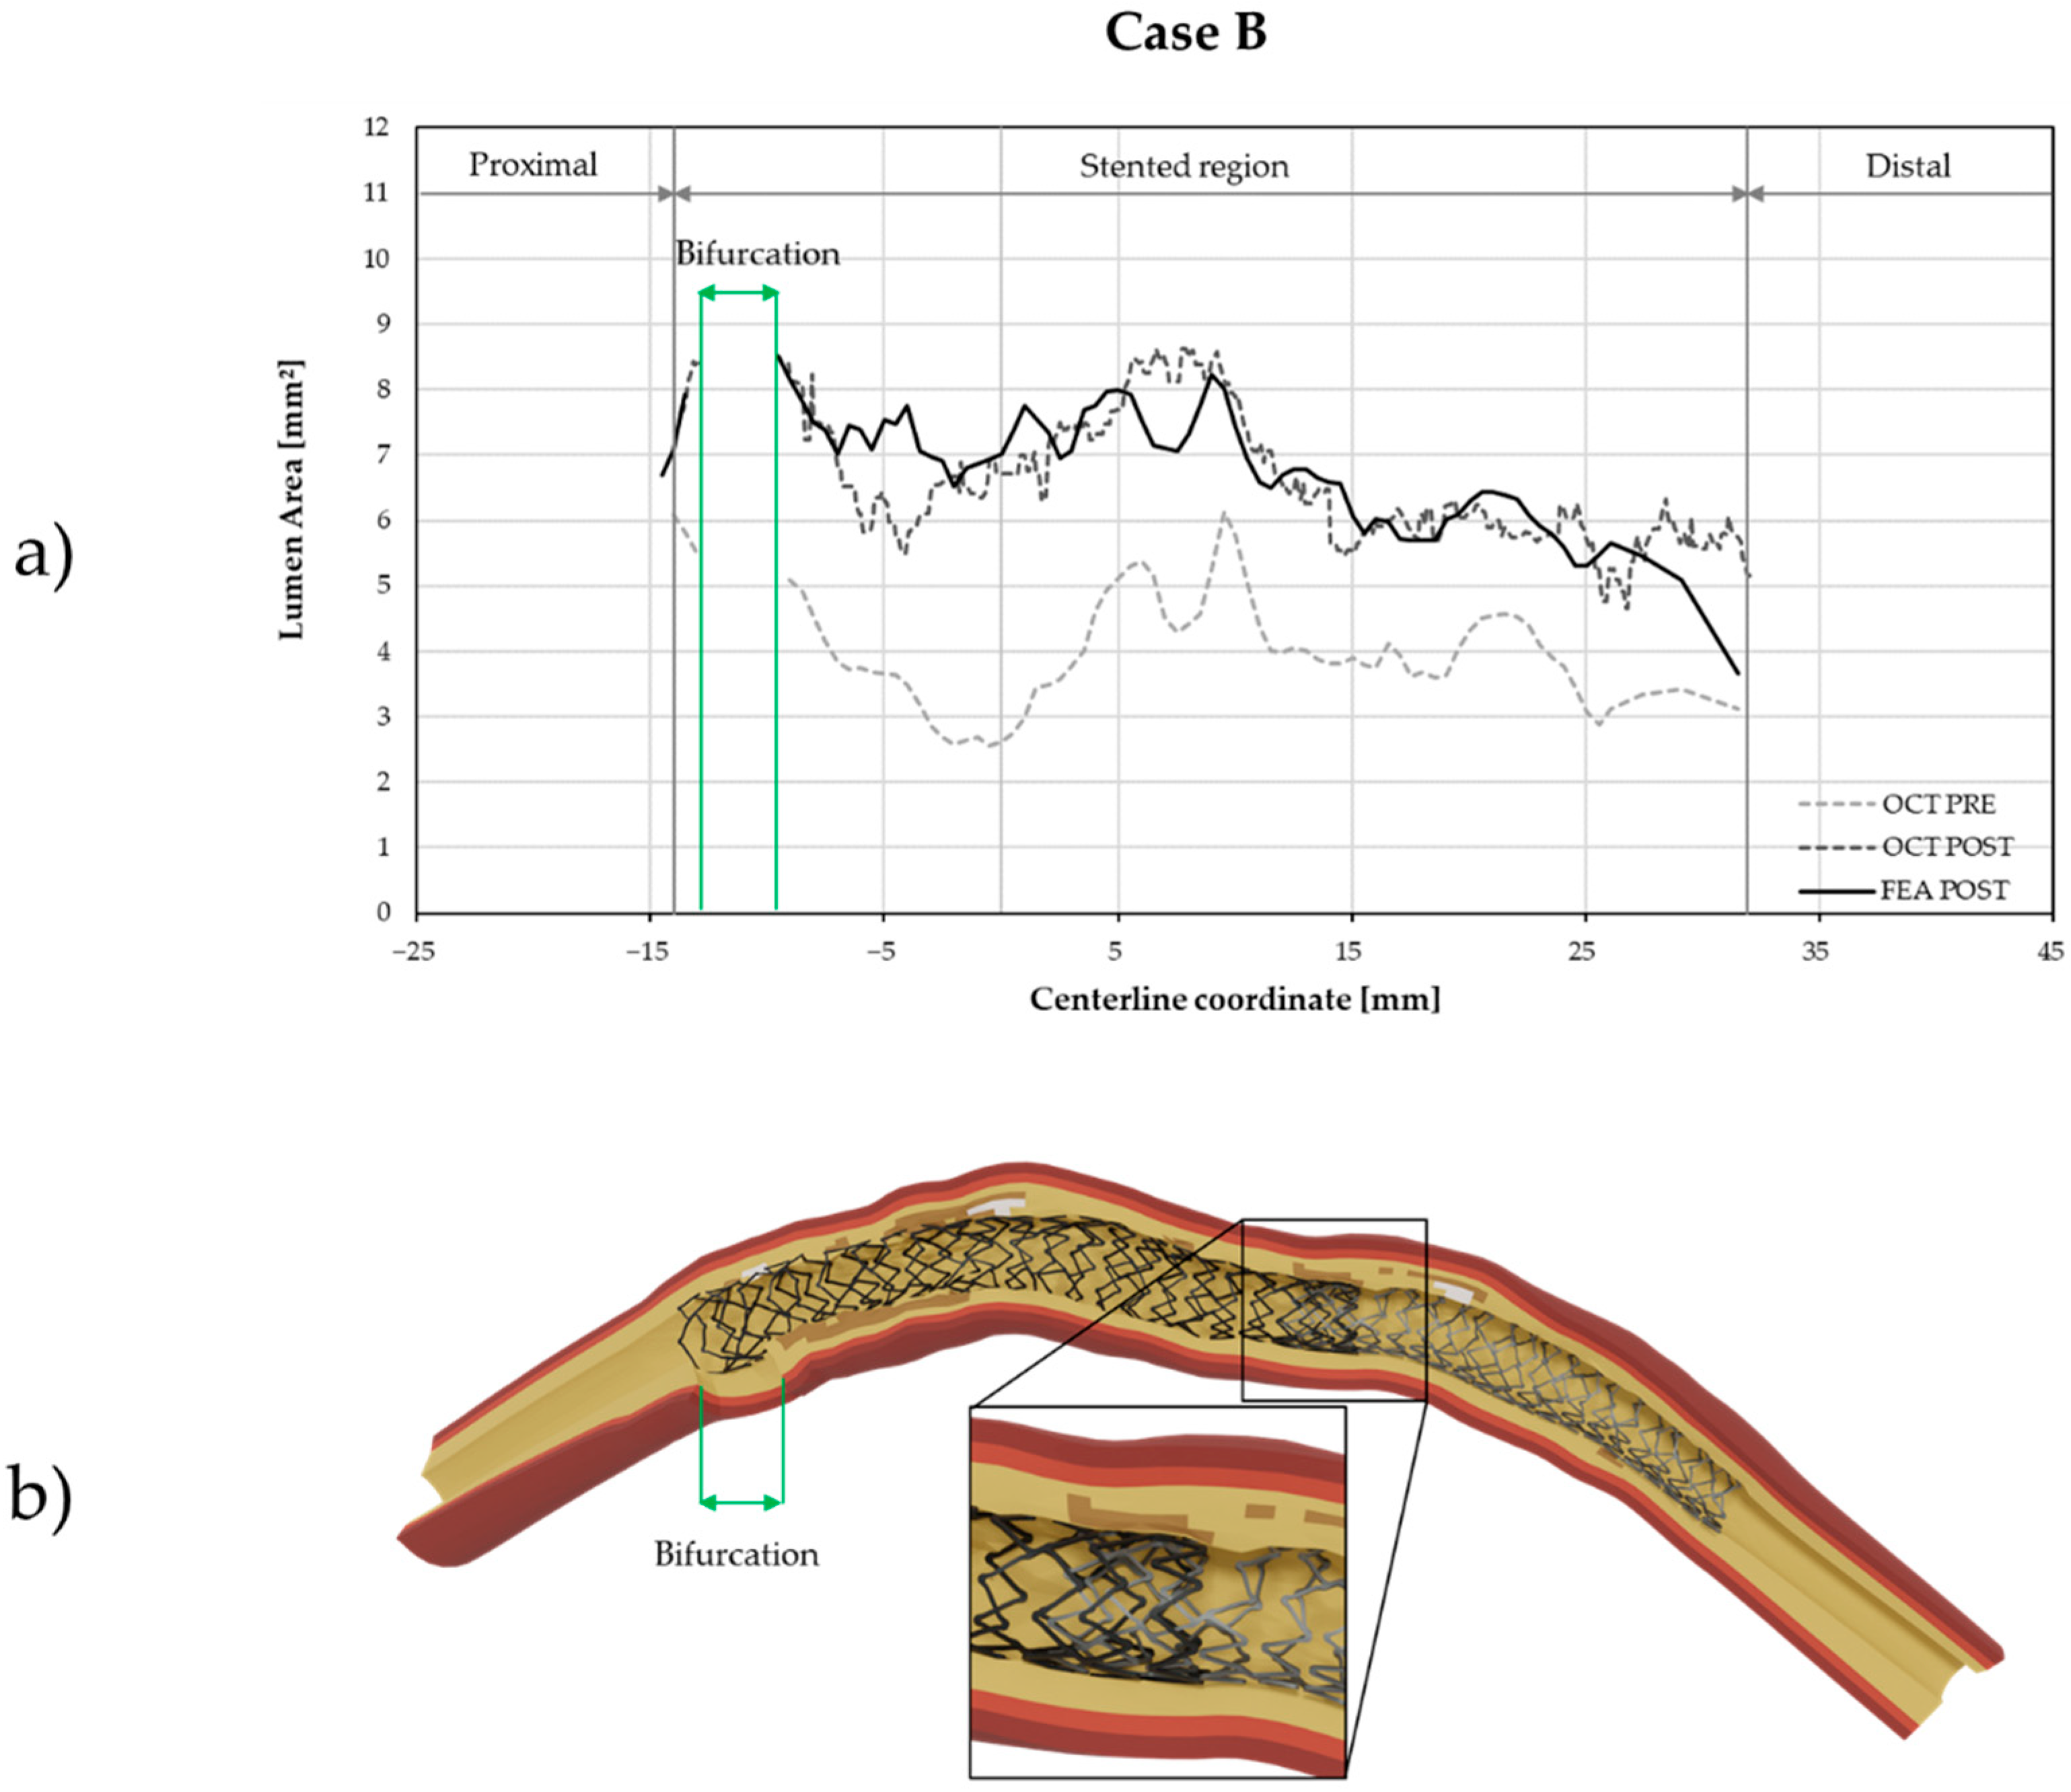
3. Results
4. Discussion
5. Conclusions
Author Contributions
Funding
Institutional Review Board Statement
Informed Consent Statement
Data Availability Statement
Acknowledgments
Conflicts of Interest
References
- Timmis, A.; Townsend, N.; Gale, C.P.; Torbica, A.; Lettino, M.; Petersen, S.E.; Mossialos, E.A.; Maggioni, A.P.; Kazakiewicz, D.; May, H.T.; et al. European society of cardiology: Cardiovascular disease statistics 2019. Eur. Heart J. 2020, 41, 12–85. [Google Scholar] [CrossRef] [PubMed]
- Byrne, R.A.; Joner, M.; Kastrati, A. Stent thrombosis and restenosis: What have we learned and where are we going? the Andreas Grüntzig Lecture ESC 2014. Eur. Heart J. 2015, 36, 3320–3331. [Google Scholar] [CrossRef] [Green Version]
- Chiastra, C.; Wu, W.; Dickerhoff, B.; Aleiou, A.; Dubini, G.; Otake, H.; Migliavacca, F.; LaDisa, J.F. Computational replication of the patient-specific stenting procedure for coronary artery bifurcations: From OCT and CT imaging to structural and hemodynamics analyses. J. Biomech. 2016, 49, 2102–2111. [Google Scholar] [CrossRef] [PubMed] [Green Version]
- Conway, C.; McGarry, J.P.; Edelman, E.R.; McHugh, P.E. Numerical Simulation of Stent Angioplasty with Predilation: An Investigation into Lesion Constitutive Representation and Calcification Influence. Ann. Biomed. Eng. 2017, 45, 2244–2252. [Google Scholar] [CrossRef] [Green Version]
- He, R.; Zhao, L.G.; Silberschmidt, V.V.; Liu, Y.; Vogt, F. Patient-specific modelling of stent overlap: Lumen gain, tissue damage and in-stent restenosis. J. Mech. Behav. Biomed. Mater. 2020, 109, 103836. [Google Scholar] [CrossRef]
- He, R.; Zhao, L.; Silberschmidt, V.V.; Liu, Y.; Vogt, F. Computational Evaluation of Artery Damage in Stent Deployment. Procedia Struct. Integr. 2018, 13, 187–191. [Google Scholar] [CrossRef]
- Morlacchi, S.; Colleoni, S.G.; Cárdenes, R.; Chiastra, C.; Diez, J.L.; Larrabide, I.; Migliavacca, F. Patient-specific simulations of stenting procedures in coronary bifurcations: Two clinical cases. Med. Eng. Phys. 2013, 35, 1272–1281. [Google Scholar] [CrossRef]
- Samant, S.; Wu, W.; Zhao, S.; Khan, B.; Sharzehee, M.; Panagopoulos, A.; Makadia, J.; Mickley, T.; Bicek, A.; Boismier, D.; et al. Computational and experimental mechanical performance of a new everolimus-eluting stent purpose-built for left main interventions. Sci. Rep. 2021, 11, 8728. [Google Scholar] [CrossRef] [PubMed]
- Migliavacca, F. Is modeling stents still an important issue? Procedia Struct. Integr. 2019, 15, 46–50. [Google Scholar] [CrossRef]
- Antonini, L.; Mandelli, L.; Berti, F.; Pennati, G.; Petrini, L. Validation of the computational model of a coronary stent: A fundamental step towards in silico trials. J. Mech. Behav. Biomed. Mater. 2021, 122, 104644. [Google Scholar] [CrossRef]
- Tao, F.; Cheng, J.; Qi, Q.; Zhang, M.; Zhang, H.; Sui, F. Digital twin-driven product design, manufacturing and service with big data. Int. J. Adv. Manuf. Technol. 2018, 94, 3563–3576. [Google Scholar] [CrossRef]
- Corral-Acero, J.; Margara, F.; Marciniak, M.; Rodero, C.; Loncaric, F.; Feng, Y.; Gilbert, A.; Fernandes, J.F.; Bukhari, H.A.; Wajdan, A.; et al. The “Digital Twin” to enable the vision of precision cardiology. Eur. Heart J. 2020, 41, 4556–4564. [Google Scholar] [CrossRef]
- Min, J.K.; Taylor, C.A.; Achenbach, S.; Koo, B.K.; Leipsic, J.; Nørgaard, B.L.; Pijls, N.J.; De Bruyne, B. Noninvasive fractional flow reserve derived from coronary CT angiography. JACC Cardiovasc. Imaging 2015, 8, 1209–1222. [Google Scholar] [CrossRef] [Green Version]
- Cilla, M.; Peña, E.; Martínez, M.A. 3D computational parametric analysis of eccentric atheroma plaque: Influence of axial and circumferential residual stresses. Biomech. Model. Mechanobiol. 2012, 11, 1001–1013. [Google Scholar] [CrossRef]
- Bukala, J.; Kwiatkowski, P.; Malachowski, J. Numerical analysis of stent expansion process in coronary artery stenosis with the use of non-compliant balloon. Biocybern. Biomed. Eng. 2016, 36, 145–156. [Google Scholar] [CrossRef]
- Ragkousis, G.E.; Curzen, N.; Bressloff, N.W. Computational Modelling of Multi-folded Balloon Delivery Systems for Coronary Artery Stenting: Insights into Patient-Specific Stent Malapposition. Ann. Biomed. Eng. 2015, 43, 1786–1802. [Google Scholar] [CrossRef] [PubMed] [Green Version]
- Frangi, A.F.; Niessen, W.J.; Vincken, K.L.; Viergever, M.A. Multiscale vessel enhancement filtering. In Proceedings of the Medical Image Computing and Computer-Assisted Intervention—MICCAI’98, Cambridge, MA, USA, 11–13 October 1998; Wells, W.M., Colchester, A., Delp, S., Eds.; Springer: Berlin/Heidelberg, Germany, 1998; pp. 130–137. [Google Scholar]
- Tsompou, P.I.; Andrikos, I.O.; Karanasiou, G.S.; Sakellarios, A.I.; Tsigkas, N.; Kigka, V.I.; Kyriakidis, S.; Michalis, L.K.; Fotiadis, D.I.; Author, S.B. Validation study of a novel method for the 3D reconstruction of coronary bifurcations. Proc. Annu. Int. Conf. IEEE Eng. Med. Biol. Soc. EMBS 2020, 2020, 1576–1579. [Google Scholar] [CrossRef]
- Holzapfel, G.A.; Sommer, G.; Gasser, C.T.; Regitnig, P. Determination of layer-specific mechanical properties of human coronary arteries with nonatherosclerotic intimal thickening and related constitutive modeling. Am. J. Physiol.-Hear. Circ. Physiol. 2005, 289, 2048–2058. [Google Scholar] [CrossRef] [Green Version]
- Akyildiz, A.C.; Speelman, L.; Gijsen, F.J.H. Mechanical properties of human atherosclerotic intima tissue. J. Biomech. 2014, 47, 773–783. [Google Scholar] [CrossRef] [PubMed]
- Gastaldi, D.; Morlacchi, S.; Nichetti, R.; Capelli, C.; Dubini, G.; Petrini, L.; Migliavacca, F. Modelling of the provisional side-branch stenting approach for the treatment of atherosclerotic coronary bifurcations: Effects of stent positioning. Biomech. Model. Mechanobiol. 2010, 9, 551–561. [Google Scholar] [CrossRef] [PubMed]
- Pant, S.; Bressloff, N.W.; Limbert, G. Geometry parameterization and multidisciplinary constrained optimization of coronary stents. Biomech. Model. Mechanobiol. 2012, 11, 61–82. [Google Scholar] [CrossRef]
- Chandra, S.; Gnanaruban, V.; Riveros, F.; Rodriguez, J.F.; Finol, E.A. A methodology for the derivation of unloaded abdominal aortic aneurysm geometry with experimental validation. J. Biomech. Eng. 2016, 138, 101005. [Google Scholar] [CrossRef] [Green Version]
- Favero, G.; Paganelli, C.; Buffoli, B.; Rodella, L.F.; Rezzani, R. Endothelium and its alterations in cardiovascular diseases: Life style intervention. BioMed Res. Int. 2014, 2014, 801896. [Google Scholar] [CrossRef] [Green Version]
- Gasser, T.C.; Ogden, R.W.; Holzapfel, G.A. Hyperelastic modelling of arterial layers with distributed collagen fibre orientations. J. R. Soc. Interface 2006, 3, 15–35. [Google Scholar] [CrossRef]
- Chai, C.K.; Akyildiz, A.C.; Speelman, L.; Gijsen, F.J.H.; Oomens, C.W.J.; van Sambeek, M.R.H.M.; van der Lugt, A.; Baaijens, F.P.T. Local axial compressive mechanical properties of human carotid atherosclerotic plaques-characterisation by indentation test and inverse finite element analysis. J. Biomech. 2013, 46, 1759–1766. [Google Scholar] [CrossRef] [PubMed] [Green Version]
- Loree, H.M.; Grodzinsky, A.J.; Park, S.Y.; Gibson, L.J.; Lee, R.T. Static circumferential tangential modulus of human atherosclerotic tissue. J. Biomech. 1994, 27, 195–204. [Google Scholar] [CrossRef]
- Maher, E.; Creane, A.; Sultan, S.; Hynes, N.; Lally, C.; Kelly, D.J. Tensile and compressive properties of fresh human carotid atherosclerotic plaques. J. Biomech. 2009, 42, 2760–2767. [Google Scholar] [CrossRef]
- Lawlor, M.G.; O’Donnell, M.R.; O’Connell, B.M.; Walsh, M.T. Experimental determination of circumferential properties of fresh carotid artery plaques. J. Biomech. 2011, 44, 1709–1715. [Google Scholar] [CrossRef]
- Berti, F.; Antonini, L.; Poletti, G.; Fiuza, C.; Vaughan, T.J.; Migliavacca, F.; Petrini, L.; Pennati, G. How to Validate in silico Deployment of Coronary Stents: Strategies and Limitations in the Choice of Comparator. Front. Med. Technol. 2021, 3, 702656. [Google Scholar] [CrossRef]
- Antonini, L.; Berti, F.; Isella, B.; Hossain, D.; Mandelli, L.; Pennati, G.; Petrini, L. From the real device to the digital twin: A coupled experimental-numerical strategy to investigate a novel bioresorbable vascular scaffold. PLoS ONE 2021, 16, e0252788. [Google Scholar] [CrossRef]
- Chiastra, C.; Grundeken, M.J.; Collet, C.; Wu, W.; Wykrzykowska, J.J.; Pennati, G.; Dubini, G.; Migliavacca, F. Biomechanical Impact of Wrong Positioning of a Dedicated Stent for Coronary Bifurcations: A Virtual Bench Testing Study. Cardiovasc. Eng. Technol. 2018, 9, 415–426. [Google Scholar] [CrossRef] [PubMed]
- Antonini, L.; Poletti, G.; Mandelli, L.; Dubini, G.; Pennati, G.; Petrini, L. Comprehensive computational analysis of the crimping procedure of PLLA BVS: Effects of material viscous-plastic and temperature dependent behavior. J. Mech. Behav. Biomed. Mater. 2021, 123, 104713. [Google Scholar] [CrossRef]
- Ahmed, S.S.; Messali, Z.; Ouahabi, A.; Trepout, S.; Messaoudi, C.; Marco, S. Nonparametric denoising methods based on contourlet transform with sharp frequency localization: Application to low exposure time electron microscopy images. Entropy 2015, 17, 3461–3478. [Google Scholar] [CrossRef] [Green Version]
- Ouahabi, A. A review of wavelet denoising in medical imaging. In Proceedings of the 8th International Workshop on Systems, Signal Processing and Their Application (IEEE/WoSSPA), Algeris, Algeria, 12–15 May 2013; pp. 19–26. [Google Scholar]


| C10 | C20 | C30 | C40 | C50 | C60 | |
|---|---|---|---|---|---|---|
| Adventitia | ||||||
| Media |
| Artery Tissue | Plastic Strain (−) | Plastic Stress (MPa) |
|---|---|---|
| Adventitia | 0 | 1.60 |
| 0.07 | 2.30 | |
| 0.40 | 4.00 | |
| Media | 0 | 0.70 |
| 0.07 | 1.10 | |
| 0.40 | 2.00 |
| Plaque Type | Material Model | Material Parameters | Compressibility |
|---|---|---|---|
| Generic Plaque | Neo-Hookean Hyperelastic-Plastic | Incompressible | |
| Lipid Plaque | Neo-Hookean Hyperelastic-Plastic | Incompressible | |
| Calcified Plaque | Linear Elastic-Plastic | Compressible, | |
| Clinical Case | Lesion Length | % Diameter Stenosis | Procedure Step 1 | Procedure Step 2 | Procedure Step 3 | Procedure Step 4 |
|---|---|---|---|---|---|---|
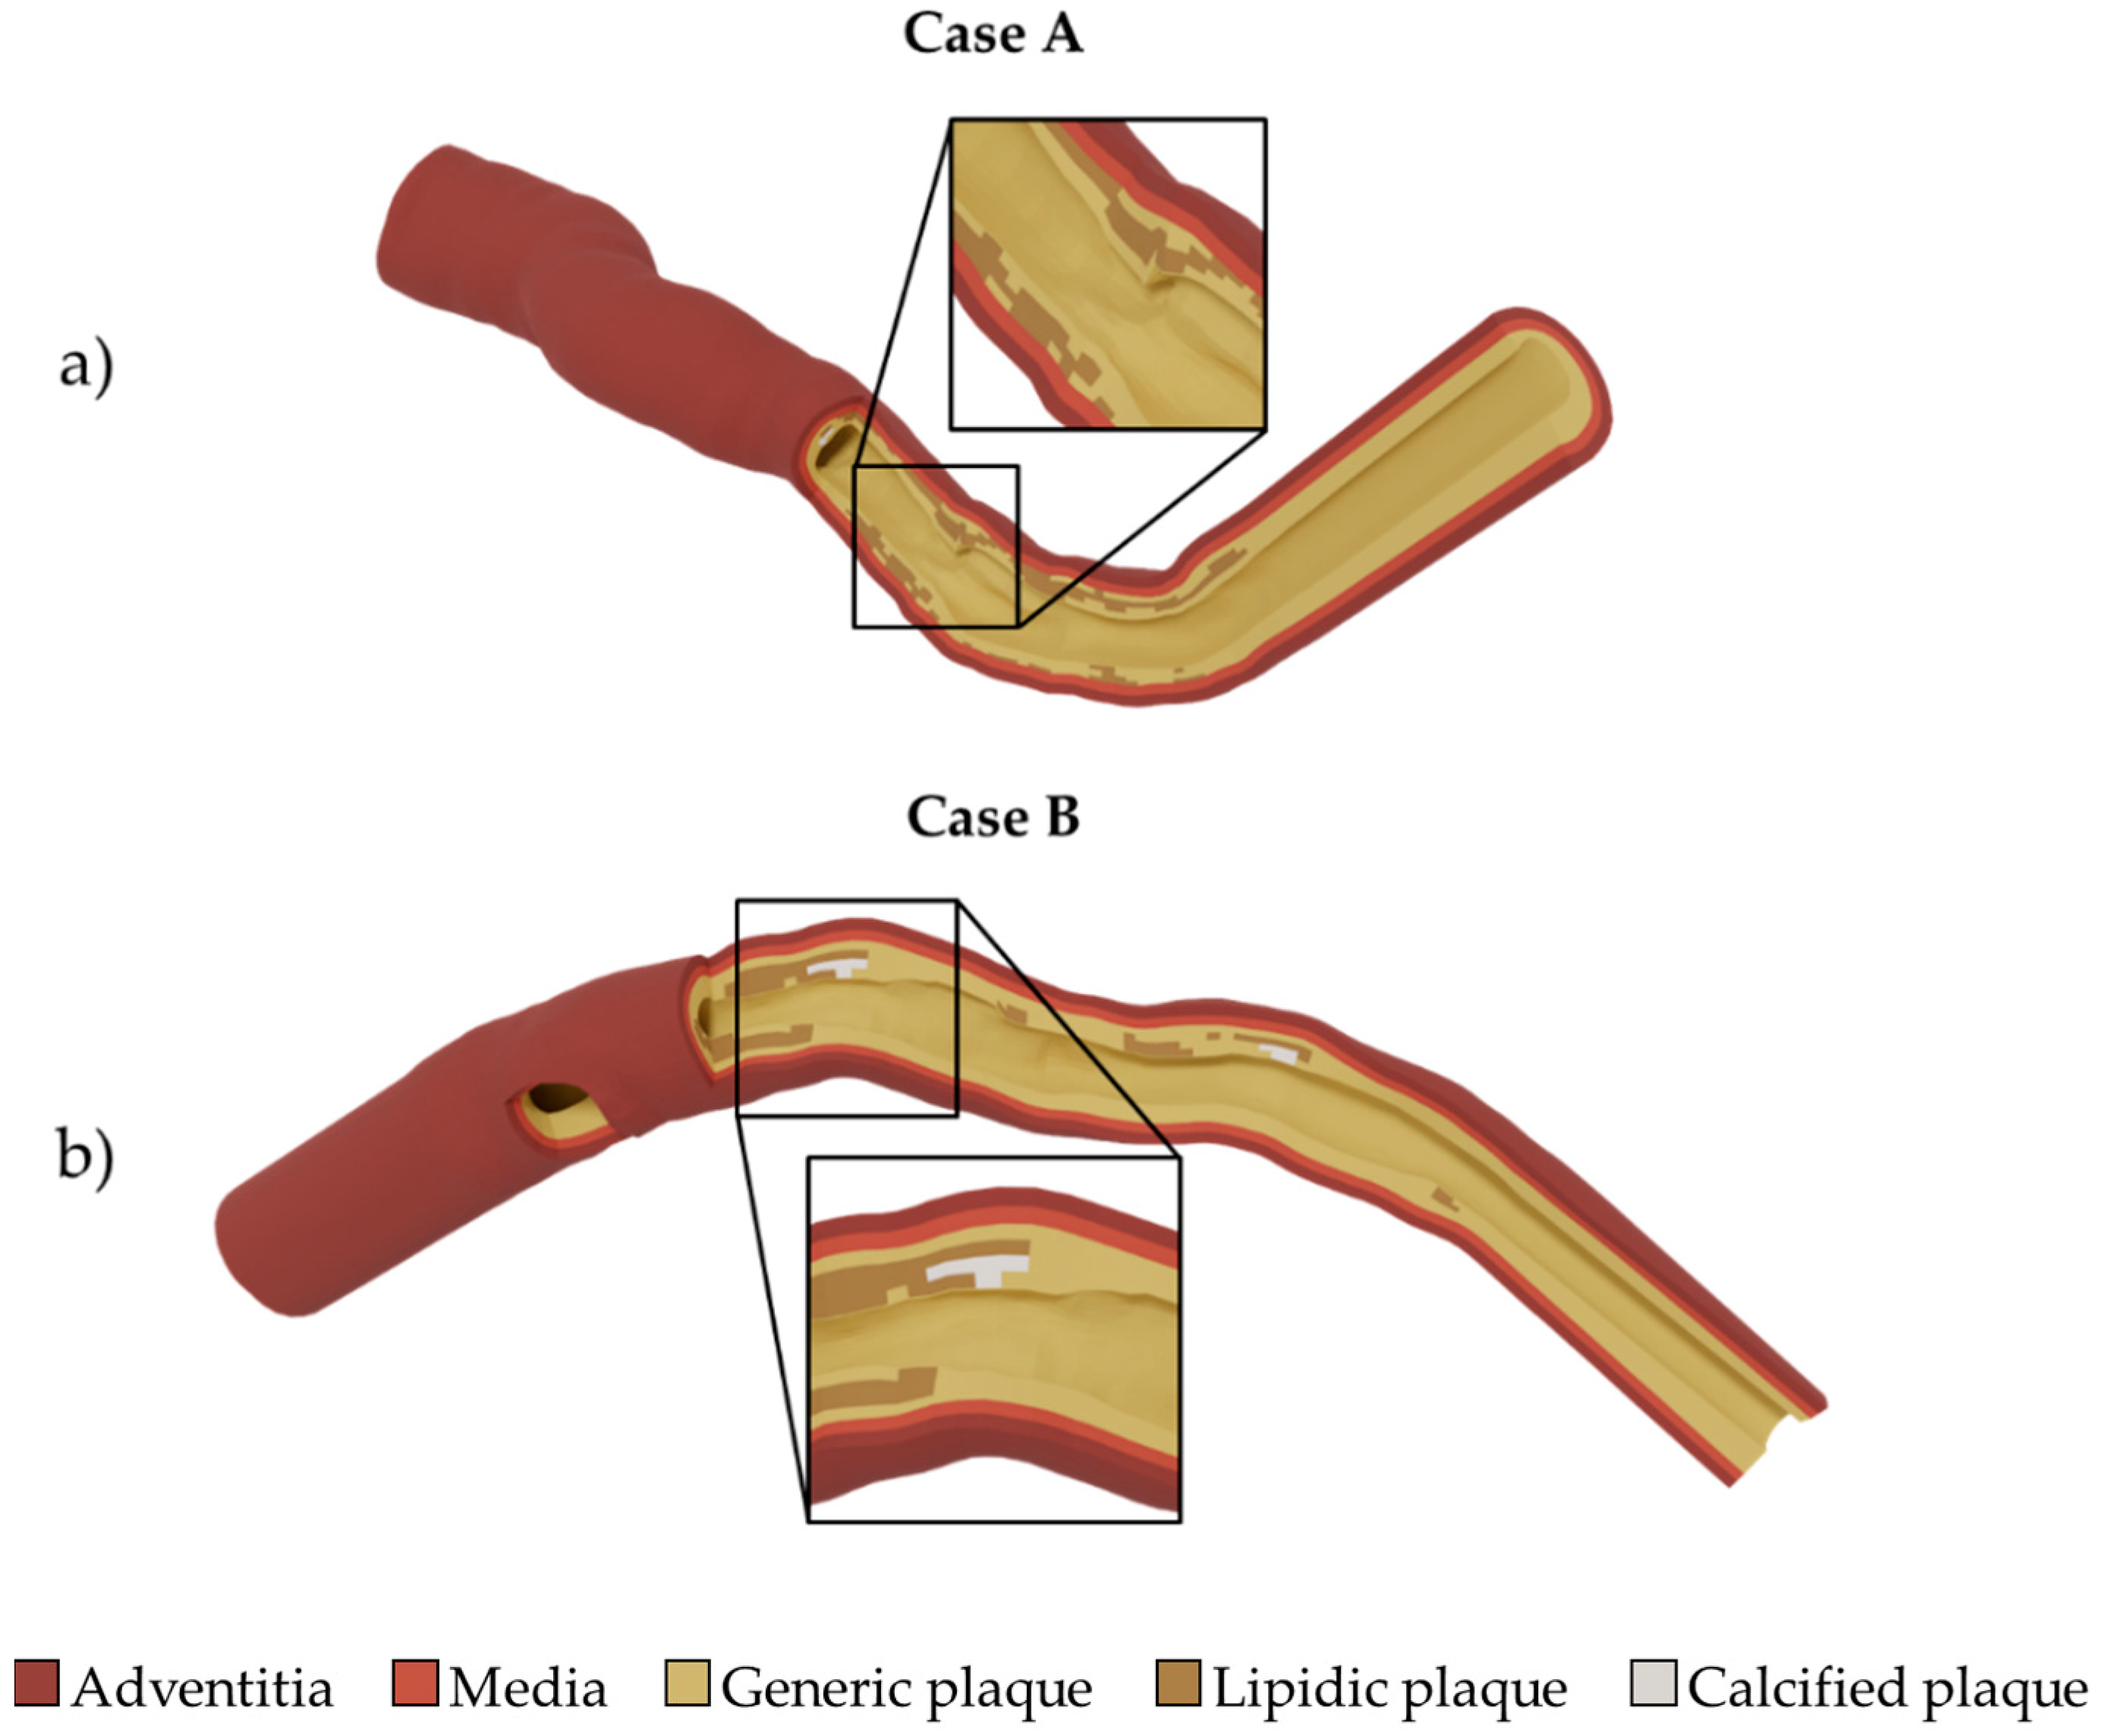
| Case A | 16 mm | 60% | Angioplasty | Stenting | - | - |
| Case B | 46 mm | 69% | Angioplasty | Stenting 1 | Stenting 2 | Post-dilation |
Publisher’s Note: MDPI stays neutral with regard to jurisdictional claims in published maps and institutional affiliations. |
© 2022 by the authors. Licensee MDPI, Basel, Switzerland. This article is an open access article distributed under the terms and conditions of the Creative Commons Attribution (CC BY) license (https://creativecommons.org/licenses/by/4.0/).
Share and Cite
Poletti, G.; Antonini, L.; Mandelli, L.; Tsompou, P.; Karanasiou, G.S.; Papafaklis, M.I.; Michalis, L.K.; Fotiadis, D.I.; Petrini, L.; Pennati, G. Towards a Digital Twin of Coronary Stenting: A Suitable and Validated Image-Based Approach for Mimicking Patient-Specific Coronary Arteries. Electronics 2022, 11, 502. https://doi.org/10.3390/electronics11030502
Poletti G, Antonini L, Mandelli L, Tsompou P, Karanasiou GS, Papafaklis MI, Michalis LK, Fotiadis DI, Petrini L, Pennati G. Towards a Digital Twin of Coronary Stenting: A Suitable and Validated Image-Based Approach for Mimicking Patient-Specific Coronary Arteries. Electronics. 2022; 11(3):502. https://doi.org/10.3390/electronics11030502
Chicago/Turabian StylePoletti, Gianluca, Luca Antonini, Lorenzo Mandelli, Panagiota Tsompou, Georgia S. Karanasiou, Michail I. Papafaklis, Lampros K. Michalis, Dimitrios I. Fotiadis, Lorenza Petrini, and Giancarlo Pennati. 2022. "Towards a Digital Twin of Coronary Stenting: A Suitable and Validated Image-Based Approach for Mimicking Patient-Specific Coronary Arteries" Electronics 11, no. 3: 502. https://doi.org/10.3390/electronics11030502
APA StylePoletti, G., Antonini, L., Mandelli, L., Tsompou, P., Karanasiou, G. S., Papafaklis, M. I., Michalis, L. K., Fotiadis, D. I., Petrini, L., & Pennati, G. (2022). Towards a Digital Twin of Coronary Stenting: A Suitable and Validated Image-Based Approach for Mimicking Patient-Specific Coronary Arteries. Electronics, 11(3), 502. https://doi.org/10.3390/electronics11030502