
Neighboring-Pixel-Based Maximum Power Point Tracking Algorithm for Partially Shaded Photovoltaic (PV) Systems

 , , , and
Abstract
:1. Introduction
2. Proposed MPPT
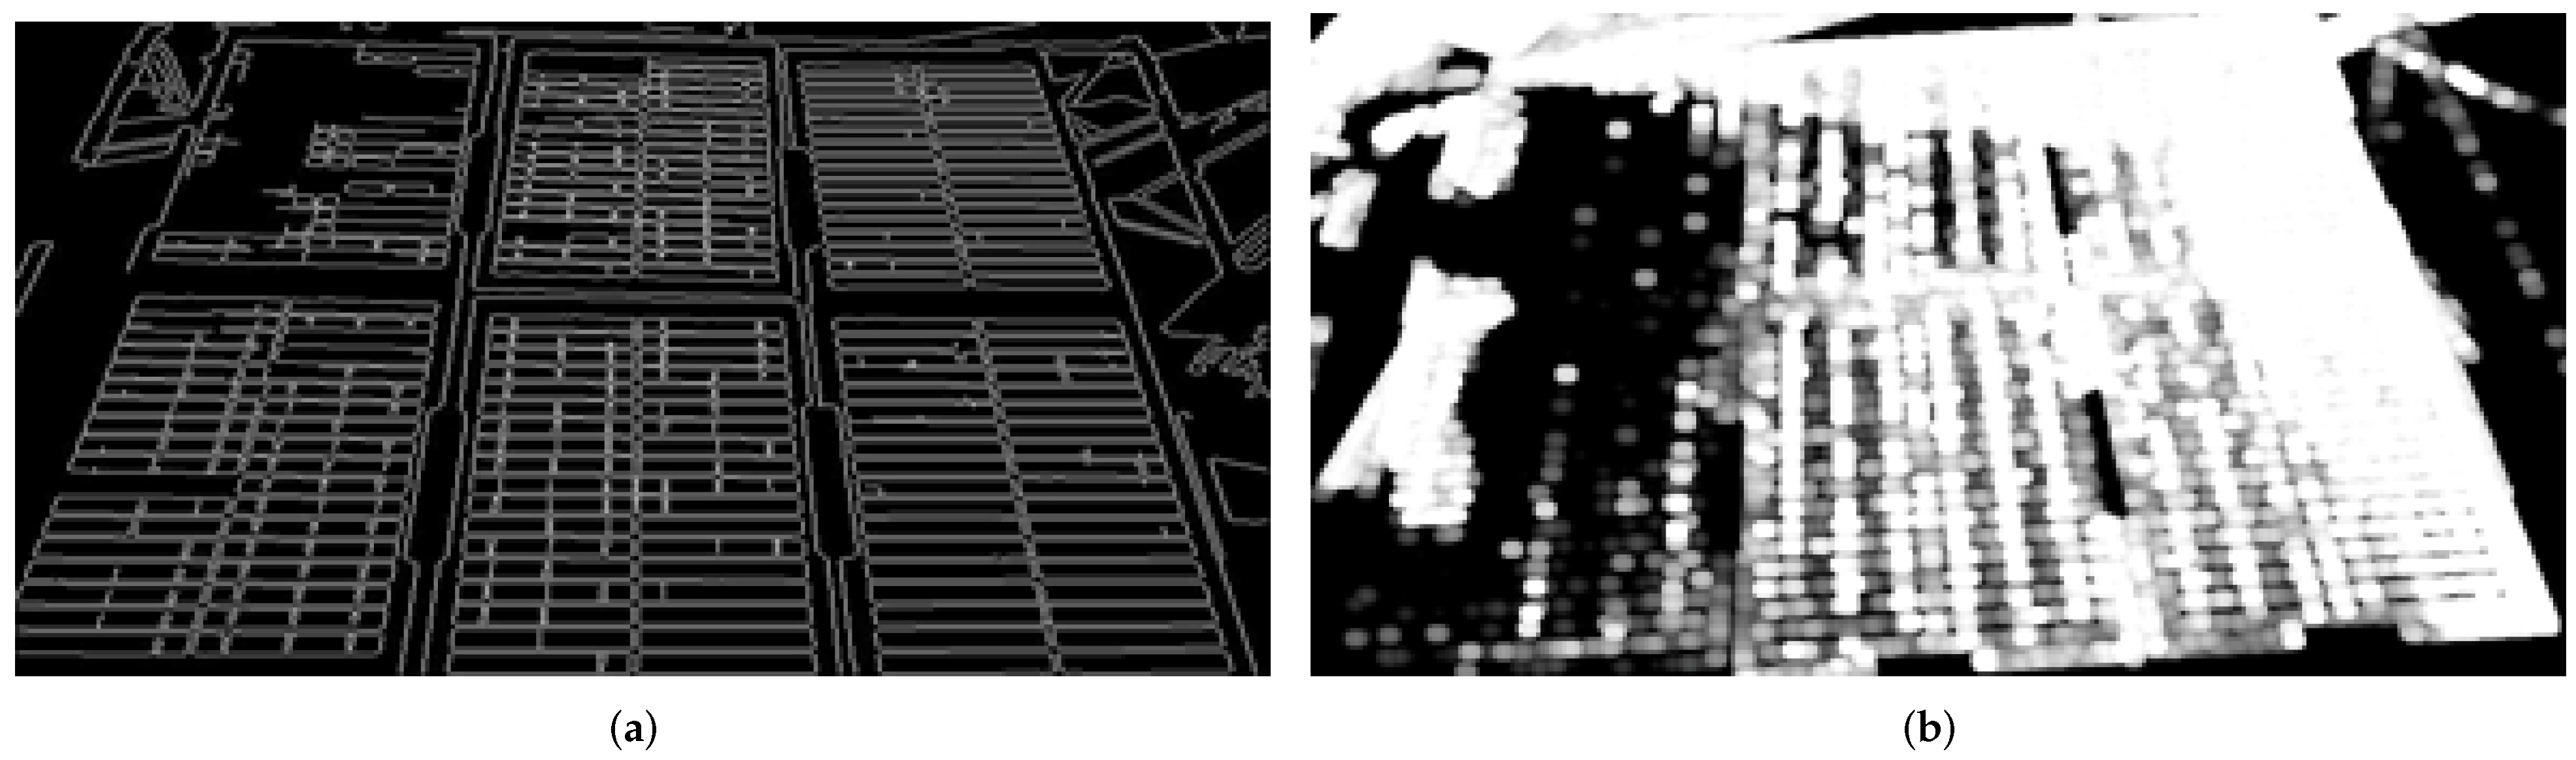
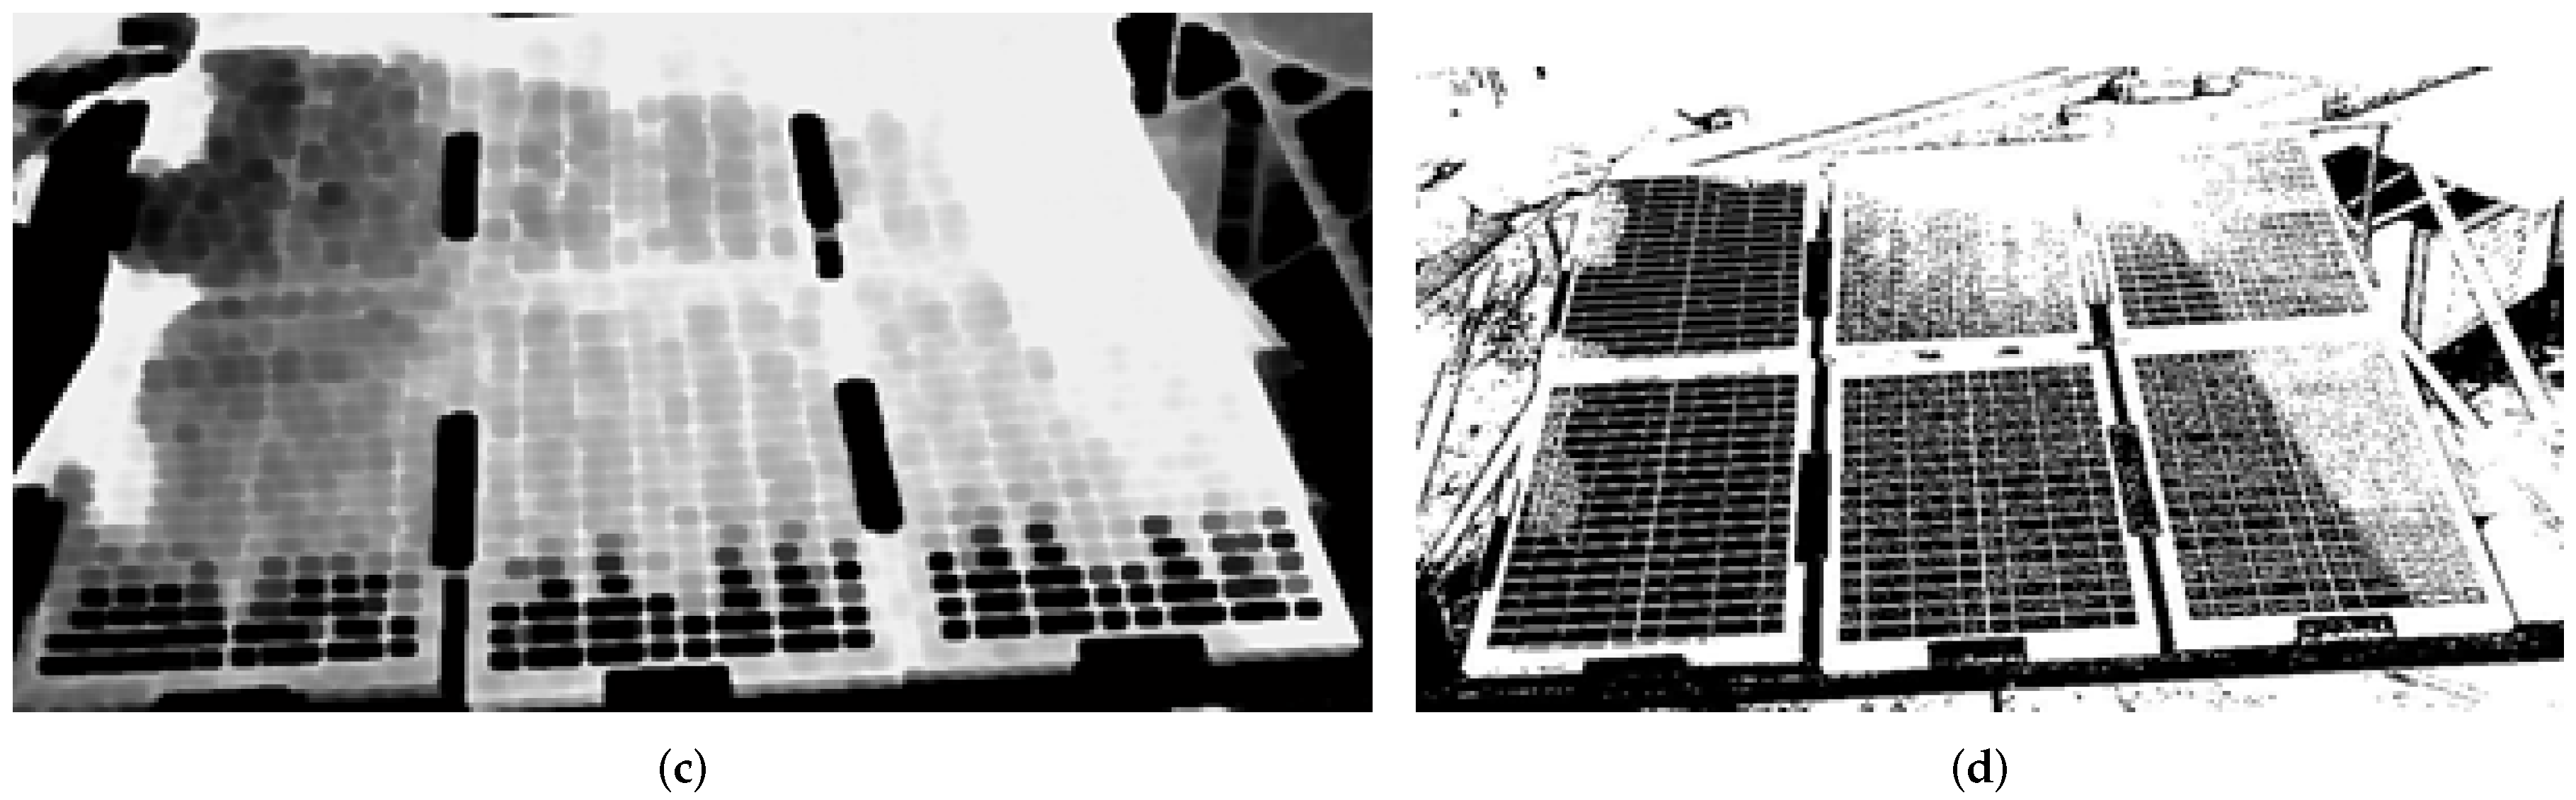
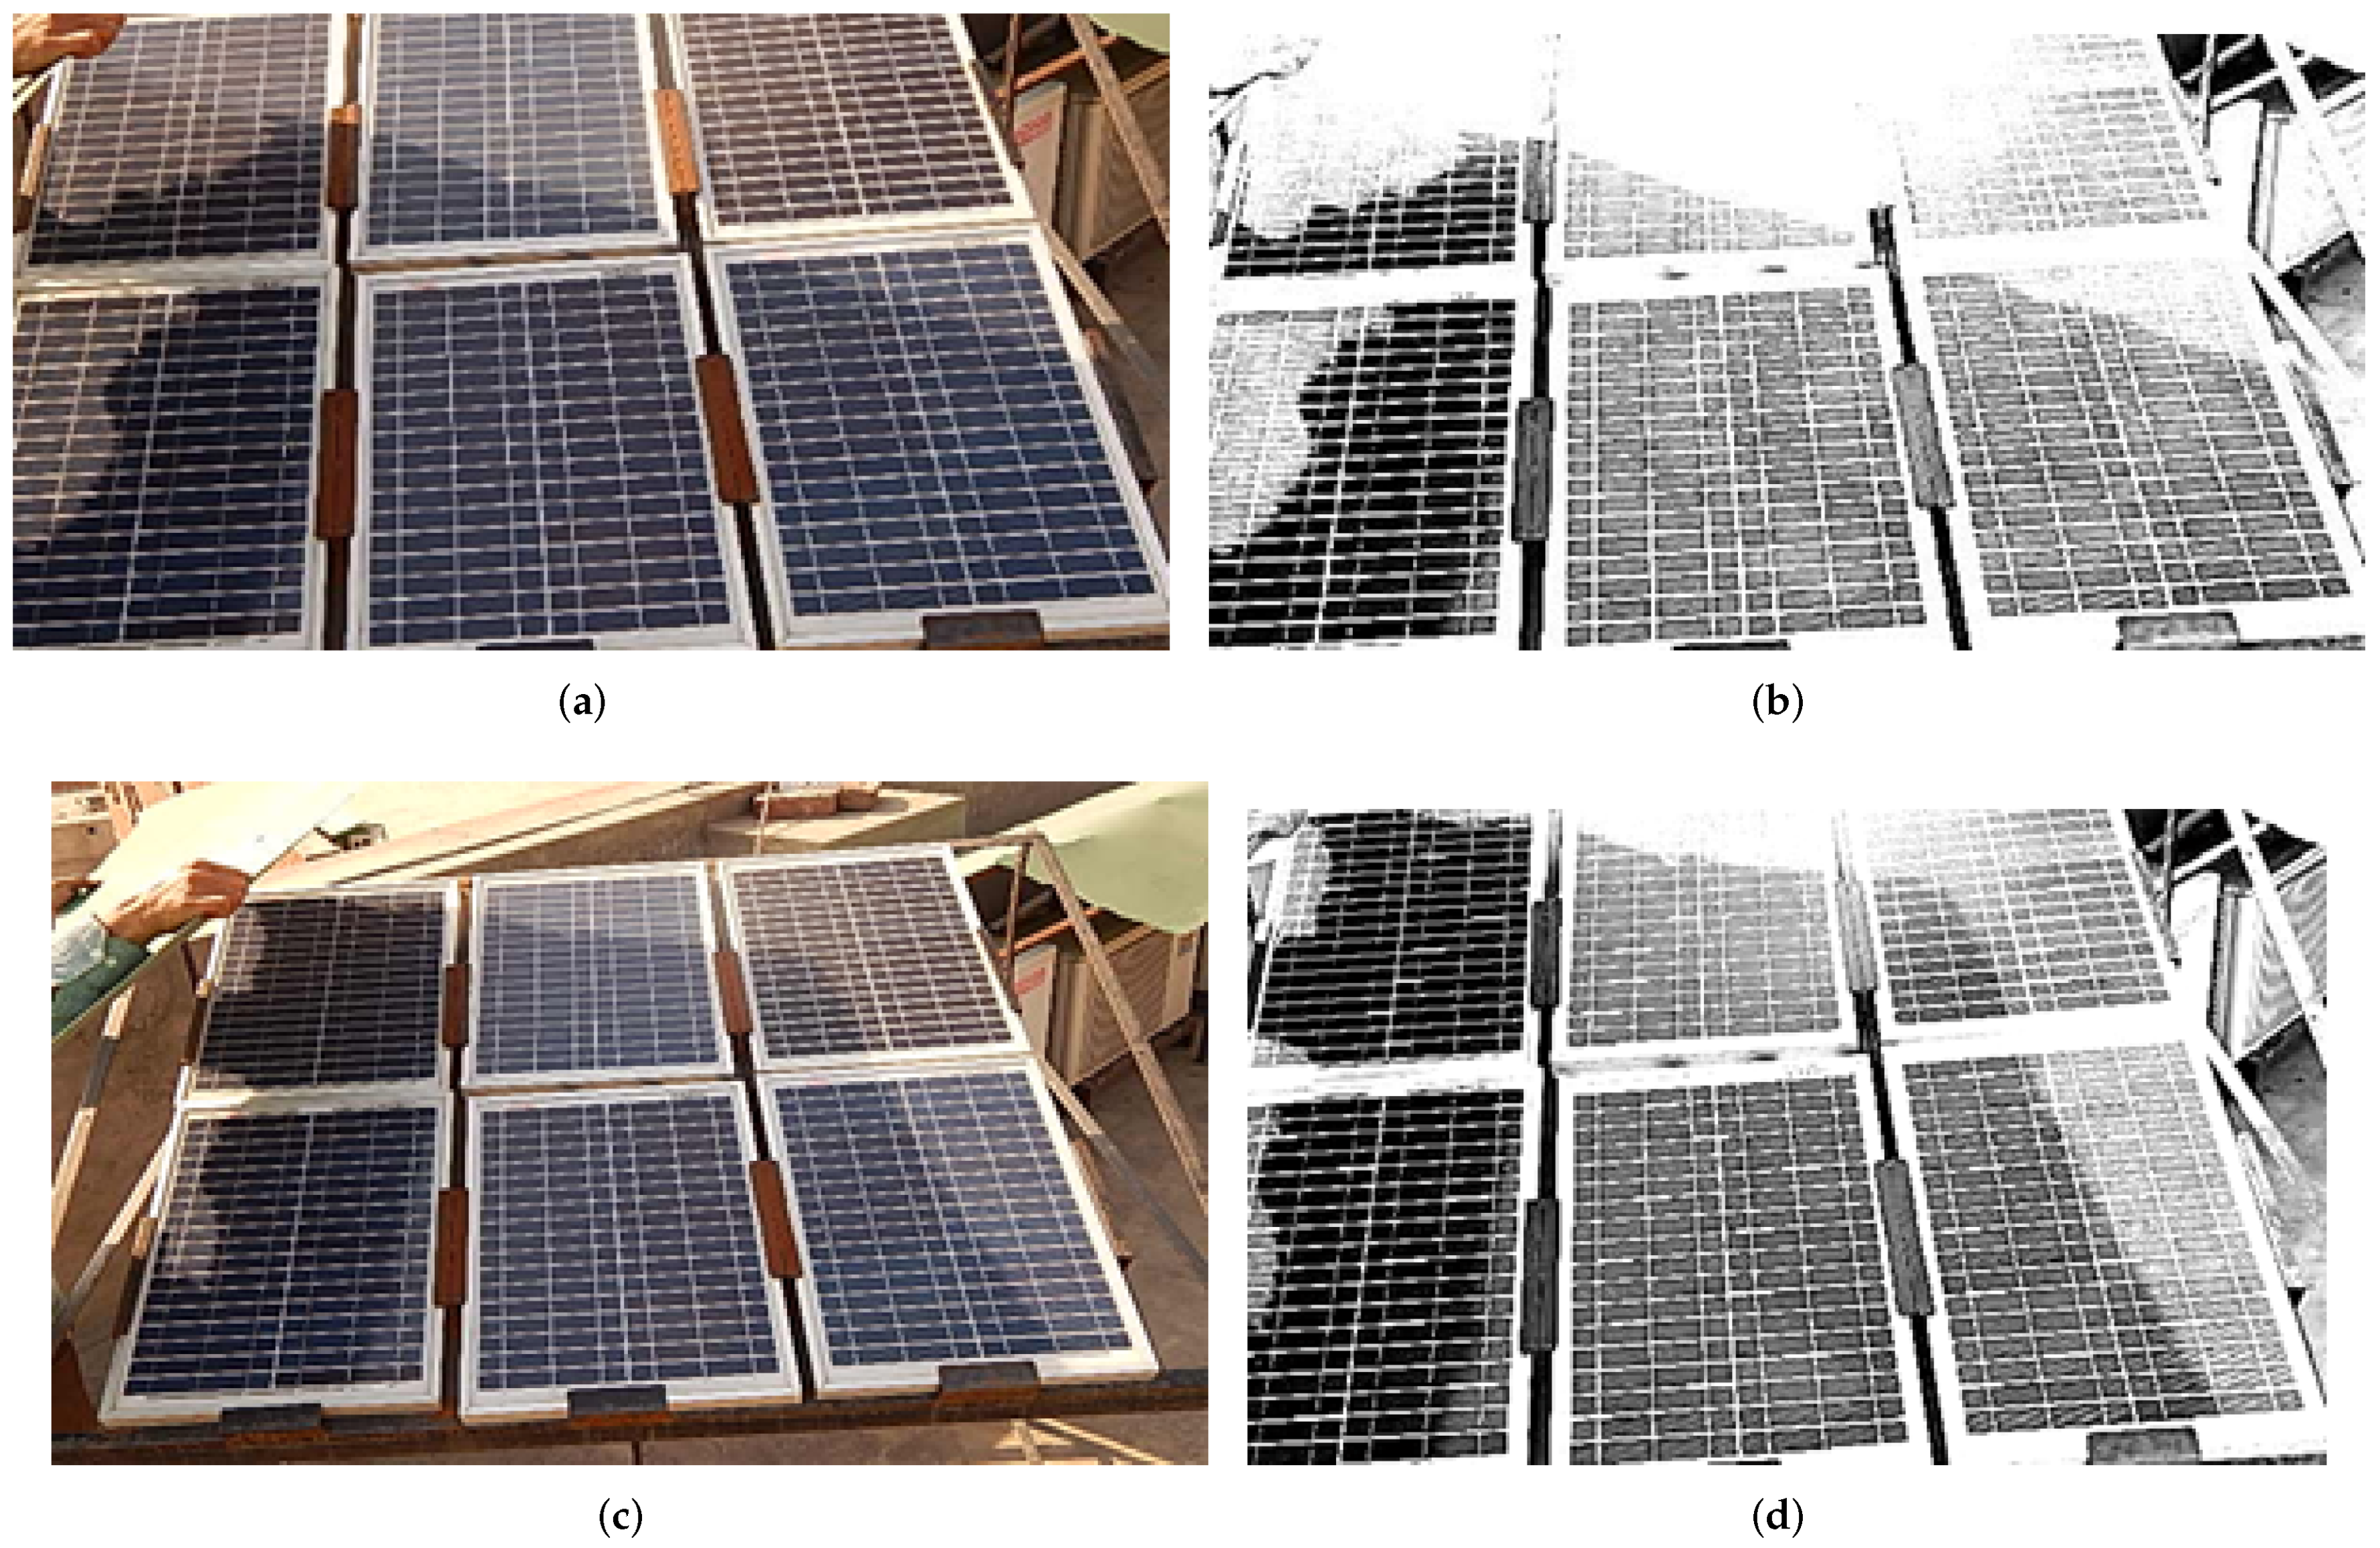
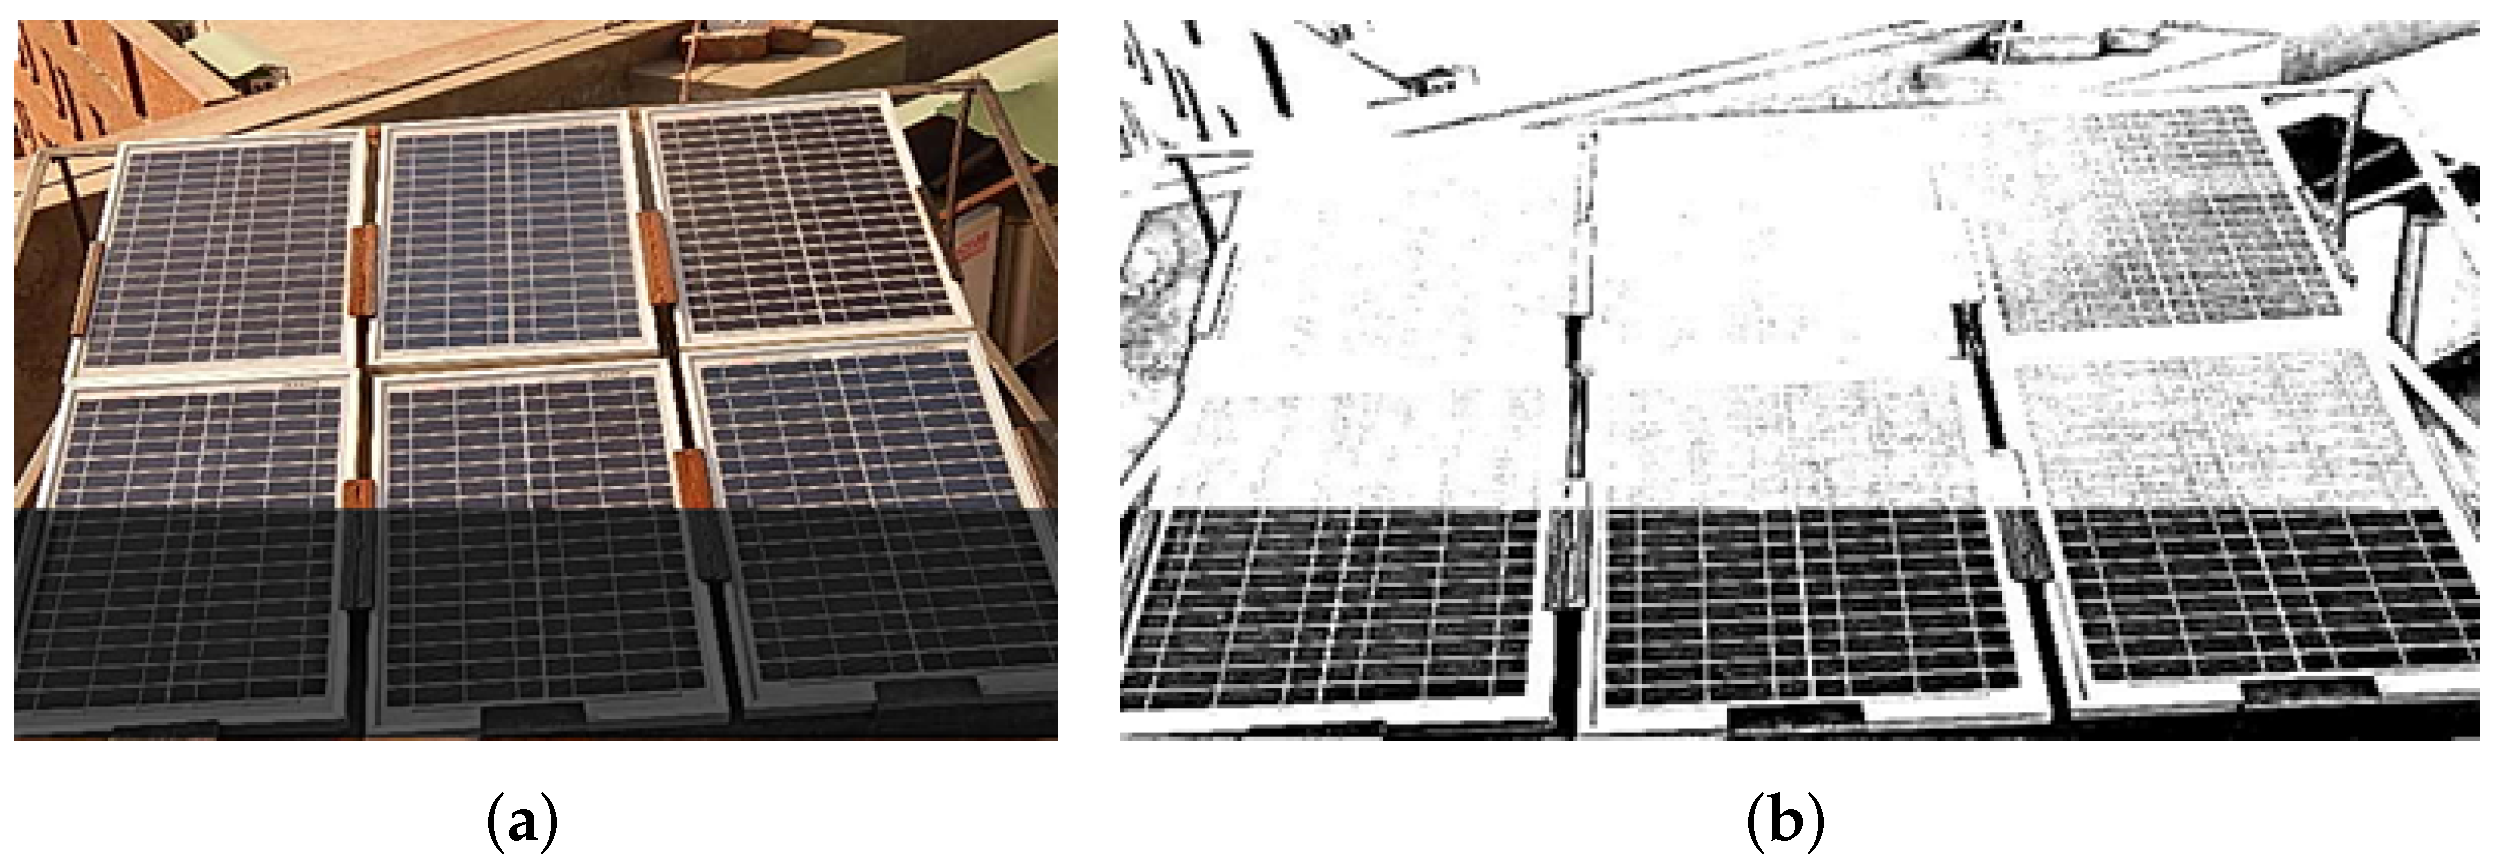
2.1. The Image Formation Model
2.2. Existing Image Processing Techniques
2.3. Proposed Neighboring Pixel Algorithm (NPA)
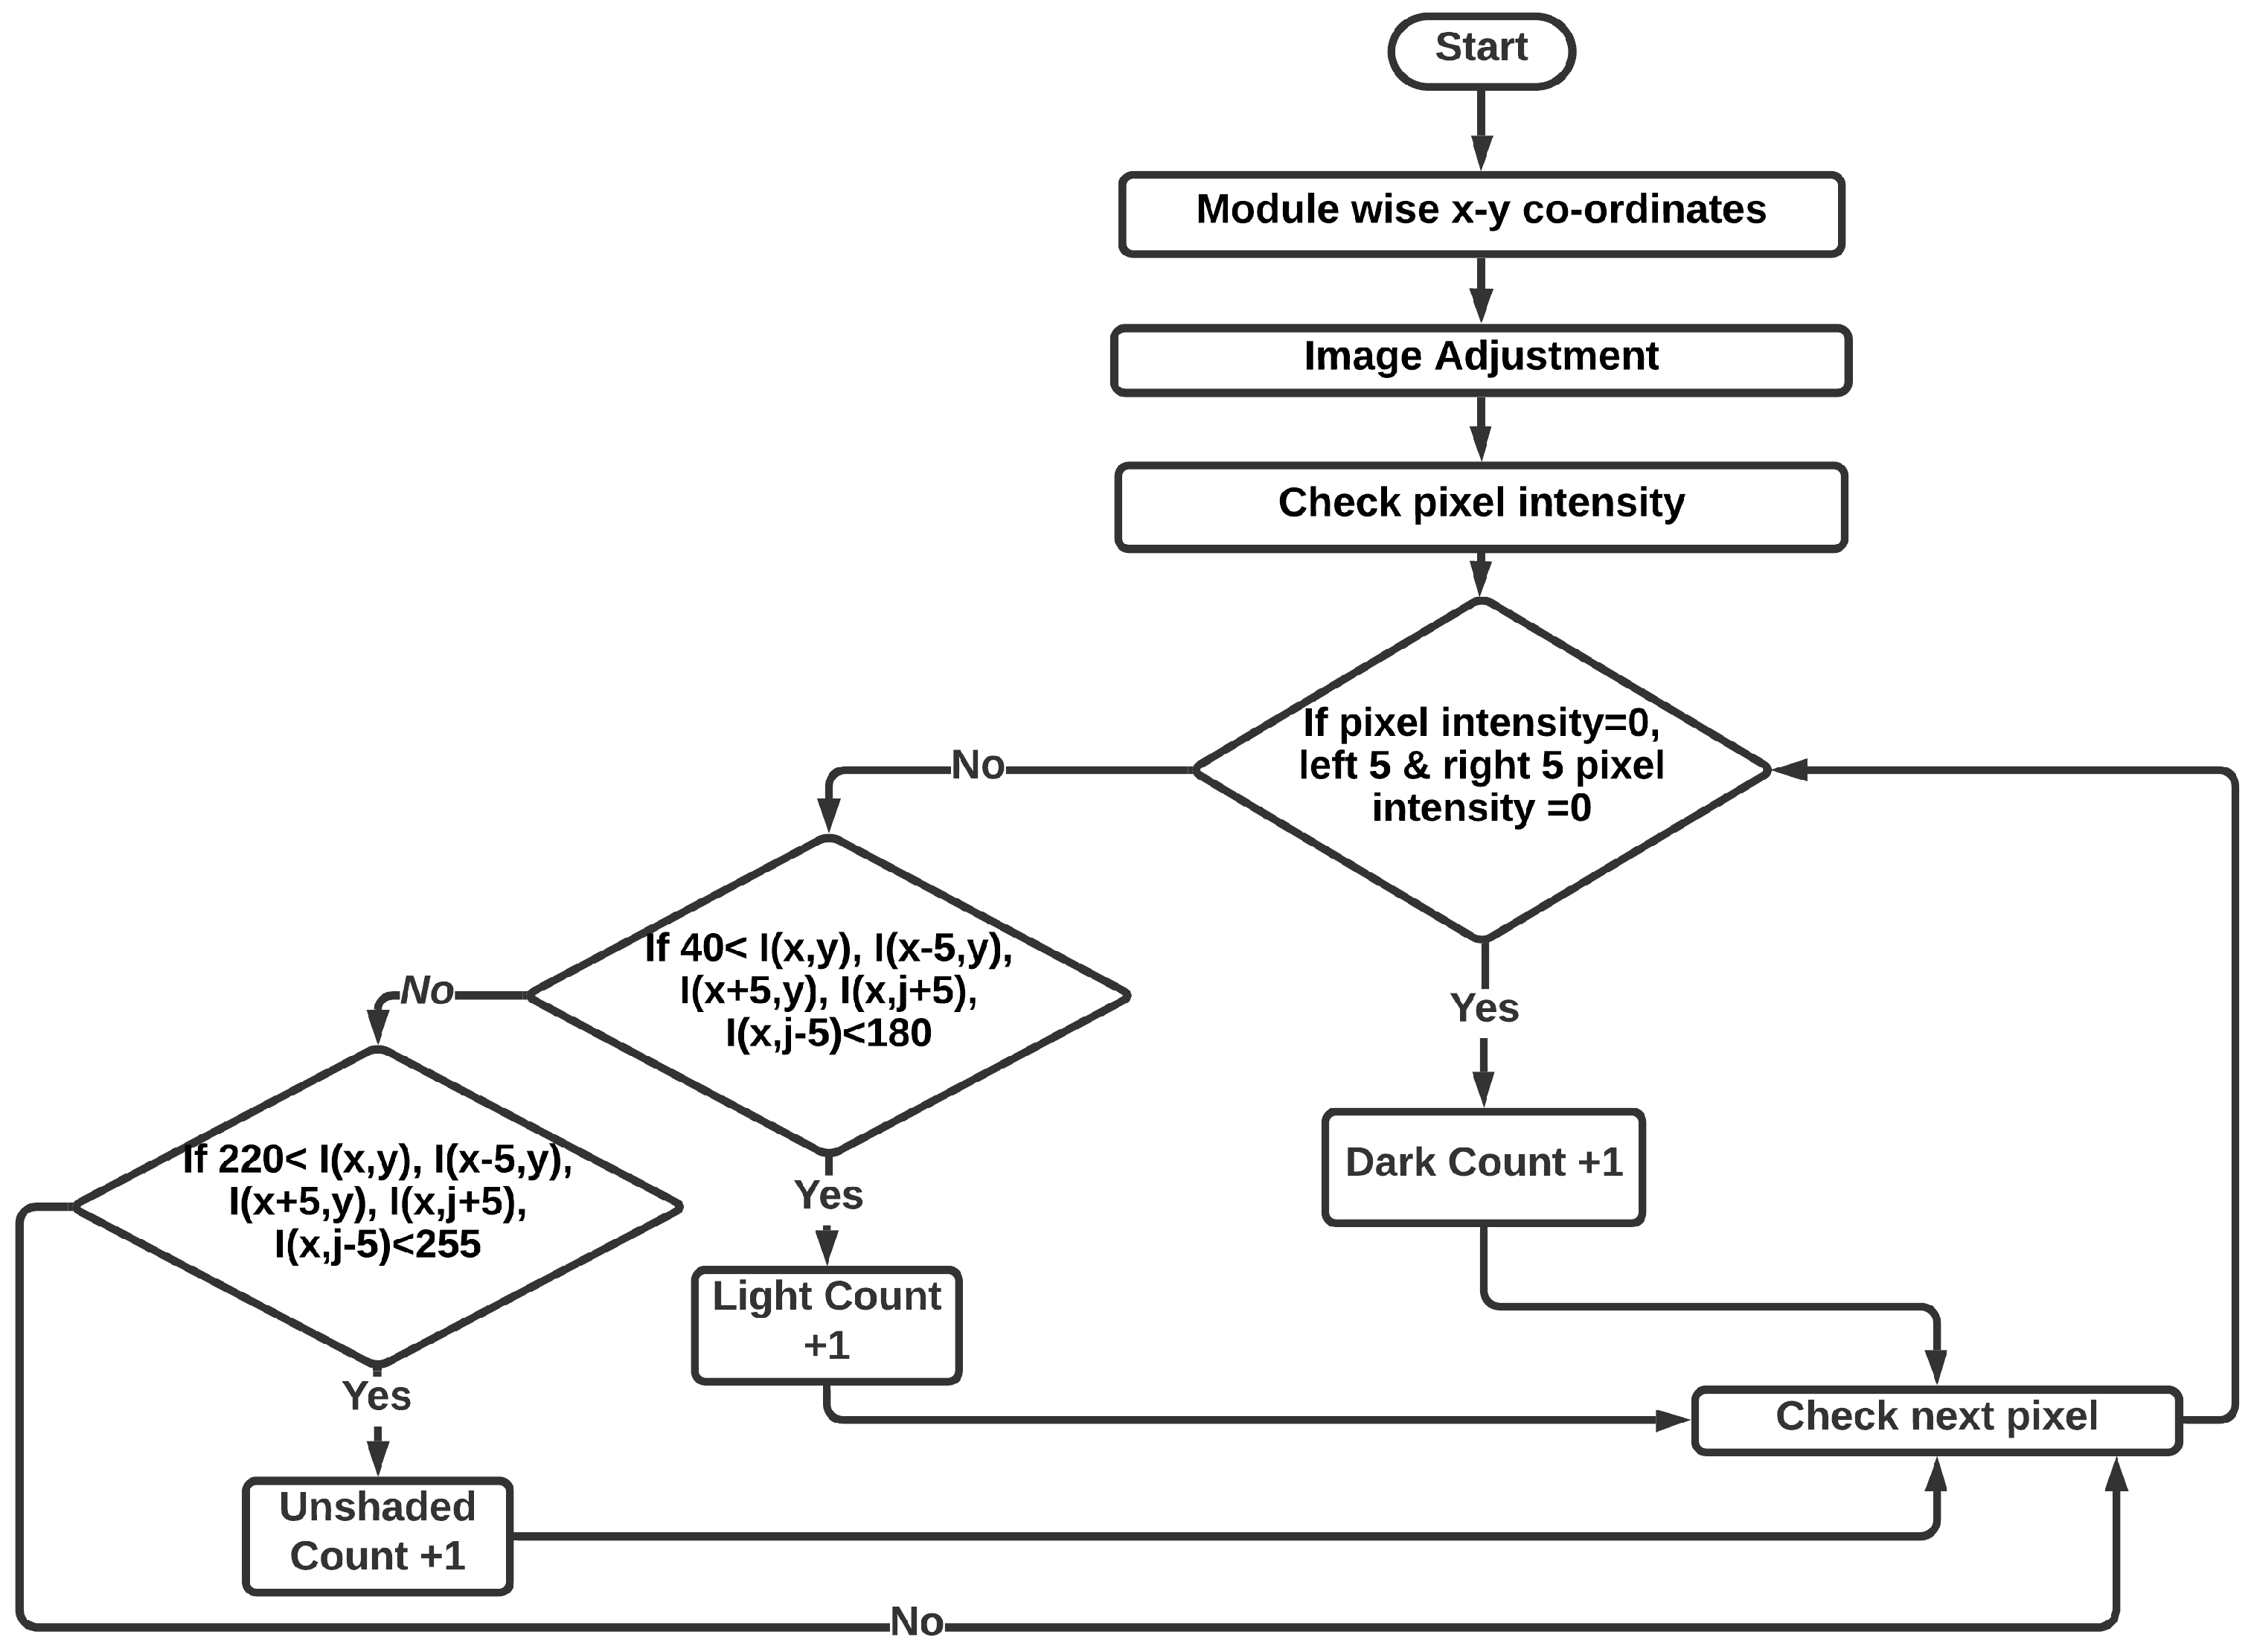
- Unshaded PV module | 1000 .
- Lightly shaded PV module | 500 .
- Dark shaded PV module = 100 .
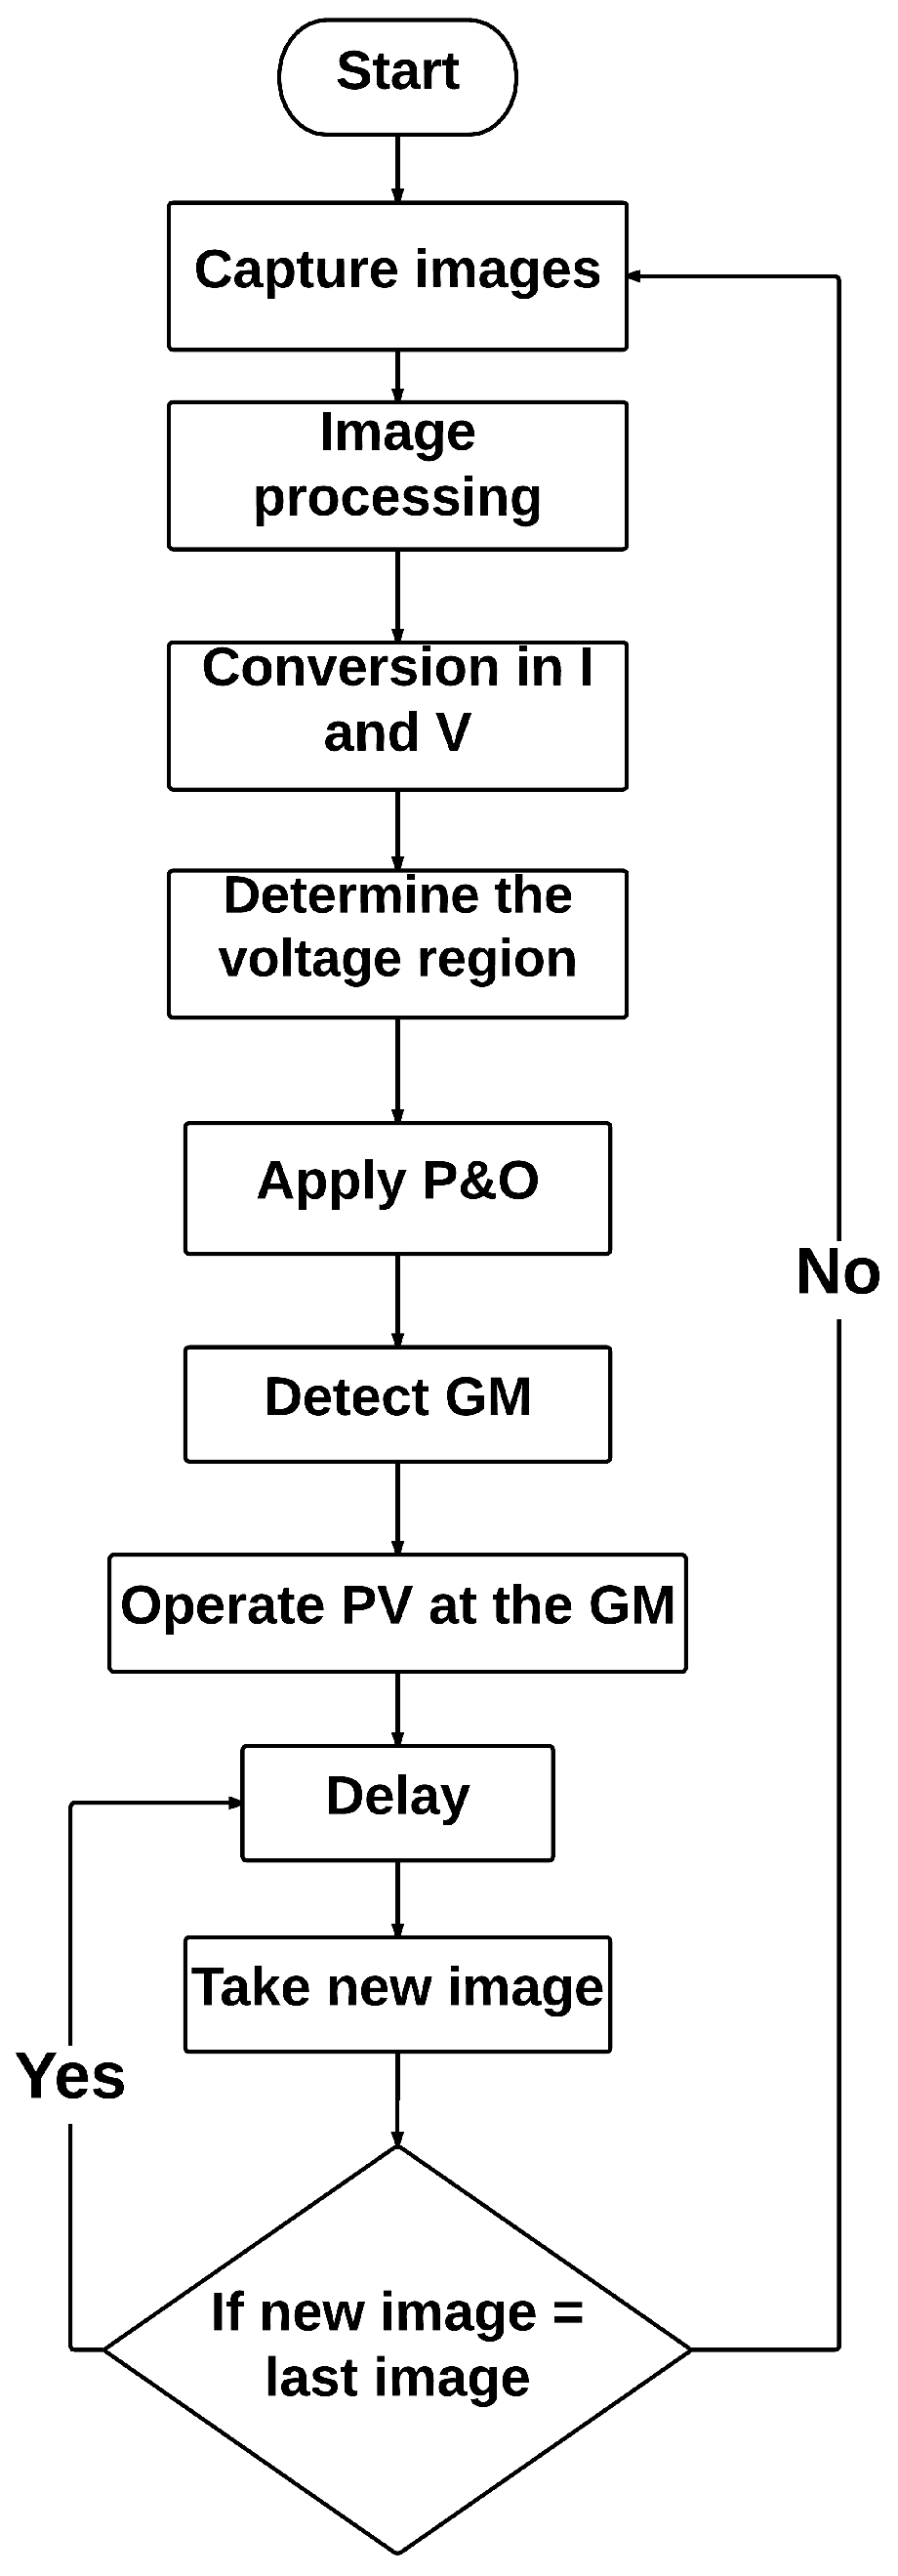
2.4. Image Processing Workflow
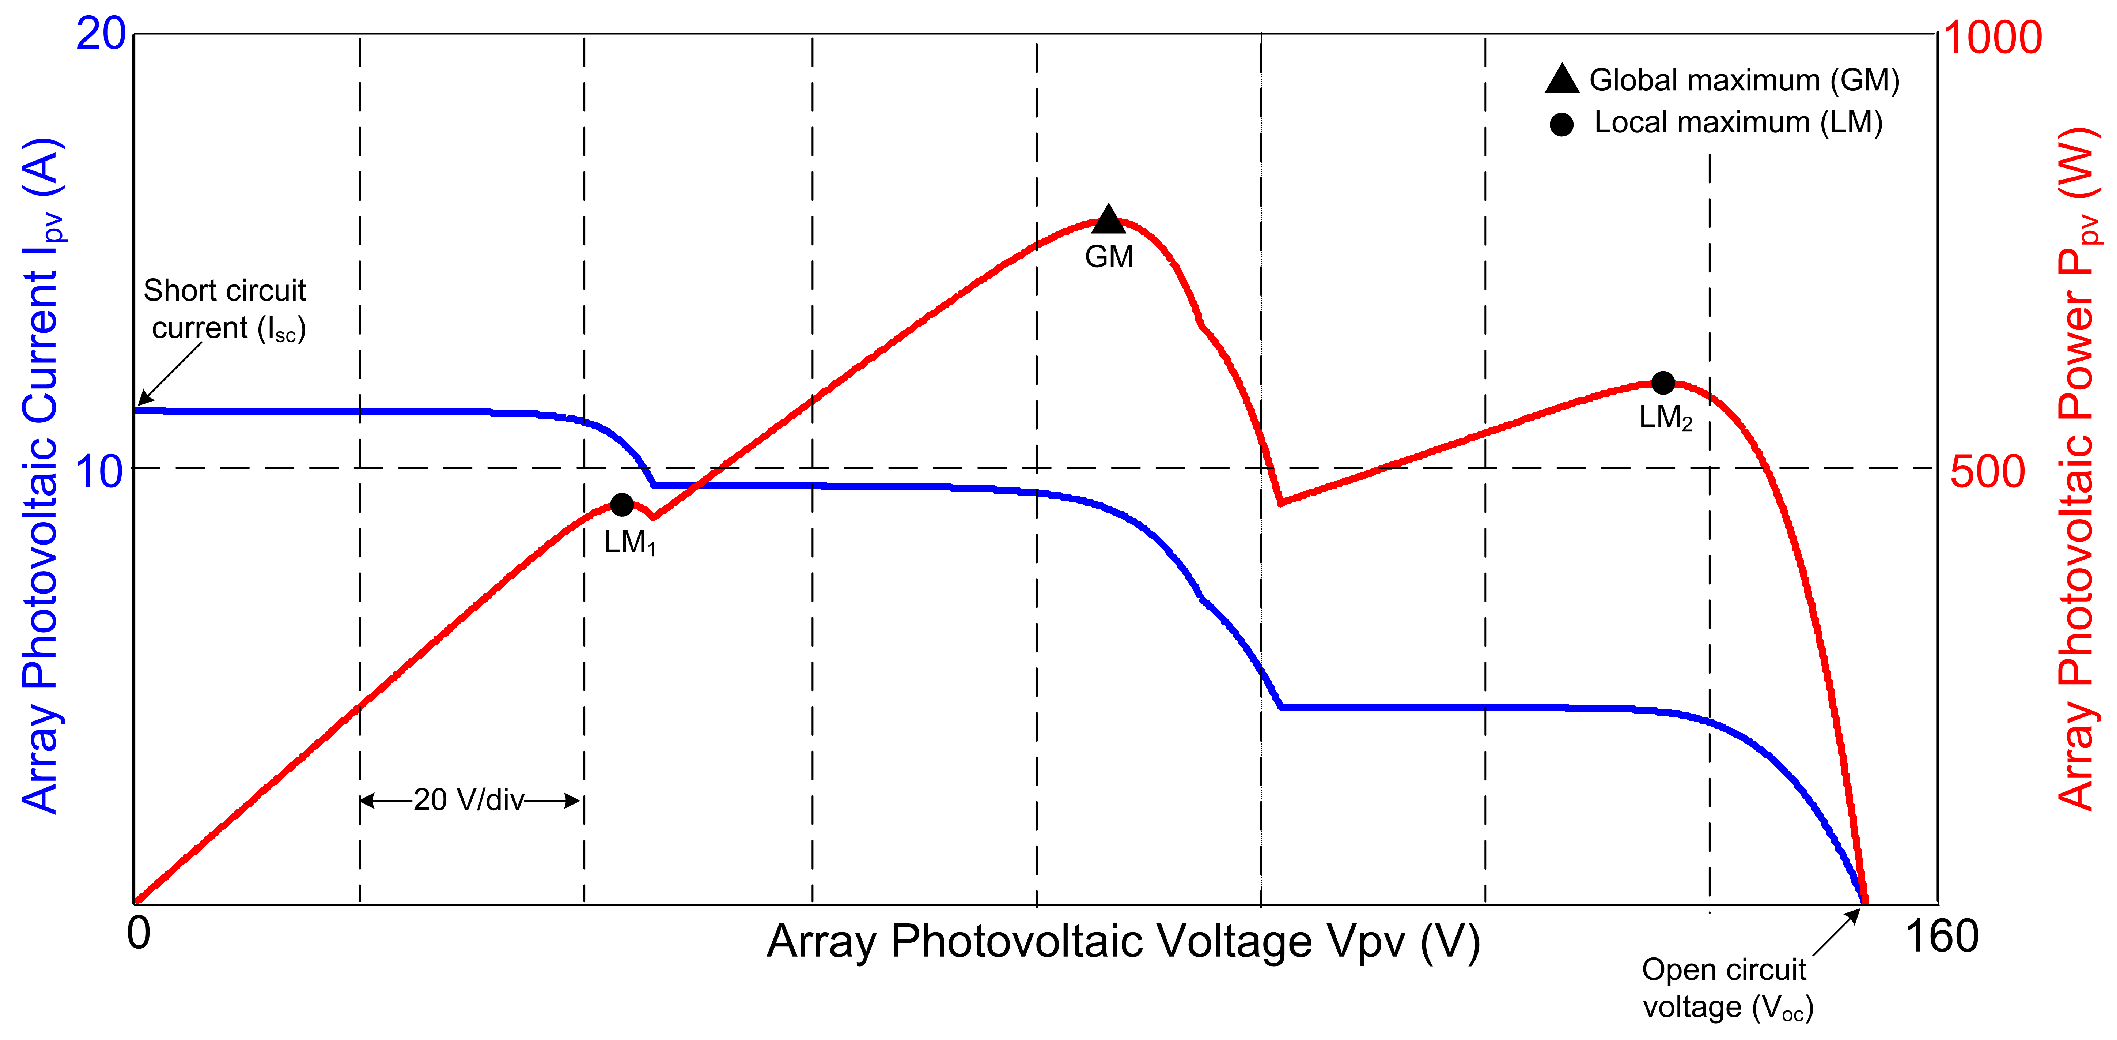
2.5. Prediction of Maximum Voltage Region under Partial Shading Scenario
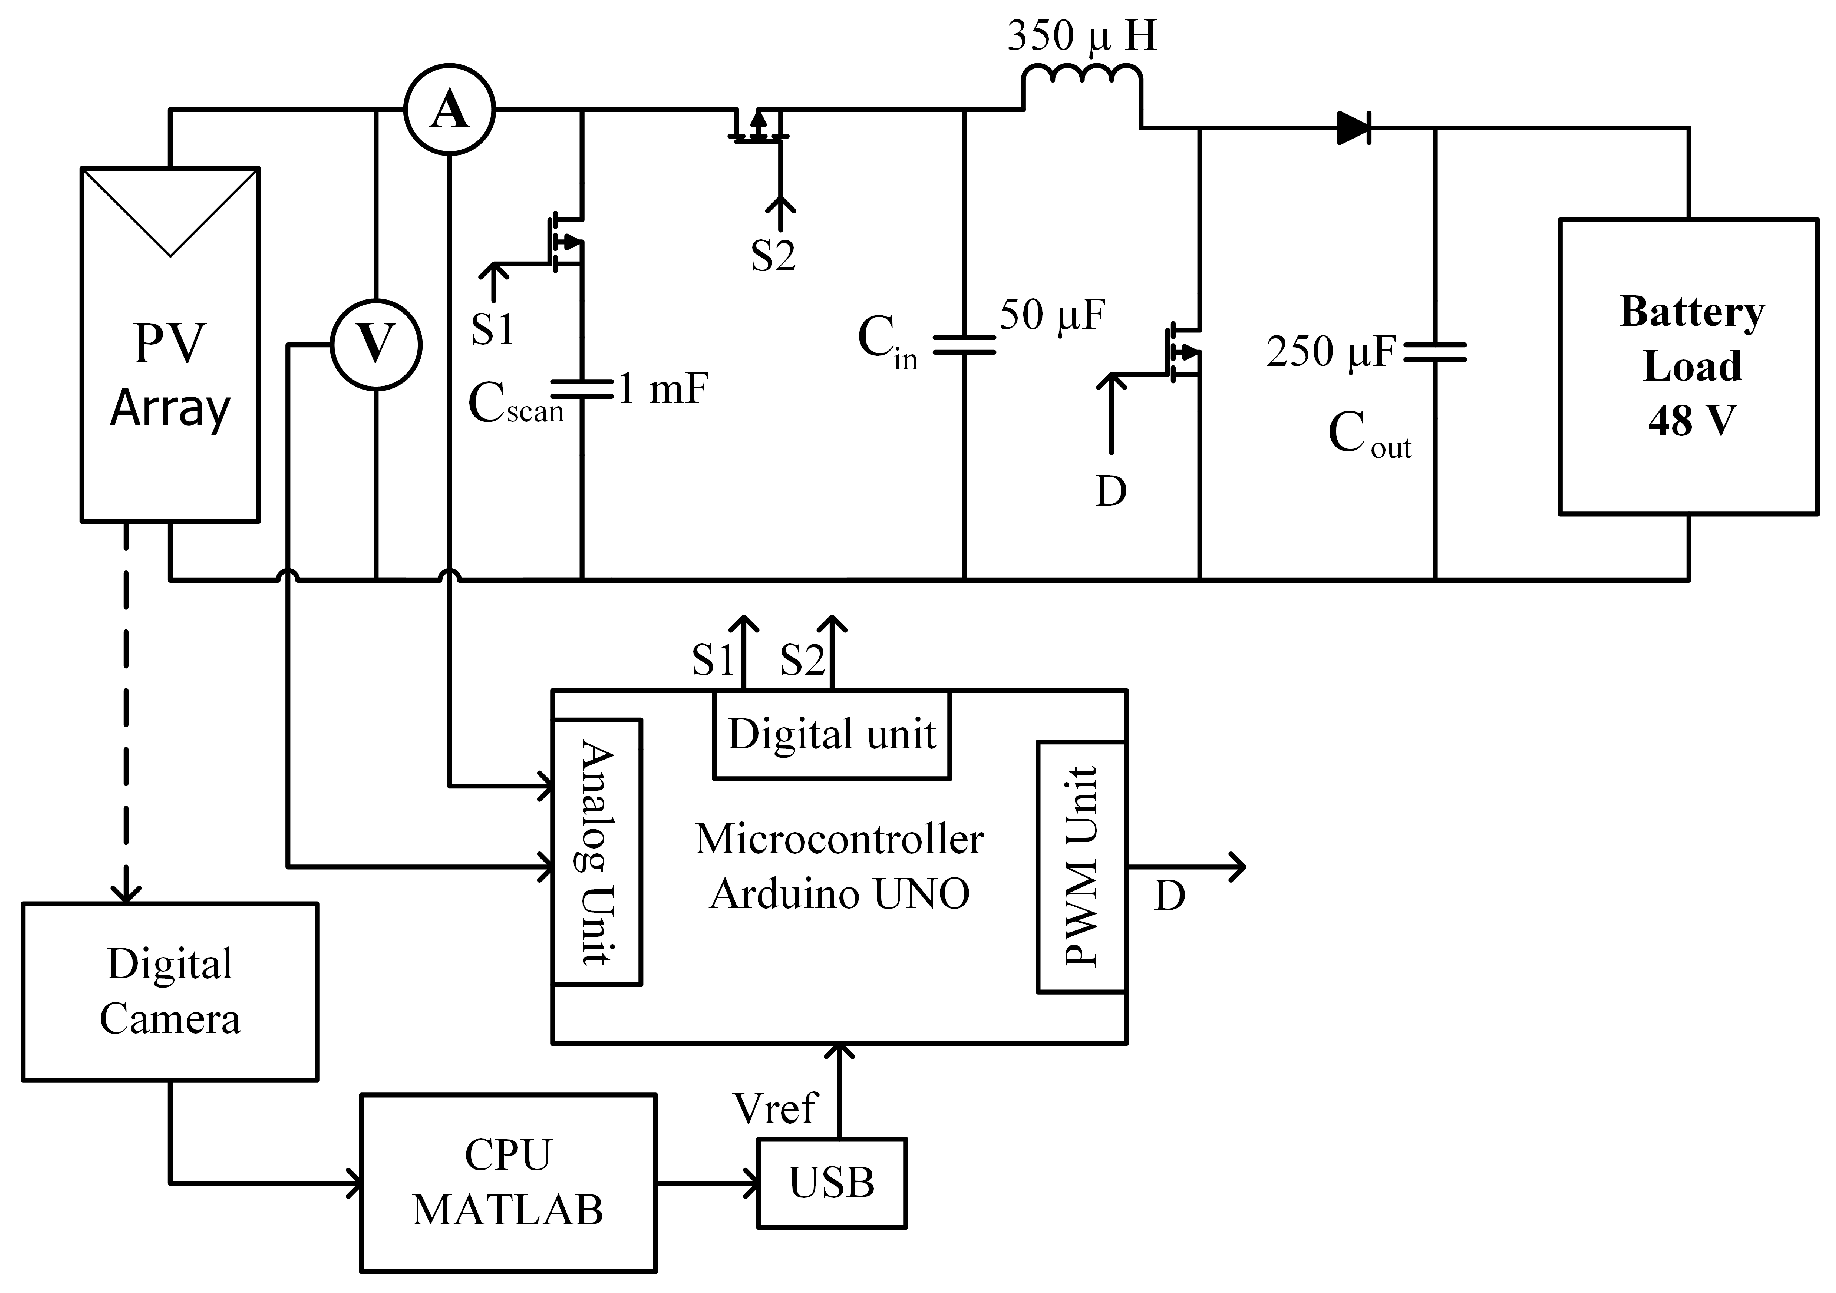
3. Concept Validation
- Input capacitor () = 50 μF.
- Inductor (L) = 350 μH.
- Output capacitor () = 250 μF.
- Load = Battery of 48 V.
- Switching frequency = 40 kHz.
- Scanning capacitor () = 1 mF.
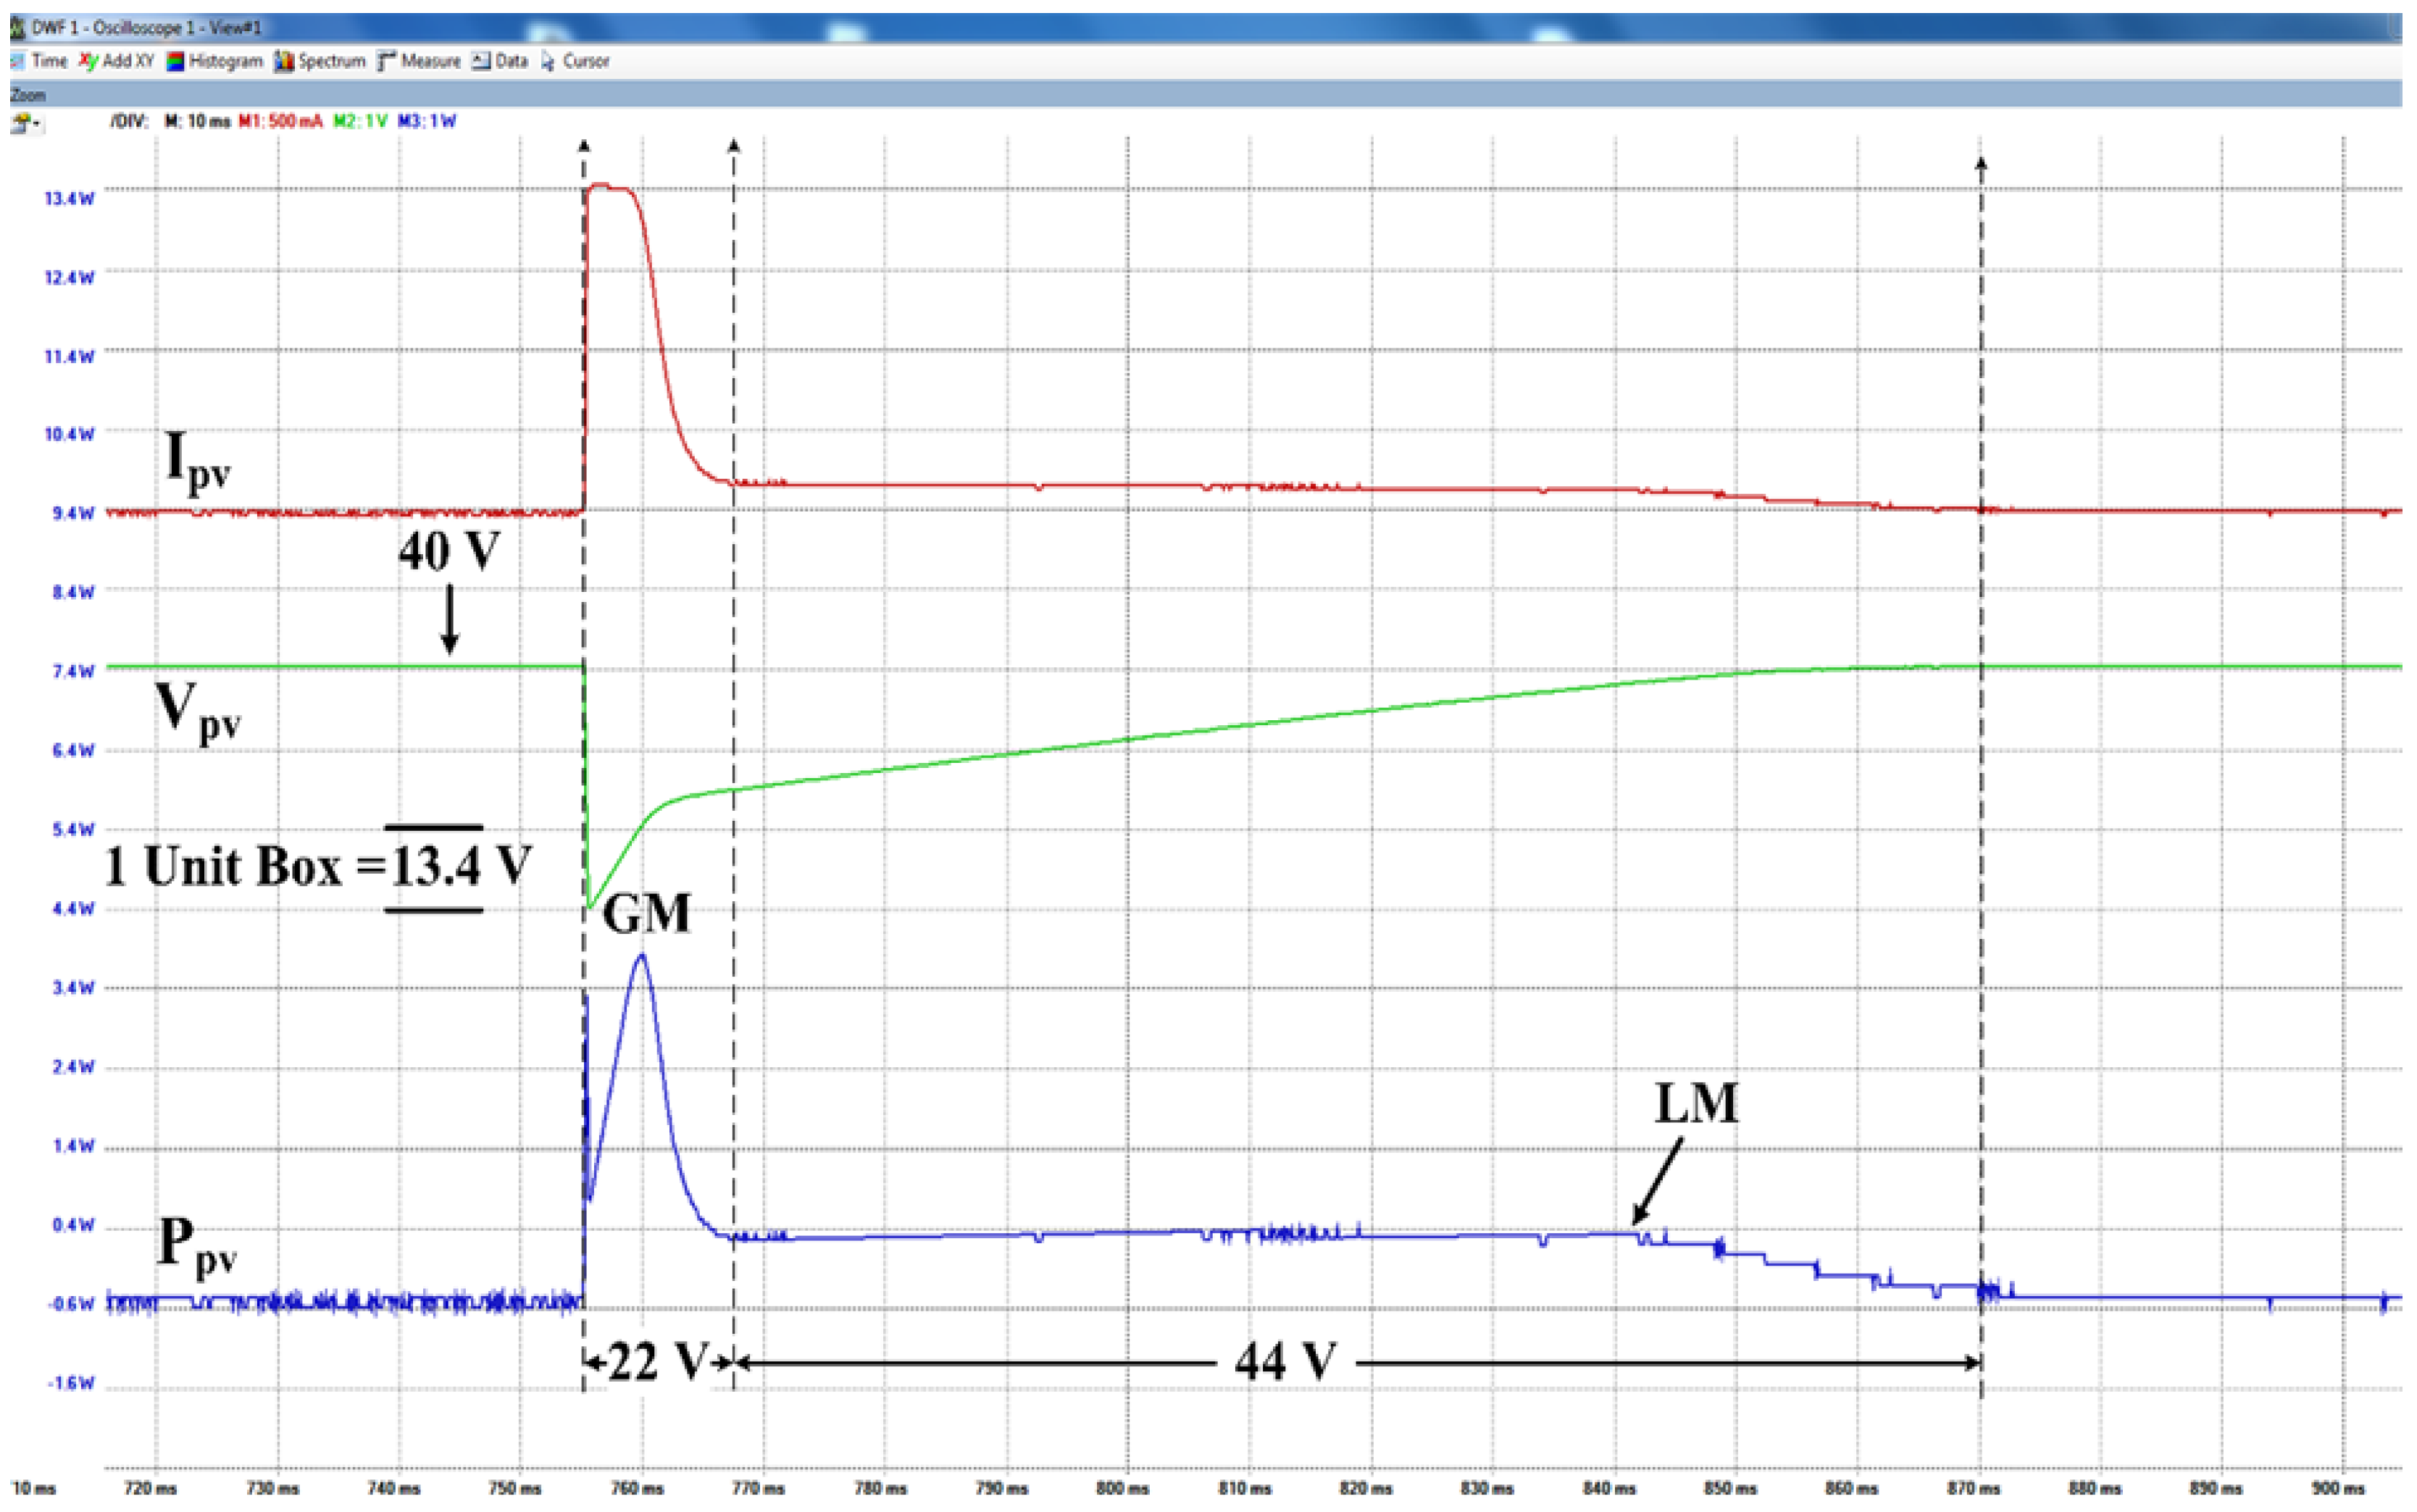
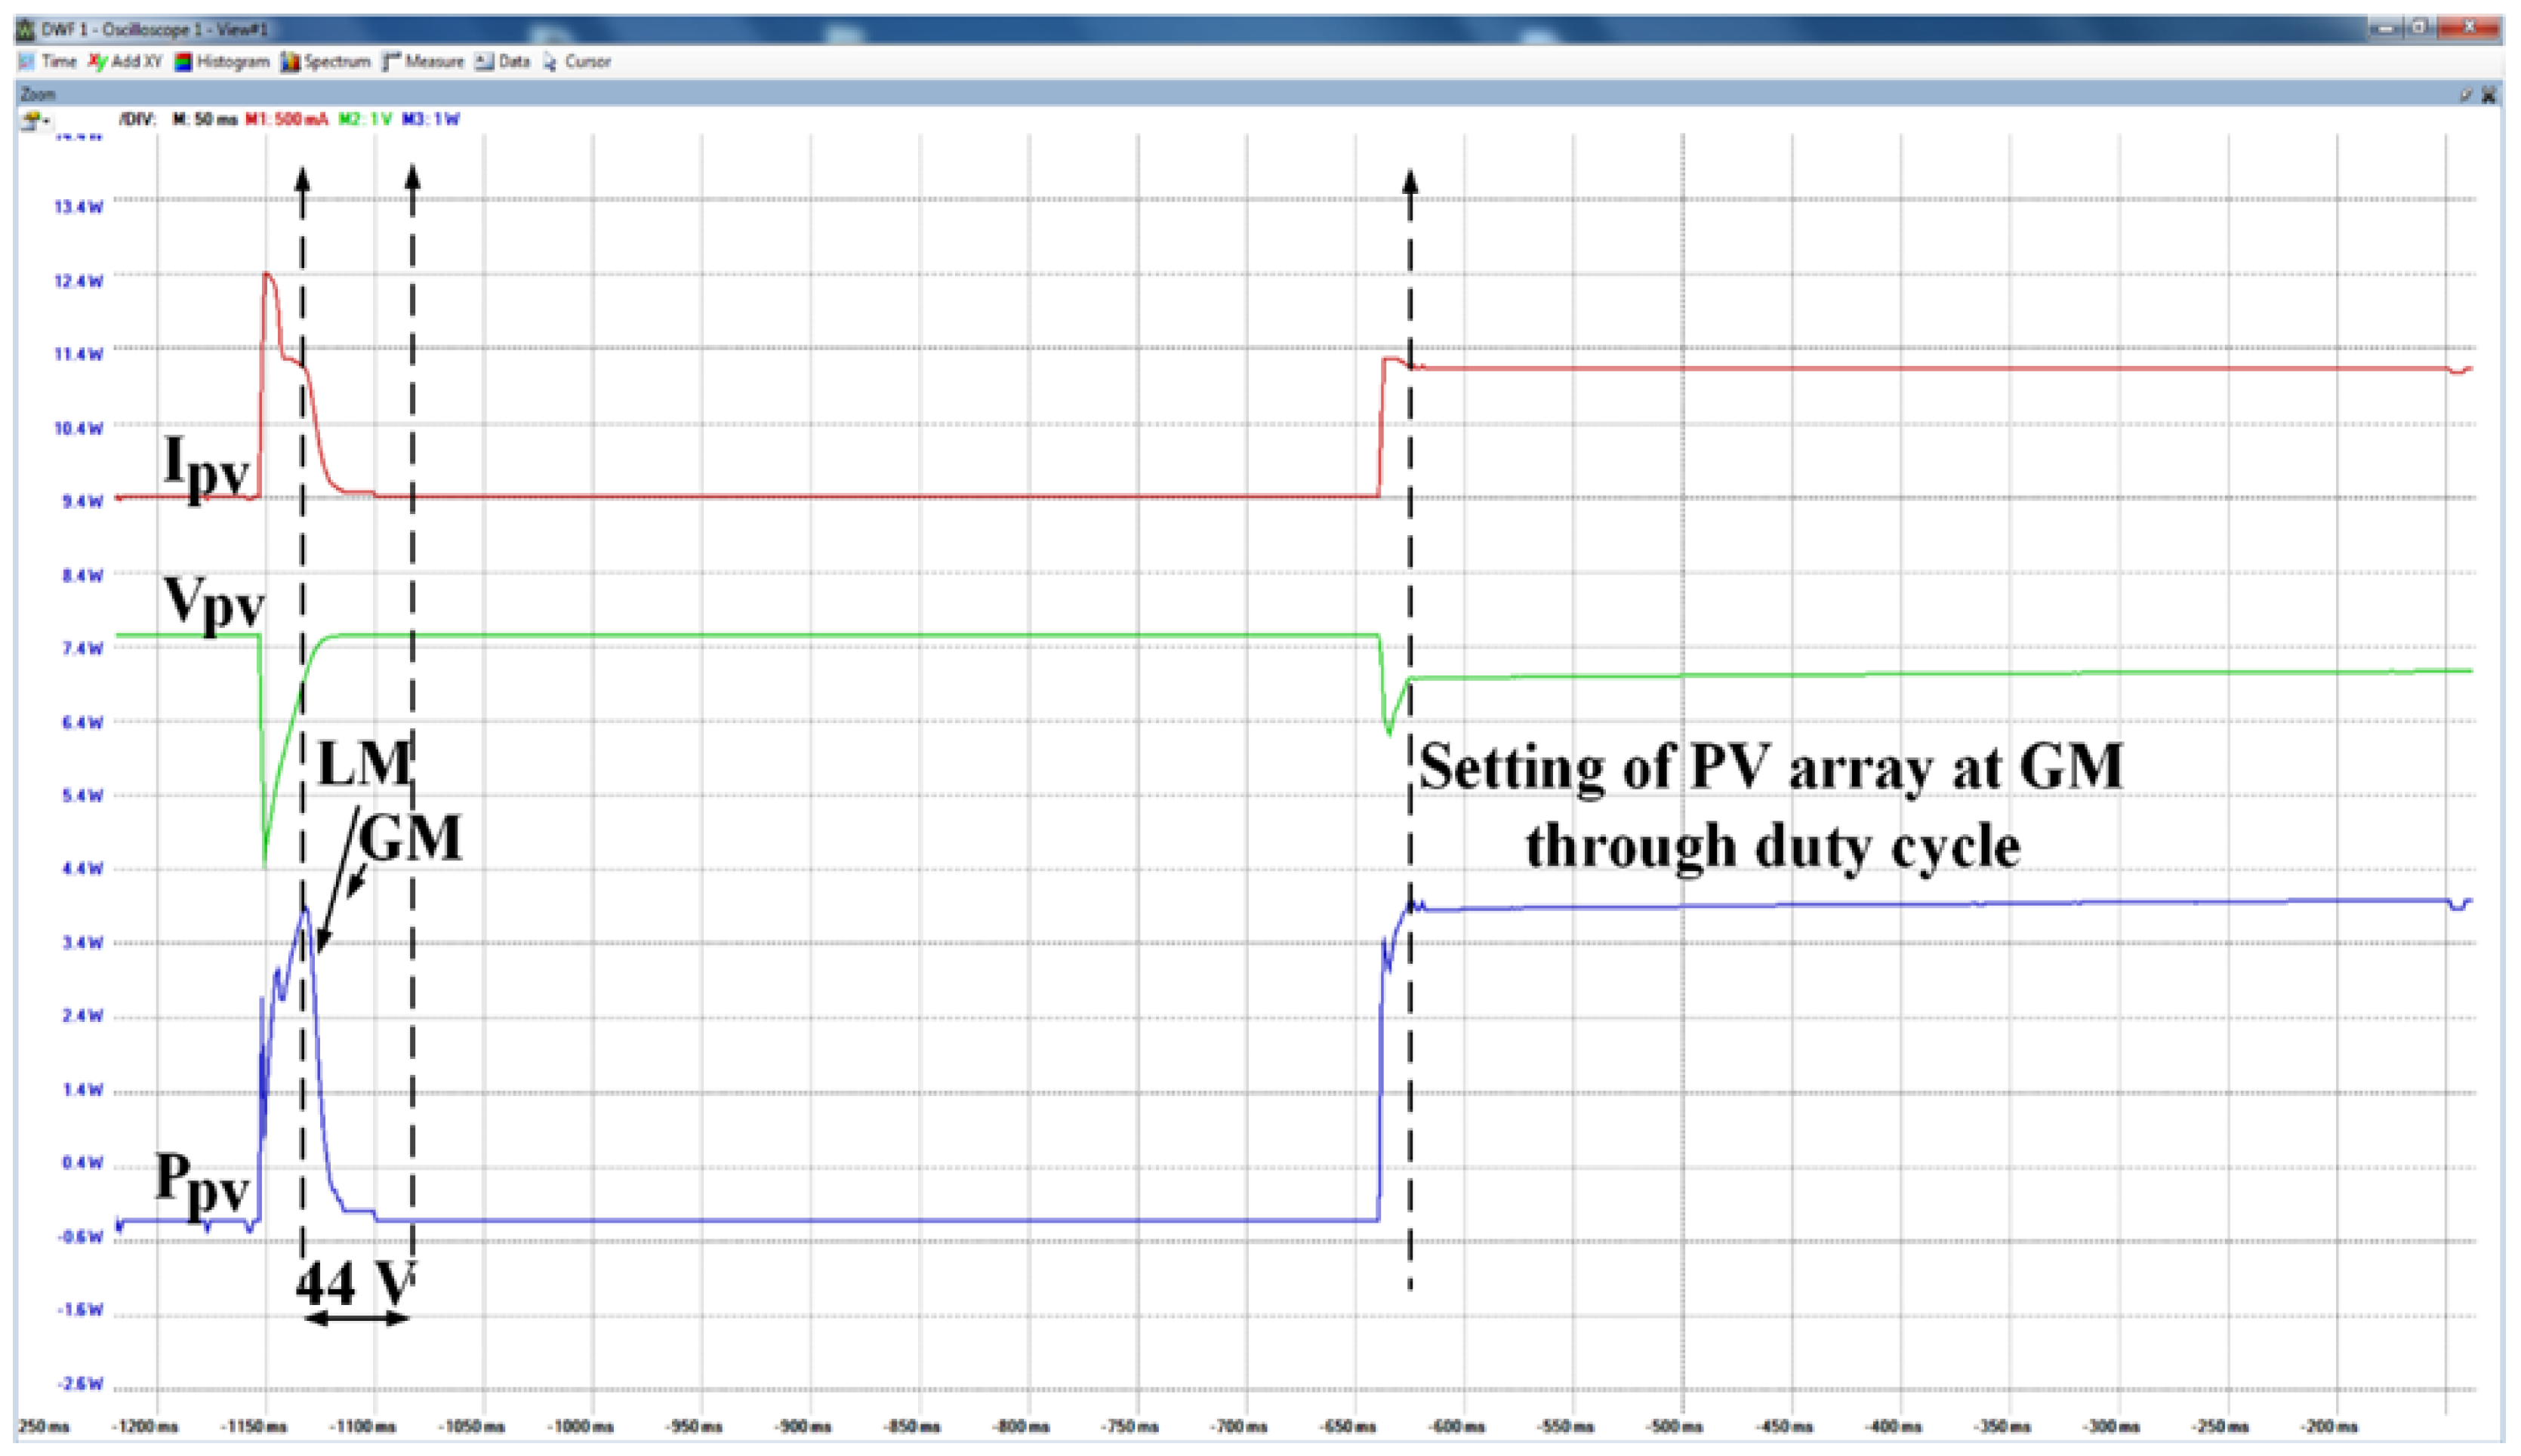
3.1. Case 1
- A PV array consists of two series of connected modules where the of each module is 12 V. Therefore, two regions take place in the PV array, which are Region-1 (0–22 V) and Region-2 (22–44 V).
- The 11 and 33 V points are selected as the mid-points of Region-1 and Region-2, respectively.
- The VI method is engaged to determine the three strings situation in Region-1 and Region-2. The imaging method declares the following current values for strings in two regions:
- -
- Region-1: String-1 (S1) exhibits the 1.21 A, i.e., . This means that although S1 string is shaded but in Region-1, the current of the unshaded module prevails, while shaded modules are by-passed. The situation is the same with String-2 and String-3.
- -
- Region-2: The dark shaded module of each string is active as declared by the VI method. Consequently, the current value of each string is represented with a 10% , i.e., 0.121 A.
3.2. Case 2
4. Conclusions
Author Contributions
Funding
Data Availability Statement
Conflicts of Interest
References
- Lewis, N.S. Toward cost-effective solar energy use. Science 2007, 315, 798–801. [Google Scholar] [CrossRef] [Green Version]
- Sher, H.A.; Murtaza, A.F.; Addoweesh, K.E.; Chiaberge, M. Pakistan’s progress in solar PV based energy generation. Renew. Sustain. Energy Rev. 2015, 47, 213–217. [Google Scholar] [CrossRef]
- Li, Y.; Wang, J.; Wang, R.; Gao, D.W.; Sun, Q.; Zhang, H. A Switched Newton-Raphson-Based Distributed Energy Management Algorithm for Multienergy System Under Persistent DoS Attacks. IEEE Trans. Autom. Sci. Eng. 2021, 1–13. [Google Scholar] [CrossRef]
- Sher, H.A.; Murtaza, A.F.; Addoweesh, K.E.; Chiaberge, M. An intelligent off-line MPPT technique for PV applications. In Proceedings of the 2013 IEEE Conference on Systems, Process & Control (ICSPC), Kuala Lumpur, Malaysia, 13–15 December 2013; pp. 316–320. [Google Scholar]
- Ahmad, R.; Murtaza, A.F.; Sher, H.A.; Shami, U.T.; Olalekan, S. An analytical approach to study partial shading effects on PV array supported by literature. Renew. Sustain. Energy Rev. 2017, 74, 721–732. [Google Scholar] [CrossRef]
- Sher, H.A.; Murtaza, A.F.; Al-Haddad, K. A hybrid maximum power point tracking method for photovoltaic applications with reduced offline measurements. In Proceedings of the 2017 IEEE International Conference on Industrial Technology (ICIT), Toronto, ON, Canada, 22–25 March 2017; pp. 1482–1485. [Google Scholar]
- Shams, I.; Mekhilef, S.; Tey, K.S. Improved-Team-Game-Optimization-Algorithm-Based Solar MPPT With Fast Convergence Speed and Fast Response to Load Variations. IEEE Trans. Ind. Electron. 2020, 68, 7093–7103. [Google Scholar] [CrossRef]
- Murtaza, A.F.; Sher, H.A.; Spertino, F.; Ciocia, A.; Noman, A.M.; Al-Shamma’a, A.A.; Alkuhayli, A. A Novel MPPT Technique Based on Mutual Coordination between Two PV Modules/Arrays. Energies 2021, 14, 6996. [Google Scholar] [CrossRef]
- Murtaza, A.F.; Sher, H.A.; Al-Haddad, K.; Spertino, F. Module level electronic circuit based PV array for identification and reconfiguration of bypass modules. IEEE Trans. Energy Convers. 2020, 36, 380–389. [Google Scholar] [CrossRef]
- Shams, I.; Mekhilef, S.; Tey, K.S. Maximum power point tracking using modified butterfly optimization algorithm for partial shading, uniform shading, and fast varying load conditions. IEEE Trans. Power Electron. 2020, 36, 5569–5581. [Google Scholar] [CrossRef]
- Ahmad, R.; Murtaza, A.F.; Sher, H.A. Power tracking techniques for efficient operation of photovoltaic array in solar applications—A review. Renew. Sustain. Energy Rev. 2019, 101, 82–102. [Google Scholar] [CrossRef]
- Anh, D.T. Autonomous Solar Panel Cleaner with Image Processing and Neural Network. Ph.D. Thesis, Vietnamese-German University, Thu Dau Mot, Vietnam, 2021. [Google Scholar]
- de Carvalho Neto, J.T. Qualitative and Quantitative Diagnostic Device for Detecting Defects in Crystalline Silicon PV Cells. IEEE Trans. Device Mater. Reliab. 2021, 21, 647–657. [Google Scholar] [CrossRef]
- Hu, Y.; Cao, W.; Wu, J.; Ji, B.; Holliday, D. Thermography-based virtual MPPT scheme for improving PV energy efficiency under partial shading conditions. IEEE Trans. Power Electron. 2014, 29, 5667–5672. [Google Scholar] [CrossRef] [Green Version]
- Guerriero, P.; Cuozzo, G.; Daliento, S. Health diagnostics of PV panels by means of single cell analysis of thermographic images. In Proceedings of the 2016 IEEE 16th International Conference on Environment and Electrical Engineering (EEEIC), Florence, Italy, 7–10 June 2016; pp. 1–6. [Google Scholar]
- Karakose, M.; Baygin, M. Image processing based analysis of moving shadow effects for reconfiguration in PV arrays. In Proceedings of the 2014 IEEE International Energy Conference (ENERGYCON), Cavtat, Croatia, 13–16 May 2014; pp. 683–687. [Google Scholar]
- Mahmoud, Y.; El-Saadany, E.F. A Novel MPPT Technique Based on an Image of PV Modules. IEEE Trans. Energy Convers. 2017, 32, 213–221. [Google Scholar] [CrossRef]
- Aghaei, M.; Grimaccia, F.; Gonano, C.A.; Leva, S. Innovative Automated Control System for PV Fields Inspection and Remote Control. IEEE Trans. Ind. Electron. 2015, 62, 7287–7296. [Google Scholar] [CrossRef]
- Vergura, S.; Marino, F. Quantitative and Computer-Aided Thermography-Based Diagnostics for PV Devices: Part I 8212; Framework. IEEE J. Photovoltaics 2017, 7, 822–827. [Google Scholar] [CrossRef]
- Vergura, S.; Colaprico, M.; de Ruvo, M.F.; Marino, F. A Quantitative and Computer-Aided Thermography-Based Diagnostics for PV Devices; Part II: Platform and Results. IEEE J. Photovoltaics 2017, 7, 237–243. [Google Scholar] [CrossRef]
- Marschner, S.R.; Westin, S.H.; Lafortune, E.P.; Torrance, K.E. Image-based bidirectional reflectance distribution function measurement. Appl. Opt. 2000, 39, 2592–2600. [Google Scholar] [CrossRef]
- McAndrew, A. An introduction to digital image processing with matlab notes for scm2511 image processing. Sch. Comput. Sci. Math. Vic. Univ. Technol. 2004, 264, 1–264. [Google Scholar]
- Hussain, A.; Sher, H.A.; Murtaza, A.F.; Al-Haddad, K. Improved restricted control set model predictive control (iRCS-MPC) based maximum power point tracking of photovoltaic module. IEEE Access 2019, 7, 149422–149432. [Google Scholar] [CrossRef]
- Shams, I.; Mekhilef, S.; Tey, K.S. Improved Social Ski Driver-Based MPPT for Partial Shading Conditions Hybridized with Constant Voltage Method for Fast Response to Load Variations. IEEE Trans. Sustain. Energy 2021, 12, 2255–2267. [Google Scholar] [CrossRef]
- Seritan, G.C.; Enache, B.A.; Adochiei, F.C.; Argatu, F.C.; Christodoulou, C.; Vita, V.; Toma, A.R.; Gandescu, C.H.; Hathazi, F.I. Performance evaluation of photovoltaic panels containing cells with different bus bars configurations in partial shading conditions. Rev. Roum. Sci. Tech.-Ser. Electrotech. Energetique 2020, 65, 67–70. [Google Scholar]
- Xiao, W.; Ozog, N.; Dunford, W.G. Topology study of photovoltaic interface for maximum power point tracking. IEEE Trans. Ind. Electron. 2007, 54, 1696–1704. [Google Scholar] [CrossRef]
- Sher, H.A.; Addoweesh, K.E.; Al-Haddad, K. Performance enhancement of a flyback photovoltaic inverter using hybrid maximum power point tracking. In Proceedings of the IECON 2015—41st Annual Conference of the IEEE Industrial Electronics Society, Yokohama, Japan, 9–12 November 2015; pp. 005369–005373. [Google Scholar]
- Kim, Y.H.; Jang, J.W.; Shin, S.C.; Won, C.Y. Weighted-efficiency enhancement control for a photovoltaic AC module interleaved flyback inverter using a synchronous rectifier. IEEE Trans. Power Electron. 2014, 29, 6481–6493. [Google Scholar] [CrossRef]
- Zhang, L.; Hu, H.; Feng, L.; Xing, Y.; Ge, H.; Sun, K. A weighted efficiency enhancement control for modular grid-tied photovoltaic generation system. In Proceedings of the IECON 2011—37th Annual Conference of the IEEE Industrial Electronics Society, Melbourne, VIC, Australia, 7–10 November 2011; pp. 3093–3098. [Google Scholar]
- SC20P-12 Solar PV Module Datasheet. Available online: https://www.enfsolar.com/pv/panel-datasheet/crystalline/14019 (accessed on 16 January 2022).


| Parameters | Value |
|---|---|
| Maximum power () | 20 W |
| Voltage at maximum power () | 17.5 V |
| Current at maximum power () | 1.14 A |
| Open circuit voltage () | 21.5 V |
| Short circuit current () | 1.29 A |
Publisher’s Note: MDPI stays neutral with regard to jurisdictional claims in published maps and institutional affiliations. |
© 2022 by the authors. Licensee MDPI, Basel, Switzerland. This article is an open access article distributed under the terms and conditions of the Creative Commons Attribution (CC BY) license (https://creativecommons.org/licenses/by/4.0/).
Share and Cite
Rehman, H.; Murtaza, A.F.; Sher, H.A.; Noman, A.M.; Al-Shamma’a, A.A.; Alkuhayli, A.; Spertino, F. Neighboring-Pixel-Based Maximum Power Point Tracking Algorithm for Partially Shaded Photovoltaic (PV) Systems. Electronics 2022, 11, 359. https://doi.org/10.3390/electronics11030359
Rehman H, Murtaza AF, Sher HA, Noman AM, Al-Shamma’a AA, Alkuhayli A, Spertino F. Neighboring-Pixel-Based Maximum Power Point Tracking Algorithm for Partially Shaded Photovoltaic (PV) Systems. Electronics. 2022; 11(3):359. https://doi.org/10.3390/electronics11030359
Chicago/Turabian StyleRehman, Huma, Ali Faisal Murtaza, Hadeed Ahmed Sher, Abdullah M. Noman, Abdullrahman A. Al-Shamma’a, Abdulaziz Alkuhayli, and Filippo Spertino. 2022. "Neighboring-Pixel-Based Maximum Power Point Tracking Algorithm for Partially Shaded Photovoltaic (PV) Systems" Electronics 11, no. 3: 359. https://doi.org/10.3390/electronics11030359
APA StyleRehman, H., Murtaza, A. F., Sher, H. A., Noman, A. M., Al-Shamma’a, A. A., Alkuhayli, A., & Spertino, F. (2022). Neighboring-Pixel-Based Maximum Power Point Tracking Algorithm for Partially Shaded Photovoltaic (PV) Systems. Electronics, 11(3), 359. https://doi.org/10.3390/electronics11030359