
Automatic Pavement Crack Detection Fusing Attention Mechanism


Abstract
1. Introduction
- (1)
- We propose a novel pavement crack detection method fusing with attention mechanisms to detect and classify the pavement cracks, which can obtain accurate detection results with only a small increase in computational load.
- (2)
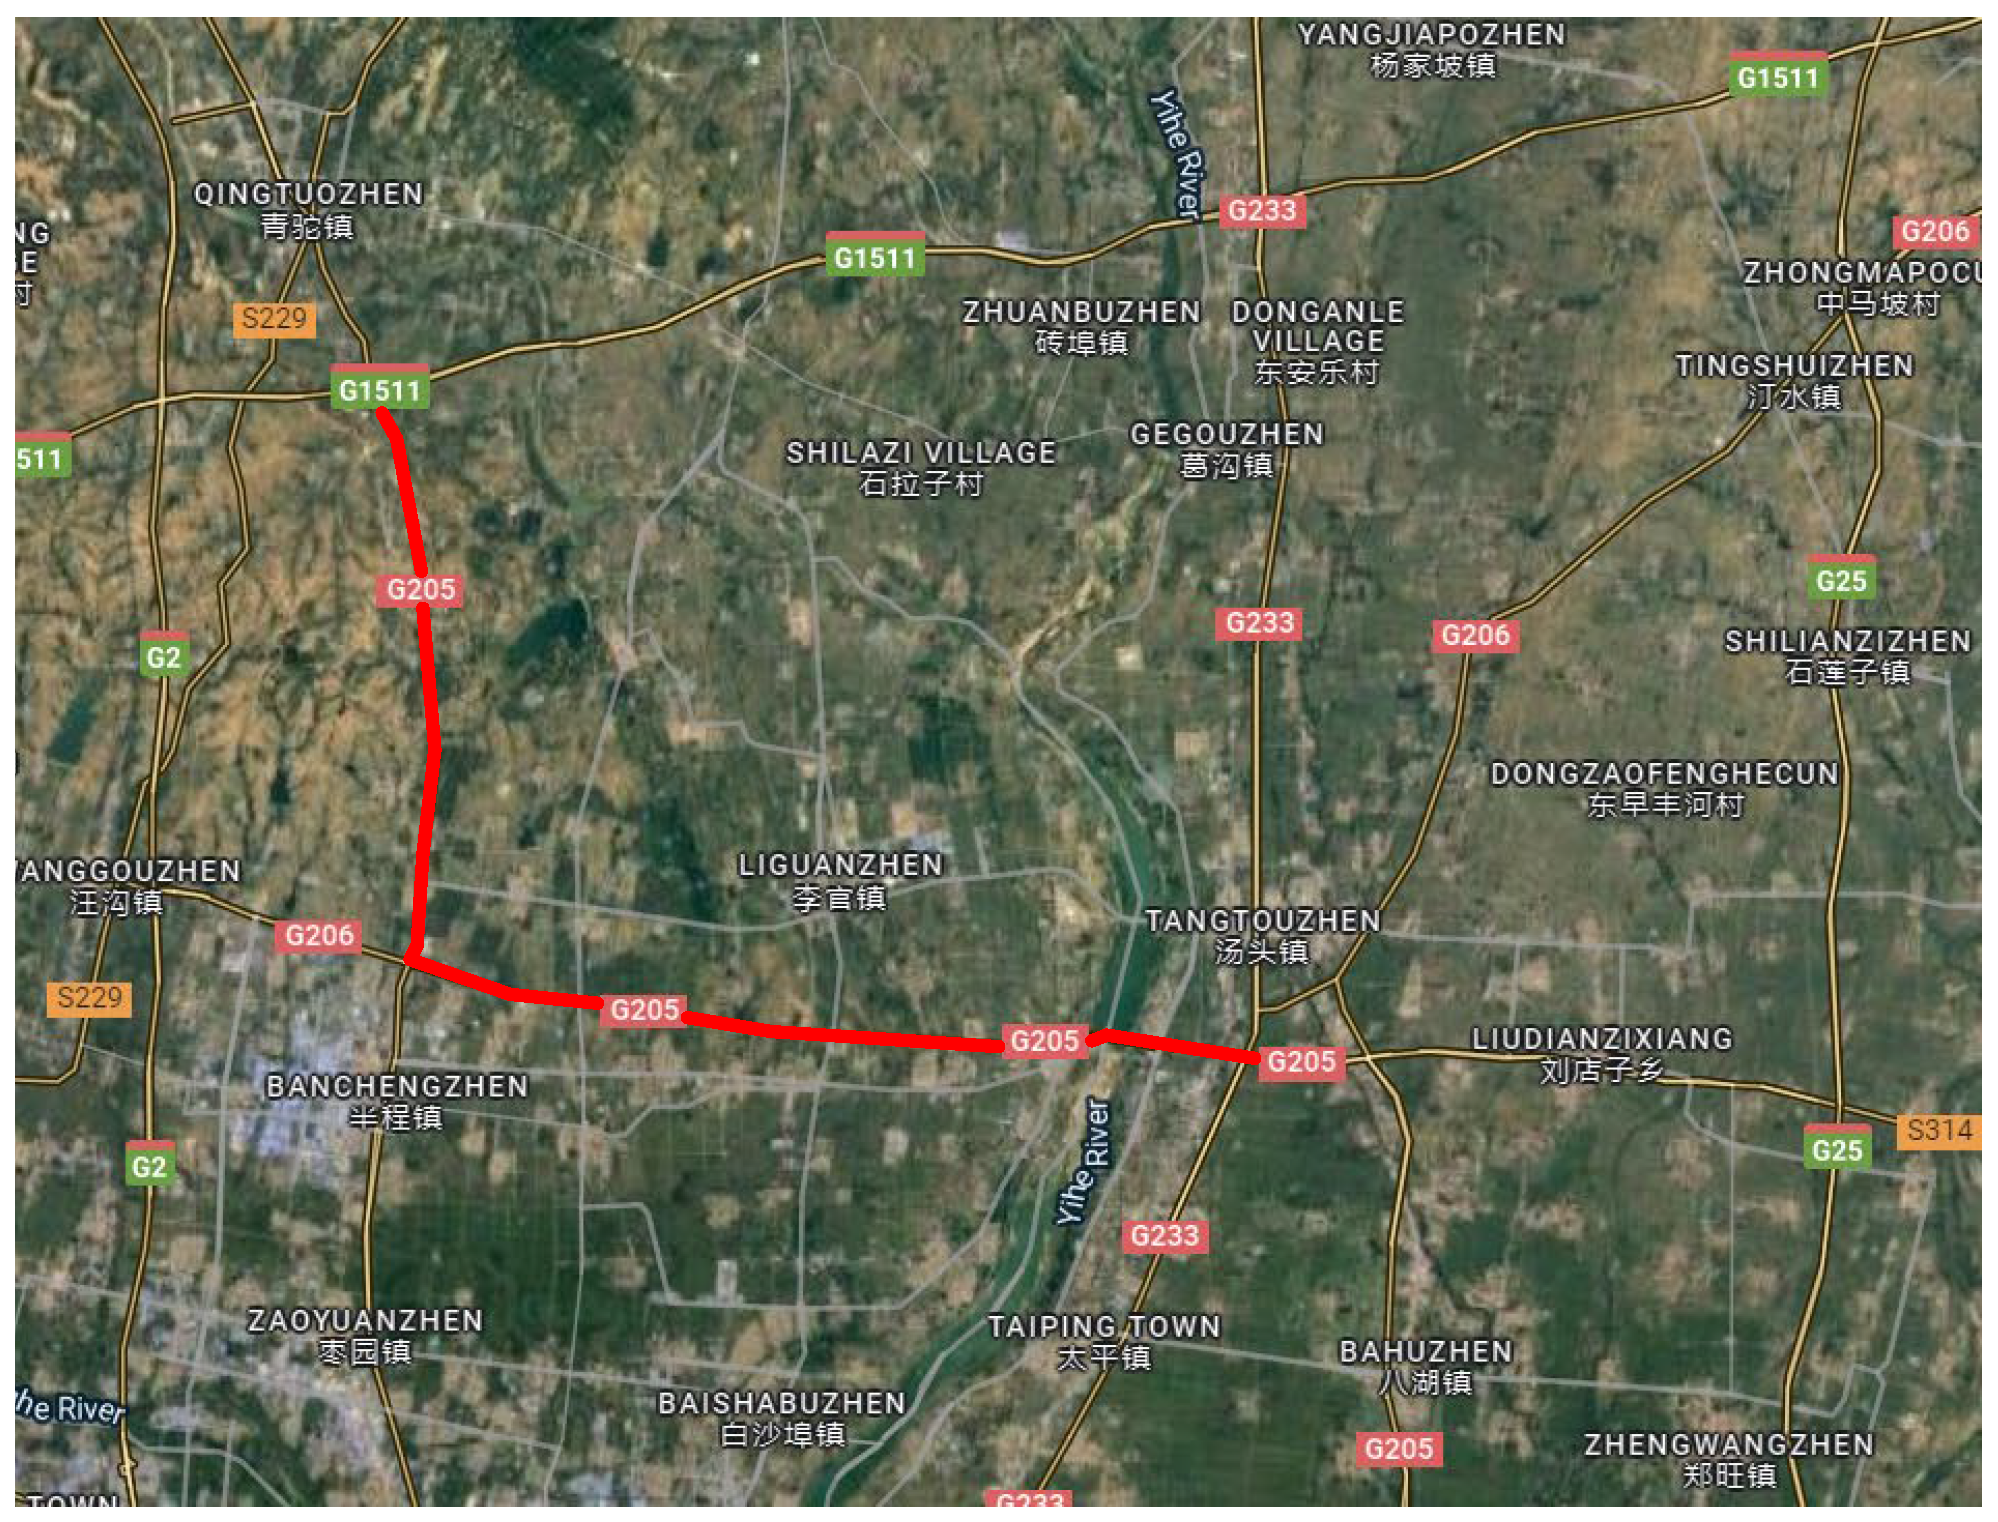
- A self-building pavement crack dataset collected in Linyi City has been proposed to be supplementary for the studies of cracks in terms of datasets.
- (3)
- Experiments on the self-building pavement crack datasets and the public crack datasets [24] show that the proposed method significantly improves the accuracy of pavement crack detection over other methods.
2. Materials and Methods
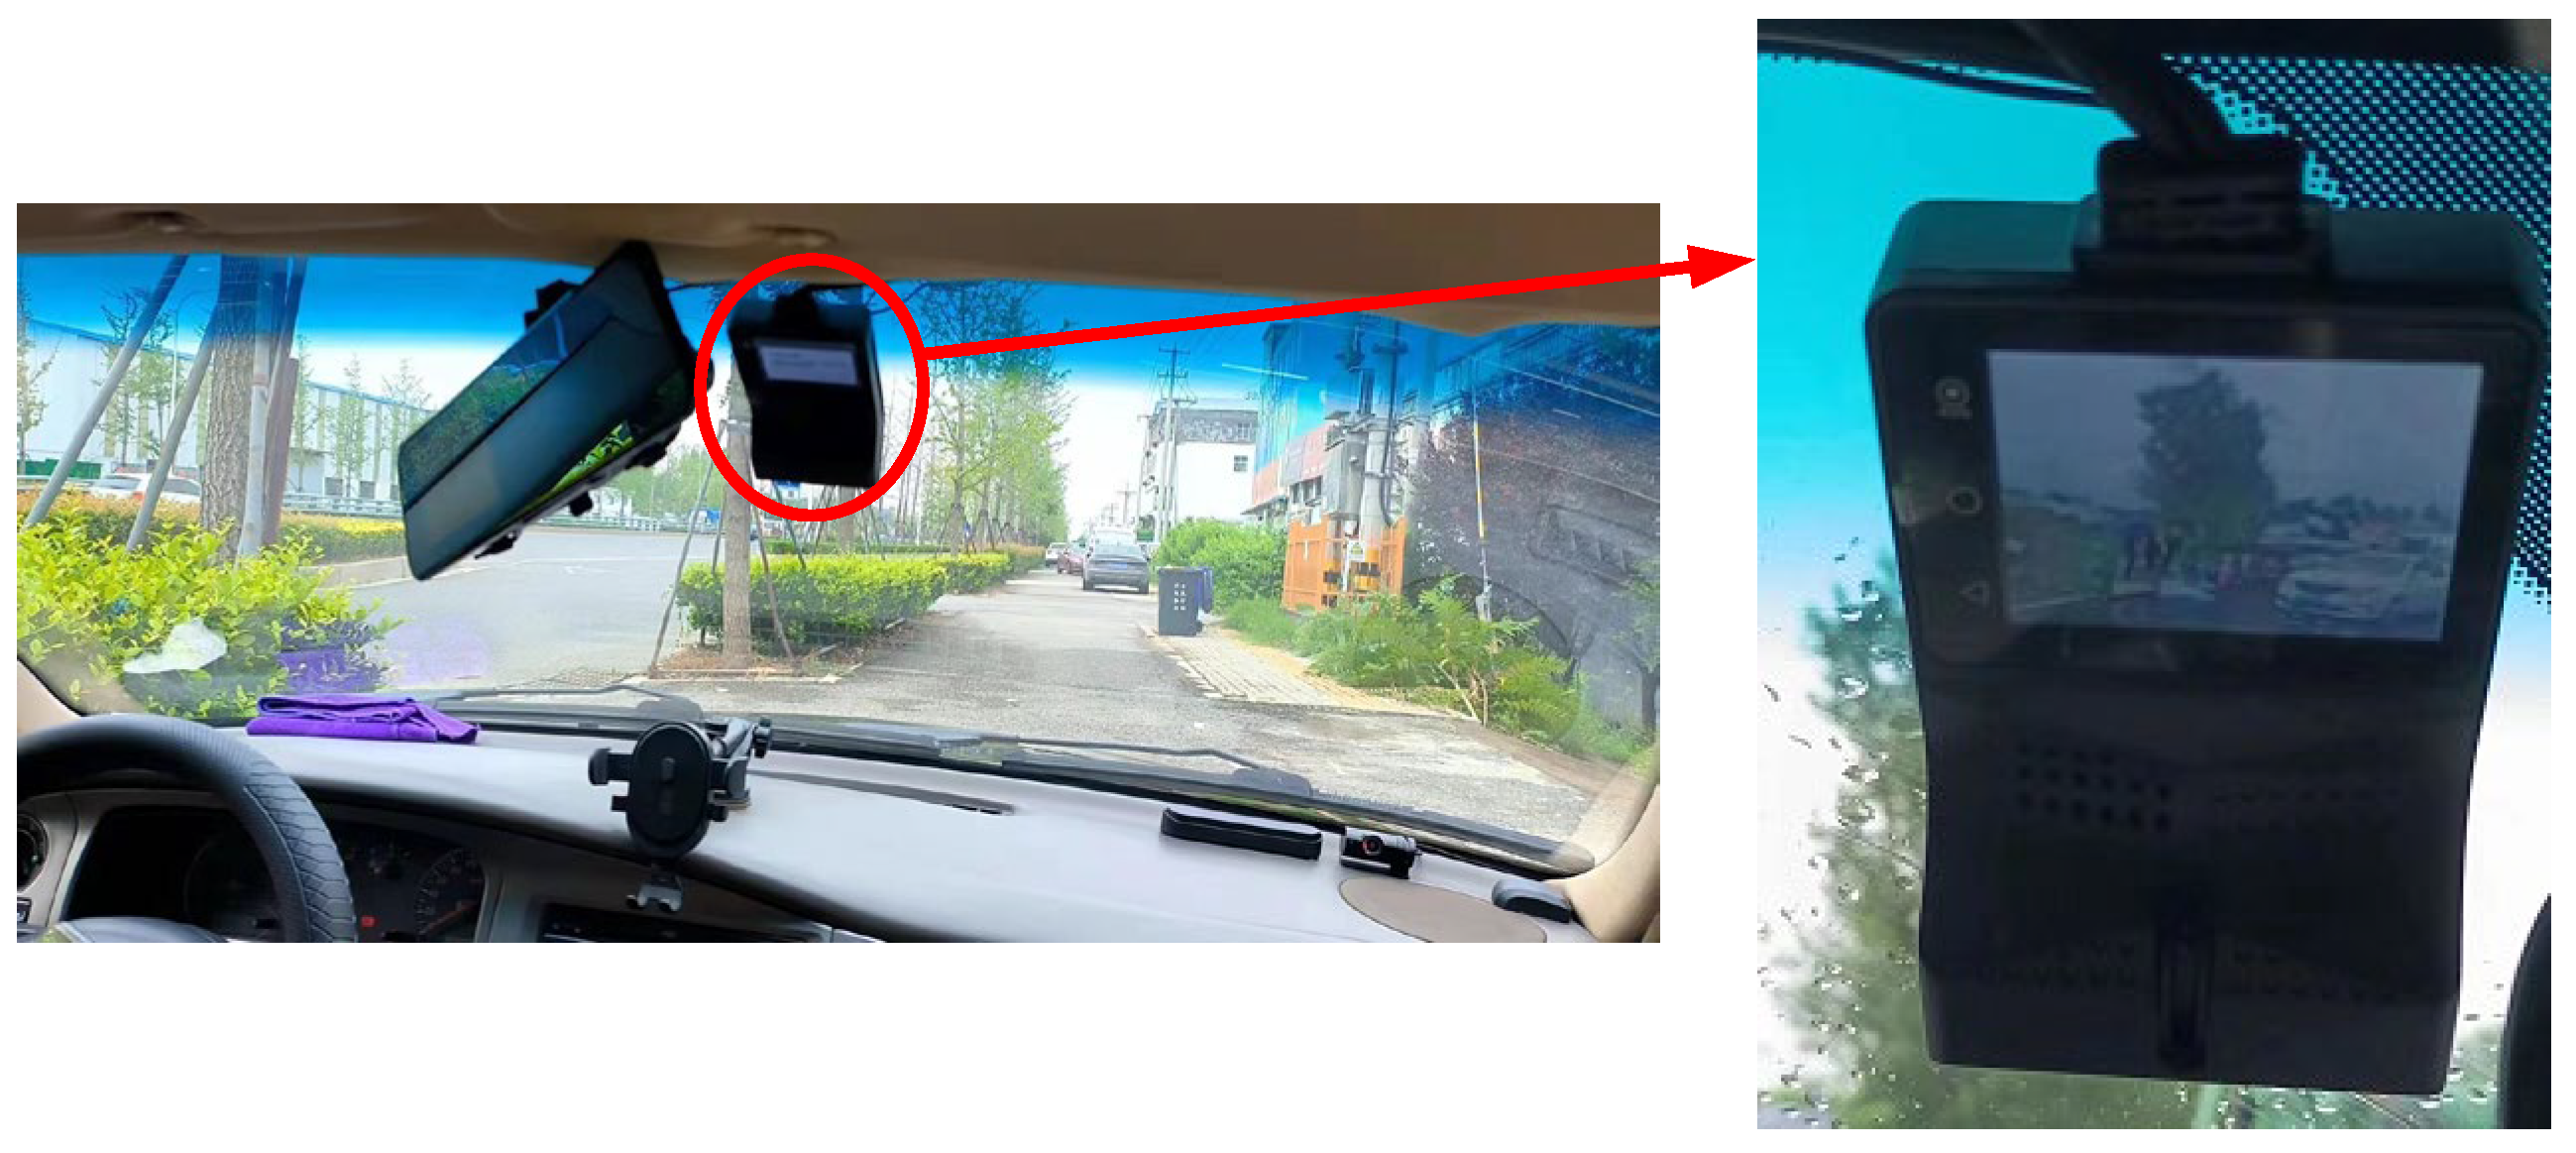
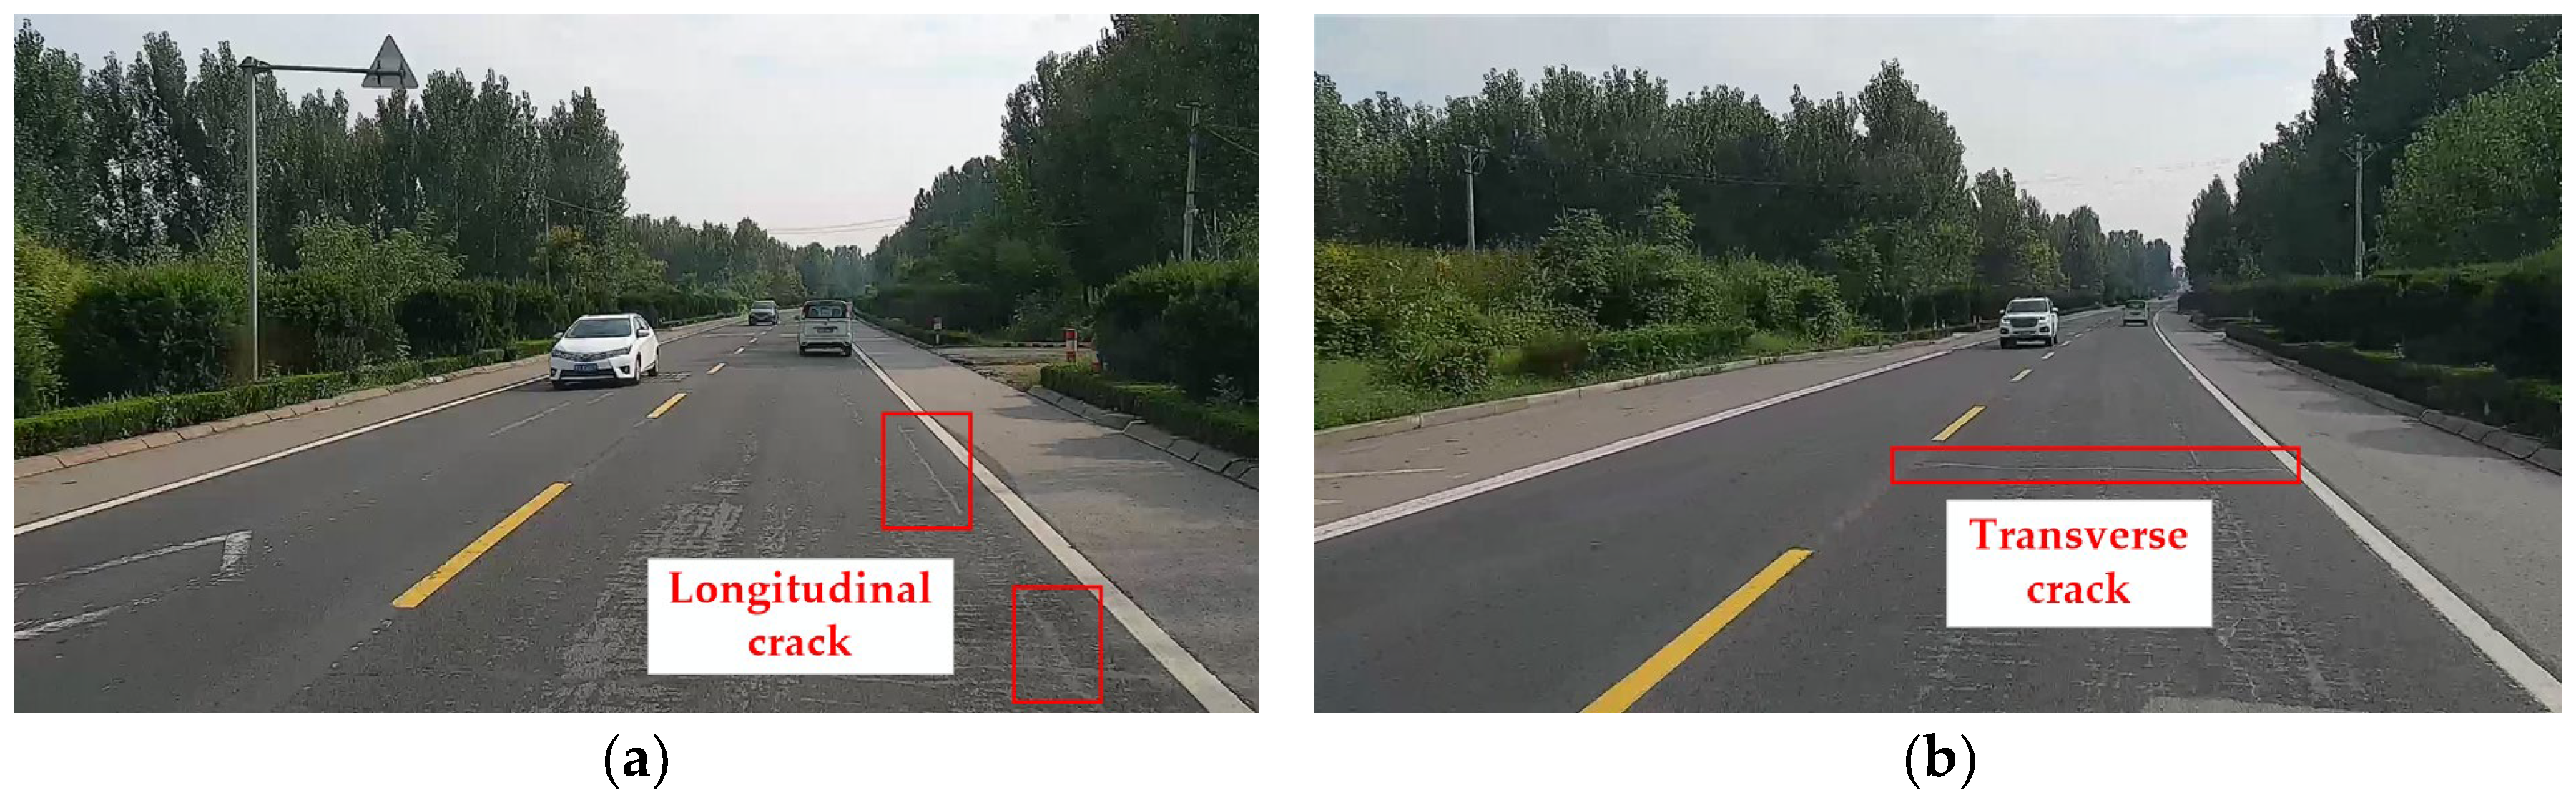
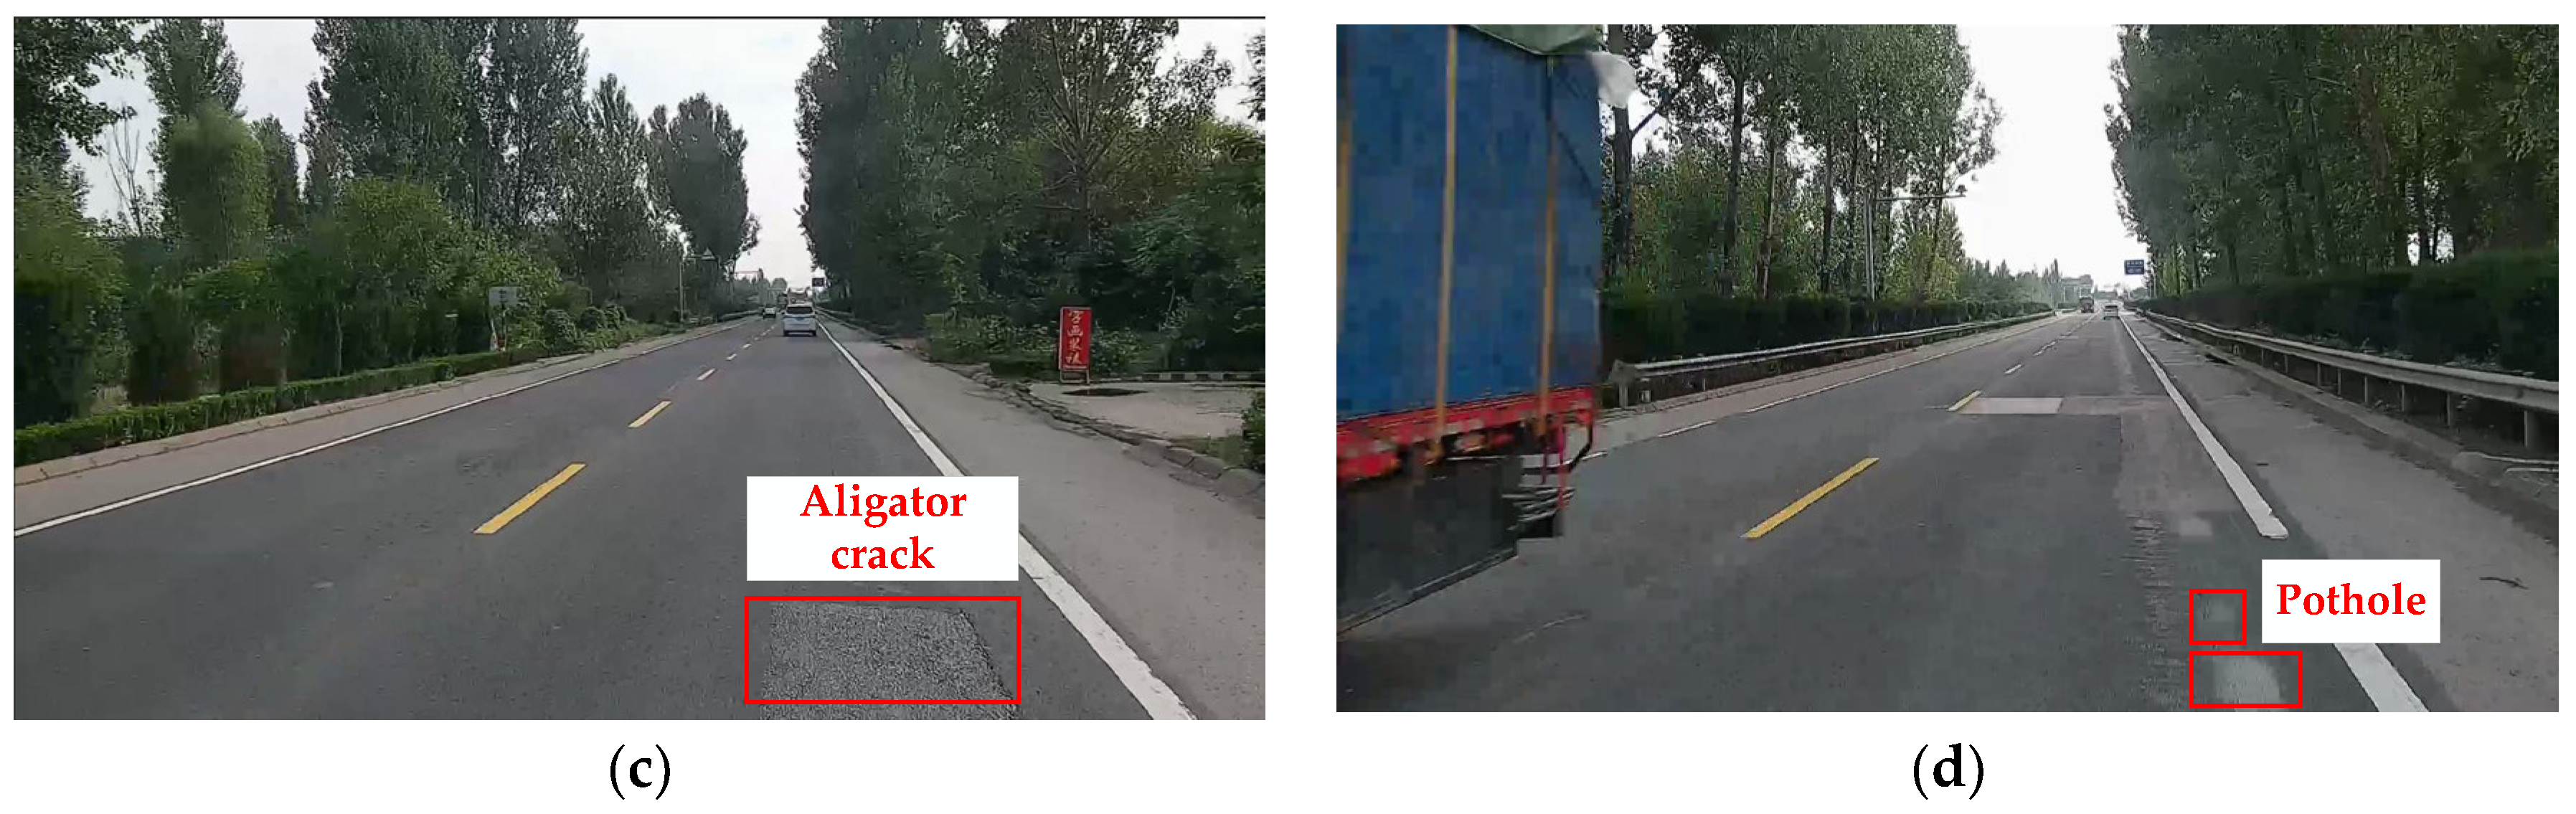
2.1. Dataset of Pavement Cracks
2.2. Architecture Design for Attention-Fused Crack Detection Network
2.2.1. The Architecture of YOLOV5
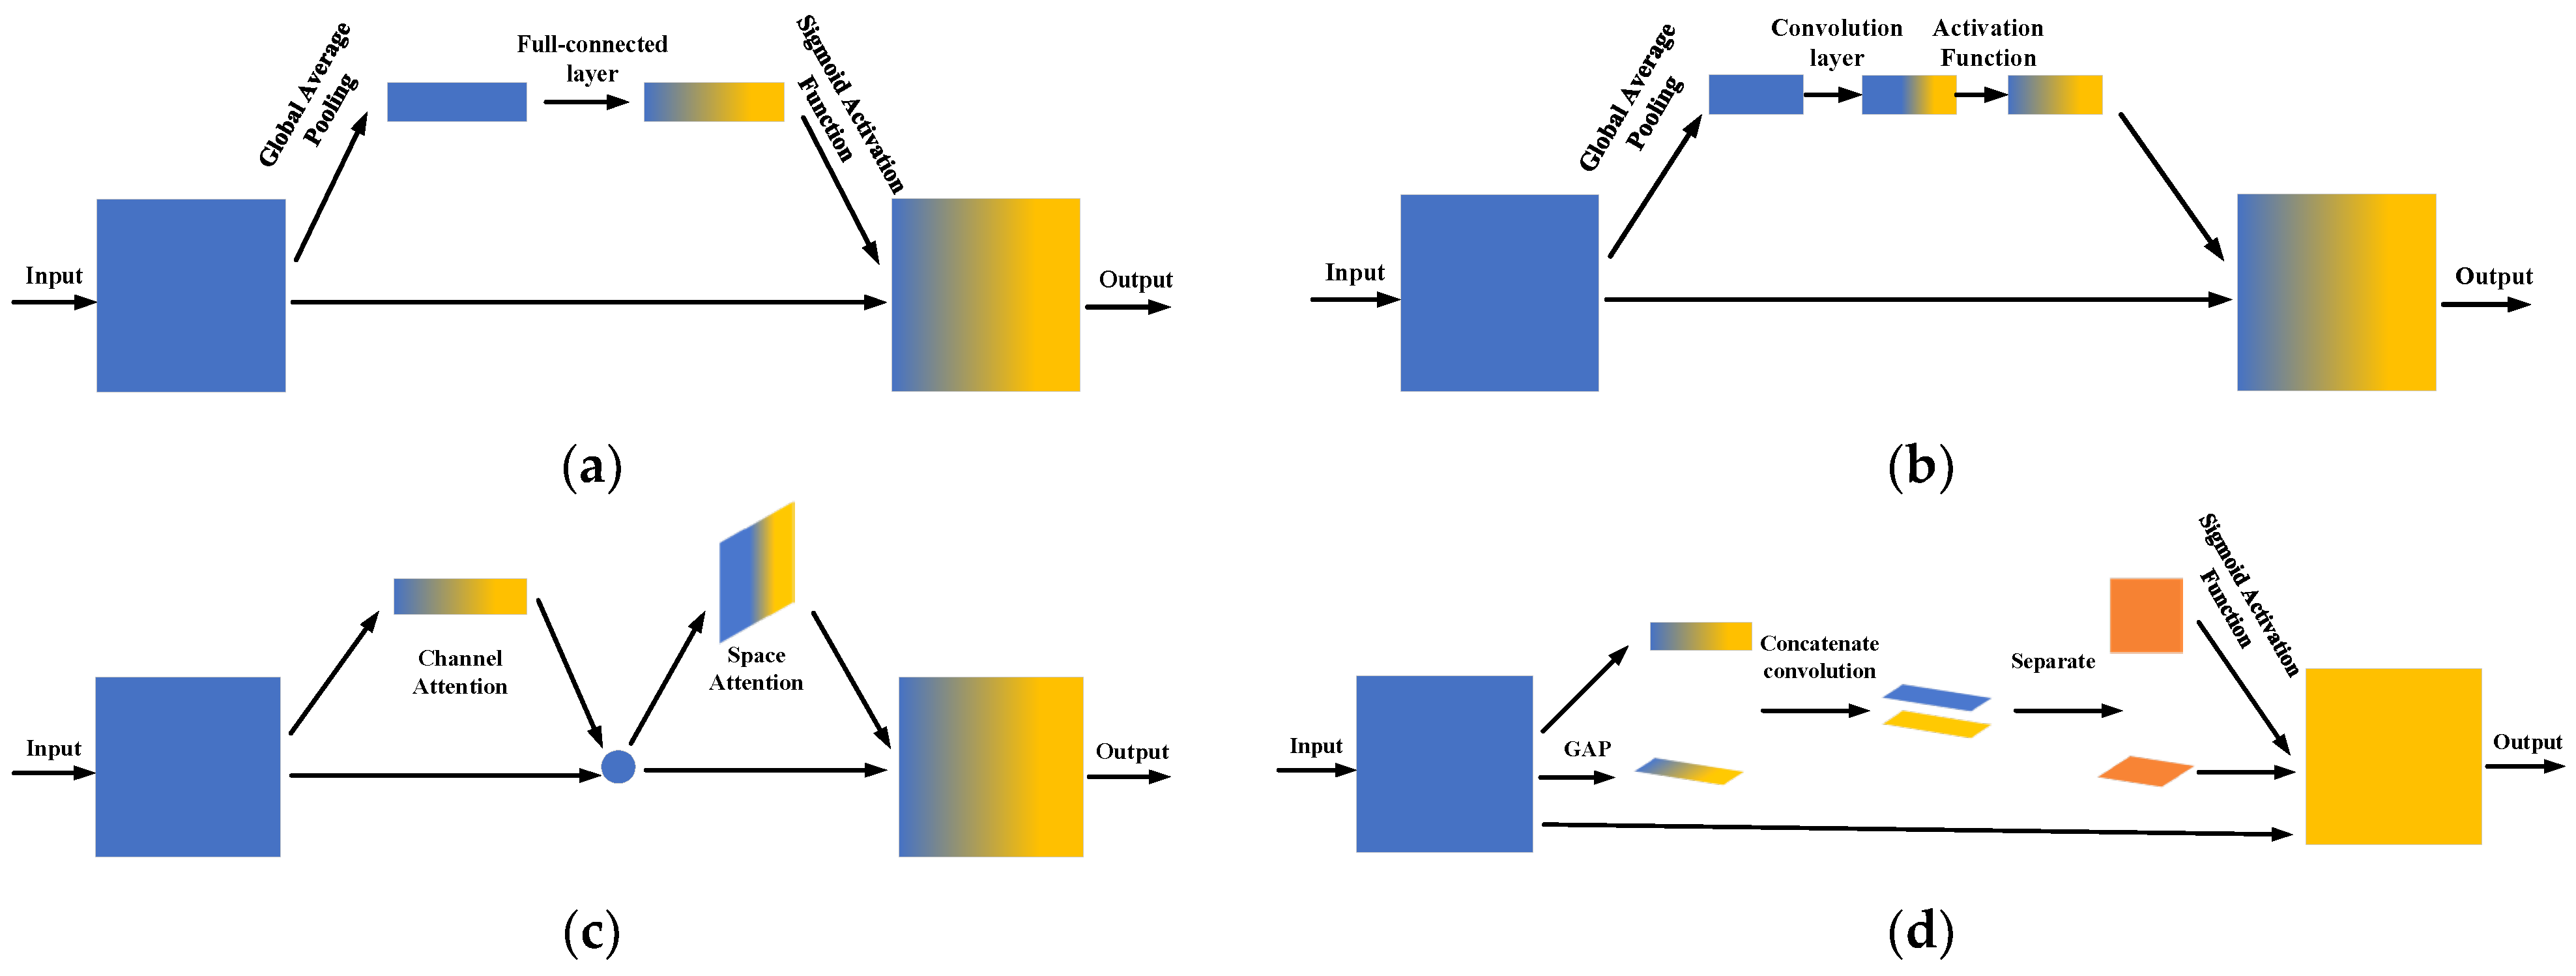
2.2.2. The Architecture of Attention Mechanisms
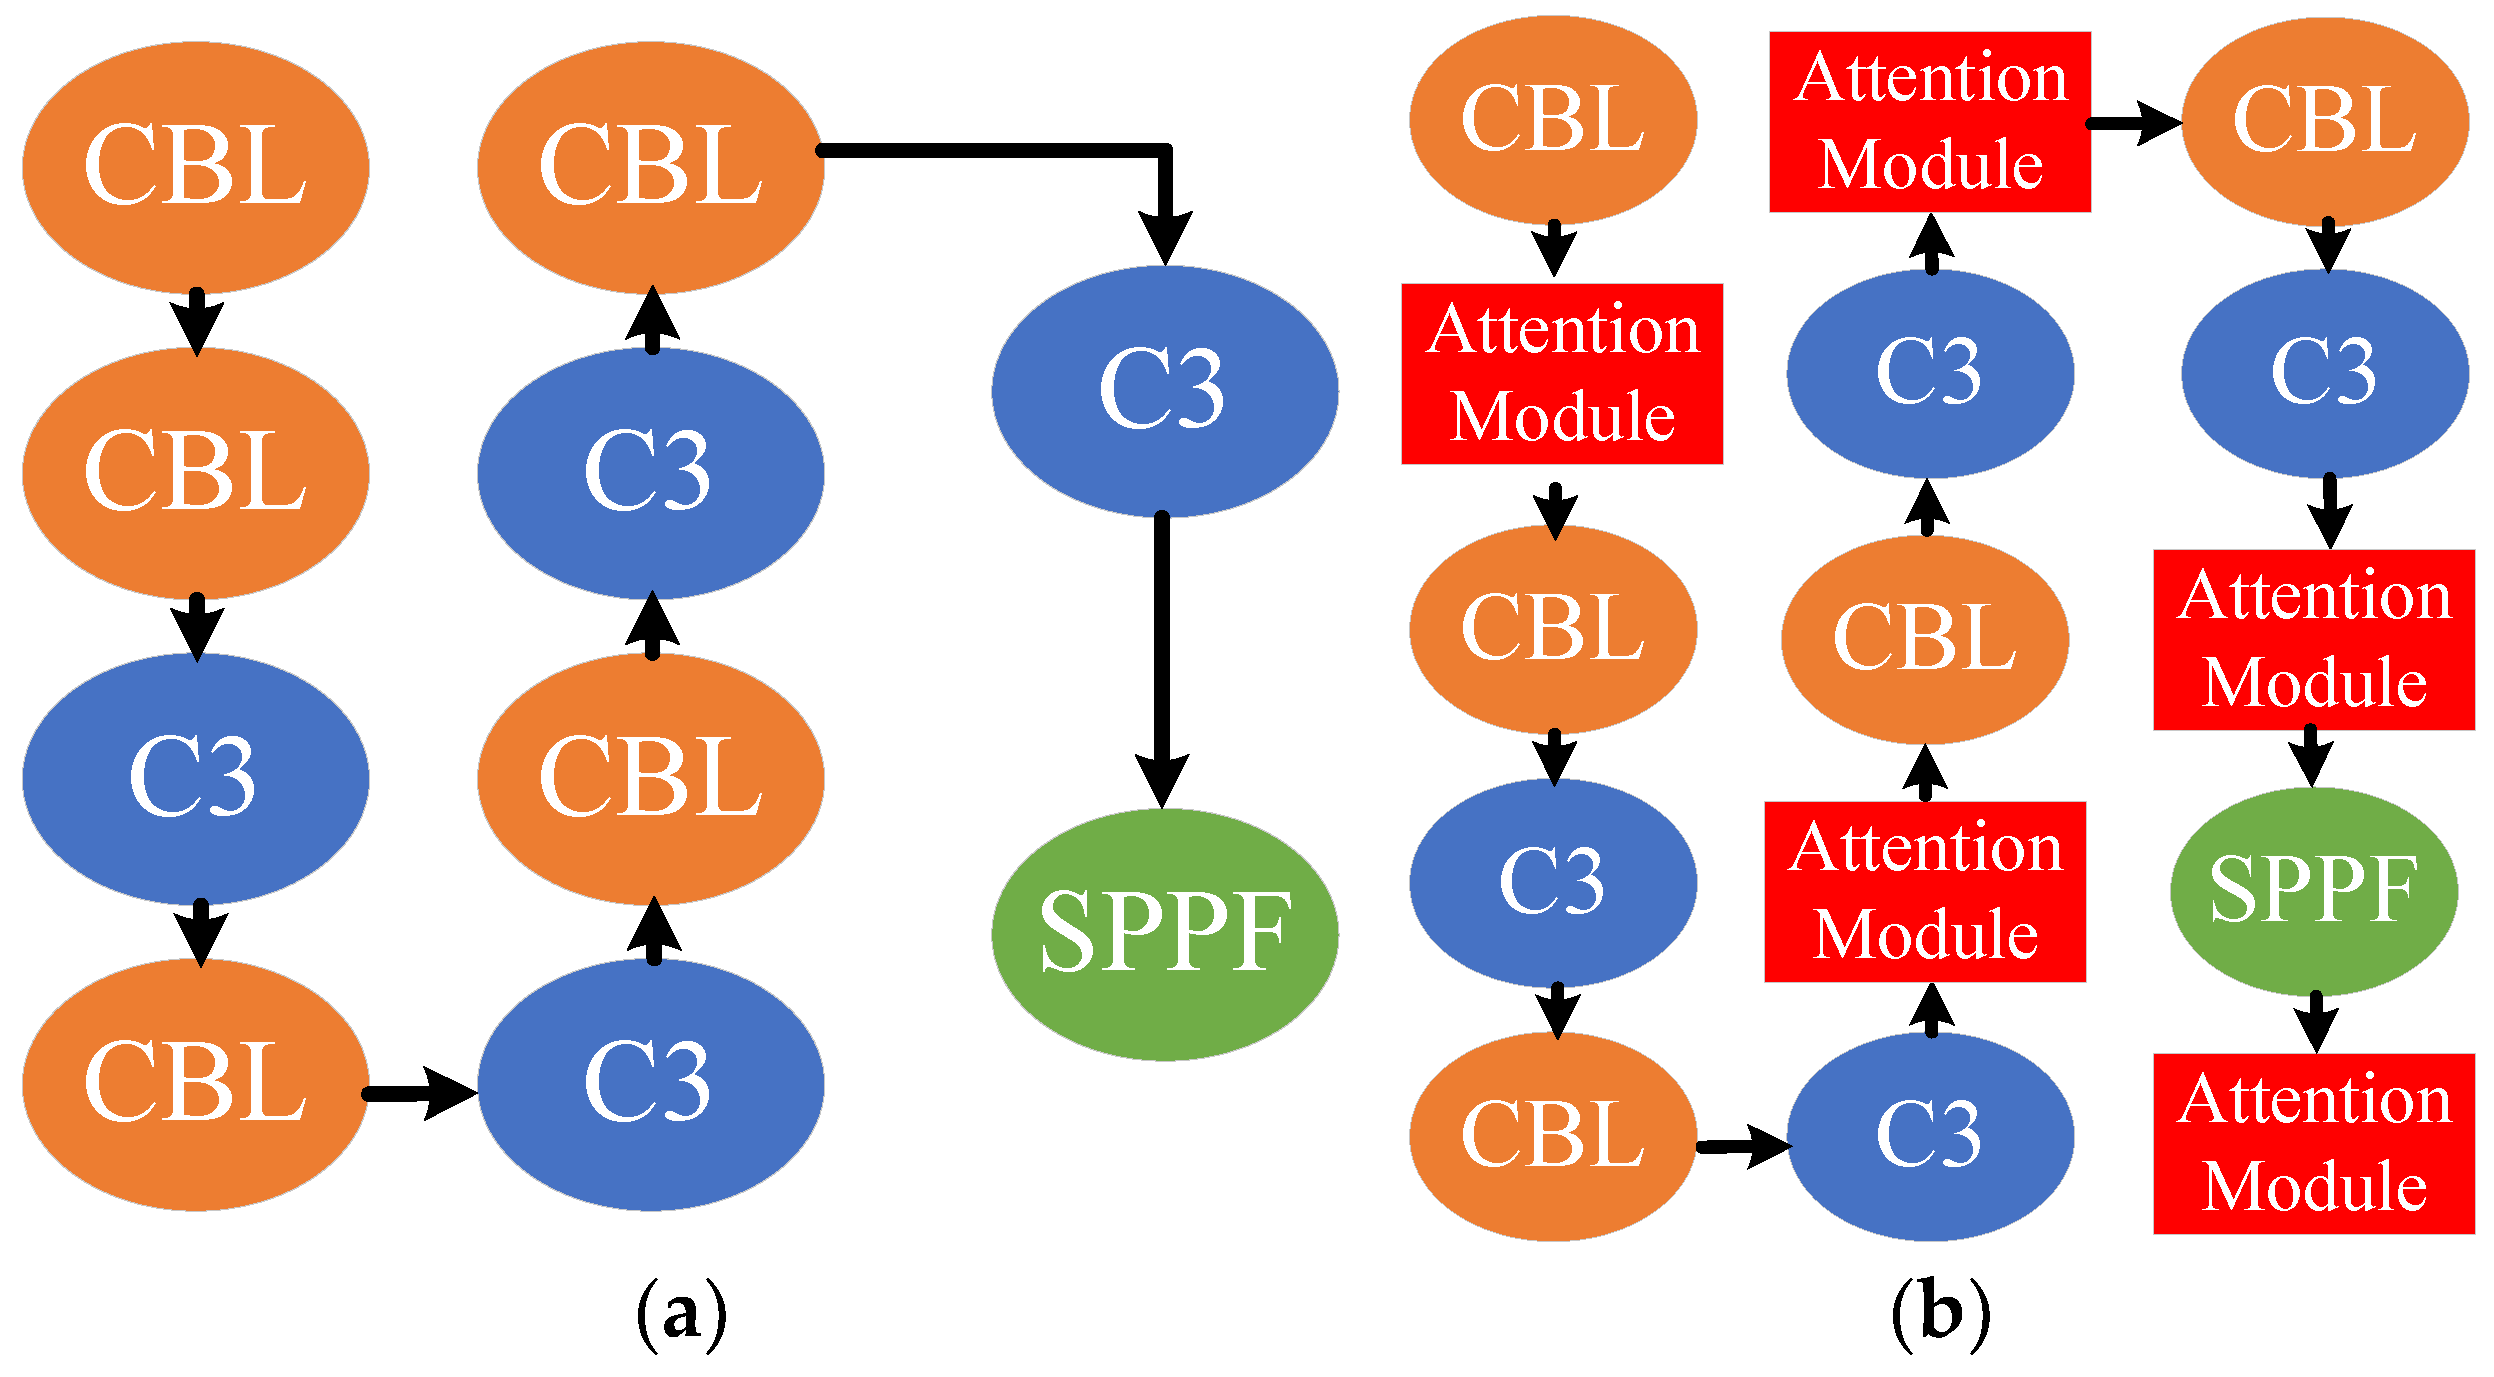
2.2.3. Improved Crack Detection with Fusing Attention Mechanism
2.3. Training Procedure
3. Results and Evaluation
3.1. Evaluation Metrics
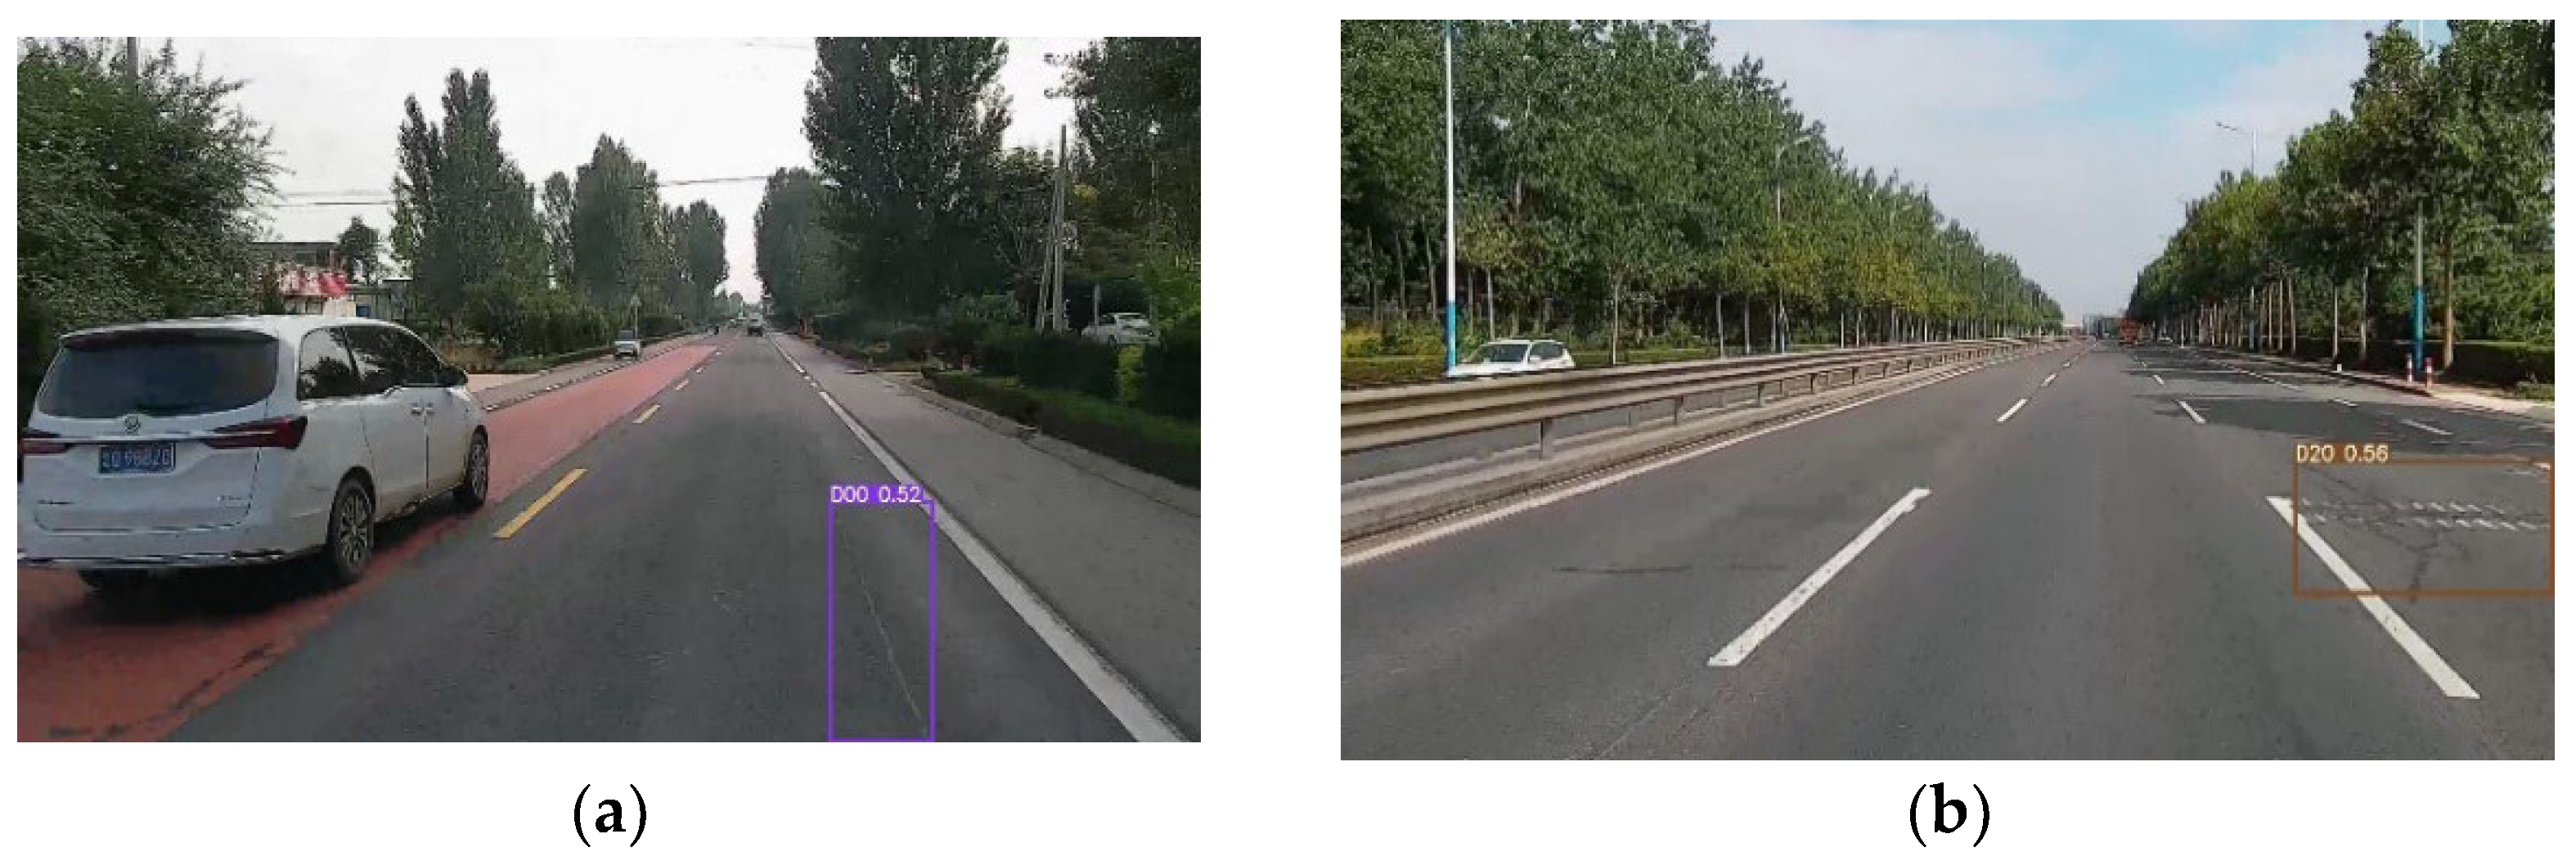
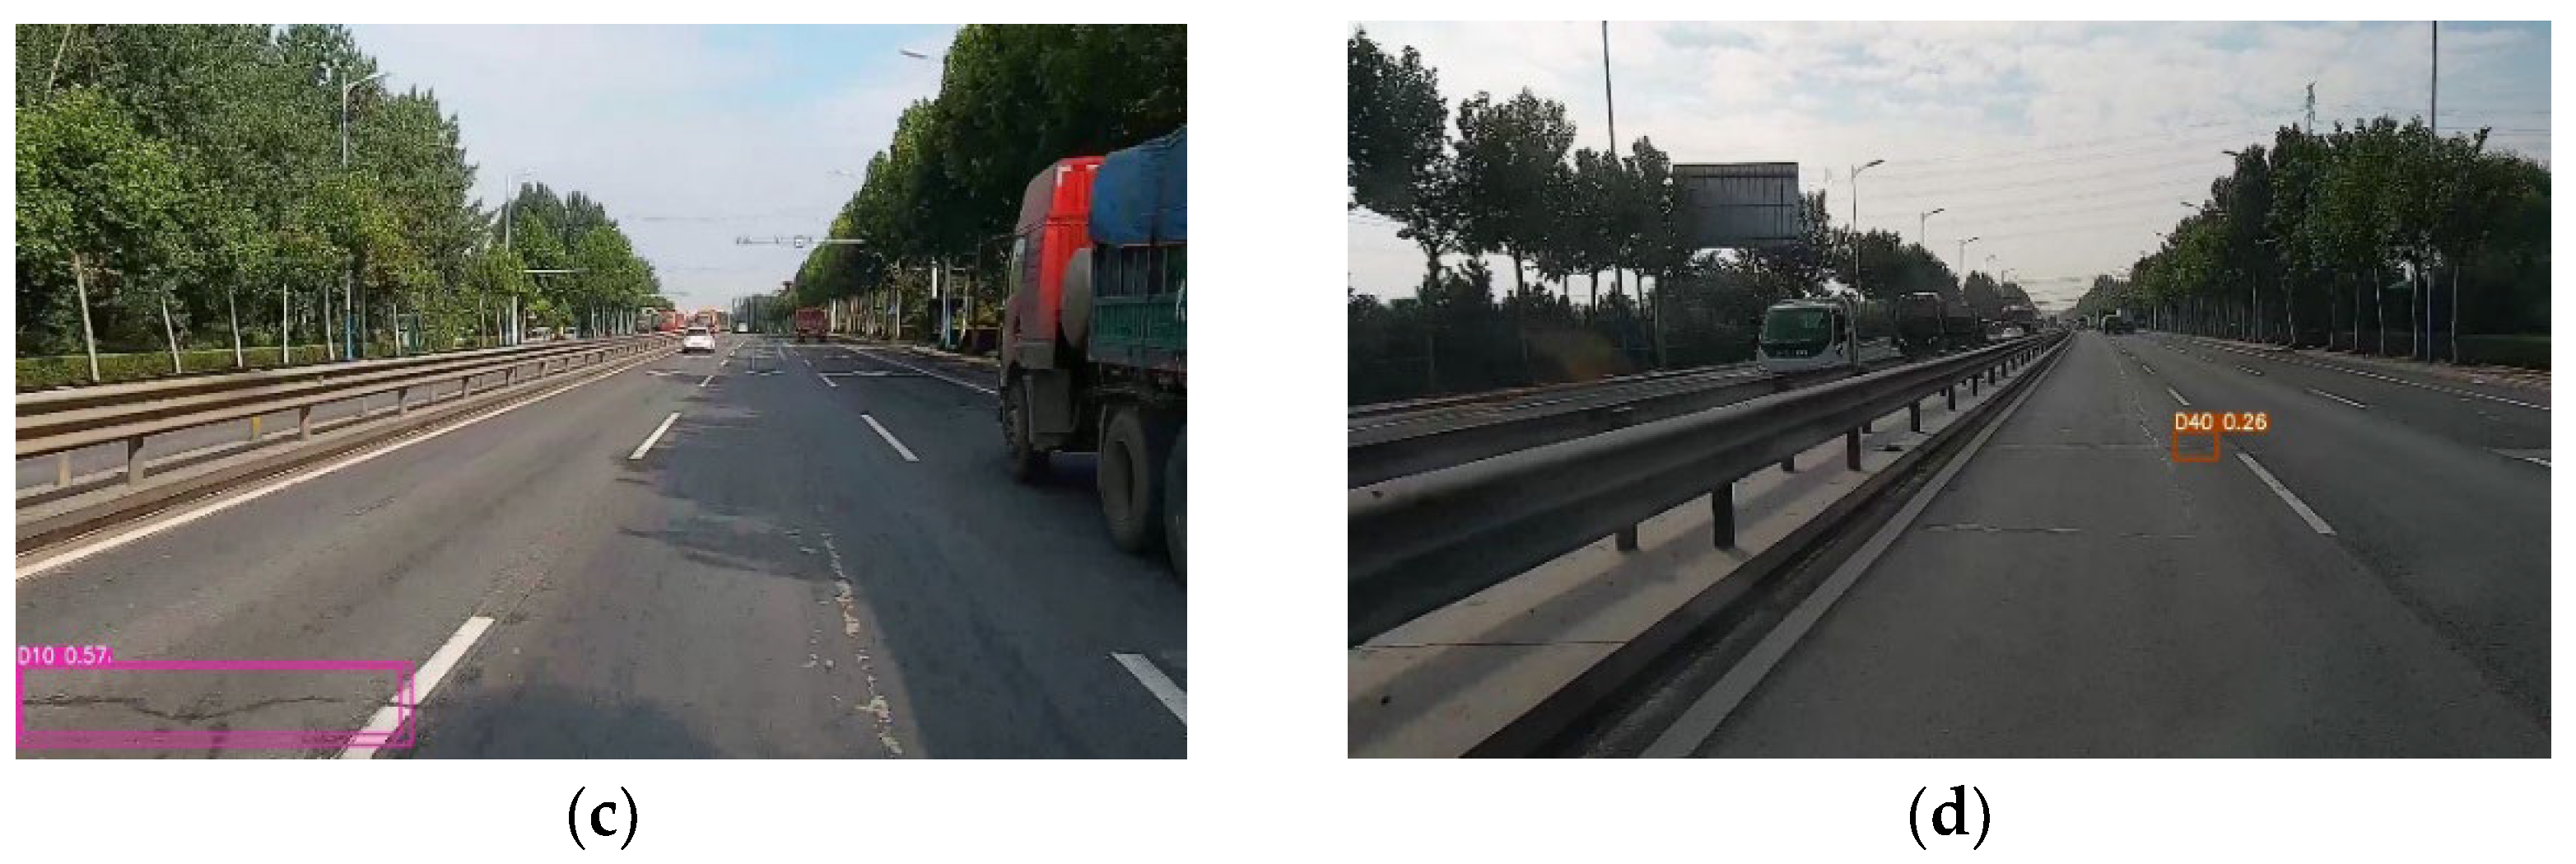
3.2. Pavement Crack Detection Results
4. Conclusions
Author Contributions
Funding
Institutional Review Board Statement
Informed Consent Statement
Data Availability Statement
Conflicts of Interest
References
- Kheradmandi, N.; Mehranfar, V. A critical review and comparative study on image segmentation-based techniques for pavement crack detection. Constr. Build. Mater. 2022, 321, 126162. [Google Scholar] [CrossRef]
- Liu, F.; Liu, J.; Wang, L. Asphalt Pavement Crack Detection Based on Convolutional Neural Network and Infrared Thermography. In IEEE Transactions on Intelligent Transportation Systems; IEEE: New York, NY, USA, 2022. [Google Scholar] [CrossRef]
- Xu, Z.; Guan, H.; Kang, J.; Lei, X.; Ma, L.; Yu, Y.; Chen, Y.; Li, J. Pavement crack detection from CCD images with a locally enhanced transformer network. Int. J. Appl. Earth Obs. Geoinf. 2022, 110, 102825. [Google Scholar] [CrossRef]
- Huyan, J.; Li, W.; Tighe, S.; Xu, Z.; Zhai, J. CrackU-net: A novel deep convolutional neural network for pixelwise pavement crack detection. Struct. Control. Health Monit. 2020, 27, e2551. [Google Scholar] [CrossRef]
- Arya, D.; Maeda, H.; Ghosh, S.K.; Toshniwal, D.; Mraz, A.; Kashiyama, T.; Sekimoto, Y. Deep learning-based road damage detection and classification for multiple countries. Autom. Constr. 2021, 132, 103935. [Google Scholar] [CrossRef]
- Zhou, J.; Huang, P.S.; Chiang, F.-P. Wavelet-based pavement distress detection and evaluation. Opt. Eng. 2006, 45, 027007. [Google Scholar] [CrossRef]
- Subirats, P.; Dumoulin, J.; Legeay, V.; Barba, D. Automation of Pavement Surface Crack Detection using the Continuous Wavelet Transform. In Proceedings of the 2006 International Conference on Image Processing, Las Vegas, NV, USA, 26–29 June 2006; pp. 3037–3040. [Google Scholar] [CrossRef]
- Peng, L.; Chao, W.; Shuangmiao, L.; Baocai, F. Research on Crack Detection Method of Airport Runway Based on Twice-Threshold Segmentation. In Proceedings of the 2015 Fifth International Conference on Instrumentation and Measurement, Computer, Communication and Control (IMCCC), Qinhuangdao, China, 18–20 September 2015; pp. 1716–1720. [Google Scholar] [CrossRef]
- Xu, W.; Tang, Z.; Zhou, J.; Ding, J. Pavement crack detection based on saliency and statistical features. In Proceedings of the 2013 IEEE International Conference on Image Processing, Melbourne, VIC, Australia, 15–18 September 2013; pp. 4093–4097. [Google Scholar] [CrossRef]
- Chen, G.H.; Ni, J.; Chen, Z.; Huang, H.; Sun, Y.L.; Ip, W.H.; Yung, K.L. Detection of Highway Pavement Damage Based on a CNN Using Grayscale and HOG Features. Sensors 2022, 22, 2455. [Google Scholar] [CrossRef]
- Quintana, M.; Torres, J.; Menéndez, J.M. A Simplified Computer Vision System for Road Surface Inspection and Maintenance. IEEE Trans. Intell. Transp. Syst. 2016, 17, 608–619. [Google Scholar] [CrossRef]
- Kapela, R.; Śniatała, P.; Turkot, A.; Rybarczyk, A.; Pożarycki, A.; Rydzewski, P.; Wyczałek, M.; Błoch, A. Asphalt surfaced pavement cracks detection based on histograms of oriented gradients. In Proceedings of the 2015 22nd International Conference Mixed Design of Integrated Circuits & Systems (MIXDES), Torun, Poland, 25–27 June 2015; pp. 579–584. [Google Scholar] [CrossRef]
- Maode, Y.; Shaobo, B.; Kun, X.; Yuyao, H. Pavement Crack Detection and Analysis for High-grade Highway. In Proceedings of the 2007 8th International Conference on Electronic Measurement and Instruments, Xian, China, 16–19 August 2007; pp. 4–548. [Google Scholar] [CrossRef]
- Fan, Z.; Li, C.; Chen, Y.; Wei, J.; Loprencipe, G.; Chen, X.; Di Mascio, P. Automatic Crack Detection on Road Pavements Using Encoder-Decoder Architecture. Materials 2020, 13, 2960. [Google Scholar] [CrossRef]
- Yang, F.; Zhang, L.; Yu, S.; Prokhorov, D.; Mei, X.; Ling, H. Feature Pyramid and Hierarchical Boosting Network for Pavement Crack Detection. IEEE Trans. Intell. Transp. Syst. 2020, 21, 1525–1535. [Google Scholar] [CrossRef]
- Maeda, H.; Kashiyama, T.; Sekimoto, Y.; Seto, T.; Omata, H. Generative adversarial network for road damage detection. Comput. -Aided Civ. Infrastruct. Eng. 2021, 36, 47–60. [Google Scholar] [CrossRef]
- Zhang, K.; Cheng, H.D.; Zhang, B. Unified Approach to Pavement Crack and Sealed Crack Detection Using Preclassification Based on Transfer Learning. J. Comput. Civ. Eng. 2018, 32, 04018001. [Google Scholar] [CrossRef]
- Wang, W.; Su, C. Convolutional Neural Network-Based Pavement Crack Segmentation Using Pyramid Attention Network. IEEE Access 2020, 8, 206548–206558. [Google Scholar] [CrossRef]
- Fan, Z.; Li, C.; Chen, Y.; Di Mascio, P.; Chen, X.; Zhu, G.; Loprencipe, G. Ensemble of Deep Convolutional Neural Networks for Automatic Pavement Crack Detection and Measurement. Coatings 2020, 10, 152. [Google Scholar] [CrossRef]
- Zhou, T.; Wang, S.; Zhou, Y.; Yao, Y.; Li, J.; Shao, L. Motion-attentive transition for zero-shot video object segmentation. Proc. AAAI Conf. Artif. Intell. 2020, 34, 13066–13073. [Google Scholar] [CrossRef]
- Zhou, T.; Wang, W.; Qi, S.; Ling, H.; Shen, J. Cascaded human-object interaction recognition. In Proceedings of the IEEE/CVF Conference on Computer Vision and Pattern Recognition, Seattle, WA, USA, 13–19 June 2020; pp. 4263–4272. [Google Scholar]
- Choudhury, A.; Ramchandani, R.; Shamoon, M.; Khare, A.; Kaushik, K. An Efficient Algorithm for Detecting and Measure the Properties of Pothole. In Emerging Technology in Modelling and Graphics; Springer: Singapore, 2020; pp. 447–457. [Google Scholar]
- Ahmed, K.R. Smart pothole detection using deep learning based on dilated convolution. Sensors 2021, 21, 8406. [Google Scholar] [CrossRef]
- Zhu, J.; Zhong, J.; Ma, T.; Huang, X.; Zhang, W.; Zhou, Y. Pavement distress detection using convolutional neural networks with images captured via UAV. Autom. Constr. 2022, 133, 103991. [Google Scholar] [CrossRef]
- Liu, J.; Yang, X.; Lau, S.; Wang, X.; Luo, S.; Lee, V.C.S.; Ding, L. Automated pavement crack detection and segmentation based on two-step convolutional neural network. Comput.-Aided Civ. Infrastruct. Eng. 2020, 35, 1291–1305. [Google Scholar] [CrossRef]
- Redmon, J.; Divvala, S.; Girshick, R.; Farhadi, A. You Only Look Once: Unified, Real-Time Object Detection. In Proceedings of the 2016 IEEE Conference on Computer Vision and Pattern Recognition (CVPR), Las Vegas, NV, USA, 27–30 June 2016; pp. 779–788. [Google Scholar] [CrossRef]
- Redmon, J.; Farhadi, A. YOLOv3: An Incremental Improvement. arXiv 2018, arXiv:1804.02767. [Google Scholar] [CrossRef]
- Bochkovskiy, A.; Wang, C.-Y.; Liao, H.-Y.M. YOLOv4: Optimal Speed and Accuracy of Object Detection. arXiv 2020, arXiv:2004.10934. [Google Scholar] [CrossRef]
- Yun, S.; Han, D.; Oh, S.J.; Chun, S.; Choe, J.; Yoo, Y. CutMix: Regularization Strategy to Train Strong Classifiers with Localizable Features. arXiv 2019, arXiv:1905.04899. [Google Scholar] [CrossRef]
- Rezatofighi, H.; Tsoi, N.; Gwak, J.; Sadeghian, A.; Reid, I.; Savarese, S. Generalized Intersection over Union: A Metric and A Loss for Bounding Box Regression. arXiv 2019, arXiv:1902.09630. [Google Scholar]
- Hu, J.; Shen, L.; Albanie, S.; Sun, G.; Wu, E. Squeeze-and-Excitation Networks. arXiv 2017, arXiv:1709.01507. [Google Scholar] [CrossRef]
- Wang, Q.; Wu, B.; Zhu, P.; Li, P.; Zuo, W.; Hu, Q. ECA-Net: Efficient Channel Attention for Deep Convolutional Neural Networks. arXiv 2019, arXiv:1910.03151. [Google Scholar] [CrossRef]
- Woo, S.; Park, J.; Lee, J.-Y.; Kweon, I.S. CBAM: Convolutional Block Attention Module. arXiv 2018, arXiv:1807.06521. [Google Scholar] [CrossRef]
- Hou, Q.; Zhou, D.; Feng, J. Coordinate Attention for Efficient Mobile Network Design. arXiv 2021, arXiv:2103.02907. [Google Scholar] [CrossRef]
- He, K.; Zhang, X.; Ren, S.; Sun, J. Deep Residual Learning for Image Recognition. arXiv 2015, arXiv:1512.03385. [Google Scholar] [CrossRef]
- Hacıefendioğlu, K.; Başağa, H.B. Concrete road crack detection using deep learning-based faster R-CNN method. Iran. J. Sci. Technol. Trans. Civ. Eng. 2022, 46, 1621–1633. [Google Scholar] [CrossRef]
- Jiang, Y.; Pang, D.; Li, C.; Yu, Y.; Cao, Y. Two-step deep learning approach for pavement crack damage detection and segmentation. Int. J. Pavement Eng. 2022. [Google Scholar] [CrossRef]
- Nie, M.; Wang, C. Pavement Crack Detection based on yolo v3. In Proceedings of the 2019 2nd International Conference on Safety Produce Informatization (IICSPI); IEEE: New York, NY, USA, 2019. [Google Scholar]


| Indicator | Value |
|---|---|
| GPU | Nvidia GeForce RTX 3070 |
| CPU | Intel Core i7-10700 |
| CUDA | 11.3 |
| CUDANN | 8.4.1 |
| Pytorch | 1.10.1 |
| Indicator | Value |
|---|---|
| Image resolution | 1920 × 1080 |
| Scan FOV | 90° |
| Working temperature | –30 °C~60 °C |
| Working voltage | DC 9~18 V |
| Frequency | ≥10 Hz |
| Categories | Longitudinal Crack | Transverse Crack | Alligator Crack | Pothole |
|---|---|---|---|---|
| Number of instances | 4070 (42.17%) | 1202 (12.46%) | 3144 (32.58%) | 1234 (12.79%) |
| Ground Truths | Predicted | |
|---|---|---|
| True Detection Result | False Detection Result | |
| True detection result | TP | FN |
| False detection result | FP | TN |
| Methods | Precision | Recall | F1 | Map |
|---|---|---|---|---|
| YOLOV5s | 90.91% | 85.59% | 88.17% | 90.71% |
| YOLOV5s-SE | 93.21% | 82.41% | 87.47% | 90.57% |
| YOLOV5s-ECA | 94.76% | 83.21% | 88.61% | 91.07% |
| YOLOV5s-CBAM | 94.58% | 80.60% | 87.03% | 89.40% |
| YOLOV5s-CoordAtt | 95.27% | 83.45% | 88.96% | 91.81% |
| Methods | Precision | Recall | F1 | Map-0.5 |
|---|---|---|---|---|
| YOLOV5s | 74.9% | 61.4% | 67.4% | 67.1% |
| YOLOV5s-SE | 76.9% | 49% | 59.9% | 68.4% |
| YOLOV5s-ECA | 74.7% | 52.1% | 61.4% | 59.9% |
| YOLOV5s-CBAM | 72.8% | 52.3% | 60.8% | 68.7% |
| YOLOV5s-CoordAtt | 77.8% | 49.5% | 60.5% | 71.4% |
| YOLOV3 [38] | 76.5% | 65.2% | 70.4% | 70.3% |
| FasteRCNN [36] | 74.2% | 51.7% | 60.9% | 59.2% |
| YOLOV4 [37] | 71.5% | 66.2% | 68.7% | 52.7% |
Publisher’s Note: MDPI stays neutral with regard to jurisdictional claims in published maps and institutional affiliations. |
© 2022 by the authors. Licensee MDPI, Basel, Switzerland. This article is an open access article distributed under the terms and conditions of the Creative Commons Attribution (CC BY) license (https://creativecommons.org/licenses/by/4.0/).
Share and Cite
Ren, J.; Zhao, G.; Ma, Y.; Zhao, D.; Liu, T.; Yan, J. Automatic Pavement Crack Detection Fusing Attention Mechanism. Electronics 2022, 11, 3622. https://doi.org/10.3390/electronics11213622
Ren J, Zhao G, Ma Y, Zhao D, Liu T, Yan J. Automatic Pavement Crack Detection Fusing Attention Mechanism. Electronics. 2022; 11(21):3622. https://doi.org/10.3390/electronics11213622
Chicago/Turabian StyleRen, Junhua, Guowu Zhao, Yadong Ma, De Zhao, Tao Liu, and Jun Yan. 2022. "Automatic Pavement Crack Detection Fusing Attention Mechanism" Electronics 11, no. 21: 3622. https://doi.org/10.3390/electronics11213622
APA StyleRen, J., Zhao, G., Ma, Y., Zhao, D., Liu, T., & Yan, J. (2022). Automatic Pavement Crack Detection Fusing Attention Mechanism. Electronics, 11(21), 3622. https://doi.org/10.3390/electronics11213622