
SIFT-Flow-Based Virtual Sample Generation for Single-Sample Finger Vein Recognition


Abstract
1. Introduction
- Network-based methods: These methods need to segment vein patterns first and then extract features according to the vein patterns. Related methods mainly include: repeated line tracking (RLT) [5], maximum curvature points (MaxiC) [6,7], mean curvature (MeanC) [8], region growth [9], the anatomy structure analysis-based method [10] (ASAVE), and so on.
- Local descriptor-based methods: These methods do not require segment vein patterns but directly apply local descriptors to images. Related methods mainly include: local binary pattern (LBP) [11,12], local line binary pattern (LLBP) [13,14], local directional code (LDC) [15], discriminative binary codes (DBC) [16], anchor-based manifold binary pattern (AMBP) [17], and so on.
- Dimensionality reduction-based methods: These methods have achieved good results in the field of face recognition, so researchers introduced it into finger vein recognition. Commonly used dimensionality reduction techniques include: principal component analysis (PCA) [18], linear discriminant analysis (LDA) [19], two-dimensional principal component analysis ((2D) PCA) [20,21], and so on. For these methods, multiple images are needed to train the transformation matrix.
- Deep learning-based methods: Deep learning has been applied to various research fields because of its powerful feature representation ability. Recently, the deep learning-based methods have also achieved remarkable results in the field of finger vein recognition [22,23,24]. Such methods also require multiple images to participate in training.
2. Related Work
3. The Proposed Method
3.1. SIFT-Flow Algorithm
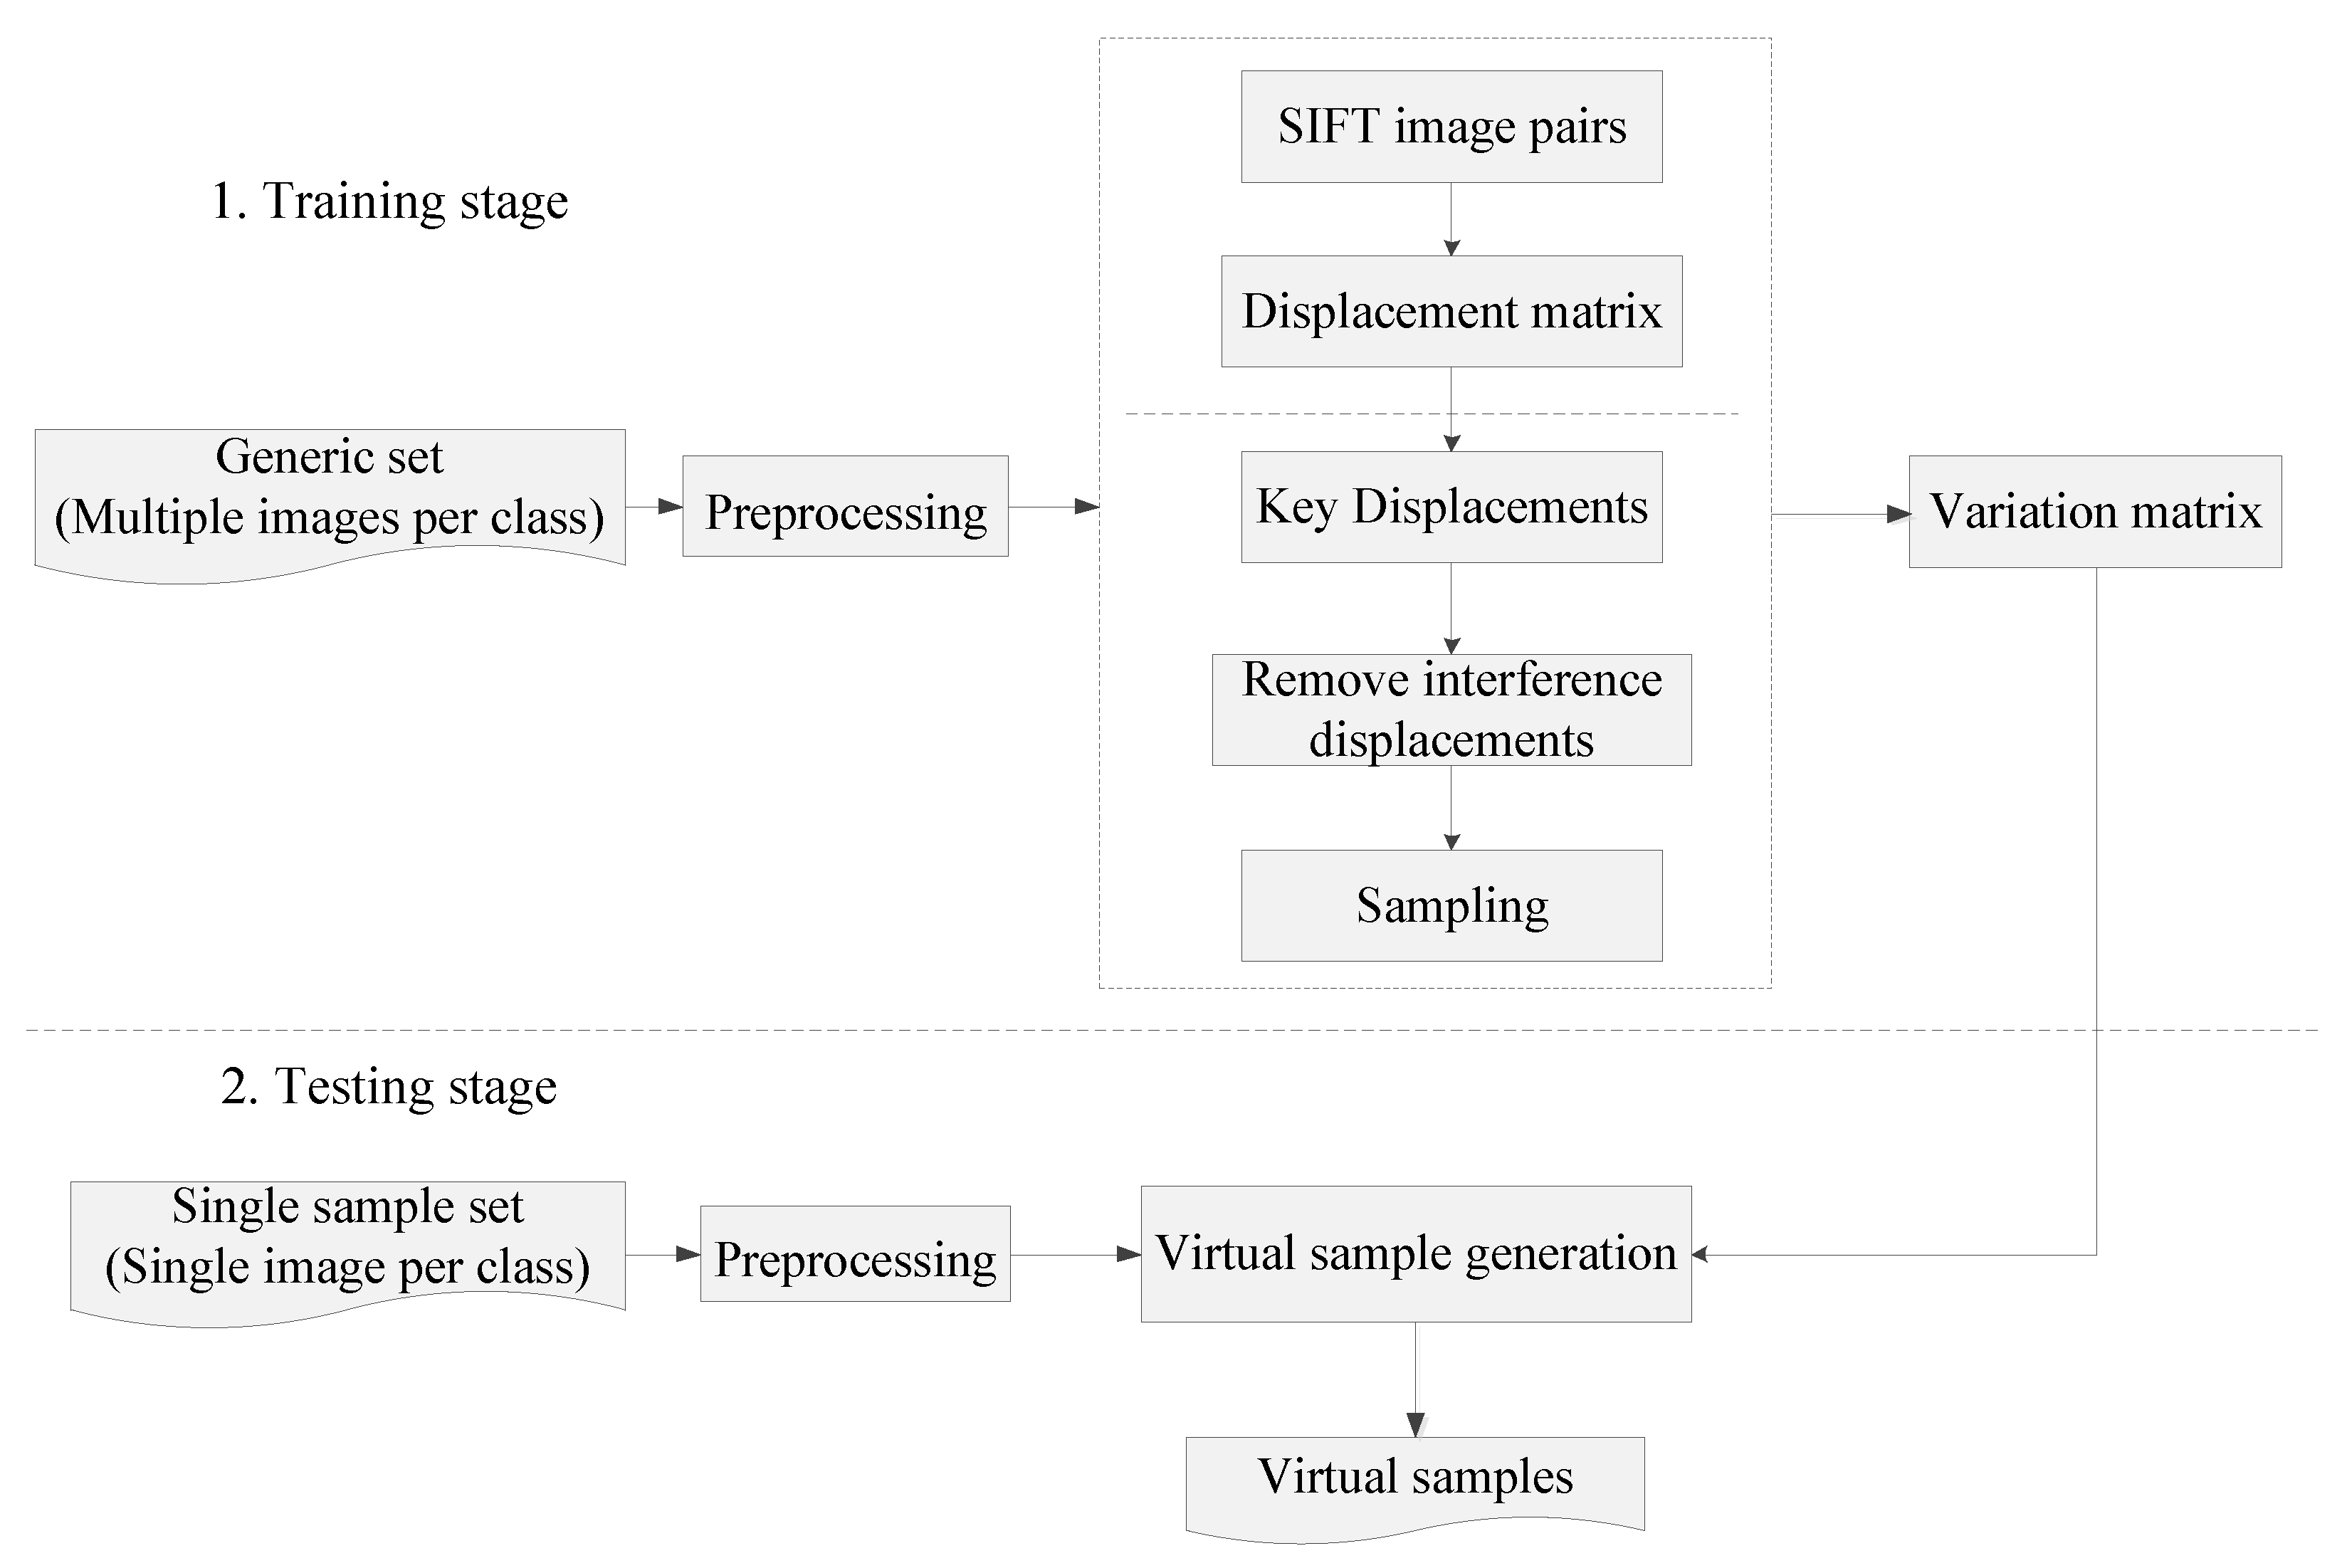
3.2. SIFT-Flow-Based Virtual Sample Generation (SVSG)
3.2.1. Preprocessing
3.2.2. Variation Matrix Learning
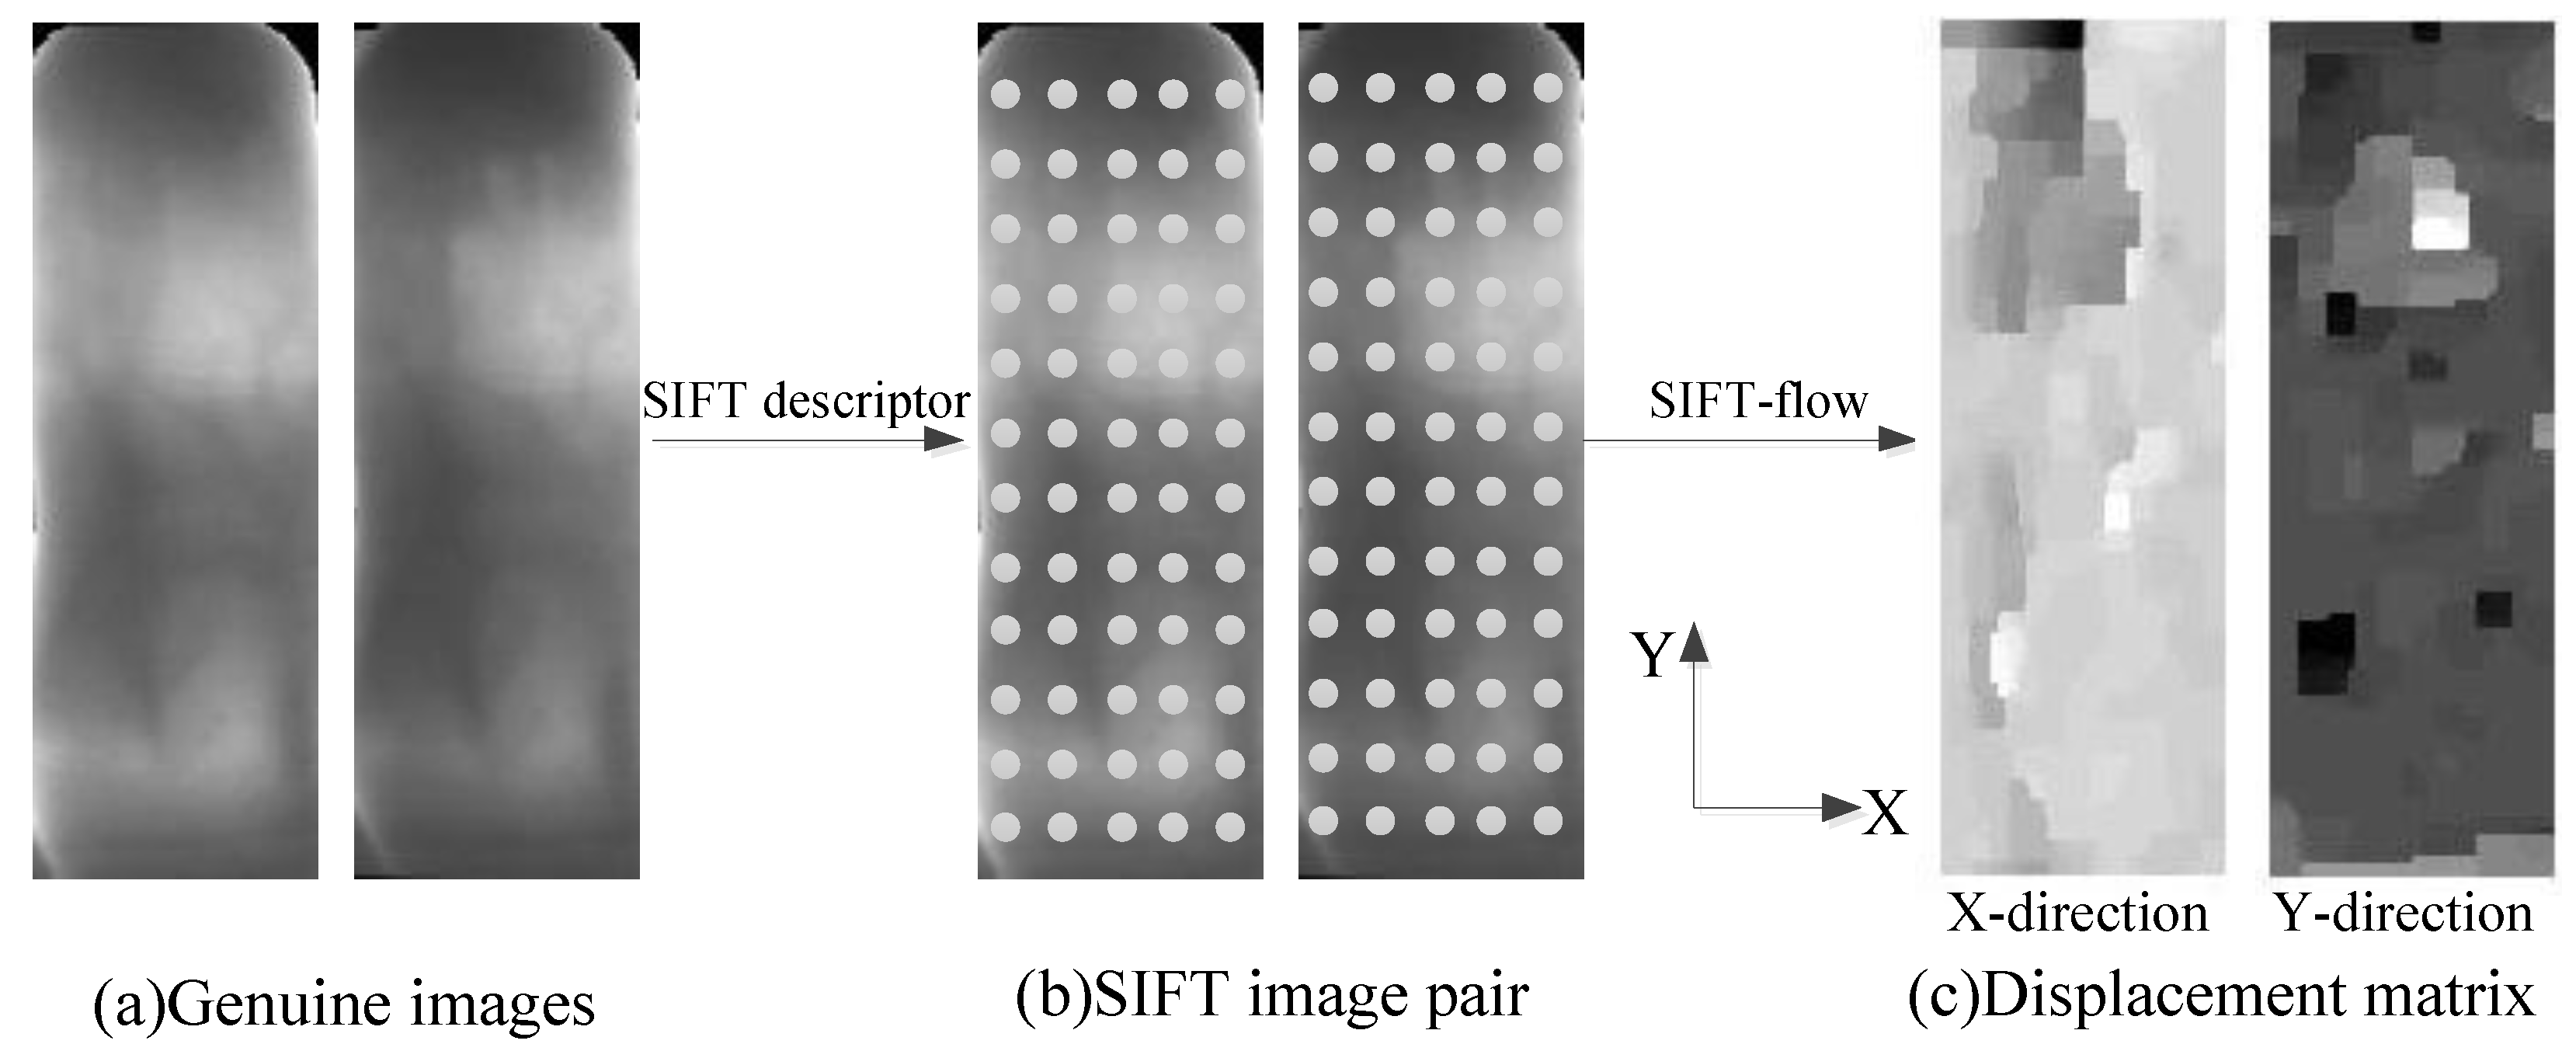
- Displacement matrix computation.As mentioned above, the calculation of the displacement matrix is based on the SIFT image pair, so we need to construct the SIFT image pair. In order to ensure that the displacement matrix can cover all displacements within the class, all images are required to participate in forming image pairs. Specifically, for a particular class w, the displacement matrix is calculated as follows:
- (1)
- Construct SIFT image pairs.For each image within the class w, we obtain the SIFT image using the SIFT descriptor, where the jth SIFT image is represented as . Then, taking the first SIFT image as the benchmark, the remaining other SIFT images form SIFT image pairs with it: for example, the pair is formed by the first SIFT image and the SIFT image.
- (2)
- Calculate displacement matrix.In this step, the SIFT-flow algorithm is used to obtain the displacement matrix of each SIFT image pair, which is given as follows:where each matrix consists of displacements in both the X-direction and the Y-direction.
- 2.
- Global variation matrix computation.Herein, we introduce the steps to obtain the global variation matrix. First, we obtain the key displacement of each displacement matrix and then remove the interference displacement. Finally, the variation matrix is sampled to reduce redundancy.
- (1)
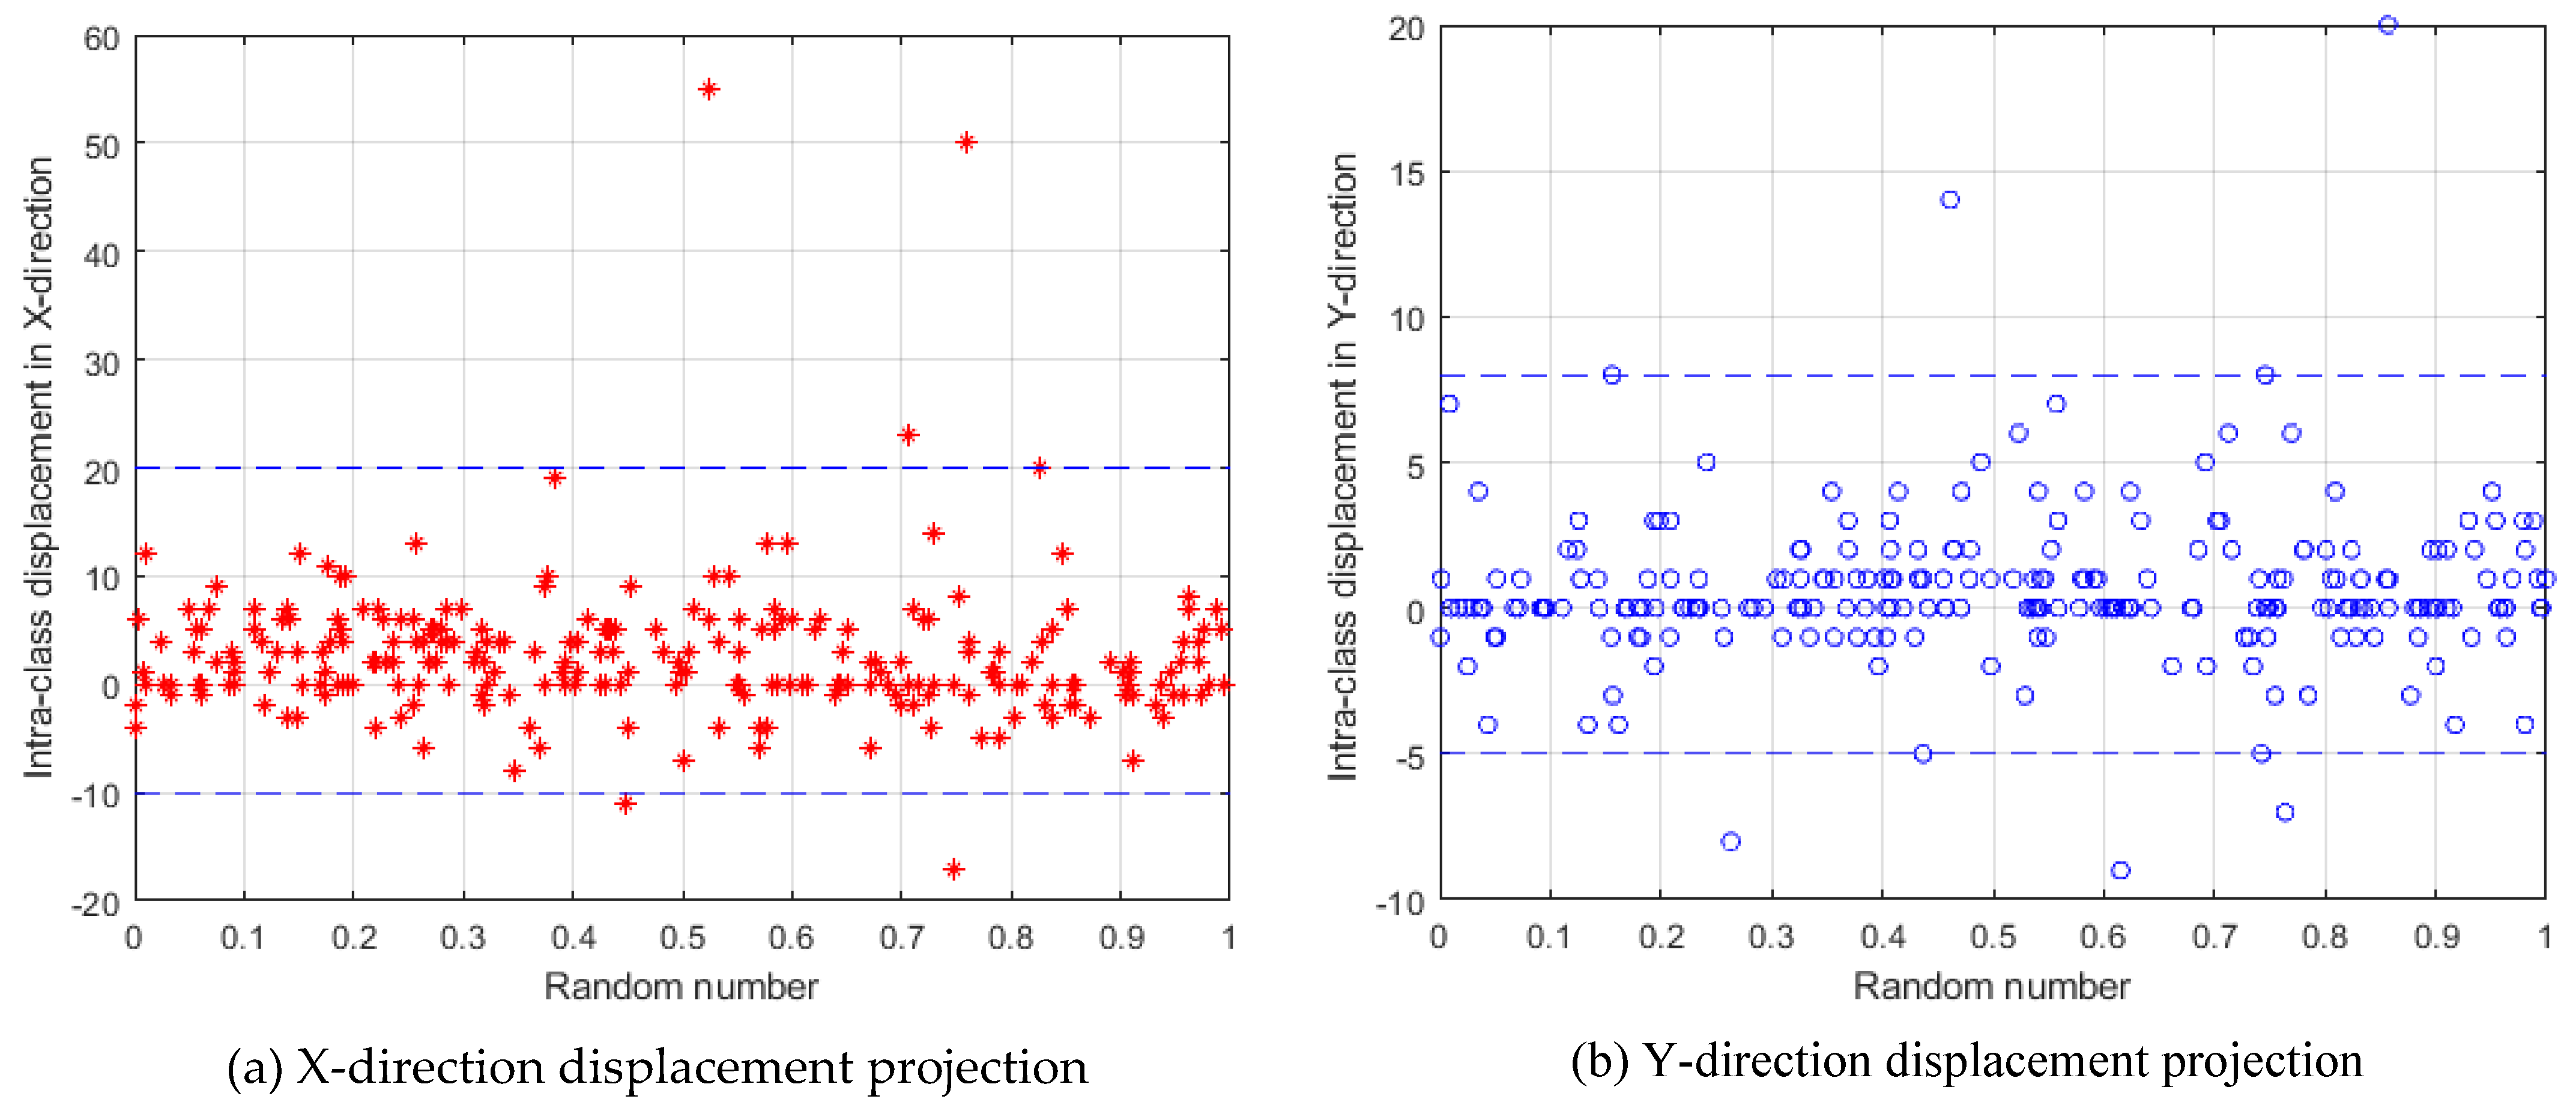
- Obtain key displacements.Meng et al. [37] pointed out that in finger vein recognition, the displacements of different pixels in two images from the same finger are similar, and Figure 3c also proves this statement. So, we can use the displacement with the most occurrences as the key displacement between two images. First, the frequency of each displacement for the displacement matrix is counted. The displacement with the largest frequency is used as the key displacement of the matrix, and all key displacements are combined into a variation matrix of class w which can be calculated as:where denotes the frequency of all displacements in the displacement matrix , and denotes the maximum frequency. Equation f gives the displacement with a certain frequency. We calculate the key displacements of all classes in the generic set to form a temporary variation matrix .
- (2)
- Remove interference displacements.There are two kinds of interference displacements considered in this paper. The first is the displacement with too large value and small frequency, which is also quite different from the adjacent value. These displacements are caused by occasional large movements of a finger during acquisition and are not universal. If these displacements are used to generate virtual samples, they are likely to adversely affect recognition. The second is that the displacement value is 0 or too small, and these displacements indicate that there is almost no difference between the two images. If such displacements were used to generate virtual samples, they would not be helpful for identification but would create data redundancy. Therefore, we remove the above two displacements.
- (3)
- Sampling.The existing temporary variation matrix is displacement-intensive. For example, there will be displacements with value x and x+1 at the same time, and the virtual samples generated by these two adjacent displacements have almost the same contribution to recognition. In order to avoid data redundancy, for adjacent displacements, we just keep one. Therefore, we sample the remaining matrix according to the step size and use the remaining matrix as the final global variation matrix , where has two components, representing the displacement in the X-direction and Y-direction.
| Algorithm 1: Learning variation matrix. |
| Inputs: The preprocessed finger vein images on the generic set Outputs: Variation matrix V Algorithm: 1. Initialize V = [], Vtmp = [], i = 1, j = 2 2. While i ≤ n do \\ n is the number of classes of generic set 3. Get SIFT image of first image of class i 4. While j ≤ m do \\ m is the number of samples per class 5. Obtain SIFT image pairs 6. Calculate displacement matrix using Equation (4) 7. End while 8. Get key displacements of class i 9. End while 10. Key displacements of all classes form a temporary matrix Vtmp 11. Remove interference displacement of Vtmp 12. Sampling Vtmp 13. The remainder of forms the global variation matrix V 14. Return V |
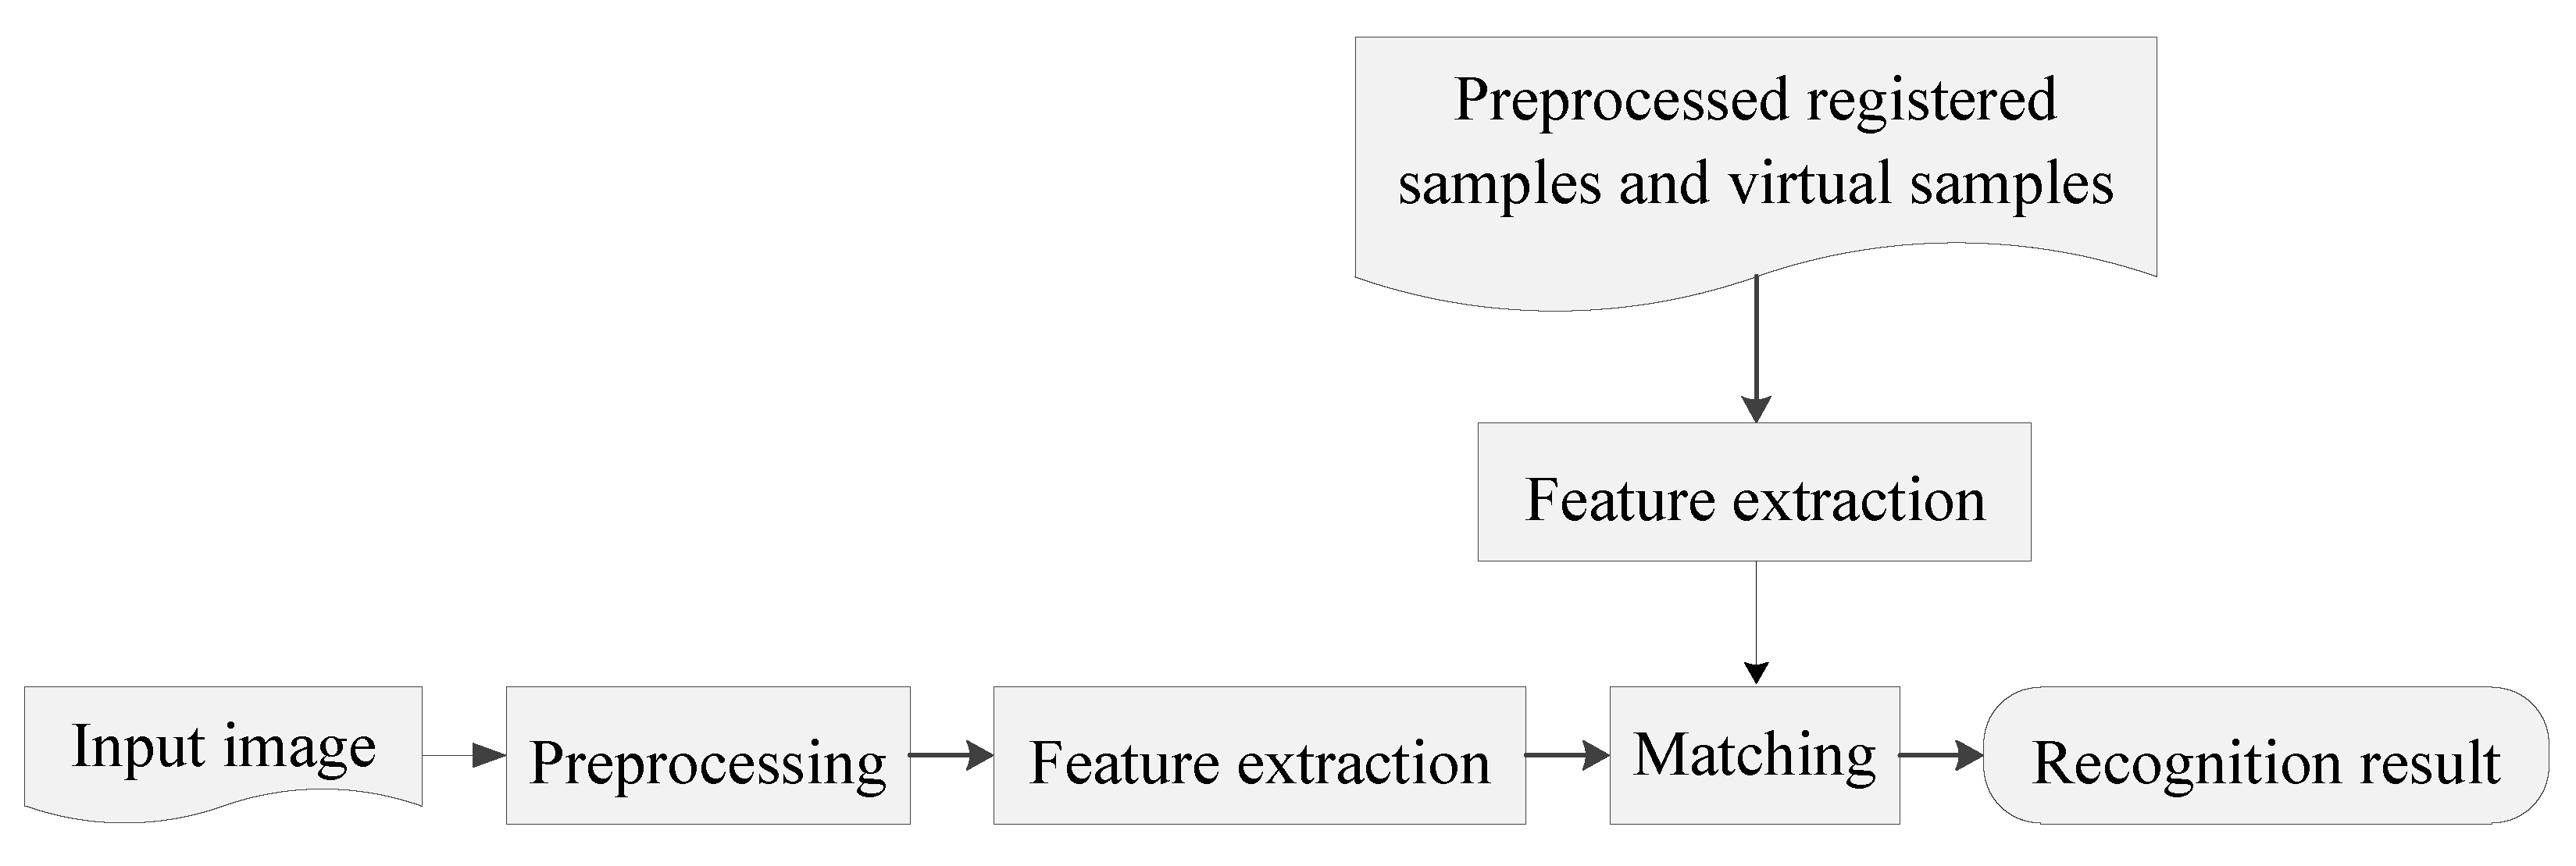
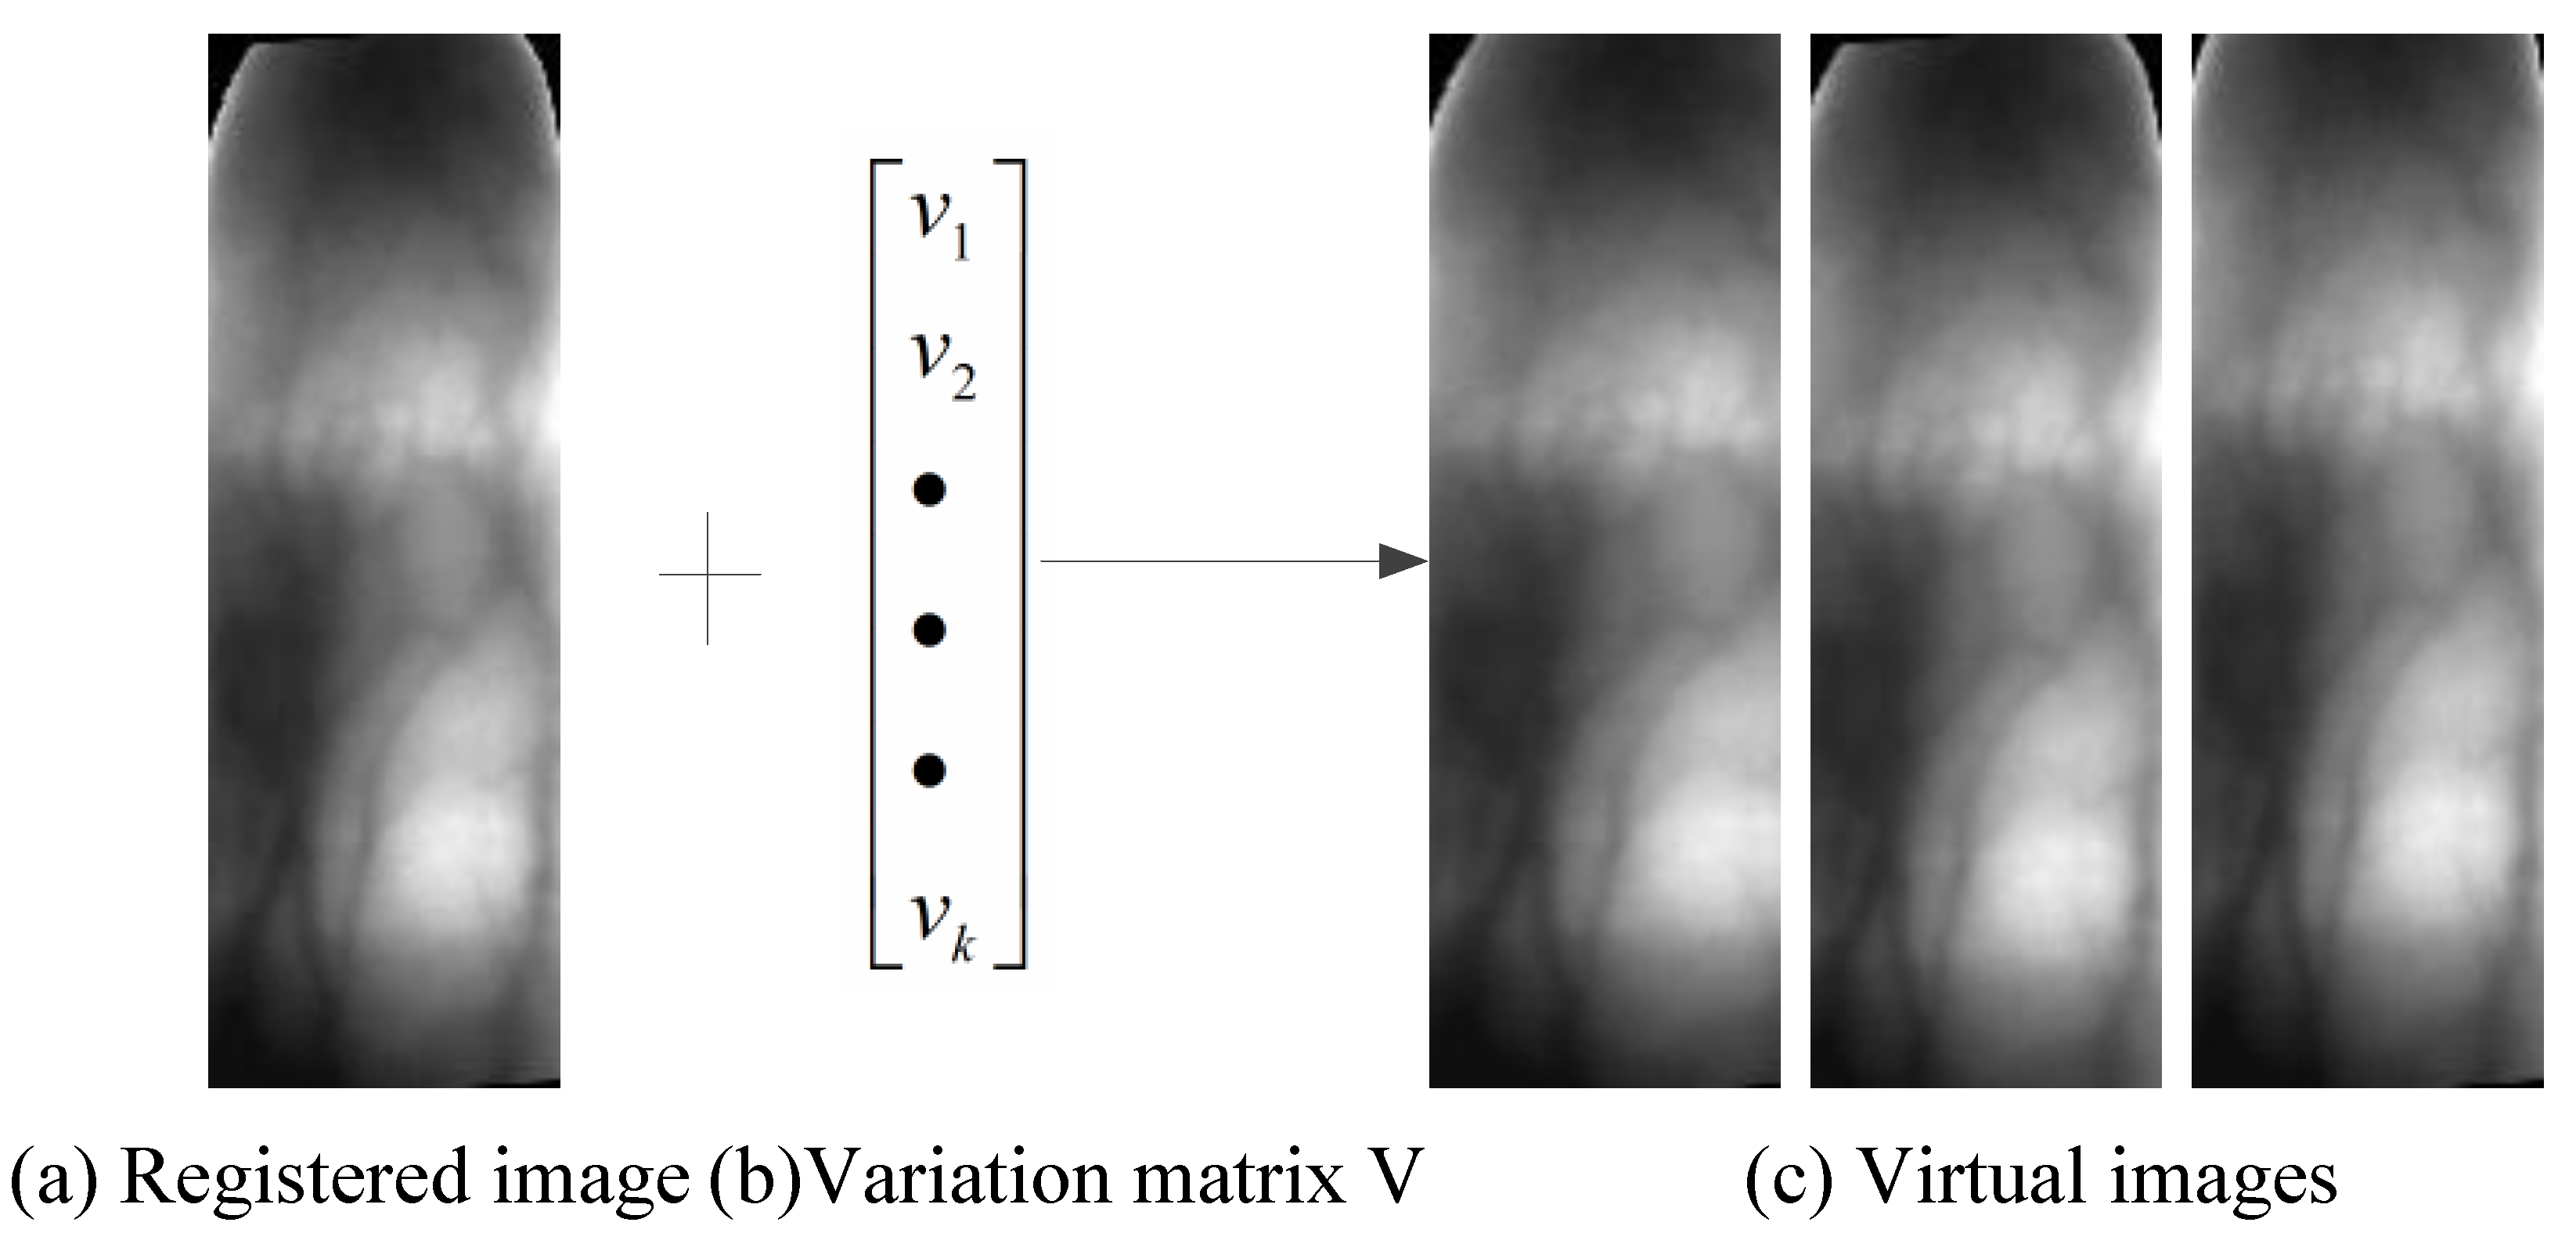
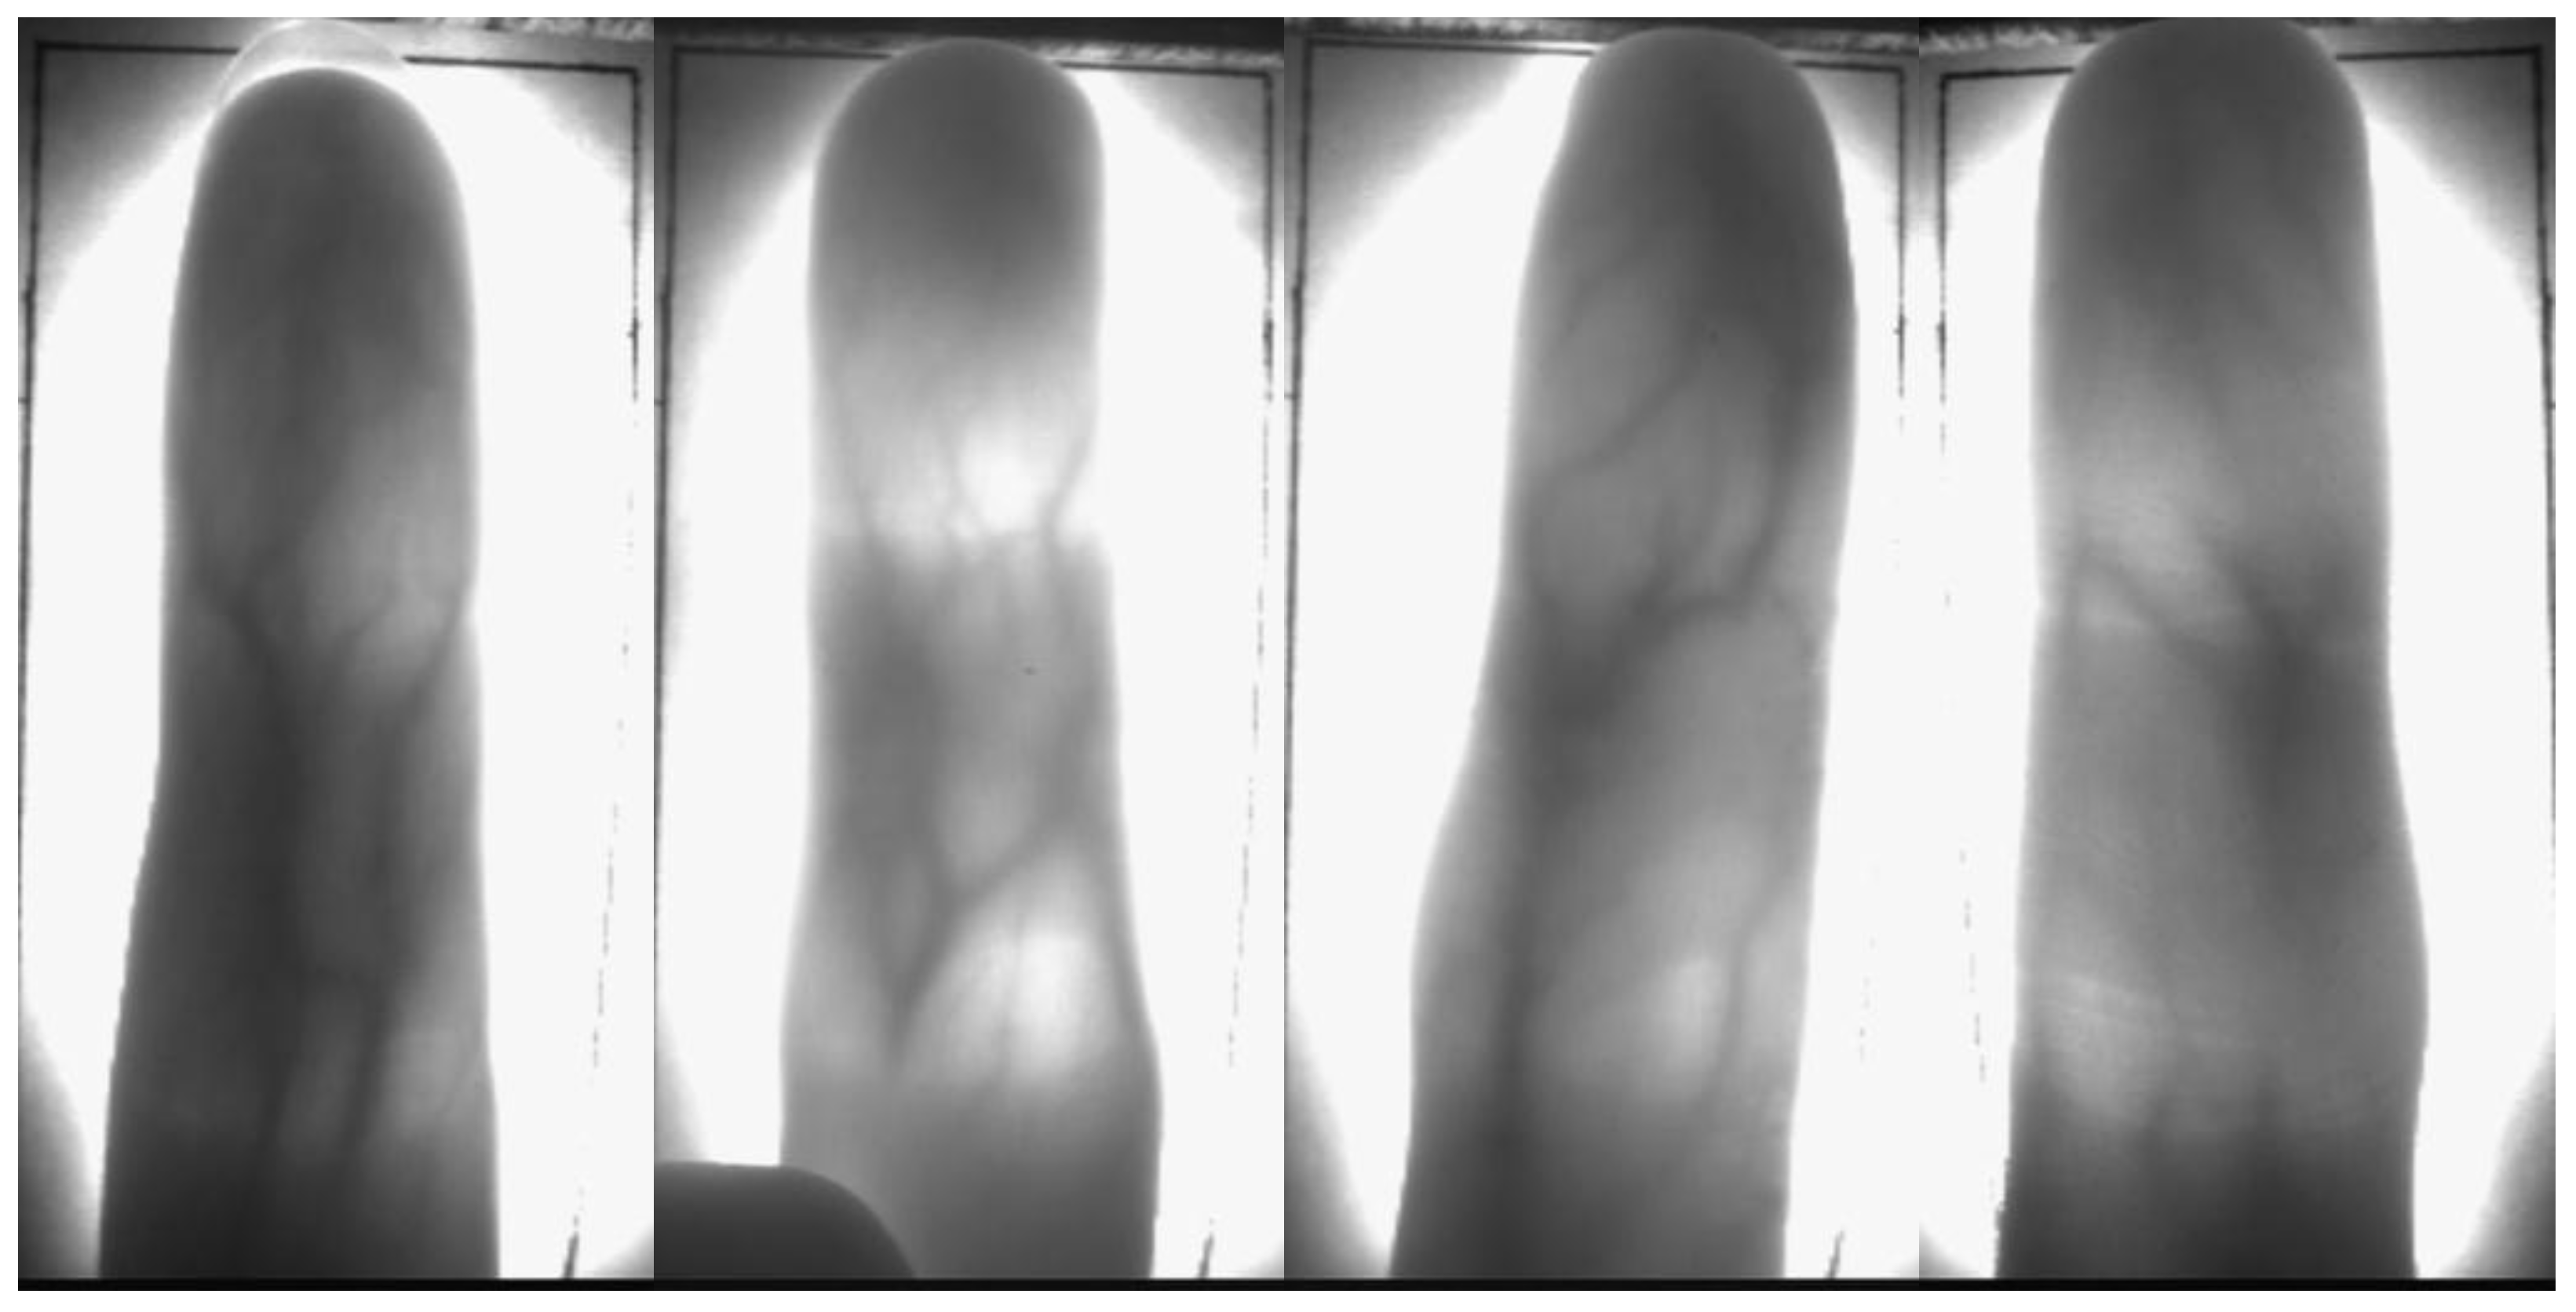
3.2.3. Virtual Sample Generation
4. Experiments
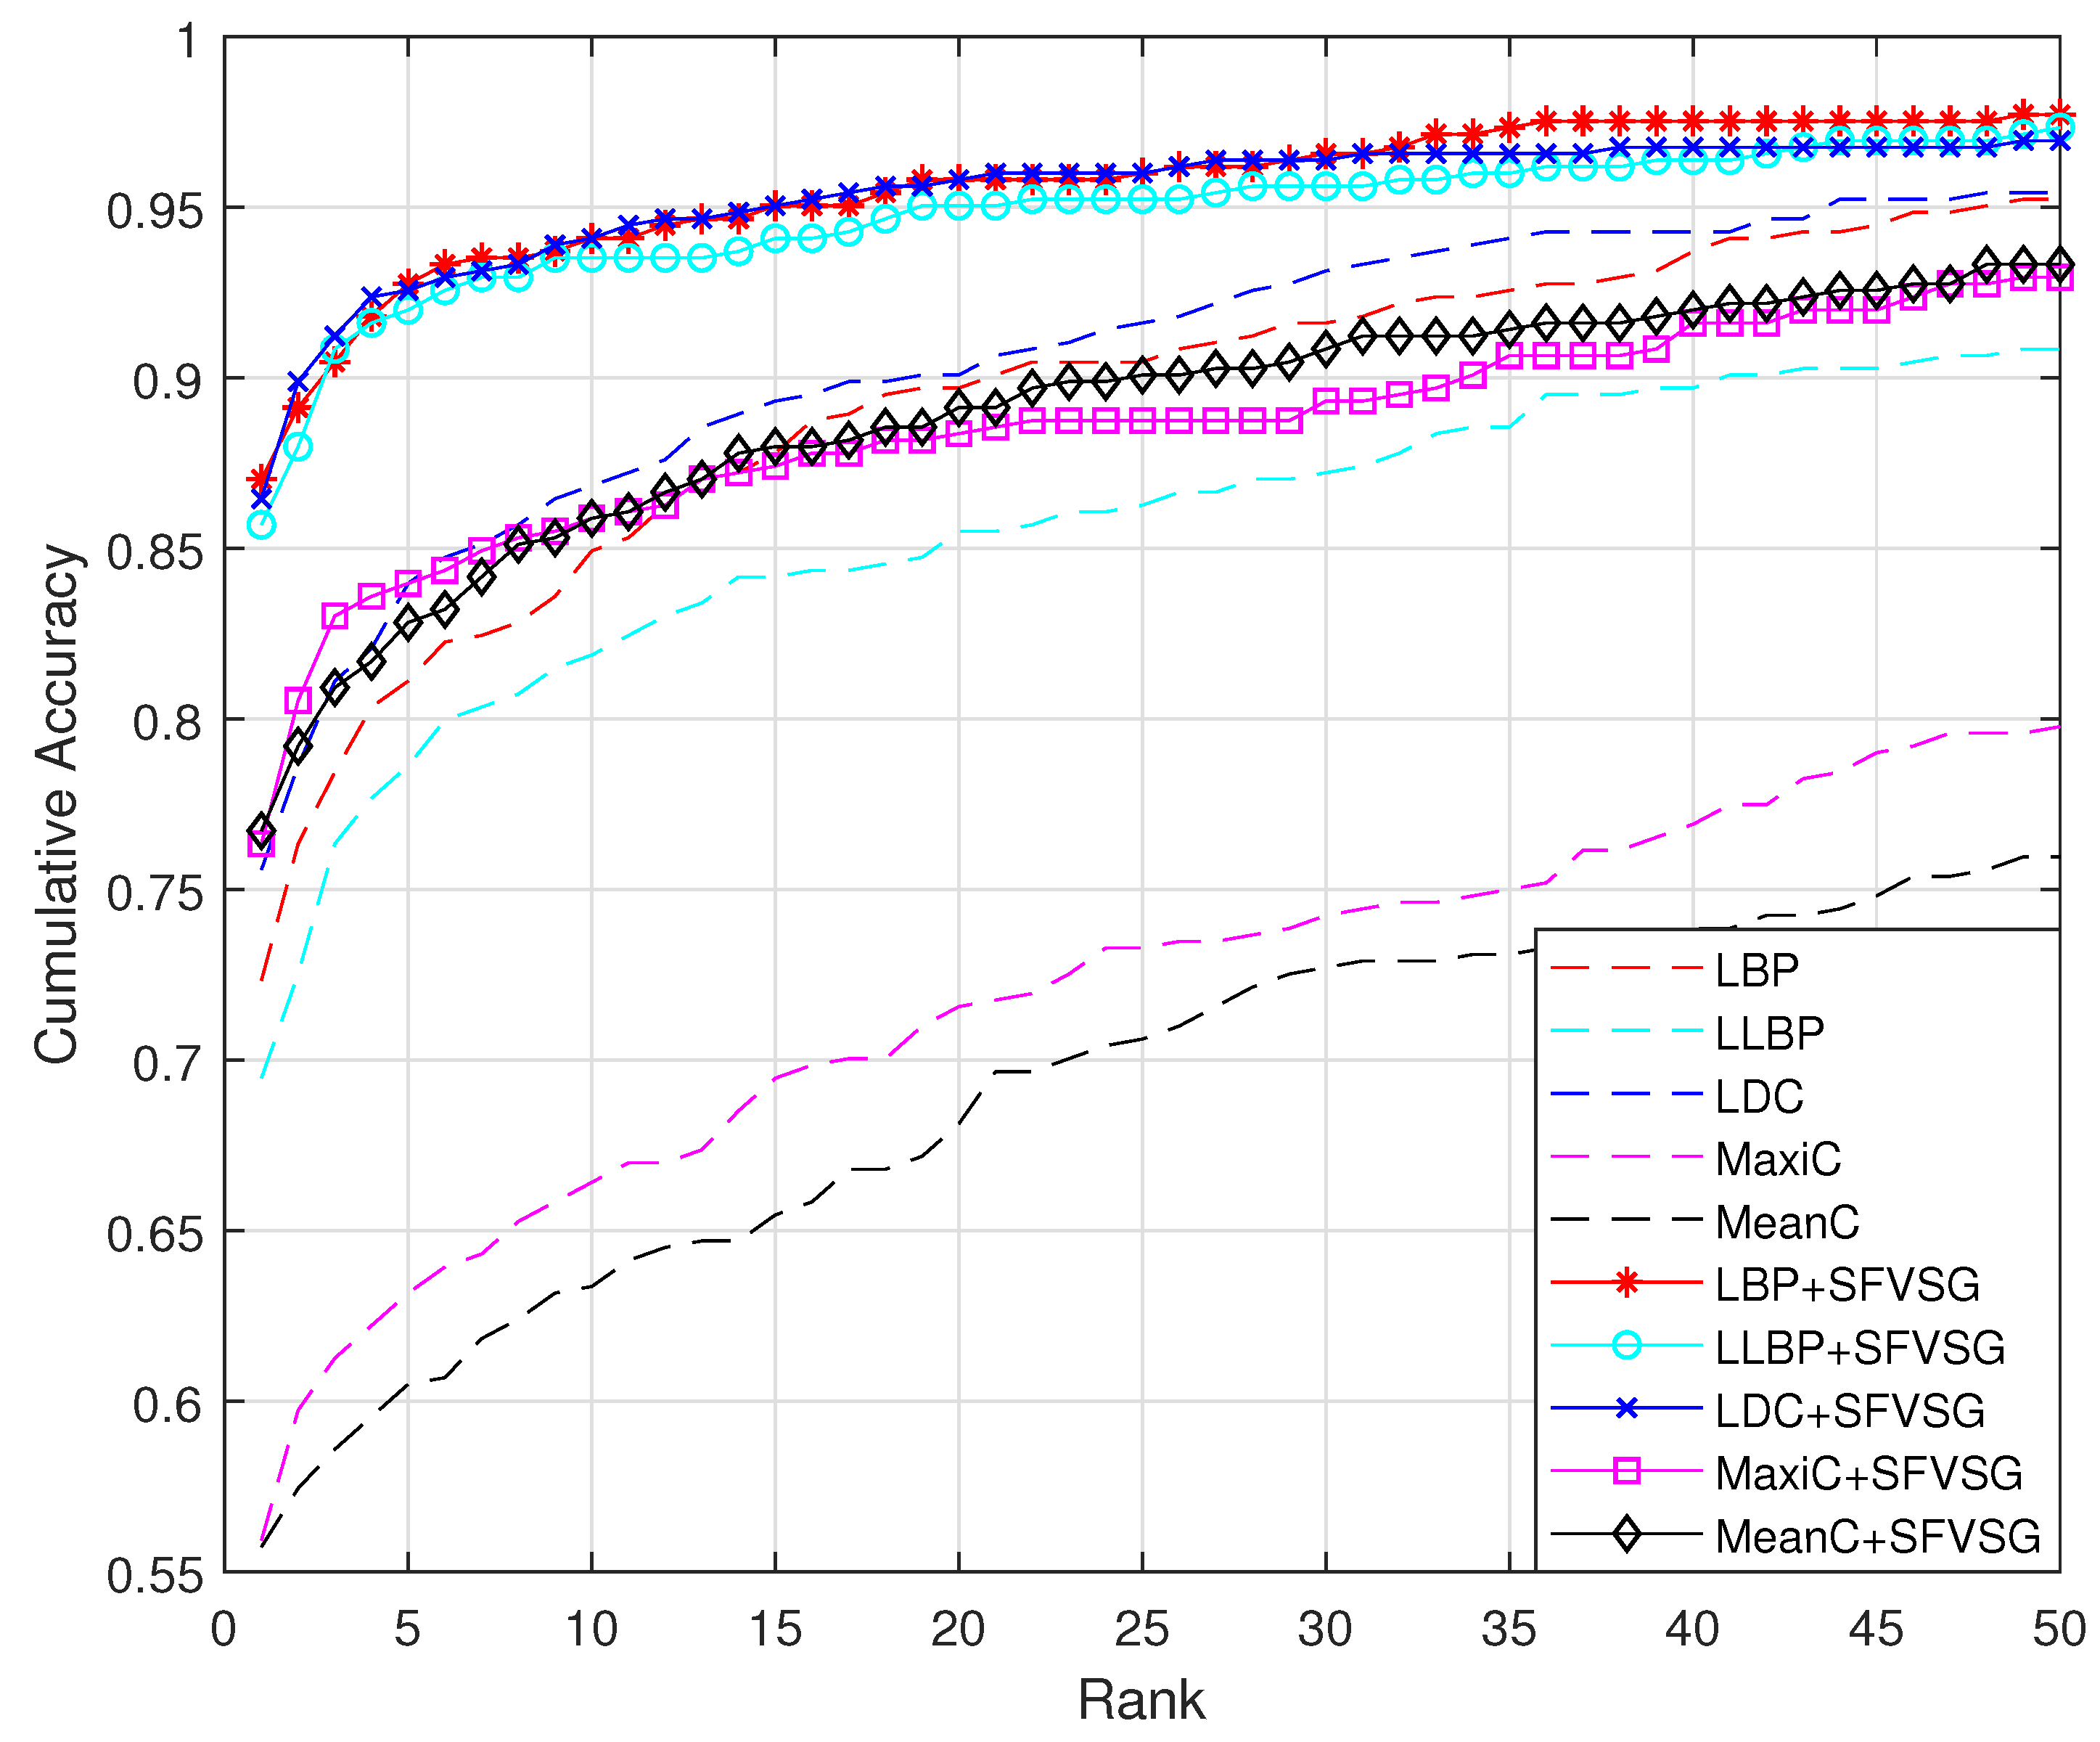
4.1. Experiment 1: Effectiveness of SVSG
4.2. Experiment 2: Complementarity of Virtual Samples
4.3. Experiment 3: Interference Displacement Analysis
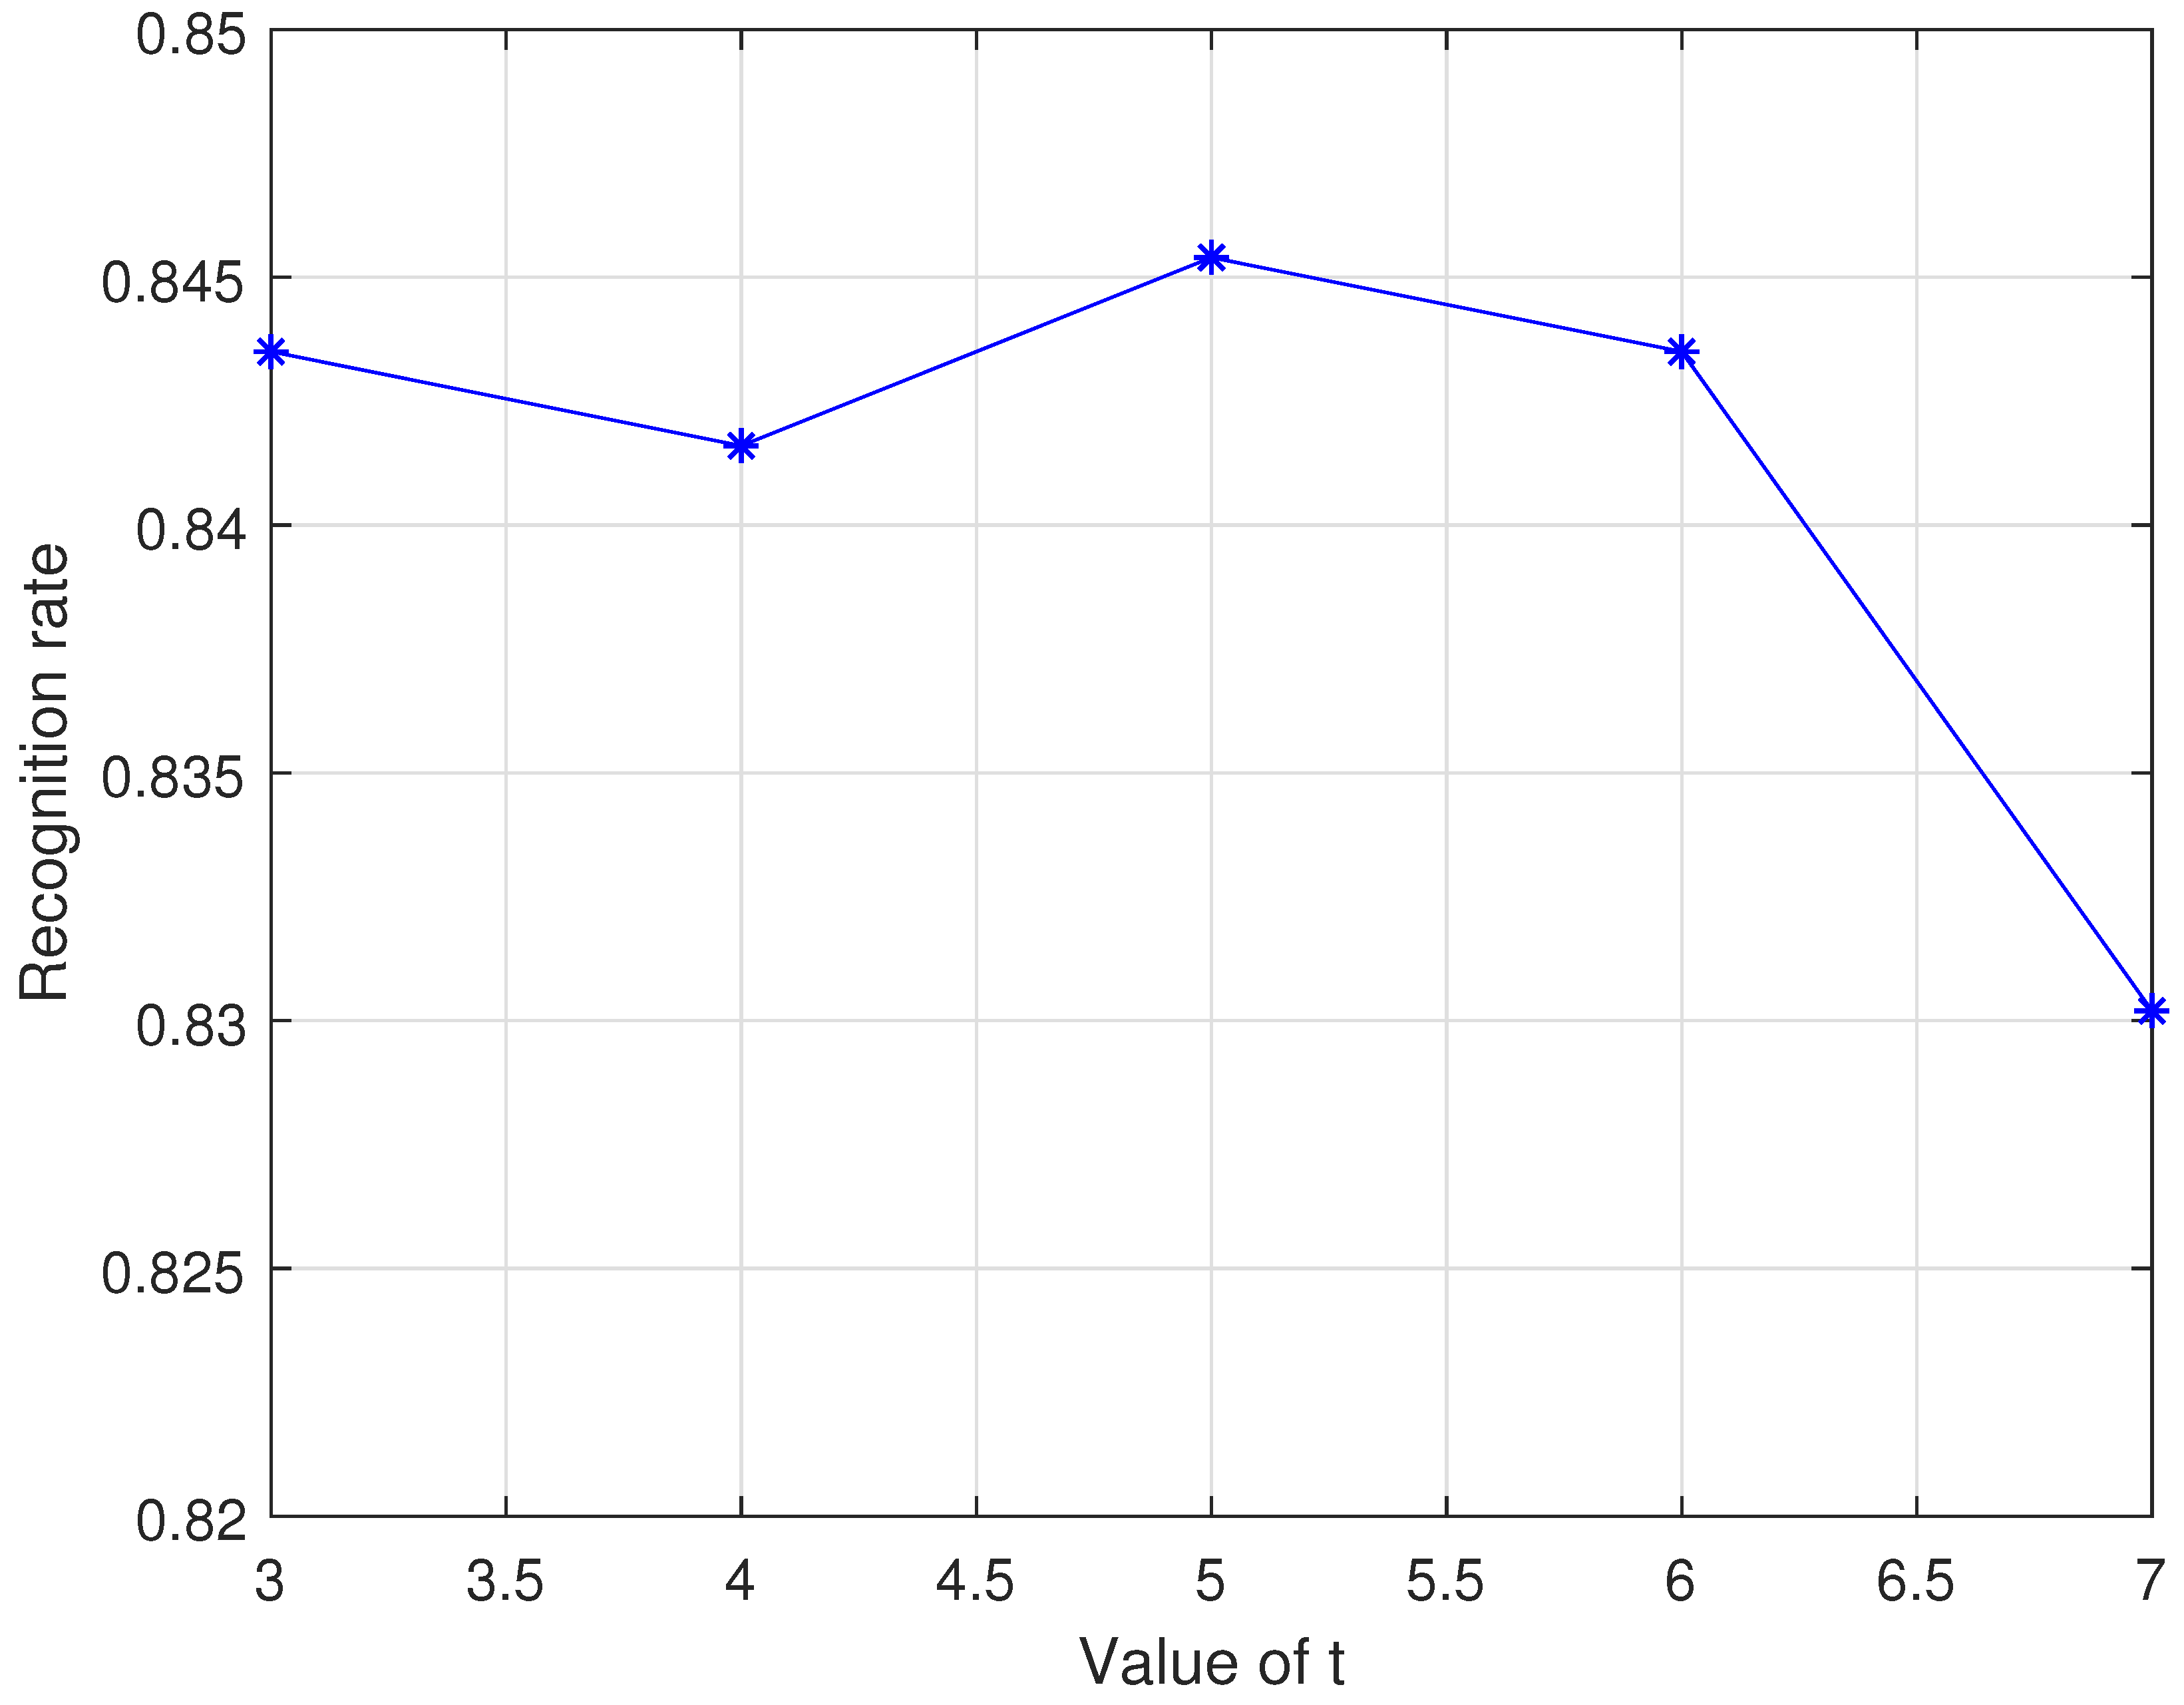
4.4. Experiment 4: Sampling Step Size
5. Conclusions
Author Contributions
Funding
Institutional Review Board Statement
Informed Consent Statement
Data Availability Statement
Acknowledgments
Conflicts of Interest
References
- Yanagawa, T.; Aoki, S.; Ohyama, T. Human Finger Vein Images Are Diverse and Its Patterns Are Useful For Personal Identification; Faculty of Mathematics, Kyushu University: Fukuoka, Japan, 2007. [Google Scholar]
- Shaheed, K.; Liu, H.; Yang, G.; Qureshi, I.; Gou, J.; Yin, Y. A systematic review of finger vein recognition techniques. Information 2018, 9, 213. [Google Scholar] [CrossRef]
- Liu, Z.; Yin, Y.; Wang, H.; Song, S.; Li, Q. Finger vein recognition with manifold learning. J. Netw. Comput. Appl. 2010, 33, 275–282. [Google Scholar] [CrossRef]
- Sidiropoulos, G.K.; Kiratsa, P.; Chatzipetrou, P.; Papakostas, G.A. Feature Extraction for Finger-Vein-Based Identity Recognition. J. Imaging 2021, 7, 89. [Google Scholar] [CrossRef]
- Miura, N.; Nagasaka, A.; Miyatake, T. Feature extraction of finger-vein patterns based on repeated line tracking and its application to personal identification. Mach. Vis. Appl. 2004, 15, 194–203. [Google Scholar] [CrossRef]
- Miura, N.; Nagasaka, A.; Miyatake, T. Extraction of finger-vein patterns using maximum curvature points in image profiles. IEICE Trans. Inf. Syst. 2007, 90, 1185–1194. [Google Scholar] [CrossRef]
- Roza, W.A.; Kassim, J.M.; Abdullah, S.N.H.S. Finger vein recognition using straight line approximation based on ensemble learning. Int. J. Adv. Comput. Sci. Appl. 2019, 10, 1. [Google Scholar]
- Song, W.; Kim, T.; Kim, H.C.; Choi, J.H.; Kong, H.J.; Lee, S.R. A finger-vein verification system using mean curvature. J. Pattern Recognit. Lett. 2011, 32, 1541–1547. [Google Scholar] [CrossRef]
- Qin, H.; Qin, L.; Yu, C. Region growth-based feature extraction method for finger-vein recognition. Opt. Eng. 2011, 50, 057208. [Google Scholar] [CrossRef]
- Yang, L.; Yang, G.; Yin, Y.; Xi, X. Finger vein recognition with anatomy structure analysis. IEEE Trans. Circuits Syst. Video Technol. 2017, 28, 1892–1905. [Google Scholar] [CrossRef]
- Lee, E.C.; Jung, H.; Kim, D. New finger biometric method using near infrared imaging. Sensors 2011, 11, 2319–2333. [Google Scholar] [CrossRef] [PubMed]
- Su, K.; Yang, G.; Wu, B.; Yang, L.; Li, D.; Su, P.; Yin, Y. Human identification using finger vein and ECG signals. Neurocomputing 2019, 332, 111–118. [Google Scholar] [CrossRef]
- Rosdi, B.A.; Shing, C.W.; Suandi, S.A. Finger vein recognition using local line binary pattern. Sensors 2011, 11, 11357–11371. [Google Scholar] [CrossRef] [PubMed]
- Liu, H.; Song, L.; Yang, G.; Yang, L.; Yin, Y. Customized local line binary pattern method for finger vein recognition. In Chinese Conference on Biometric Recognition; Springer: Cham, Switzerland, 2017; pp. 314–323. [Google Scholar]
- Meng, X.; Yang, G.; Yin, Y.; Xiao, R. Finger vein recognition based on local directional code. Sensors 2012, 12, 14937–14952. [Google Scholar] [CrossRef]
- Xi, X.; Yang, L.; Yin, Y. Learning discriminative binary codes for finger vein recognition. Pattern Recognition. 2017, 66, 26–33. [Google Scholar] [CrossRef]
- Liu, H.; Yang, G.; Yang, L.; Su, K.; Yin, Y. Anchor-based manifold binary pattern for finger vein recognition. Sci. China Inf. Sci. 2019, 62, 1–16. [Google Scholar] [CrossRef] [PubMed]
- Wu, J.D.; Liu, C.T. Finger-vein pattern identification using principal component analysis and the neural network technique. Expert Syst. Appl. 2011, 38, 5423–5427. [Google Scholar] [CrossRef]
- Wu, J.D.; Liu, C.T. Finger-vein pattern identification using SVM and neural network technique. Expert Syst. Appl. 2011, 38, 14284–14289. [Google Scholar] [CrossRef]
- Yang, G.; Xi, X.; Yin, Y. Finger vein recognition based on (2D) 2 PCA and metric learning. J. Biomed. Biotechnol. 2012, 2012, 324249. [Google Scholar] [CrossRef]
- Hu, N.; Ma, H.; Zhan, T. Finger vein biometric verification using block multi-scale uniform local binary pattern features and block two-directional two-dimension principal component analysis. Optik. 2020, 208, 163664. [Google Scholar] [CrossRef]
- Radzi, S.A.; Hani, M.K.; Bakhteri, R. Finger-vein biometric identification using convolutional neural network. Turk. J. Electr. Eng. Comput. Sci. 2016, 24, 1863–1878. [Google Scholar] [CrossRef]
- Das, R.; Piciucco, E.; Maiorana, E.; Campisi, P. Convolutional neural network for finger-vein-based biometric identification. IEEE Trans. Inf. Forensics Secur. 2018, 14, 360–373. [Google Scholar] [CrossRef]
- Yang, W.; Hui, C.; Chen, Z.; Xue, J.H.; Liao, Q. FV-GAN: Finger vein representation using generative adversarial networks. IEEE Trans. Inf. Forensics Secur. 2019, 14, 2512–2524. [Google Scholar] [CrossRef]
- Liu, C.; Yuen, J.; Torralba, A.; Sivic, J.; Freeman, W.T. Sift flow: Dense correspondence across different scenes. In Proceedings of the European Conference on Computer Vision, Marseille, France, 12–18 October 2008; pp. 28–42. [Google Scholar]
- Liu, C.; Yuen, J.; Torralba, A. Sift flow: Dense correspondence across scenes and its applications. IEEE Trans. Pattern Anal. Mach. Intell. 2010, 33, 978–994. [Google Scholar] [CrossRef] [PubMed]
- Suni, S.S.; Gopakumar, K. Dense SIFT–Flow based Architecture for Recognizing Hand Gestures. Adv. Sci. Technol. Eng. Syst. J. ASTES 2020, 5, 944–954. [Google Scholar]
- Li, L.; Peng, Y.; Qiu, G.; Sun, Z.; Liu, S. A survey of virtual sample generation technology for face recognition. Artif. Intell. Rev. 2018, 50, 1–20. [Google Scholar] [CrossRef]
- Shan, S.; Cao, B.; Gao, W.; Zhao, D. Extended Fisherface for face recognition from a single example image per person. In Proceedings of the 2002 IEEE International Symposium on Circuits and Systems (Cat. No. 02CH37353), Phoenix-Scottsdale, AZ, USA, 26–29 May 2002. [Google Scholar]
- Zhang, D.; Chen, S.; Zhou, Z.H. A new face recognition method based on SVD perturbation for single example image per person. Appl. Math. Comput. 2005, 163, 895–907. [Google Scholar] [CrossRef]
- Wang, X.; Huang, W.; Qin, C.; Tian, L. Using weighted average face and symmetrical face to solve problem of single sample per person based on sparse representation. Appl. Res. Comput. 2015, 32, 1527–1531. [Google Scholar]
- Hu, F.; Zhang, M.; Zou, B.; Ma, J. Pose and Illumination Invariant Face Recognition Based on HMM with One Sample Per Person. Chin. J. Comput. 2009, 32, 1424–1433. [Google Scholar] [CrossRef]
- Xu, Y.; Zhang, Z.; Lu, G.; Yang, J. Approximately symmetrical face images for image preprocessing in face recognition and sparse representation based classification. Pattern Recognit. 2016, 54, 68–82. [Google Scholar] [CrossRef]
- Liu, C.; Qin, H.; Yang, G.; Shen, Z.; Wang, J. Ensemble Deep Learning Based Single Finger-Vein Recognition. In Proceedings of the International Conference on Cognitive Systems and Signal Processing, Suzhou, China, 20–21 November 2021; pp. 261–275. [Google Scholar]
- Lowe, D.G. Distinctive image features from scale-invariant keypoints. Int. J. Comput. Vis. 2004, 60, 91–110. [Google Scholar] [CrossRef]
- Yang, L.; Yang, G.; Yin, Y.; Xiao, R. Sliding window-based region of interest extraction for finger vein images. Sensors 2013, 13, 3799–3815. [Google Scholar] [CrossRef]
- Meng, X.; Xi, X.; Yang, G.; Yin, Y. Finger vein recognition based on deformation information. Sci. China Inf. Sci. 2018, 61, 1–15. [Google Scholar] [CrossRef]
- Maeland, E. On the comparison of interpolation methods. IEEE Trans. Med. Imaging 1988, 7, 213–217. [Google Scholar] [CrossRef] [PubMed]
- Parker, J.A.; Kenyon, R.V.; Troxel, D.E. Comparison of interpolating methods for image resampling. IEEE Trans. Med. Imaging 1983, 2, 31–39. [Google Scholar] [CrossRef] [PubMed]
- Kumar, A.; Zhou, Y. Human identification using finger images. IEEE Trans. Image Process. 2011, 21, 2228–2244. [Google Scholar] [CrossRef] [PubMed]


| Category | Method | Rank-One Recognition Rate |
|---|---|---|
| Local descriptor-based methods | LBP | 72.33% |
| LBP + SVSG | 87.02 % | |
| LDC | 75.57% | |
| LDC + SVSG | 86.45% | |
| LLBP | 69.47% | |
| LLBP + SVSG | 85.69% | |
| Network-based methods | MaxiC | 55.92% |
| MaxiC + SVSG | 76.34% | |
| MeanC | 55.73% | |
| MeanC + SVSG | 76.72% |
| Template | Rank-One Recognition Rate (%) |
|---|---|
| Registered sample | 72.33% |
| Virtual sample 1 | 74.62% |
| Virtual sample 2 | 56.68% |
| Virtual sample 3 | 68.89% |
| Virtual sample 4 | 59.73% |
| Virtual sample 5 | 64.12% |
| Virtual sample 6 | 60.11% |
| Vsample1 + Vsample2 | 75.95% |
| Vsample1 + Vsample2 + Vsample3 | 76.15% |
| Vsample1 + Vsample2 + Vsample3 + Vsample4 | 85.69% |
| Vsample1 + Vsample2 + Vsample3 + Vsample4 + Vsample5 | 85.88% |
| Vsample1 + Vsample2 + Vsample3 + Vsample4 + Vsample5 + Vsample6 | 86.45% |
| Vsample1 + Vsample2 + Vsample3 + Vsample4 + Vsample5 + Vsample6 + Registered sample | 87.02% |
Publisher’s Note: MDPI stays neutral with regard to jurisdictional claims in published maps and institutional affiliations. |
© 2022 by the authors. Licensee MDPI, Basel, Switzerland. This article is an open access article distributed under the terms and conditions of the Creative Commons Attribution (CC BY) license (https://creativecommons.org/licenses/by/4.0/).
Share and Cite
Zhou, L.; Yang, L.; Fu, D.; Yang, G. SIFT-Flow-Based Virtual Sample Generation for Single-Sample Finger Vein Recognition. Electronics 2022, 11, 3382. https://doi.org/10.3390/electronics11203382
Zhou L, Yang L, Fu D, Yang G. SIFT-Flow-Based Virtual Sample Generation for Single-Sample Finger Vein Recognition. Electronics. 2022; 11(20):3382. https://doi.org/10.3390/electronics11203382
Chicago/Turabian StyleZhou, Lizhen, Lu Yang, Deqian Fu, and Gongping Yang. 2022. "SIFT-Flow-Based Virtual Sample Generation for Single-Sample Finger Vein Recognition" Electronics 11, no. 20: 3382. https://doi.org/10.3390/electronics11203382
APA StyleZhou, L., Yang, L., Fu, D., & Yang, G. (2022). SIFT-Flow-Based Virtual Sample Generation for Single-Sample Finger Vein Recognition. Electronics, 11(20), 3382. https://doi.org/10.3390/electronics11203382