Abstract
Cracks can occur on different surfaces such as buildings, roads, aircrafts, etc. The manual inspection of cracks is time-consuming and prone to human error. Machine vision has been used for decades to detect defects in materials in production lines. However, the detection or segmentation of cracks on a randomly textured surface, such as marble, has not been sufficiently investigated. This work provides an up-to-date systematic and exhaustive study on marble crack segmentation with color images based on deep learning (DL) techniques. The authors conducted a performance evaluation of 112 DL segmentation models with red–green–blue (RGB) marble slab images using five-fold cross-validation, providing consistent evaluation metrics in terms of Intersection over Union (IoU), precision, recall and F1 score to identify the segmentation challenges related to marble cracks’ physiology. Comparative results reveal the FPN model as the most efficient architecture, scoring 71.35% mean IoU, and SE-ResNet as the most effective feature extraction network family. The results indicate the importance of selecting the appropriate Loss function and backbone network, underline the challenges related to the marble crack segmentation problem, and pose an important step towards the robotic automation of crack segmentation and simultaneous resin application to heal cracks in marble-processing plants.
1. Introduction
Marble has always been a reference point for Greece, as an integral part of its rich heritage. In addition to white and off-white marbles, Greece is ranked among the countries with the greatest variety of light and light-colored marbles such as grey, green, black and red, as well as textured marbles of exceptional quality [1]. Moreover, Greece acquires great marble deposits: currently, 210 quarries are fully active; 80 active quarries and 15 major marble-processing plants are established in Eastern Macedonia in Northern Greece, extracting more than 200,000 m3 of marble annually [2].
Since Greek marble holds an established position in the world market and is on a path of steady growth, many automations and innovations, accompanied by high-tech investments, are implemented in the Greek marble industry to maintain high marble quality. Towards this end, this work aims to provide a step towards the robotic application of resin (resination) to heal marble cracks by providing computer vision algorithms for the detection of cracks in marble surfaces, as part of an ongoing project established in Northern Greece [3].
Cracks are physical separations in marble slabs that deteriorate their quality. Cracks occur when the stone is quarried, when it is being handled, fabricated or transported, or after installation due to structural stress. Cracks are not easily visible. Visibility can be increased by the appropriate lighting conditions of a space, as well as by the viewing angle. To date, crack detection in marble-processing plants is performed by the careful manual visual inspection of slabs. The latter is time-consuming and prone to error, especially in textured marbles with watermark background designs [4]. In the quarry, innovative extraction technologies have aimed to reduce extraction defects, leaving the main repair actions to the polishing phase. To deal with cracks, resin is applied to slabs; the use of polyester resin to fill and reinforce marble slabs has been an accepted solution for more than 50 years. Resin is traditionally applied to the entire slab surface to make sure all cracks are filled, avoiding time-consuming slab-by-slab visual inspection and application. However, application on the entire slab fails to fill the deeper cracks, which later are filled manually. Therefore, the automatic targeted application of resin over the crack, before being applied to the entire slab, would be a feasible solution, offering—at the same time—a more precise application process towards enhanced marble quality, in terms of appearance and durability, and a more thorough management of resources (human labor, resin, etc.).
Recently, research on automatic visual inspection on the production line has been dedicated to helping industries to improve vision inspection-related processes [5,6,7]. Artificial intelligence (AI)-based visual quality inspection employs the capabilities of machine vision to detect anomalies/defects and product variations, providing algorithms and robotic automations that can adapt to workforce changes with the aim of achieving scaling production and higher quality control levels in an efficient and cost-effective way [8,9,10,11,12]. The most popular approaches of machine vision are classification, object detection and image segmentation [13]. Since image segmentation provides pixel-by-pixel details of objects and it is typically used to locate boundaries such as lines and curves, it is considered the most suitable technique for anomaly detection.
To this end, the main contribution of this work is the systematic and exhaustive study of crack detection on marble surfaces with deep learning segmentation techniques. The novelty lies in the investigation of the performance of a set of 112 model architectures (4 models and 28 backbones) that takes place for the first time in the literature.
In addition, this work also aims to achieve the following:
- A comparison between feature extraction networks (backbones) to identify the most suitable one. In the literature, there is limited work on the investigation of the performance of DL architectures based on the proposed backbone networks.
- The performance investigation of a proposed unified Loss function, never before applied to crack segmentation problems.
- The introduction of the first annotated public dataset of marble cracks.
- A simultaneous study on the physiology of cracks in marble surfaces, highlighting the difficulty of the problem; random textures on marble surfaces do not follow any deterministic placement rules or exhibit periodicity, making crack detection on them a challenging task.
- The first step towards the implementation of a vision-based robotic system for crack segmentation and the simultaneous application of resin for aesthetic reasons, as well as the reinforcement of slabs and post-processing cost reduction.
The rest of the paper is structured as follows. Section 2 reviews the related work. The physiology of cracks in marble is analyzed in Section 3. The materials and methods are presented in Section 4, covering the dataset, the segmentation models and the proposed methodology. In Section 5, the experimental setup and results are summarized, followed by a discussion in Section 6. Finally, Section 7 concludes the paper.
2. Related Work
The recent advances in machine learning (ML) and deep learning (DL) have offered the opportunity for the enhancement of automatic crack-detection algorithms. Cracks can appear in different kinds of materials; however, the focus in the related literature is mainly on concrete manmade structures (buildings, pavements, bridges, dams, etc.) where minor cracking could threaten public safety, rather than on marble.
The most popular ML models for crack detection are support vector machines (SVMs) [14,15], artificial neural networks (ANNs) [16,17] and random forests (RFs) [18,19]. In ML methods, crack detection is usually accompanied by crack type classification, including the preprocessing step of feature extraction. Even though ML methods are effective, higher-level features are needed to better handle the complex data in images, such as illumination variations [20]. DL methods can better handle such complex information since they can learn the features directly from the data. Convolutional neural networks (CNNs) are, therefore, commonly used for crack-detection tasks, supporting classification, object detection and image segmentation [21,22,23,24,25]. Segmentation methods can lead to a more precise crack localization aided by parallel growth and higher advances in current remote sensing technologies (cameras) that can provide higher spatial and spectral resolution data. Moreover, the extracted crack location can also be used for crack type classification or to extract essential crack features. Therefore, DL segmentation methods are currently the trend in crack detection.
However, DL methods for crack detection are in their early stages of development, while research on DL-based crack detection specifically on marble surfaces is scarce in the literature. It should be noted that a search on the Scopus database returned 589 results by searching with the keywords “deep learning” and “crack detection”, 544 of which were dated within the last 5 years; searching within the results with the additional term “marble” returned only one publication, dated in 2021. With further research on Google Scholar, two more related works were found, dated in 1997 and 2020. However, these two papers did not include numerical detection performance results. Therefore, the contribution of the present work is evident.
Machine vision for marble defect detection was first introduced in 1997 [26]. Authors developed an image database of aesthetic and physical defects on Carrara marble, designed a lighting system and proposed vision-based algorithms for the detection of several types of defects: surface defects, geometric defects, colored inclusions, morphological defects, monochromatic inclusions and cracks. In [27], the authors discussed the most popular algorithms and methods for image segmentation to detect defects on marble slabs. The article concluded the disadvantages of other methods could be resolved by using the k-means clustering method and that Gaussian blur algorithms, Hough transform, and the Kenny algorithm were probably the best suited algorithms for the recognition of defects on the surface of marble slabs. In [28], a deep learning semantic segmentation method was proposed, providing numerical evaluations and comparative experiments for the first time. A DeepLabv3+ model was trained to detect fractures and cracks with an initial dataset. The dataset was augmented and then used to train five different convolutional neural networks (CNNs): MobileNet-v2, Xception, ResNet-18, Inception-ResNet-v2 and ResNet-50, using three different optimization algorithms (stochastic gradient descent with momentum (SGDM), Adam, and root mean square propagation (RMSprop)). The results indicated ResNet-50 with the RMSprop optimizer as the most efficient architecture, resulting in a mean Intersection over Union (mIoU) of 0.672.
The limited literature on marbles reveals that the detection of cracks on the surface of marble slabs presents peculiarities compared with the detection of cracks on other surfaces such as concrete. This is related to the textured surface of marble slabs, displaying strong texture information which is unstructured and irregular. This means that in a marble slab, a crack exhibits similar statistical properties to areas of the image that are part of the marble texture, e.g., marble watermarks make the detection of cracks really challenging. In general, computer vision and artificial intelligence have been used for visual inspections of textured materials, with the aim of identifying engineering features that could represent local or global distinctiveness of the sampled images [29]. The improvement of deep learning models with features resulting from texture analysis methods is considered efficient for enabling better-trained models. The classification of texture is challenging due to properties such as regularity, randomness, uniformity, and distortion that cannot be properly defined due to the fact that texture types are infinite and complex. Texture analysis has been used to assess the quality of many textured products [30], introducing multiple methods able to extract textures from an image, such as the grey-level co-occurrence matrix (GLCM), local binary patterns (LBPs), etc. Information regarding the physiology of cracks in marble is provided in the following section (Section 3).
3. The Physiology of Cracks in Marble
Marble is a metamorphic, i.e., heated and compressed, rock originating from sedimentary limestone. Marble is quarried naturally and contains mainly calcium. In some cases, magnesium can prevail, and then the rock is called dolomite [31]. Marble is quarried in blocks of 3 × 2 × 5 m. From these blocks, slabs are cut, usually in the size of 3 × 2 m with thickness ranging from 2 to 4 cm. Slabs are further cut into tiles of various sizes, depending on the needs of the construction. The schematic procedure of marble from the quarry into tile is illustrated in Figure 1. Photos of marble in all processing stages are provided in Figure 2.
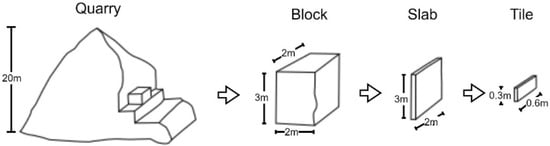
Figure 1.
Schematic representation of marble processing from quarry to tile.
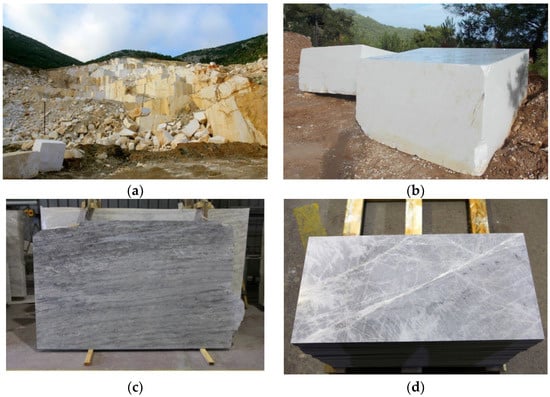
Figure 2.
(a) A quarry at Paggaion Mountain, Kavala, Greece; (b) two blocks of white marble originating from Thassos Island, Greece; (c) a marble slab; (d) a tile of Grey Lais dolomitic marble from Falakron Mountain, Drama, Greece.
Nowadays, slabs are treated with a wide range of chemical products, e.g., with a polymer or epoxy resin base to enforce the stone prior to the cutting of the tiles [32]. Traditional treatment can include three steps depending on the quality of the marble. The succession of these steps can vary depending on the types of flaws encountered. Usually, in the first step, the resin is applied on the complete surface of the slab, penetrating it and closing its pores and minor cracks of maximum 2 mm of aperture. In the second step, a net is applied with the use of a chemical resin to the backside of the slab. In the third step, bigger cracks have to be treated locally with the application of special polymer fillers, which have to match the natural color of the stone. Although the resination of the complete slab in the first step has already been automated, the filling of flaws such as bigger cracks and holes, referring to the third step of the process, requires the inspection of a trained worker and manual repair using special chemical fillers. This work aims to develop an algorithm capable of regulating the amount of resin applied according to the aperture of the crack.
Traditionally, white marble with no watermark texture and flaws such as cracks, inclusions, or cavities was used as an ornamental stone and was rated as a high-quality stone [33]. Although that type of marble is still highly valued in the market, progress in using chemical products has allowed the marble industry to repair even highly defected marble slabs. Flaws in marble slabs can be grouped into three main categories, as illustrated in Figure 3. Type I includes bigger cracks and holes as a result of natural processes during the exhumation of the rock mass due to brittle tectonics. These flaws are created before the quarrying of the marble blocks. Type II flaws are smaller cracks as a result of the handling of the material during the quarrying of the marble in the factory. These are treated usually by the resination of the entire slab. Type III defects are caused during and after installation and are not treated in an industrial environment. In this work, the aim is to develop an algorithm to detect cracks of Type I and Type II.
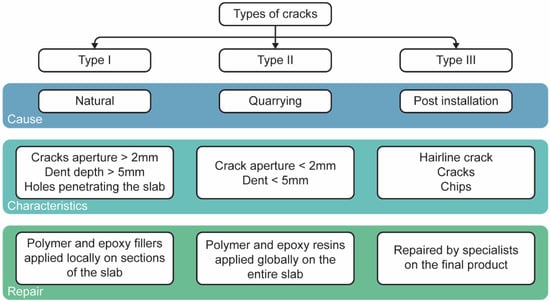
Figure 3.
Types of cracks, cause, characteristics and their treatment.
The detection of flaws using computer vision is a difficult task due to the complex textures on many marble types marketed today. It is very common to encounter Type I cracks that have been filled naturally with minerals. These types of filled cracks are called fissures and do not create problems on the stability of the slab (Figure 4). Due to their optical similarity to cracks, fissures pose a significant problem to the automatic recognition of cracks.
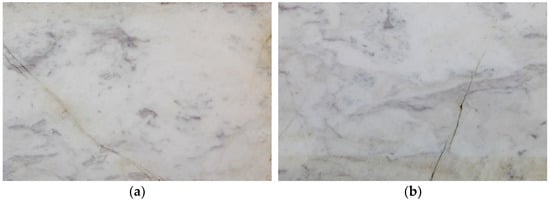
Figure 4.
(a) Textured marble without cracks. The line resembling a crack at the left–bottom section of the image is a fissure; (b) textured marble with cracks. Two parallel cracks at the right–bottom section of the image. Both depicted marble samples have not been treated with any resin.
4. Materials and Methods
In this section, the materials and methods are summarized, including the image dataset, the semantic segmentation model architectures, and the proposed methodology.
4.1. Dataset
In order to perform marble crack segmentation, a crack dataset was formulated. The original marble crack dataset, namely the Marble Crack Segmentation (MCS) Dataset, and annotations are available online at https://github.com/MachineLearningVisionRG/mcs-dataset (accessed on 26 September 2022). The dataset was a reformation of the dataset for marble surface anomaly detection 2, provided by Aman Rastogi [34]; only the images of the “crack” folder of the train and test set were used. Both folders contained augmented images due to the scant availability of crack images. All augmented images were removed, resulting in 246 original RGB images of 256 × 256 pixel size. Cracks in the images were manually annotated using the LabelMe annotation tool [35].
Five-fold cross-validation was applied to the dataset to increase the confidence in the models’ performance. At each fold, 156 images were used for training, 40 for validation and 50 for testing. Figure 5 illustrates the formulation of the proposed marble crack dataset.
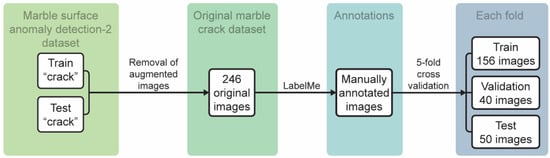
Figure 5.
Formulation of the proposed marble crack dataset.
4.1.1. Data Preprocessing
All original images were subjected to adaptive histogram equalization (AHE) using the contrast-limited AHE (CLAHE) variant. The latter was applied to reduce noise amplification [36]. It should be noted that for each backbone case, a corresponding preprocessing function was applied to the images. For example, for the DenseNet model, the images are scaled between 0 and 1, while for the case of the ResNet models, the images’ channels are converted from RGB to BGR and the pixel values are zero-centered.
4.1.2. Data Augmentation
The Albumentations [37] library provides a plethora of different augmentation techniques. Therefore, in this work, the images in the training set were augmented in real time while training the examined models. More specifically, at each iteration, a minibatch of 32 images was selected and traditional augmentation techniques were applied to the images, including uniformly random rotation (between 0 and 90°) and horizontal and vertical flipping with 50% chance.
4.2. Semantic Segmentation—DL Model Architectures
Semantic segmentation can provide dense pixel-level information useful to fully understand a scene. However, most of the backbones used in segmentation models for feature extraction resulting from pretrained models may lead to poor performance, especially in small categories, such as marble cracks, due to the lack of sufficient spatial information [38]. Therefore, efficient combinations of model architectures need to be investigated for the problem under study. In this work, 4 deep convolutional neural network models are fully trained (all layers) and 28 backbone architectures for feature extraction are tested for marble crack semantic segmentation. The reason to fully train the models is due to the aforementioned weakness of pretrained models to extract meaningful spatial features from new image samples for the problem under study. Furthermore, to strengthen this decision, a pretrained baseline model is also examined for comparative reasons.
4.2.1. Models
In this work, four deep CNN models were selected: Feature Pyramid Network (FPN) [39], LinkNet [40], Pyramid Scene Parsing Network (PSPNet) [41] and U-Net [42]. The selection was due to the powerful capabilities of the models for feature extraction, learning representations and their end-to-end trainable structures. Moreover, all models were widely used recently in various segmentation applications, resulting in state-of-the-art performances [43,44,45,46].
Baseline Model
A baseline model was selected to demonstrate the performance of a pretrained DL model on cracks compared with the performance of fully trained DL models on the available marble crack data. The baseline model architecture, namely, DeepCrack, available online: https://github.com/yhlleo/DeepCrack (accessed on 14 September 2022) (code and dataset available at [47]), was described in [48]. The model was pretrained on RGB images, illustrating cracks on manmade structures such as asphalt and concrete.
4.2.2. Backbone Architectures
Backbones refer to feature extraction networks and are responsible for computing features from the input images. The selection of the most suitable network for feature extraction should not be completed by chance, since it is strongly related to the performance of the target task (e.g., segmentation) and it is responsible for, among other things, the computational complexity of the DL model. Many backbone networks have been developed and used in various DL models [49].
It should be noted that, in the literature, there are a lack of research works that aim to compare proposed feature extraction networks for their DL applications [49,50]. However, in computer vision tasks, the selection of the appropriate backbone network is critical; unsuitable backbones for specific applications can deteriorate the model’s performance and be significantly complex and computationally costly.
In this work, a solution to the aforementioned problem is investigated by evaluating the various existing backbones used for feature extraction. More specifically, for each of the 4 models, 28 backbone networks are examined towards the investigation of the most efficient combination. The types (families) and names of the backbones are summarized in Table 1.

Table 1.
Families and names of backbones.
4.3. Methodology
In this work, crack semantic segmentation is formulated into a binary image-labeling problem, where 1 refers to crack and 0 refers to non-crack.
The proposed methodology derives from the combination of 4 semantic segmentation models with 28 feature extraction networks. The aim of this modular design is to investigate the combination that best fits the crack segmentation problem. In addition, the most appropriate Loss function for the problem under study is also investigated. Experimental results are evaluated based on two different perspectives: (1) based on the model and (2) based on the backbone. Figure 6 illustrates the proposed methodology.
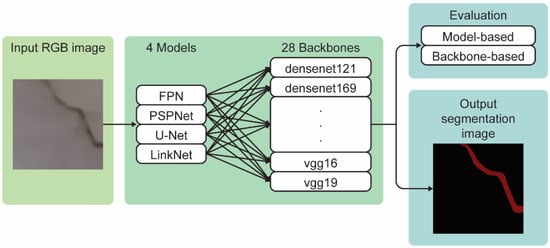
Figure 6.
An illustration of the proposed methodology. Input images are provided for the proposed segmentation architecture, examining the combination of 4 semantic segmentation models with 28 feature extraction networks; results include the output segmentation image and the numerical experimental results of the models which are evaluated based on two different perspectives: (1) based on the model and (2) based on the backbone.
Loss Function
Challenges in semantic segmentation tasks, such as imbalanced data, can be better handled by adopting the appropriate Loss function towards better convergence of the models. DL methods use stochastic gradient descent to optimize and learn targets. For more accurate and quick learning, the mathematical representations of targets, namely, Loss functions, need to be able to cover all boundary cases. For binary problems such as semantic segmentation, where the class of a pixel can be either 0 or 1, state-of-the-art approaches adopt, among others, Focal Loss (FL) and Dice Loss (DLo) as the optimization targets [51].
FL is commonly used with imbalanced data, due to its ability to down-weight the contribution of easy examples, thus enabling the model to learn the harder ones. DLo is used to evaluate segmentation results by calculating the similarity between two images. The selection of the appropriate Loss function is crucial, especially for class-imbalanced data such as the case of marble cracks. Recently, unified losses were presented in the literature to handle class-imbalanced datasets for image segmentation towards the constant improvement of segmentation quality, and were also associated with better recall-precision balance [52].
Towards this end, in this work, the Loss function calculated as the sum of Focal and Dice Loss is selected as the optimization target applied in all segmentation experiments. The proposed unified Loss function is used to generalize Dice-based and Focal-based Loss functions into a single framework.
The Focal Loss (FL) is as follows:
where is the modulation factor, is the output of the activation function, is the focus factor where , is a control weight defined in [0,1] and is the estimated probability of class. Dice Loss (DLo) is defined by the equation:
where is the real value and is the value predicted by the prediction model.
Considering that both Focal and Dice Loss are cost-effective operations, the proposed unified Loss is not expected to considerably increase the training time compared with the component Loss functions [52].
5. Experiments and Results
In this work, all algorithms were implemented in Python 3.9 using TensorFlow and Keras [53] on a personal computer with an Nvidia RTX 3090 GPU. Original RGB images (256 × 256) were uniformly resized to 224 × 224 pixels to be used as input images to the segmentation models (except for PSPNet, which required input image dimensions of 240 × 240).
5.1. Model Setup
For each model, a five-fold cross-validation technique was incorporated to better evaluate its effectiveness and robustness. The models are trained for 20 epochs. To avoid overfitting, early stopping is applied on the validation set; training stops once the validation loss stays above or below 0.001 for five consequent epochs.
All backbones have pretrained weights on ImageNet for faster and better convergence. For the baseline model, the adopted configuration is described in [47]. Table 2 includes the details of the hyperparameters used in all DL models.
Table 2.
Models’ hyperparameter setup.
5.2. Metrics
In order to report numerical evaluations for the examined segmentation models, four well-known semantic segmentation metrics were adopted: Intersection over Union (IoU), precision (P), recall (R) and F1 score. In the case of semantic segmentation, a pixel-by-pixel analysis is performed. In order to calculate IoU, the basic mathematical definitions of True Positive, False Positive and False Negative are required.
In image segmentation, True Positive (TP) is defined as the intersection of the Ground Truth (GT) with the segmentation mask (S) (mathematical operation AND between GT and S):
TP = GT * S
False Positive (FP) is the prediction outside the GT area (mathematical operation OR between GT and S, minus GT):
FP = (GT + S) − GT
False Negative (FN) is the number of pixels in the GT area that the model failed to predict (mathematical operation OR between GT and S, minus S):
FN = (GT + S) − S
IoU measures similarity between finite sample sets, and based on the above, it is calculated as follows:
Precision (P) and recall (R) are also commonly used for semantic segmentation evaluation, and are calculated as follows:
Finally, F1 score is calculated as the weighted average of precision and recall:
5.3. Results
In addition to the models’ evaluation for all backbone combinations (model-based evaluation), the evaluation of the efficiency of each backbone is also examined separately (backbone-based evaluation). Moreover, the results include the evaluation of the pretrained baseline model with the marble crack dataset (baseline model-evaluation) for comparative reasons. In what follows, experimental results after five-fold cross-validation are presented.
5.3.1. Model-Based Evaluation
Table 3 includes the performance results of the FPN model on the testing set after the five-fold cross-validation strategy. Best values, mean values and standard deviation are included in the table. Moreover, among the best IoU performances on the training set images, the two most frequently involved backbone networks are also reported (Frequent Best Backbones). It should be noted that maximum (Max) values in the performance tables refer to the higher reported performance of each metric, not necessarily referring to the same testing image.
Table 3.
Performance (%) of FPN on the test set after 5-fold cross-validation. Best mIoU is marked in bold.
The best results with the FPN for each one of the 50 images of the testing set from each fold involved the inceptionv3 backbone network (in 5 cases) the most times, followed by seresnet152 and resnet50 (both in 4 cases). The best overall performance in terms of IoU reached 98.46% by using seresnet152, while the reported mIoU was 71.35%. Figure 7 illustrates the indicative segmentation results with the FPN of different measured IoU performances.
Figure 7.
Indicative images of the testing set to illustrate FPN performance. For each image: up–left is the ground truth image, down–left is the RGB input image, up–right is the output segmentation and down–right is the output segmentation mask applied to the input image. (a) Best (IoU 98.46% with seresnet152); (b) medium (IoU 93.24 with seresnet50); (c) moderate (IoU 37.41 with seresnet50).
Table 4 summarizes the performance results of LinkNet. The best IoU performance reached 98.54% with densenet169 feature extraction, while the IoU was 70.39%, slightly lower than FPN. Figure 8 illustrates the indicative segmentation results with LinkNet referring to the different measured IoU performances.
Table 4.
Performance (%) of LinkNet on the test set after 5-fold cross-validation. Best IoU is marked in bold font.
Figure 8.
Indicative images of the testing set to illustrate LinkNet performance. For each image: up–left is the ground truth image, down–left is the RGB input image, up–right is the output segmentation and down–right is the output segmentation mask applied to the input image. (a) Best (IoU 98.54% with densenet169); (b) medium (IoU 93.12% with densenet169); (c) moderate (IoU 35.23% with resnet152).
Performance results of PSPNet are included in Table 5. The best IoU performance reached 98.29% with the mobilenet feature extraction network, while the mIoU was 62.85%. Compared with the previous two models, PSPNet displayed a poorer performance regarding all measure metrics. Figure 9 illustrates the indicative segmentation results with PSPNet for different measured IoU performances.
Table 5.
Performance (%) of PSPNet on the test set after 5-fold cross-validation. Best mIoU is marked in bold font.
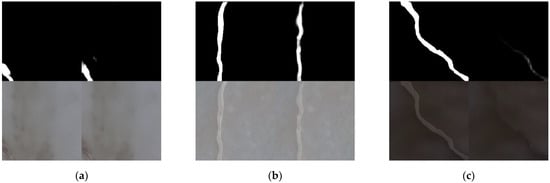
Figure 9.
Indicative images of the testing set to illustrate PSPNet performance. For each image: up–left is the ground truth image, down–left is the RGB input image, up–right is the output segmentation and down–right is the output segmentation mask applied to the input image. (a) Best (IoU 98.29% with mobilenet); (b) medium (IoU 91.83 with vgg19); (c) moderate (IoU 13.75% with resnet50).
Finally, regarding U-Net, the performance results are presented in Table 6. U-Net reported the best performance among all models, reaching an IoU of 98.83% with the resnet50 backbone. However, mIoU was not the best compared with the previous models, ranking U-Net in third place, with a score of 68.91%. Figure 10 illustrates indicative segmentation results with U-Net for different measured IoU performances, as for all previous models.
Table 6.
Performance (%) of U-Net on the test set after 5-fold cross-validation. Best mIoU is marked in bold font.
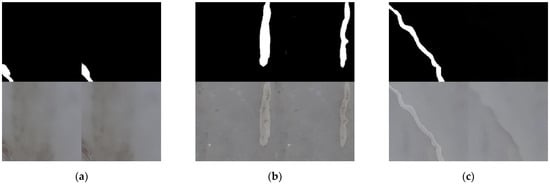
Figure 10.
Indicative images of the testing set to illustrate U-Net performance. For each image: up–left is the ground truth image, down–left is the RGB input image, up–right is the output segmentation and down–right is the output segmentation mask applied to the input image. (a) Best (IοU 98.83% with resnet50); (b) medium (IοU 93.62% with efficientnetb1); (c) moderate (IοU 29.91% with resnet101).
It should be noted that the best (Max) IοU performance refers to a certain backbone, which is not necessarily the backbone that appears in most of the best testing cases (referring to the Frequent Best IοU Backbones in the tables). However, in all models, the best IοU performance was achieved with either one of the backbones that contributed more frequently towards the best IοU results. Therefore, a trend can be seen that some feature extraction networks can lead to better segmentation results when combined with specific models, regarding the marble crack-detection problem. Further investigation on the backbone contribution to the models’ performance metrics is provided in an upcoming subsection.
As it can be observed from subfigure (a) in Figure 3, Figure 4, Figure 5 and Figure 6 that the best performance for all models was reported on the same image of the testing set. However, the crack on the specific image may be considered small, less intense and less obvious than the cracks on the other images that displayed poorer performance (e.g., Figure 9c and Figure 10c, etc.). The latter is attributed to the nature of the image, depicting a marble slab with fewer dark areas and spots, illuminations, and with a cleaner surface, that is, an image with less noise. It is well known that noise is one of the main challenges in visual-inspection tasks. Constant illumination or the use of thermal imaging can provide feasible solutions for noise reduction, as discussed in Section 6.
In order to comparatively evaluate the models’ performance, apart from the results in Tables, comparative figures are additionally provided: Figure 11a comparatively demonstrates the mIοU performance of all examined models; Figure 11b shows the precision metric; Figure 11c shows the recall metric; and Figure 11d shows the F1 score.
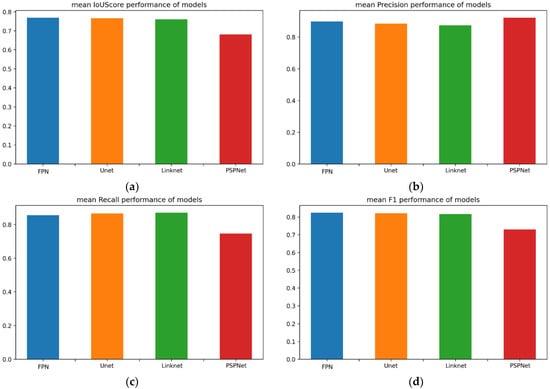
Figure 11.
(a) Mean IοU score performance of all models; (b) mean precision performance of all models; (c) mean recall performance of all models; (d) mean F1 score performance of all models.
Subfigures of Figure 11 illustrate that FPN, U-Net and LinkNet share the same degree of performance in all reported metrics, while PSPNet performs slightly worse.
However, the overall comparative results indicated that the most efficient model for the problem under study was FPN, with a 71.35% IοU. Recall that, in [28], the semantic segmentation model DeepLabv3+ for marble crack detection resulted in an IoU of 67.2%. Therefore, the undertaken investigation resulted in a more efficient model architecture, reaching a state-of-the-art performance. However, since the data used in [28] were not the same as in our case, a baseline model was tested on the same data for a fairer comparison.
5.3.2. Baseline Model Evaluation
The results regarding the selected baseline model [48] on the same testing set are included in Table 7. Mean IοU is lower than any of the proposed examined model architectures. The same is true for F1 score and recall. The low recall value in image segmentation is typically due to under-segmentation, indicating that significant image structures were not captured [54].
Table 7.
Performance (mean values—%) of the pretrained baseline model on the test set after 5-fold cross-validation.
In general, the decision on which metric to rely on is related to the type of the examined problem. In this work, the four selected metrics are reported for comparative reasons towards a more general evaluation. It should be noted, however, that the main evaluation is based on IοU, since it is the most commonly used metric in semantic segmentation due to its straightforward calculation and interpretation that make it extremely effective.
It should be highlighted here that comparative results with other methods in the literature are scarce. As reviewed in the related work section, only in [28] are there available numerical evaluations and comparative experiments of deep learning marble crack semantic segmentation methods. The results in [28] indicated Res-Net-50 with the RMSprop optimizer as the most efficient architecture, resulting in a mean Intersection over Union (mIoU) of 0.672. (67.2%). Additionally, in this case, the measured IoU is lower than most of the examined model architectures. However, the results cannot be directly compared since they refer to a different marble crack image dataset.
5.3.3. Backbone-Based Evaluation
In this subsection, the derived experimental results are also translated from the backbone point of view. We have already observed that the DL segmentation models tested on the same dataset using different backbones resulted in different performance measurements. The latter strongly indicates that the use of specific backbones for a specific task can greatly affect the performance of a DL model. In this section, our experimental results are examined by evaluating the contribution of the used backbone. Table 8 includes all models’ measured mean performances after 5-fold cross-validation regarding the backbone networks.
Table 8.
Performance (mean values—%) classification based on the used backbone. Five best mIoU values are marked in bold font.
As it can be seen from Table 8, the best IοU values were reported with the Se-ResNet family, and more specifically, with seresnext50, followed by seresnet101, seresnet50 and seresnext101. The SE-ResNet module has been introduced recently and used in various DL applications [55,56,57]. It is based on the combination of a residual module (ResNet) and a squeeze-and-excitation (SE) block, and is capable of extracting informative features by using spatial and channel-wise information within local receive fields. Research findings [57] concluded that the SE block produced significant performance improvements compared with the state-of-the-art DL architectures and added minimal computational costs.
It should be noted that the best performing model, FPN, reached the higher reported IoU combined with seresnet152, while the same backbone network was among the most frequently used backbones resulting in the best model performance. The latter was also observed regarding the other three models; in all cases, a backbone from the SE-ResNet family was one of the two most frequent backbones responsible for the best reported IοU performances. Based on the above, it can be concluded that SE-ResNet family backbones can extract more representative features for the marble crack problem, and when combined with an FPN model can result in optimal segmentation results.
6. Discussion, Challenges and Future Directions
It seems that there is a growing interest in image-based automatic crack detection. Machine vision algorithms can guarantee non-destructive inspection, tirelessly, quickly and efficiently by using inexpensive sensory equipment (e.g., RGB cameras). For the problem under study, some of the challenges that need to be confronted in image-based detection are due to the random shape and irregular size of cracks, especially on textured surfaces such as marbles, and the additional various noises such as irregular lighting conditions, shadowing, as well as other imperfections (fissures) and material breakage in the captured images. The latter was the motivation for investigating the performance of multiple combinations of models with feature extraction backbones in order to reach a conclusion about which architecture could be more efficient for the particular marble crack detection problem with its inherent difficulties.
The results indicated that the models’ performance was indeed affected by noise issues, mainly due to the used dataset, depicting marble slabs that were dirty and dusty, and subjected to different lighting conditions. Future work will focus on the collection of a marble crack image dataset under constant illumination, as well as the annotation of images with access to the physical marbles. Moreover, thermal imaging will be investigated. Studies reveal that thermal imaging can be used to better distinguish cracks on concrete compared with RGB images [58]. By using RGB images, only superficial cracks can be detected, while the internal features of the marble cannot be fully discovered. Infrared thermal imaging can aim to better distinguish invisible cracks that are superficial as well as internal cracks and other defects.
Another challenge is the limited and imbalanced data of marble cracks. Crack segmentation is a two-class problem. However, the crack covers only a small pixel area of the image. Pretrained models on surface anomalies/cracks on concrete, etc., may lead to poor performance when used with small and imbalanced data, such as marble cracks, due to the lack of sufficient spatial information. This is the reason why the baseline model (pretrained on other crack data) resulted in poor performance: 48.27% of IoU compared with the performance of the segmentation models trained from scratch, reaching an IoU of up to 71.35%. In general, the potential of a DL model is related to the used deep architecture which, in many cases, may contain many layers and levels but fail to successfully relate them to the contextual understanding of the data. Therefore, the pretrained baseline model which is competent in the specific task of concrete crack detection, when used in marble crack detection, even if it is a close/similar task, does not perform well. All the training should be repeated since the baseline model failed to understand the data context but learned what it was trained on. With the application of the same DL model architectures in different domains/applications, the models need to be maintained at each time by using the new features and data for the model to be able to effectively identify the new task scenarios.
However, despite being comparatively high, the performance of the best DL model in this work is considered low, and there are prospects for further improvement: models should be fully trained with augmented data from a small set of original data. Deep structures require more data; the more powerful and accurate a model, the more data it requires. Therefore, the DL models’ inherent complexity, the substantial number of deep layers needed for better accuracies and the corresponding amounts of training data are major limitations. Both annotation and the availability of data are challenging for DL applications. For semantic segmentation, the data need to be annotated first in order to train the DL model. Data annotation is also demanding, due to the number of objects that need to be labeled, resulting in time-consuming and labor-intensive work that also needs a human’s expert knowledge. It should be mentioned here that one of the contributions of this work is also the introduction of the first annotated public dataset for marble cracks. Future work will focus on marble crack data collection with the aim of compiling a larger dataset for the problem under study. However, it should be noted that deeper architectures with more training data would be computationally intensive, requiring high-performance computational resources and long training times. In such cases, powerful processors able to handle specialized computations are needed. Alternatives are also available; cloud GPUs offer, on-demand, the opportunity, especially for beginners, to experiment with DL without needing to purchase any equipment.
Loss functions are also crucial for the determination of a DL model’s performance. For complex tasks such as image segmentation, the Loss function needs to be decided based on the properties of the training data (distribution, skewness, boundaries, etc.). Since a universal Loss does not exist, in this work, a unified Loss function was investigated for enhanced performances. It should be mentioned here that several experiments were conducted before deciding on the selected Loss; binary cross-entropy, Focal Loss and Dice Loss were investigated separately, but led to lower performances and were, therefore, abandoned. The significant differences in the models’ performance by utilizing a different Loss function underlines its great importance in class-imbalanced image segmentation tasks. Future work aims to focus on Loss functions’ contribution by examining several Loss functions with a variety of class-imbalanced datasets.
Finally, this work highlights the major contribution of the backbone network to the models’ performance. The results indicated the SE-ResNet family as the most efficient network family for feature extraction for the marble crack segmentation problem. Future work should focus more on the examination of backbone networks, since it would be useful to assess whether performance improvements can be generalized to a specific state-of-the-art feature extraction family for the better handling of class imbalance.
This work revealed that, for a small and imbalanced dataset, there are efficient DL architectures able to provide marble crack segmentation with high accuracy. This work poses the first step towards the implementation of the first robotic automation for resin application on marble slabs in marble-processing plants.
Robot for Marble Crack Detection and Resin Application
This section outlines the preliminary conceptual design and basic components of an autonomous robot for resin application in marble slabs for the healing of surface cracks. The development of the proposed DL algorithm for the visual localization/detection of cracks in marble tiles is meant to be integrated in the system’s design. In what follows, assumptions to determine the general preliminary framework of the robotic system to be developed are made. Therefore, the proposed system may consist of the following three main parts:
- The visual-inspection part. This will include:
- ○
- A diffusion box to ensure the uniform and consistent lighting of all slabs;
- ○
- A high-resolution (HR) RGB camera for the best possible visualization of the cracks;
- ○
- A thermal camera for displaying the thermal distribution on the surface of the slab, in the form of a thermal image, for better distinguishing cracks possibly not visible with RGB imaging;
- ○
- Supporting image processing and crack-detection algorithms.
- The robotic resin application part. This will include:
- ○
- A robotic arm;
- ○
- An appropriate end-effector for resin application;
- ○
- Supporting algorithms for robot navigation and more.
- Auxiliary parts. This will include:
- ○
- A conveyor belt that will move the marble slabs one by one into the basic system part, the visual-inspection part and the robotic resin application part;
- ○
- An electric heating device/source underneath the diffusion box to thermally excite the surface of the marble slabs for thermal imaging;
- ○
- A high-performance computer to speed up the execution of the DL segmentation algorithms and process all other system-supporting algorithms.
The conceptual system will operate as follows. The conveyor belt will transport the marble slabs towards the robotic system. The movement of the conveyor belt will stop when a marble slab enters the diffusion box. The image captured by the camera(s) will contain only the marble slab to be analyzed so as not to segment the slab from the image background. DL supporting algorithms will process the captured images to locate surface cracks. Once the cracks are detected, the conveyor belt will the slab forward to the robotic resin application part to heal them. The movement of the conveyor belt will stop when the marble slab enters the resin application area to keep the slab stationary so as to apply the resin exactly over the detected cracks. The robotic arm will navigate towards the slab and will apply resin on the detected cracks. It should be noted that this is just a conceptual outline of the resin application robotic automation, and its final design may vary. The system parts are graphically illustrated in Figure 12.
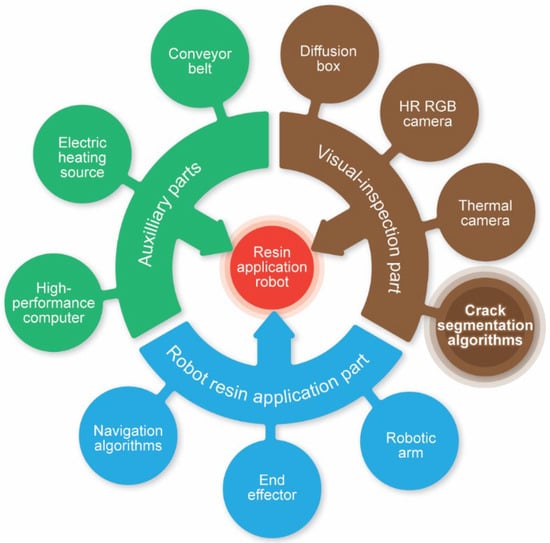
Figure 12.
Conceptual design of a robotic resin application system for marble slabs.
In Figure 12, the contribution of the present work is underlined in bold. Marble crack detection is the main algorithmic task of the visual-inspection system, which is demanding due to the nature of cracks and all related challenges, as already discussed. Therefore, this work poses an important step towards the realization of such a robotic automation. Future work will focus on the design and development of the overall system with the aim to be used practically in marble-processing plants.
7. Conclusions
This work provides the most up-to-date systematic and exhaustive study on marble crack detection in color images based on DL techniques. A performance evaluation of 112 DL segmentation models (4 models combined with 28 feature extraction networks) on RGB marble slab images using five-fold cross-validation is given, providing consistent evaluation metrics in terms of IoU, precision, recall and F1 score.
The experimental results are translated based both on the selected model as well as on the used backbone. The comparative evaluation demonstrated that the combination of FPN with SE-ResNet family backbones can result in a higher performance (mIοU 71.35% after five-fold cross-validation) compared with the state-of-the-art baseline methods using the marble crack dataset. This work managed to identify all detection challenges related to marble cracks’ physiology and disposed of the first annotated public dataset of marble cracks.
In the future, authors plan to exploit better strategies to merge representative feature extraction networks to DL models and examine more DL architecture combinations. More images of marble crack regions will be added to the current database so as to make it more comprehensive. Additional Loss functions will be tested, and unified Loss functions will be proposed. However, the main focus of future work will be on the design and development of the outlined robotic resin application system.
Author Contributions
Conceptualization, G.K.S. and G.A.P.; methodology, G.K.S. and G.A.P.; software, G.K.S.; validation, A.G.O. and A.L.; investigation, E.V., G.K.S., A.G.O. and A.L.; resources, E.V., A.S., I.T. and V.K.; data curation, G.K.S. and E.V.; writing—original draft preparation, E.V., A.G.O. and G.K.S.; writing—review and editing, E.V., G.K.S., A.G.O. and G.A.P.; visualization, G.K.S. and G.A.P.; supervision, G.A.P.; project administration, G.A.P. and I.T.S.; funding acquisition, G.A.P., I.T.S., V.K. and A.S. All authors have read and agreed to the published version of the manuscript.
Funding
This research has been co-financed by the European Union and Greek national funds through the Operational Program Competitiveness, Entrepreneurship and Innovation, under the call RESEARCH—CREATE—INNOVATE (project code: Τ2ΕΔΚ-00238).
Data Availability Statement
Publicly available datasets were analyzed in this study. The used dataset was a reformation of the dataset for marble surface anomaly detection 2, provided by Aman Rastogi [26]. The developed Marble Crack Segmentation (MCS) Dataset and annotations can be found here: [https://github.com/MachineLearningVisionRG/mcs-dataset, accessed on 26 September 2022].
Conflicts of Interest
The authors declare no conflict of interest.
References
- Intermek. Available online: https://www.intermek.gr/en/ (accessed on 5 September 2022).
- Oryctosploutos Greek Mineral Wealth. Available online: https://www.oryktosploutos.net/ (accessed on 5 September 2022).
- MLV Research Group Marble Crack Visual Detection Algorithm (VI4MC). Available online: http://mlv.cs.ihu.gr/index.php/projects/ (accessed on 5 September 2022).
- Petrou, M.; Kittler, J.; Song, K.Y. Automatic surface crack detection on textured materials. J. Mater. Process. Technol. 1996, 56, 158–167. [Google Scholar] [CrossRef]
- Kuts, V.; Otto, T.; Tähemaa, T.; Bukhari, K.; Pataraia, T. Adaptive Industrial Robots Using Machine Vision. In Volume 2: Advanced Manufacturing; American Society of Mechanical Engineers: New York, NY, USA, 2018. [Google Scholar]
- Ouzounis, A.; Sidiropoulos, G.; Papakostas, G.; Sarafis, I.; Stamkos, A.; Solakis, G. Interpretable Deep Learning for Marble Tiles Sorting. In Proceedings of the 2nd International Conference on Deep Learning Theory and Applications, Online, 7–9 July 2021; SCITEPRESS—Science and Technology Publications: Setúbal, Portugal, 2021; pp. 101–108. [Google Scholar]
- Sidiropoulos, G.K.; Ouzounis, A.G.; Papakostas, G.A.; Sarafis, I.T.; Stamkos, A.; Kalpakis, V.; Solakis, G. Exploiting Deep Metric Learning for Mable Quality Assessment with Small and Imbalanced Image Data. In Proceedings of the 2021 IEEE 12th Annual Information Technology, Electronics and Mobile Communication Conference (IEMCON), Vancouver, BC, Canada, 27–30 October 2021; pp. 0266–0269. [Google Scholar]
- Charan, A.; Karthik Chowdary, C.; Komal, P. The Future of Machine Vision in Industries—A systematic review. IOP Conf. Ser. Mater. Sci. Eng. 2022, 1224, 012027. [Google Scholar] [CrossRef]
- Lemley, J.; Bazrafkan, S.; Corcoran, P. Deep Learning for Consumer Devices and Services: Pushing the limits for machine learning, artificial intelligence, and computer vision. IEEE Consum. Electron. Mag. 2017, 6, 48–56. [Google Scholar] [CrossRef]
- Sidiropoulos, G.K.; Ouzounis, A.G.; Papakostas, G.A.; Sarafis, I.T.; Stamkos, A.; Solakis, G. Texture Analysis for Machine Learning Based Marble Tiles Sorting. In Proceedings of the 2021 IEEE 11th Annual Computing and Communication Workshop and Conference (CCWC), Las Vegas, NV, USA, 27–30 January 2021; pp. 0045–0051. [Google Scholar]
- Ouzounis, A.G.; Taxopoulos, G.; Papakostas, G.A.; Sarafis, I.T.; Stamkos, A.; Solakis, G. Marble Quality Assessment with Deep Learning Regression. In Proceedings of the 2021 Fifth International Conference on Intelligent Computing in Data Sciences (ICDS), Fez, Morocco, 20–22 October 2021; pp. 1–5. [Google Scholar]
- Sidiropoulos, G.K.; Ouzounis, A.G.; Papakostas, G.A.; Lampoglou, A.; Sarafis, I.T.; Stamkos, A.; Solakis, G. Hand-Crafted and Learned Feature Aggregation for Visual Marble Tiles Screening. J. Imaging 2022, 8, 191. [Google Scholar] [CrossRef] [PubMed]
- Mohan, A.; Poobal, S. Crack detection using image processing: A critical review and analysis. Alex. Eng. J. 2018, 57, 787–798. [Google Scholar] [CrossRef]
- Sari, Y.; Prakoso, P.B.; Baskara, A.R. Road Crack Detection using Support Vector Machine (SVM) and OTSU Algorithm. In Proceedings of the 2019 6th International Conference on Electric Vehicular Technology (ICEVT), Bali, Indonesia, 18–21 November 2019; pp. 349–354. [Google Scholar]
- Chen, C.; Seo, H.; Jun, C.H.; Zhao, Y. Pavement crack detection and classification based on fusion feature of LBP and PCA with SVM. Int. J. Pavement Eng. 2022, 23, 3274–3283. [Google Scholar] [CrossRef]
- Maurya, M.; Sadarang, J.; Panigrahi, I. Detection of crack in structure using dynamic analysis and artificial neural network. Eng. Solid Mech. 2020, 8, 285–300. [Google Scholar] [CrossRef]
- Kim, J.J.; Kim, A.-R.; Lee, S.-W. Artificial Neural Network-Based Automated Crack Detection and Analysis for the Inspection of Concrete Structures. Appl. Sci. 2020, 10, 8105. [Google Scholar] [CrossRef]
- Shi, Y.; Cui, L.; Qi, Z.; Meng, F.; Chen, Z. Automatic Road Crack Detection Using Random Structured Forests. IEEE Trans. Intell. Transp. Syst. 2016, 17, 3434–3445. [Google Scholar] [CrossRef]
- Peng, C.; Yang, M.; Zheng, Q.; Zhang, J.; Wang, D.; Yan, R.; Wang, J.; Li, B. A triple-thresholds pavement crack detection method leveraging random structured forest. Constr. Build. Mater. 2020, 263, 120080. [Google Scholar] [CrossRef]
- Hsieh, Y.-A.; Tsai, Y.J. Machine Learning for Crack Detection: Review and Model Performance Comparison. J. Comput. Civ. Eng. 2020, 34, 04020038. [Google Scholar] [CrossRef]
- Yang, C.; Chen, J.; Li, Z.; Huang, Y. Structural Crack Detection and Recognition Based on Deep Learning. Appl. Sci. 2021, 11, 2868. [Google Scholar] [CrossRef]
- Zheng, M.; Lei, Z.; Zhang, K. Intelligent detection of building cracks based on deep learning. Image Vis. Comput. 2020, 103, 103987. [Google Scholar] [CrossRef]
- Hamishebahar, Y.; Guan, H.; So, S.; Jo, J. A Comprehensive Review of Deep Learning-Based Crack Detection Approaches. Appl. Sci. 2022, 12, 1374. [Google Scholar] [CrossRef]
- Balcioglu, Y.S.; Sezen, B.; Gok, M.S.; Tunca, S. Image Processing with Deep Learning: Surface Defect Detection of Metal Gears through Deep Learning. Mater. Eval. 2022, 80, 44–53. [Google Scholar] [CrossRef]
- Yu, L.; He, S.; Liu, X.; Jiang, S.; Xiang, S. Intelligent Crack Detection and Quantification in the Concrete Bridge: A Deep Learning-Assisted Image Processing Approach. Adv. Civ. Eng. 2022, 2022, 1–15. [Google Scholar] [CrossRef]
- Lanzetta, M.; Tantussi, G. The Quality Control of Natural Materials: Defect Detection on Carrara Marble with an Artificial Vision System. In Proceedings of the 3rd Conference of the Italian Association of Mechanical Technology, Fisciano, Italy,, 17–19 September 1997; pp. 449–456. [Google Scholar]
- Sipko, E.; Kravchenko, O.; Karapetyan, A.; Plakasova, Z.; Gladka, M. The system recognizes surface defects of marble slabs based on segmentation methods. Sci. J. Astana IT Univ. 2020, 30, 50–59. [Google Scholar] [CrossRef]
- Akosman, S.A.; Oktem, M.; Moral, O.T.; Kilic, V. Deep Learning-based Semantic Segmentation for Crack Detection on Marbles. In Proceedings of the 2021 29th Signal Processing and Communications Applications Conference (SIU), Istanbul, Turkey, 9–11 June 2021; pp. 1–4. [Google Scholar]
- Bhattacharya, S.; Reddy Maddikunta, P.K.; Pham, Q.-V.; Gadekallu, T.R.; Krishnan, S.S.R.; Chowdhary, C.L.; Alazab, M.; Jalil Piran, M. Deep learning and medical image processing for coronavirus (COVID-19) pandemic: A survey. Sustain. Cities Soc. 2021, 65, 102589. [Google Scholar] [CrossRef]
- Hung, C.-C.; Song, E.; Lan, Y. Image Texture Analysis; Springer International Publishing: Cham, Switzerland, 2019; ISBN 978-3-030-13772-4. [Google Scholar]
- Bucher, K.; Grapes, R. Petrogenesis of Metamorphic Rocks; Springer: Berlin/Heidelberg, Germany, 2011; ISBN 978-3-540-74168-8. [Google Scholar]
- Icduygu, M.G.; Aktas, L.; Altan, M.C. Fabrication of Composite Tiles from Poly(Ethylene Terephthalate) (Pet) and Micro-Marble Particles Reinforced with Glass Fiber Mats: Comparison of Recycled and Commercial Resin. Polym. Polym. Compos. 2013, 21, 171–176. [Google Scholar] [CrossRef]
- Badouna, I.; Koutsovitis, P.; Karkalis, C.; Laskaridis, K.; Koukouzas, N.; Tyrologou, P.; Patronis, M.; Papatrechas, C.; Petrounias, P. Petrological and Geochemical Properties of Greek Carbonate Stones, Associated with Their Physico-Mechanical and Aesthetic Characteristics. Minerals 2020, 10, 507. [Google Scholar] [CrossRef]
- Rastogi, A. Kaggle: Marble Surface Anomaly Detection—2. Available online: https://www.kaggle.com/datasets/wardaddy24/marble-surface-anomaly-detection-2 (accessed on 12 September 2022).
- Russell, B.C.; Torralba, A.; Murphy, K.P.; Freeman, W.T. LabelMe: A Database and Web-Based Tool for Image Annotation. Int. J. Comput. Vis. 2008, 77, 157–173. [Google Scholar] [CrossRef]
- Zuiderveld, K. Contrast Limited Adaptive Histogram Equalization. In Graphics Gems; Elsevier: Amsterdam, The Netherlands, 1994; pp. 474–485. ISBN 0123361559. [Google Scholar]
- Buslaev, A.; Iglovikov, V.I.; Khvedchenya, E.; Parinov, A.; Druzhinin, M.; Kalinin, A.A. Albumentations: Fast and Flexible Image Augmentations. Information 2020, 11, 125. [Google Scholar] [CrossRef]
- Fan, L.; Wang, W.-C.; Zha, F.; Yan, J. Exploring New Backbone and Attention Module for Semantic Segmentation in Street Scenes. IEEE Access 2018, 6, 71566–71580. [Google Scholar] [CrossRef]
- Lin, T.-Y.; Dollar, P.; Girshick, R.; He, K.; Hariharan, B.; Belongie, S. Feature Pyramid Networks for Object Detection. In Proceedings of the 2017 IEEE Conference on Computer Vision and Pattern Recognition (CVPR), Honolulu, HI, USA, 21–26 July 2017; pp. 2117–2125. [Google Scholar]
- Chaurasia, A.; Culurciello, E. LinkNet: Exploiting Encoder Representations for Efficient Semantic Segmentation. In Proceedings of the 2017 IEEE Visual Communications and Image Processing (VCIP), St. Petersburg, FL, USA, 10–13 December 2017; pp. 1–4. [Google Scholar]
- Zhao, H.; Shi, J.; Qi, X.; Wang, X.; Jia, J. Pyramid Scene Parsing Network. In Proceedings of the 2017 IEEE Conference on Computer Vision and Pattern Recognition (CVPR), Honolulu, HI, USA, 21–26 July 2017; pp. 6230–6239. [Google Scholar]
- Ronneberger, O.; Fischer, P.; Brox, T. U-Net: Convolutional Networks for Biomedical Image Segmentation. In Lecture Notes in Computer Science (Including Subseries Lecture Notes in Artificial Intelligence and Lecture Notes in Bioinformatics); Springer: Cham, Switzerland, 2015; pp. 234–241. ISBN 9783319245737. [Google Scholar]
- Mao, L.; Ren, F.Z.; Yang, D.W.; Zhang, R.B. Two-way feature pyramid network for panoptic segmentation. Jilin Daxue Xuebao (Gongxueban)/J. Jilin Univ. Eng. Technol. Ed. 2022, 52, 657–665. [Google Scholar]
- Cai, J.-X.; Mu, T.-J.; Lai, Y.-K.; Hu, S.-M. LinkNet: 2D-3D linked multi-modal network for online semantic segmentation of RGB-D videos. Comput. Graph. 2021, 98, 37–47. [Google Scholar] [CrossRef]
- Zhang, R.; Chen, J.; Feng, L.; Li, S.; Yang, W.; Guo, D. A Refined Pyramid Scene Parsing Network for Polarimetric SAR Image Semantic Segmentation in Agricultural Areas. IEEE Geosci. Remote Sens. Lett. 2022, 19, 1–5. [Google Scholar] [CrossRef]
- Siddique, N.; Paheding, S.; Elkin, C.P.; Devabhaktuni, V. U-Net and Its Variants for Medical Image Segmentation: A Review of Theory and Applications. IEEE Access 2021, 9, 82031–82057. [Google Scholar] [CrossRef]
- Liu, Y. DeepCrack. Available online: https://github.com/yhlleo/DeepCrack (accessed on 14 September 2022).
- Liu, Y.; Yao, J.; Lu, X.; Xie, R.; Li, L. DeepCrack: A deep hierarchical feature learning architecture for crack segmentation. Neurocomputing 2019, 338, 139–153. [Google Scholar] [CrossRef]
- Elharrouss, O.; Akbari, Y.; Almaadeed, N.; Al-Maadeed, S. Backbones-Review: Feature Extraction Networks for Deep Learning and Deep Reinforcement Learning Approaches. arXiv 2022, arXiv:2206.08016. [Google Scholar]
- Benali Amjoud, A.; Amrouch, M. Convolutional Neural Networks Backbones for Object Detection. In Lecture Notes in Computer Science (Including Subseries Lecture Notes in Artificial Intelligence and Lecture Notes in Bioinformatics); Springer: Cham, Switzerland, 2020; pp. 282–289. ISBN 9783030519346. [Google Scholar]
- Jadon, S. A Survey of Loss Functions for Semantic Segmentation. In Proceedings of the 2020 IEEE Conference on Computational Intelligence in Bioinformatics and Computational Biology (CIBCB), Viña del Mar, Chile, 27–29 October 2020; pp. 1–7. [Google Scholar]
- Yeung, M.; Sala, E.; Schönlieb, C.-B.; Rundo, L. Unified Focal loss: Generalising Dice and cross entropy-based losses to handle class imbalanced medical image segmentation. Comput. Med. Imaging Graph. 2022, 95, 102026. [Google Scholar] [CrossRef]
- Ketkar, N. Introduction to Keras. In Deep Learning with Python; Apress: Berkeley, CA, USA, 2017; pp. 97–111. [Google Scholar]
- Monteiro, F.C.; Campilho, A.C. Performance Evaluation of Image Segmentation. In Lecture Notes in Computer Science (Including Subseries Lecture Notes in Artificial Intelligence and Lecture Notes in Bioinformatics); Springer: Cham, Switzerland, 2006; pp. 248–259. ISBN 3540448918. [Google Scholar]
- Jiang, Y.; Chen, L.; Zhang, H.; Xiao, X. Breast cancer histopathological image classification using convolutional neural networks with small SE-ResNet module. PLoS ONE 2019, 14, e0214587. [Google Scholar] [CrossRef] [PubMed]
- Hu, J.; Shen, L.; Albanie, S.; Sun, G.; Wu, E. Squeeze-and-Excitation Networks. IEEE Trans. Pattern Anal. Mach. Intell. 2020, 42, 2011–2023. [Google Scholar] [CrossRef] [PubMed]
- Hu, J.; Shen, L.; Sun, G. Squeeze-and-Excitation Networks. In Proceedings of the 2018 IEEE/CVF Conference on Computer Vision and Pattern Recognition, Salt Lake City, UT, USA, 18–23 June 2018; pp. 7132–7141. [Google Scholar]
- Yang, J.; Wang, W.; Lin, G.; Li, Q.; Sun, Y.; Sun, Y. Infrared Thermal Imaging-Based Crack Detection Using Deep Learning. IEEE Access 2019, 7, 182060–182077. [Google Scholar] [CrossRef]
Publisher’s Note: MDPI stays neutral with regard to jurisdictional claims in published maps and institutional affiliations. |
© 2022 by the authors. Licensee MDPI, Basel, Switzerland. This article is an open access article distributed under the terms and conditions of the Creative Commons Attribution (CC BY) license (https://creativecommons.org/licenses/by/4.0/).