Article

Typhoon Tracks Prediction with ConvLSTM Fused Reanalysis Data

College of Information Technology Shanghai Ocean University, Shanghai 201308, China
*
Author to whom correspondence should be addressed.
Electronics 2022, 11(20), 3279; https://doi.org/10.3390/electronics11203279
Submission received: 9 September 2022 / Revised: 30 September 2022 / Accepted: 1 October 2022 / Published: 12 October 2022
(This article belongs to the Special Issue State-of-the-Art Artificial Intelligence Technology)

Abstract

:
Typhoon occurrences pose a great threat to people’s lives and property; therefore, it is important to predict typhoon tracks accurately for disaster prevention and reduction. In recent years, research using traditional machine learning methods has struggled to include temporal and spatial features. Moreover, research that has been conducted using satellite images only does not consider the influence of physical factors on typhoon movement; therefore, this paper proposes to add a convolutional layer to the Convolutional LSTM (ConvLSTM) model to improve the ability of the model to extract images. The previous positions of the typhoon’s center are marked on subsequent reanalysis images. The subsequent coordinates of the typhoon’s center are found by fitting the predicted coordinates of each physical variable. The research method in this paper required selecting the physical variables group which was most correlated with the direction and distance of the typhoon movement from 11 physical variables; this was achieved using Canonical Correlation Analysis (CCA) and Grey Relation Analysis (GRA). Then, reanalysis data is transformed into images and a continuous series of reanalysis image sequences is inputted into the ConvLSTM model so that it can make predictions. The mean absolute error of distance used for the ERA5 dataset, using the method proposed, was 54.69 km; thus, the validity of the model was proven.

1. Introduction

Typhoons can bring rich fisheries and freshwater resources to local people, and they can maintain the thermal balance of the earth; however, typhoons can also bring storms and secondary disasters, such as mountain torrents, mudslides, and storm surges, which threaten people’s daily lives, and their safety, and their property [1]. In recent years, typhoons have become increasingly frequent, causing significant damage around the world, because of global warming [2]. For example, Typhoon Haiyan struck the Philippines in 2013, killing 6245 people, injuring 28,626, leaving 1039 missing, and causing USD 776 million in economic damage [3]; therefore, it is necessary to predict typhoon tracks accurately, especially in disaster prevention and mitigation, which can help people prepare for typhoons and secondary disasters in advance, thus reducing typhoon-related casualties to a certain extent.
The traditional prediction methods mainly use the numerical model and the statistical model; for example, the Hong Kong Observatory predicted the coordinates of a typhoon’s center, 48 h into the future, using the WRF model, the mean error of which was 107 km [4]. Shiwen Wang et al. predicted typhoon trajectories using a nested numerical model with a high horizontal resolution and a complex physical package [5]. The accuracy obtained from using traditional methods is significant; however, these methods need to calculate a large number of complex mathematical and physical equation models using data, which necessitates high computing performance and exacting hardware requirements, and they are inefficient in terms of time.
To solve the abovementioned disadvantages concerning the high hardware requirements and low computational efficiency of traditional methods, many researchers are currently predicting typhoon tracks using machine learning methods. Thu Zar Hsan et al. combined Support Vector Machines (SVM) with Polynomial Regression to predict typhoon tracks [6]. Jinkai Tan et al. proposed the establishment of a Gradient Boosting Decision Tree (GBDT) nonlinear model to forecast typhoon tracks [7]; however, it is difficult for traditional machine learning methods to learn the temporal and spatial features of data [8], and thus, other researchers have selected the Recurrent Neural Network (RNN) and Long Short-Term Memory (LSTM) prediction models [9]. In addition, Mario Rüttgers et al. mentioned that their dataset of research comprised satellite images of typhoons which marked the position of the typhoon’s center. Moreover, Generative Adversarial Networks (GAN) were used to generate satellite cloud images that showed the predicted movement of the typhoon by inputting time series which consisted of satellite images of the typhoon at four previous moments in time [10]. As well as the abovementioned models, researchers also proposed predicting typhoon tracks with ConvLSTM [11]. Seungkyun Hong et al. used satellite images of typhoons in a dataset and detected the center of the typhoons by using the joint inception units of Convolutional Neural Networks (CNN) [12]. Compared with CNN, ConvLSTM can learn the temporal features of data, and compared with networks such as RNN and LSTM, it can learn certain features in images. Moreover, compared with GAN, the predicted results of ConvLSTM are more stable; therefore, ConvLSTM is suitable for predicting the time series of images. Compared with previous research, our study intends to further improve the performance of the ConvLSTM model in terms of its ability to predict typhoon tracks. We first selected the dominant physical factors group through correlation analysis, then, we took their reanalysis images, which marked the previous points of the typhoon’s center, and inputted them into the ConvLSTM model. Finally, we fitted the prediction results of the selected physical factors in order to predict only one typhoon track in a small area, rather than predict several typhoon tracks in a large area.
Furthermore, when using longitudinal and latitudinal coordinates to predict typhoon tracks, as well as satellite images, the influence of physical factors on typhoon tracks is ignored. This is because some physical factors have a greater effect on typhoon movement; therefore, in recent years, when choosing data, researchers have begun to input reanalysis data into the model in order to learn the temporal and spatial features from physical variables related to typhoon tracks. Two reanalysis databases that have been used more frequently are ERA-Interim and ERA5, which were generated by a series of ECMWF project studies [13]. Mario Rüttgers et al. combined typhoon satellite images with reanalysis images to predict typhoon tracks using their previous research [10]. Sophie Giffard-Roisin et al. trained reanalysis images of wind speed and pressure, typhoon tracks, maximum wind speed, and so on, using CNN and the Neural Network (NN), and they fused the outputs to obtain the future coordinates of the typhoon’s center [14]. In addition, as the convolutional layer can extract more features that are suitable for images than matrix data, in this study, the reanalysis data will be converted into heat maps and then inputted into the network model for prediction.
When researchers find the physical variables related to typhoon movement, reanalysis data need to be selected using correlation analysis methods. JIE LIAN et al. used the Granger Causality Test, Autocorrelation Function (ACF), and Partial Autocorrelation Function (PACF) to select the correlated physical variables [15]. The application condition of the Granger Causality Test requires the time series to be stationary; however, the typhoon tracks may suddenly turn, and the path sequences may not meet the condition of stationarity. Jian Peng et al. sought factors which had an influence on land surface temperature using Stepwise Multiple Linear Regression (SMLR) and Wavelet Coherence Analysis [16]. Nevertheless, there may be no linear relationship between typhoon tracks and physical variables; therefore, it is not reasonable to analyze the correlation between typhoon tracks and physical variables using SMLR. Ruipu Tan et al. proposed evaluating disasters caused by typhoons using a decision method based on entropic information and GRA [17]. Zhen Zheng et al. used GRA to denoise the images, then, they adaptively converted them into binary images, and detected the edge parts of the images using the morphological calculation model [18]. The data concerning the dependent variables in GRA needs to be one-dimensional, whereas the data describing typhoon movement when analyzing the correlation between typhoon tracks and physical variables is two-dimensional; therefore, the correlation cannot be directly analyzed by GRA. In addition, K. Fekadu analyzed and predicted seasonal changes with regard to rainfall in Ethiopia using CCA; high dimensional data can be reduced using CCA [19].
Combining the abovementioned analysis of our predecessors’ research methods, this paper proposes adding a convolutional layer to the units of ConvLSTM in order to improve the ability of the model to extract more features from the images, and to mark the previous positions of a typhoon’s center on images. This enables the attainment of the predicted coordinates of a typhoon’s center, which, as a result of image processing methods, correspond to each physical variable; these physical variables are fitted in order to obtain the predicted coordinates. This paper uses the longitudinal and latitudinal coordinates of typhoons, along with reanalysis data that comprises a dataset, to predict typhoon tracks. The coordinates of typhoon tracks are converted to show the direction that the typhoon is moving in, and the distance travelled. CCA and GRA were combined to analyze correlations, so as to screen out the most correlated physical variables group, convert their data into reanalysis images, and mark the previous positions of the typhoon’s center on the images. The marked reanalysis image series, containing the physical variables group, was inputted into ConvLSTM to enable predictions. Then, according to the relative position of the marked points, which show the predicted path of the typhoon’s center on the images and the true, previous coordinates of the typhoon’s center, the coordinates of the typhoon’s center are calculated using a corresponding image containing the predicted physical variables. The final predictions for the longitudinal and latitudinal coordinates of the typhoon’s center are calculated by fitting the coordinates of the typhoon’s center to predicted reanalysis images of each corresponding physical variable.
The structure of this paper is as follows. The research results of relative theories are introduced in Section 2.1. The establishment of the dataset, including data acquisition and data processing, is explained in Section 2.2. The structure of the ConvLSTM model and our suggested improvements are described in Section 2.3. Section 3 notes the experiment’s results, and compares them with the work and results of other researchers. The discussion and conclusion of the paper are noted in Section 4 and Section 5.

2. Materials and Methods

2.1. Related Work

2.1.1. ConvLSTM

The ConvLSTM model is a variant of the LSTM model. Its inputs and outputs take the form of multi-dimensional matrixes, which are convenient for extracting and learning the spatial features of images. The ConvLSTM unit in the ConvLSTM model first extracts the spatial features of inputs using a convolution operation. Then, the results of the feature extraction are inputted into the convolution operation of each gate in the unit in order to learn the temporal features of input data; the operation’s method is shown in Formula (1) [20]. Stacking many ConvLSTM layers forms the coding–prediction structure of the ConvLSTM model [21].
i t = σ ( W xi x t + W hi h t - 1 + W ci c t - 1 + b i ) , f t = σ ( W xf x t + W hf h t - 1 + W cf c t - 1 + b f ) , c t = f t c t - 1 + i t tan h ( W xc x t + W hc h t - 1 + b c ) , o t = σ ( W xo x t + W ho h t - 1 + W co c t + b o ) , h t = o t tan h ( c t ) ,

2.1.2. Canonical Correlation Analysis (CCA)

CCA is a statistical method that uses linear correlation analysis, which mainly calculates the linear relationship between multiple variables, and is also a main method for the dimensionality reduction of high-dimensional data [22]. Assuming that there are two groups of multivariable, X and Y, vectors WX and WY will be found using the CCA algorithm to maximize the correlation coefficient between XTWX and YTWY, so as to achieve a dimensionality reduction of multivariable data. The correlation coefficient between XTWX and YTWY is calculated using the following formula [23]:
max W X ,   W Y ρ = E [ x T y ] E [ x T x ] E [ y T y ] = E [ W X T XY T W Y ] E [ W X T XX T W X ] E [ W Y T YY T W Y ] ,
However, Canonical Correlation Analysis (CCA) requires that two groups of data, X and Y, should have corresponding relations; therefore, the data which will be analyzed by CCA must be pairwise. If the dataset is divided into several classes, the data in each class will be separated. Assuming that the data for X and Y are in one class, the correlation between WX and WY in different classes will be calculated with some difficulty; therefore, it is hard to consider relationships between classes in CCA.

2.1.3. Grey Relation Analysis (GRA)

The Grey Relation Analysis algorithm is an important component of Gray Theory, which can achieve similarities and differences, as well as correlations between series, by analyzing the trends of the series [24]. The successful implementation of the Grey Relation Analysis algorithm includes the following four main steps [25]:
(1) Determining the reference sequence and comparison sequences.
(2) Normalizing the data. Due to the differences between the meanings of each variable in the dataset, there are differences in the data range; however, the differences in the range do not show that their properties are different, which is the result of the different dimensions of different variables. Therefore, data normalization, also known as the state of being dimensionless, is generally required before correlation analysis.
(3) Calculating the correlation coefficient is shown in Formula (3).
ξ i ( k ) = min j i   min k x 0 * ( k ) - x j * ( k ) + ρ max j i   max k x 0 * ( k ) - x j * ( k ) x 0 * ( k ) - x i * ( k ) + ρ max j i   max k x 0 * ( k ) - x j * ( k ) ,
where ρ is the distinguishing coefficient, generally ranging between (0, 1); x 0 * ( k ) is the reference sequence; and x i * ( k ) is the comparison sequence.
(4) Calculating the correlation degree, that is, calculating the average value of the correlation coefficients, is shown in formula (4). The greater the correlation degree, and the greater the correlation between the reference sequence and the comparison sequence.
r i = 1 n k = 1 n ξ i ( k ) ,

2.2. Datasets

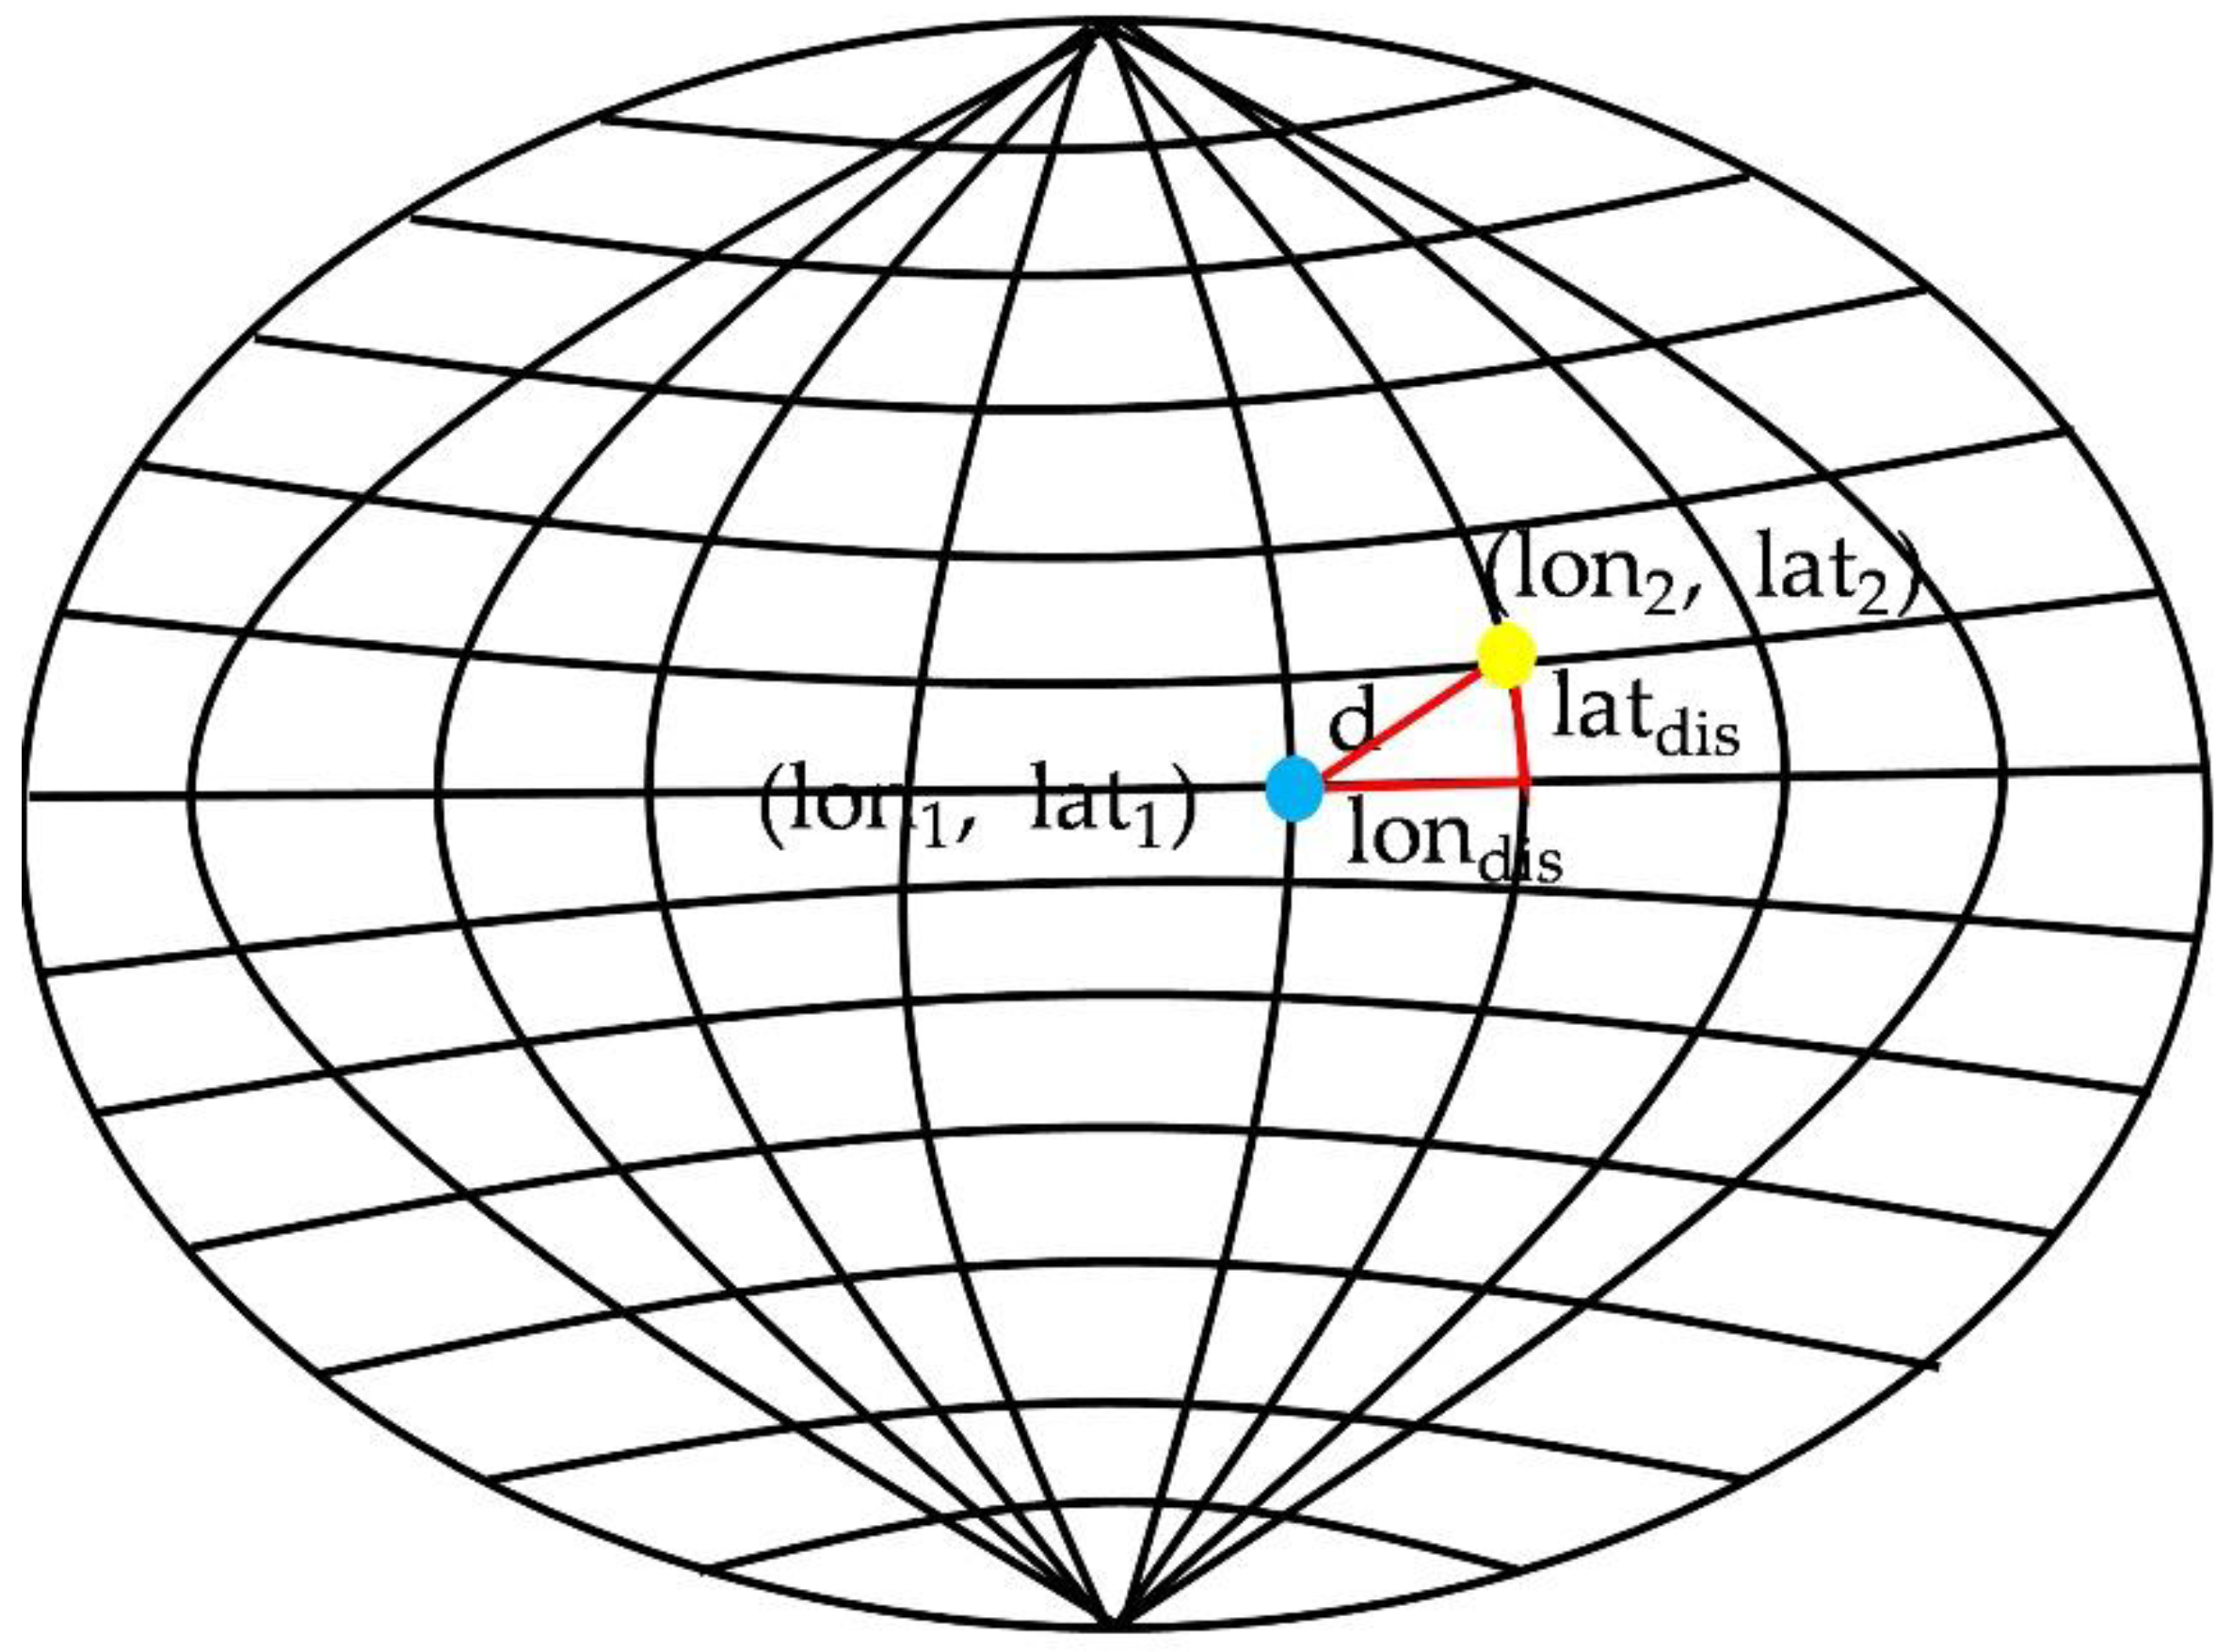
2.2.1. Coordinates of the Typhoon’s Center

The longitudinal and latitudinal coordinate data of the typhoon center used in this paper came from the Digital Typhoon dataset of the Japan National Institute of Informatics. The dataset includes typhoon satellite images, longitudinal and latitudinal coordinates of typhoon tracks, wind speed, and so on [26]. The typhoon’s center is taken as the center of the satellite image of the typhoon; indeed, the Lambert Aziumuthal Equal-area Projection method is used to project an image of a two-dimensional plane depicting a 2600 km × 2600 km area of the Earth, with the typhoon’s center as the center of the image [27]. The dataset used in this paper includes the longitudinal and latitudinal coordinate data of 142 typhoons from 2014 to 2020, with a time step of 6 h.

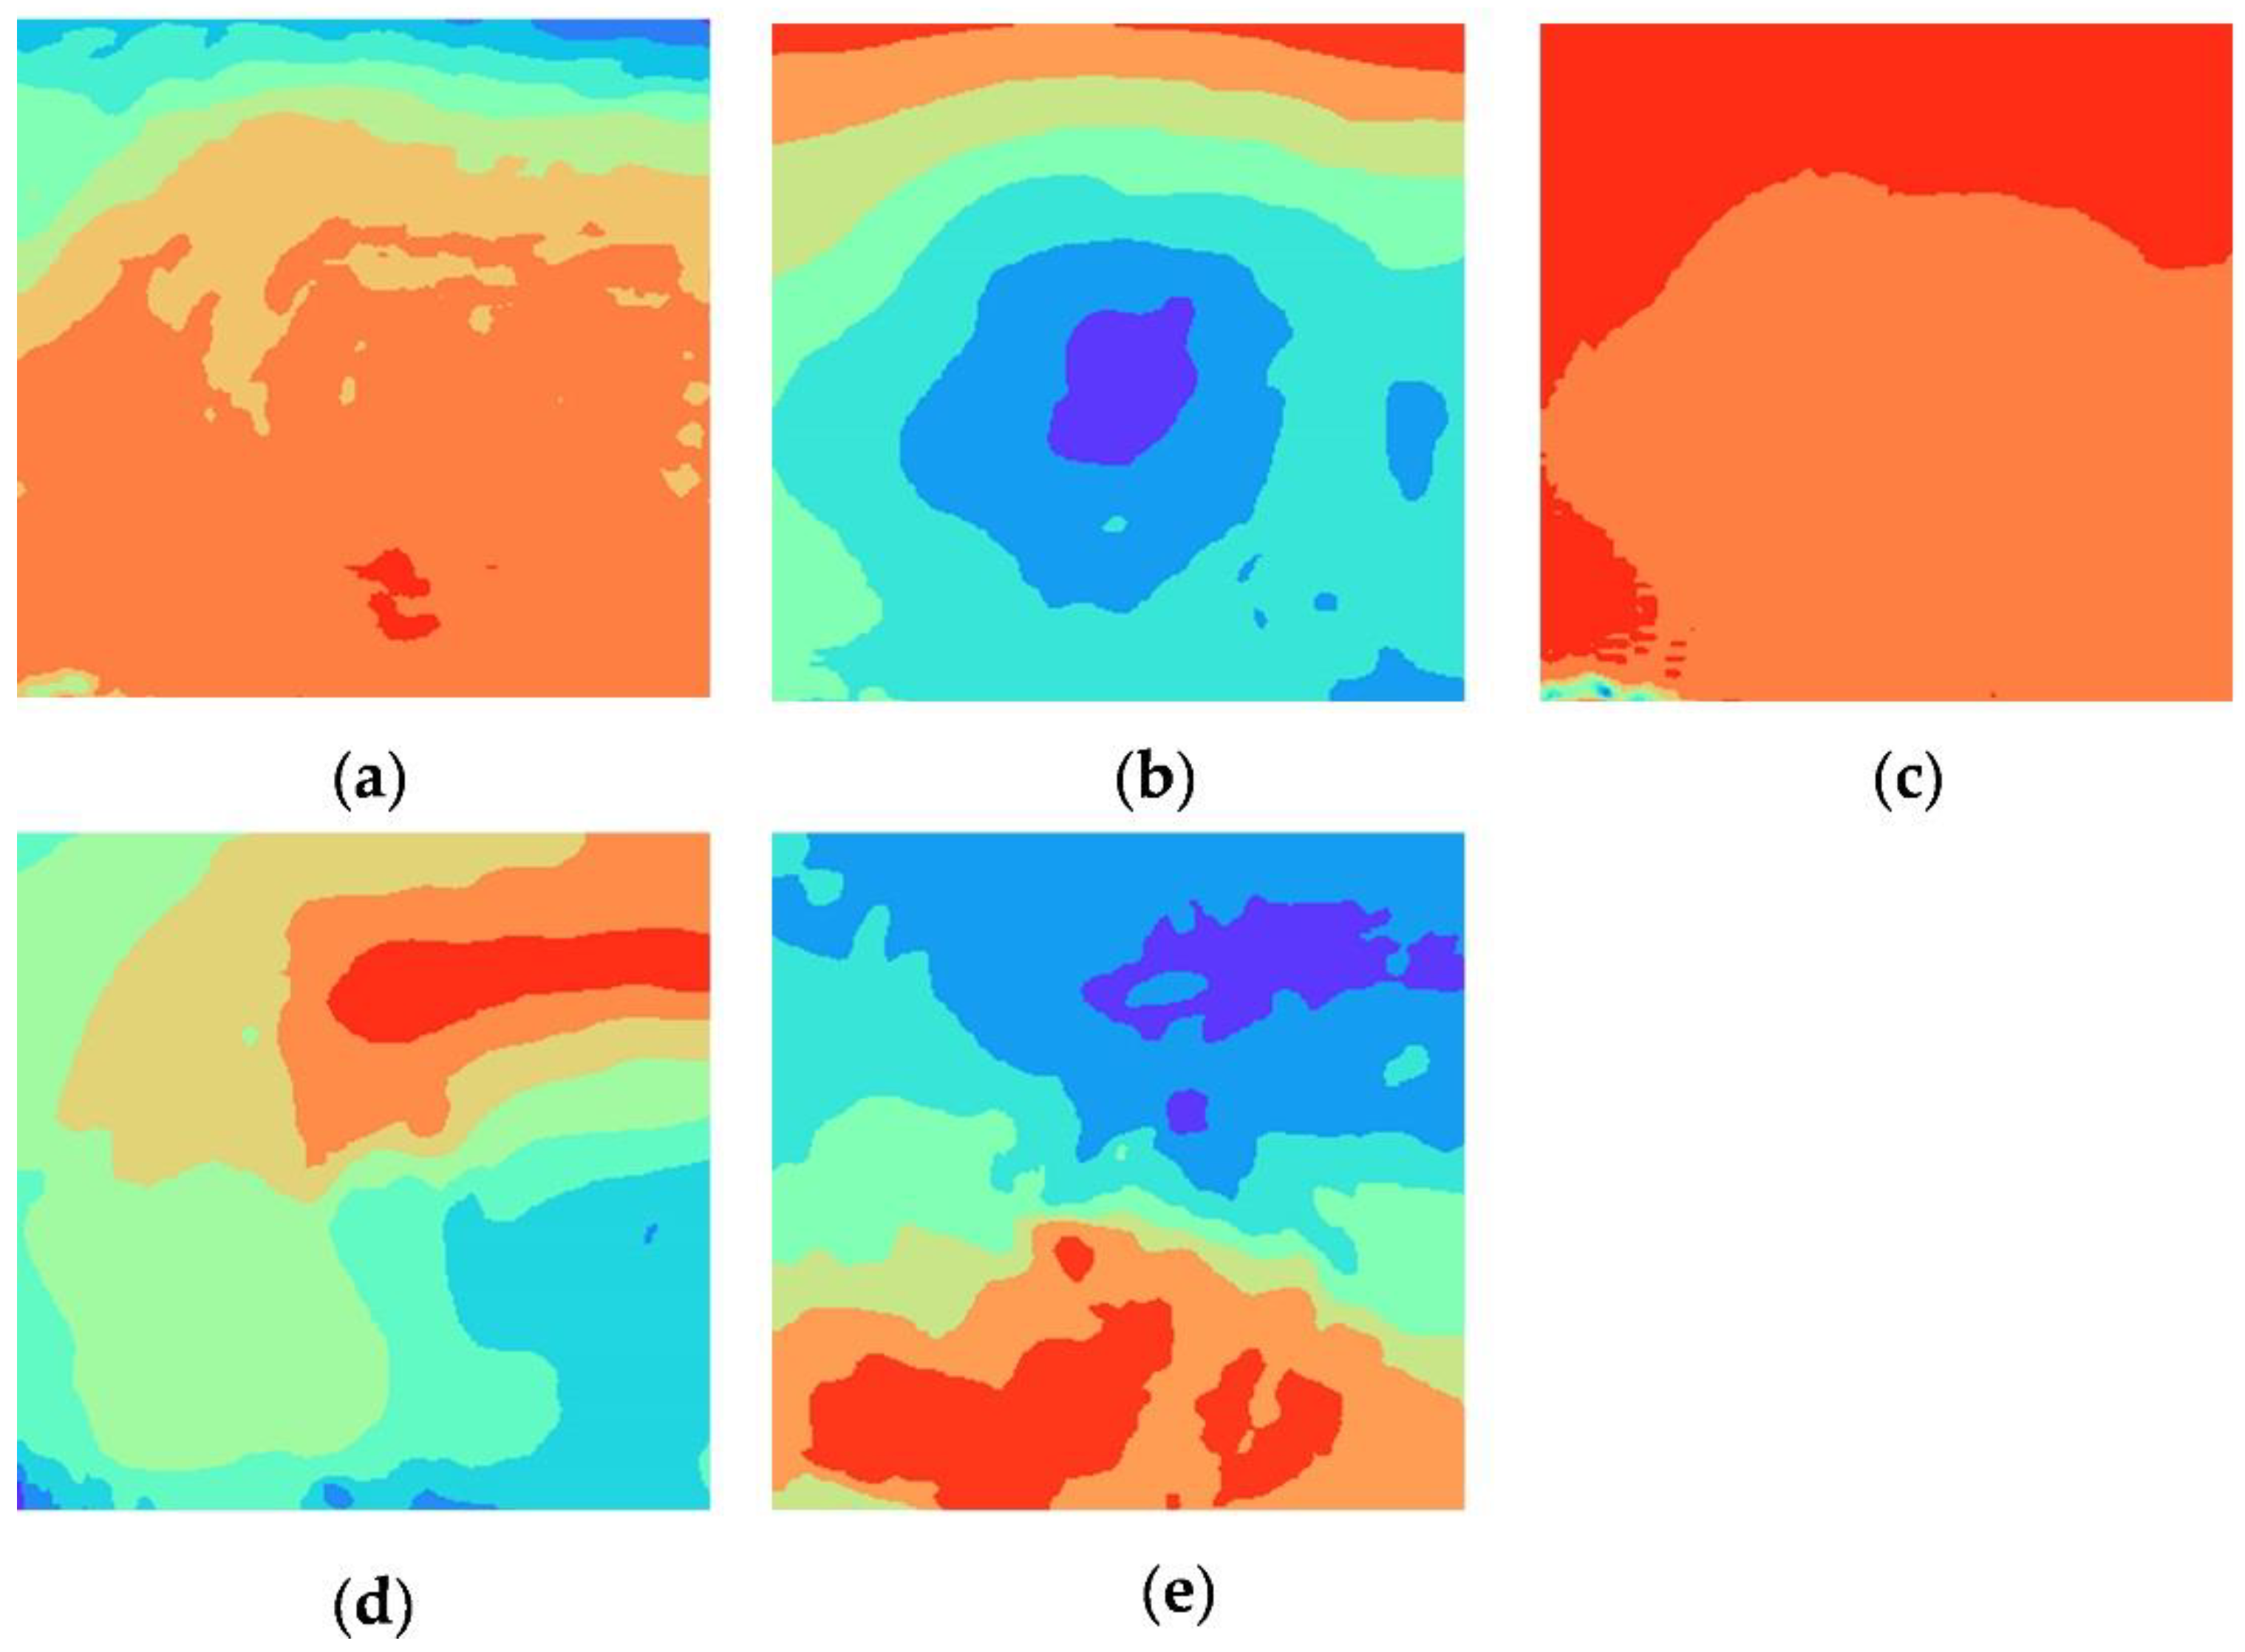
2.2.2. Reanalysis Data

The reanalysis data used in this paper are from the ERA5 database’s hourly data on pressure levels, specifically, the 1979 to present dataset. Compared with ERA-Interim, which is also widely used, ERA5 provides a finer spatial and temporal resolution and more timely data updates [28]. Reanalysis data in the dataset used in this paper includes 11 common variables from 2014 to 2020, from the ERA5 dataset. These variables include: 10 m u-component of wind, 10 m v-component of wind, 2 m dewpoint temperature, 2 m temperature, mean sea level pressure, mean wave direction, mean wave period, sea surface temperature, significant height of combined wind waves and swell, surface pressure, and total precipitation. Corresponding with the longitudinal and latitudinal coordinates of the typhoon, the time step of the reanalysis data is 6 h, the area includes the West North Pacific, and the spatial resolution of the data is 0.125° × 0.125°.

2.2.3. Data Processing

Part of the data in the dataset may be missing, thus, when preliminarily screening the data, the missing typhoon data was deleted. In addition, the short typhoon sequences were also deleted to avoid affecting the accuracy of the correlation analysis, and moreover, because short typhoon sequences cannot be predicted.
Furthermore, the precision of the longitudinal and latitudinal coordinates of the typhoon’s center in the dataset is accurate to one decimal point; therefore, interpolation is carried out for the longitude and latitude of the spatial resolution of the reanalysis data, as well as the values of the physical variables in the region, to ensure that the accuracy of the reanalysis data is also accurate to one decimal point. This ensures that the reanalysis data correspond with the precision of the longitudinal and latitudinal coordinates of the typhoon’s center. By calculating the longitude and latitude within the range of 2600 km in length and width, with the center of each typhoon being the ‘typhoon region’, the longitudinal, latitudinal, and physical variable values in this region are intercepted from the reanalysis data.
After data processing, the dataset in this paper consists of 110 typhoon processes, including 2244 typhoon sequences in the training set and 32 typhoon processes in the test set. It also includes 562 typhoon sequences, in which 11 typhoon points are included in each sequence, and the 11th moment is the ‘ground truth’.

2.3. ConvLSTM Establishment and Prediction

The method used in this paper first involves converting the coordinates of a typhoon’s center to moving angle and distance. The correlation between the physical variable groups and moving angle and distance is analyzed by combining CCA with the GRA algorithm to screen out the most correlated physical variables in a group. Then, reanalysis images are transformed from the reanalysis data of the physical variables group, marking the previous positions of the typhoon’s center on the images. Cascading reanalysis images of every physical variable are then shown in a moment, after which, reanalysis images at ten moments are inputted into the ConvLSTM model as a time series, thus enabling it to make predictions; the model is able to predict images that correspond with every physical variable for each subsequent moment. Subsequent coordinates denoting the typhoon’s center correspond with each physical variable; they are calculated by combining the related positions between marked points on a predicted image, the center of the image, and the truth of the typhoon center’s coordinates in a previous moment, fitting them using the sixth degree polynomial to obtain a result that predicts the future coordinates of the typhoon’s center.

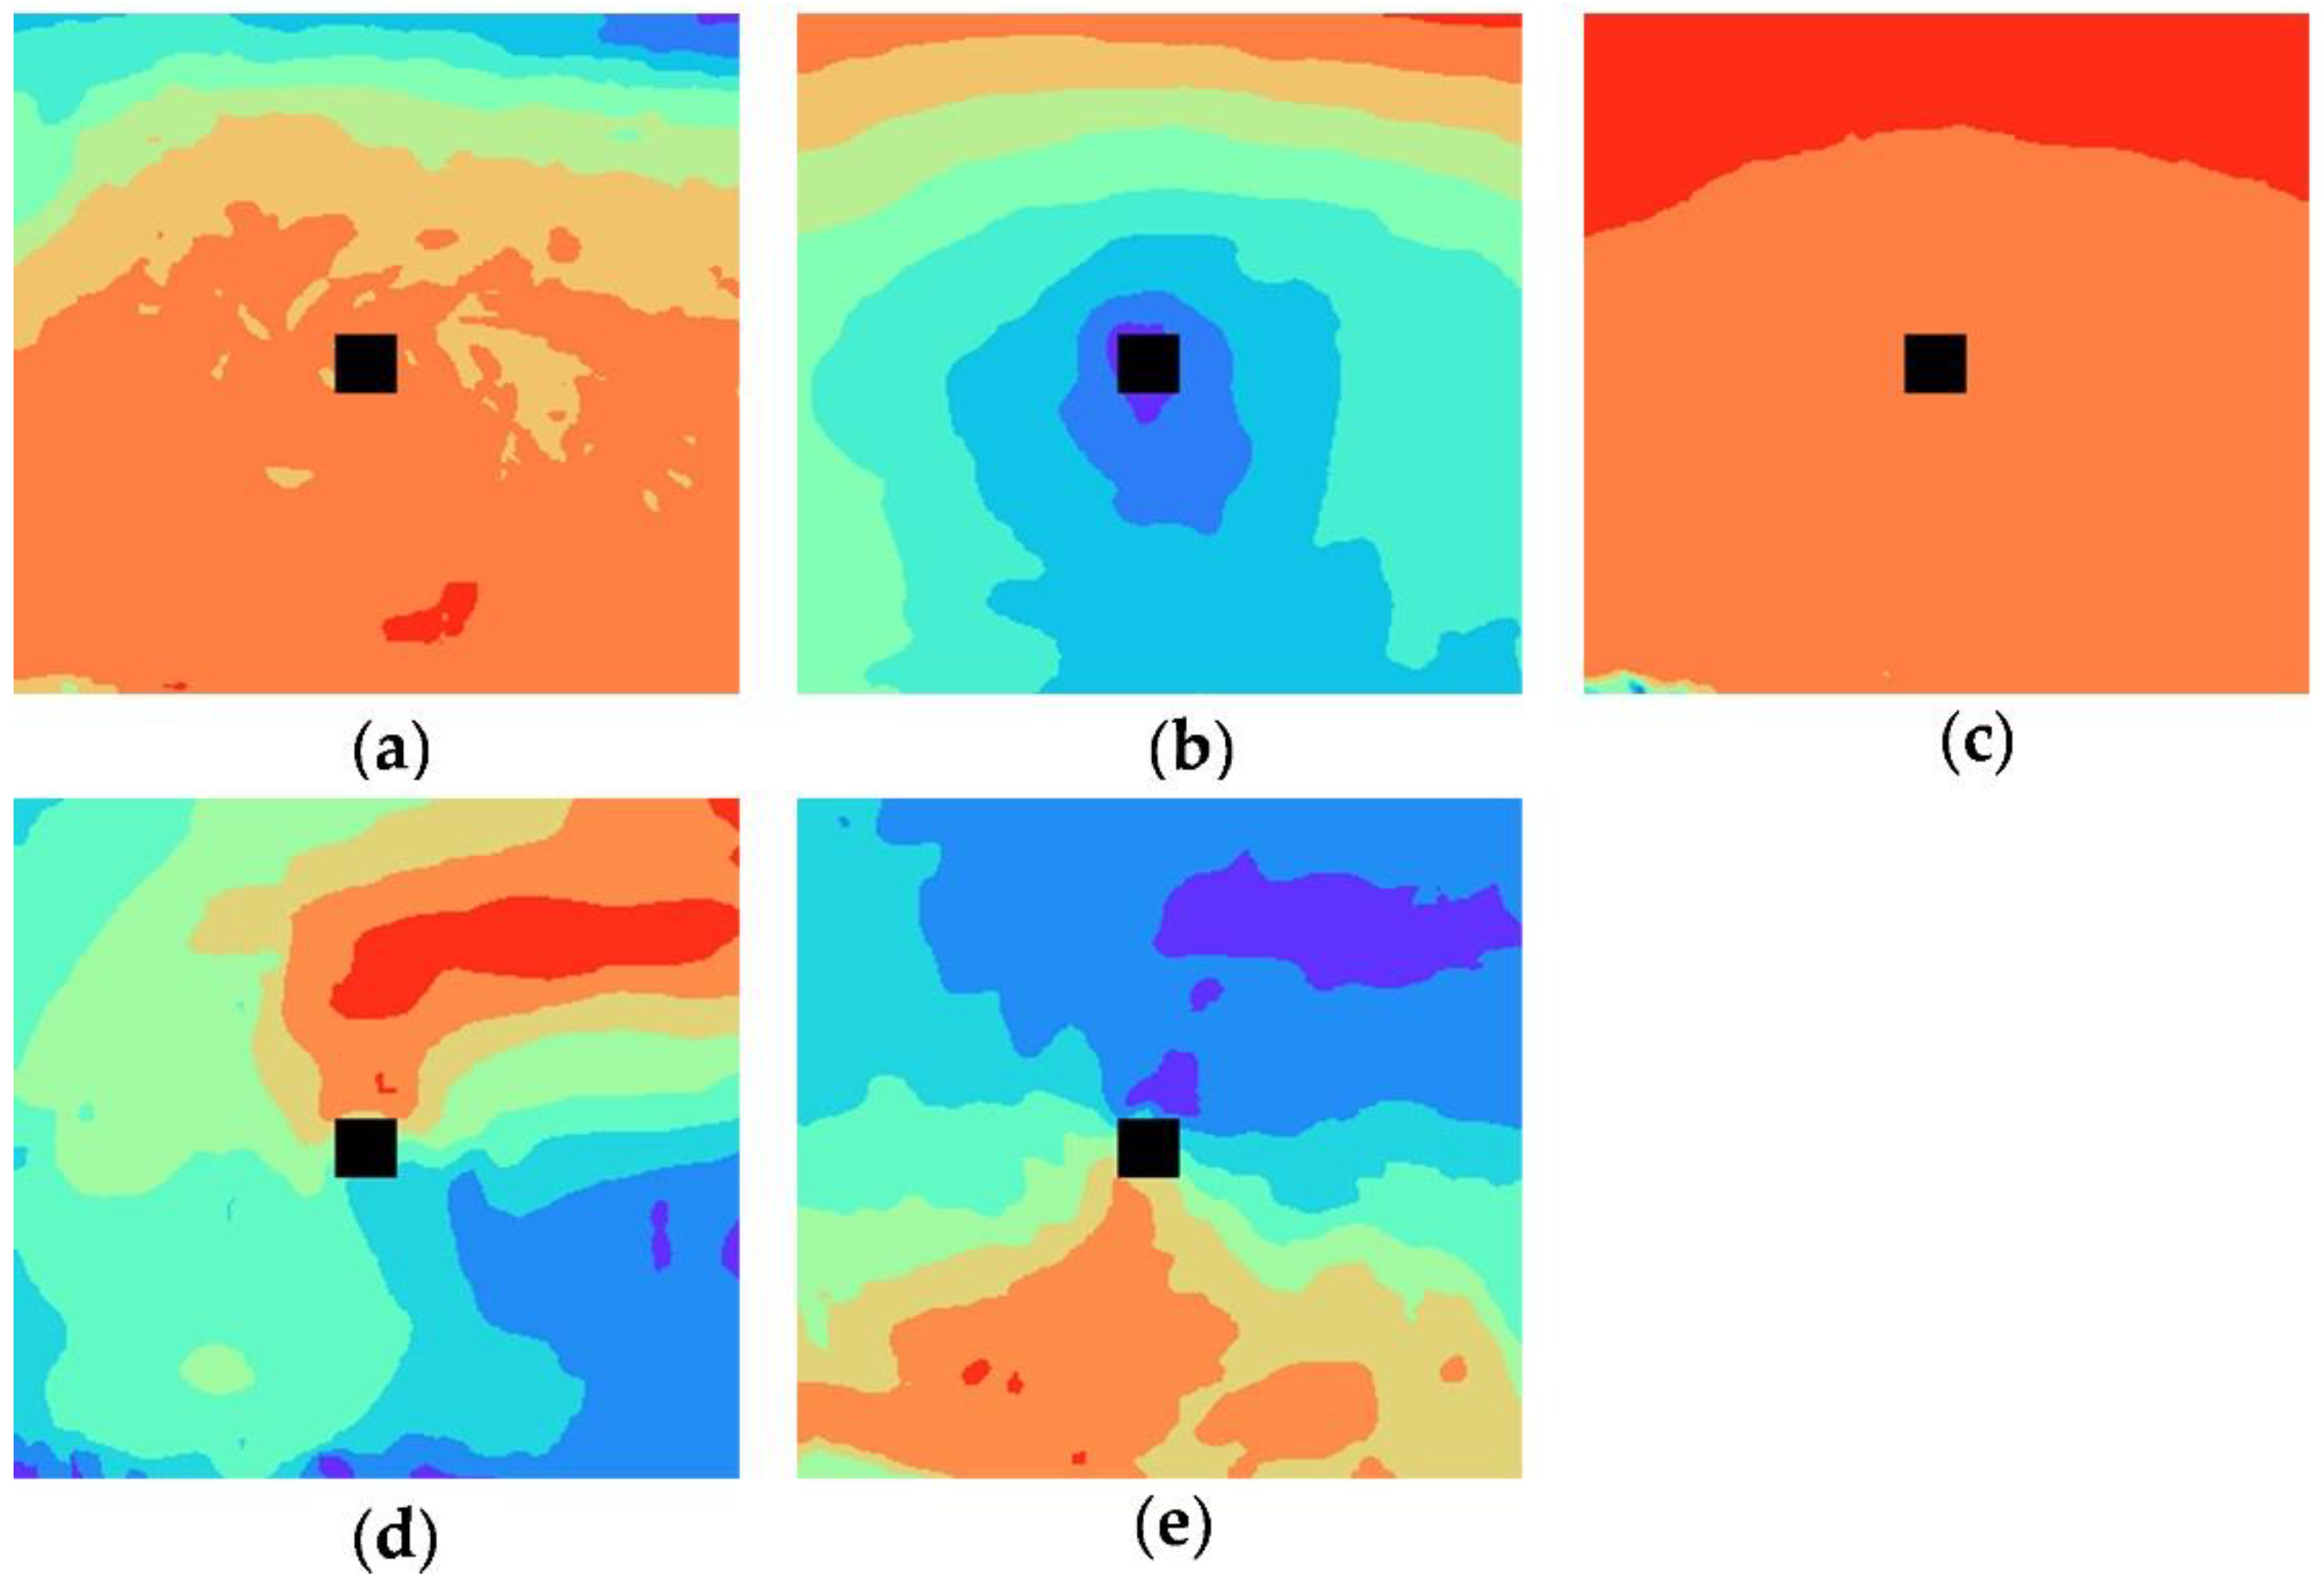
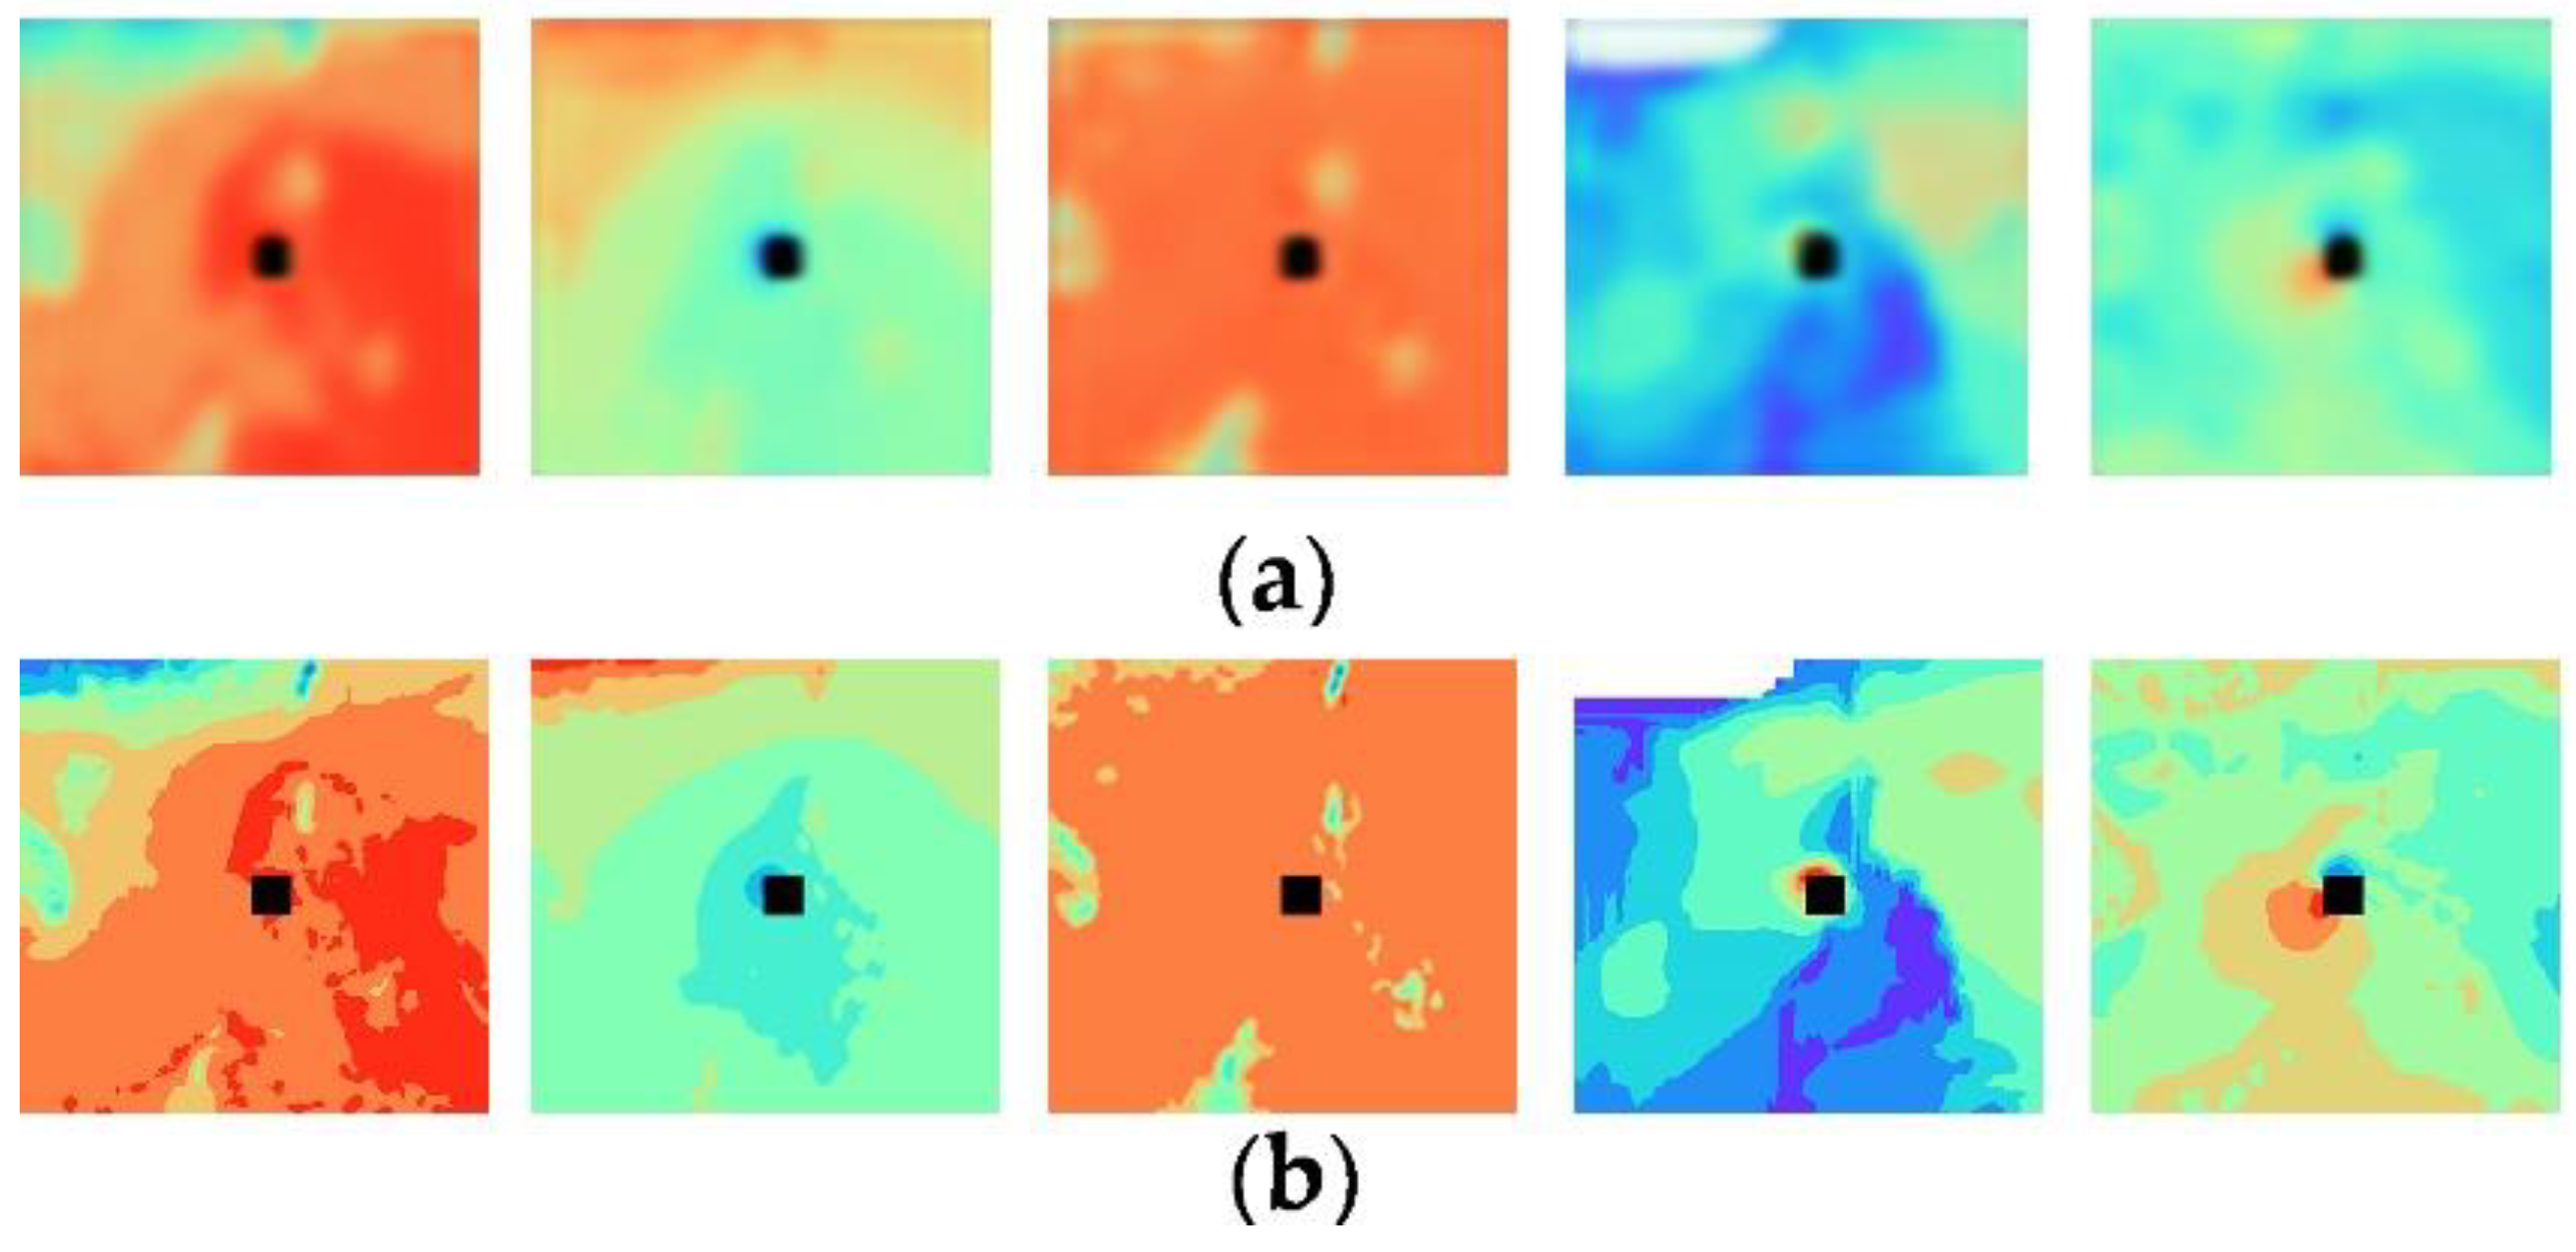
2.3.1. Correlation Analysis of Reanalysis Data

Not all of the 11 reanalysis physical variables in the dataset are related to typhoon tracks; therefore, the group with the highest correlation coefficient valueof physical variables is selected using correlation analysis via reanalysis data. Using the previous coordinates of a typhoon’s center as an origin point, the angle between the longitude of a typhoon’s center in a previous moment, in the direction of the northern hemisphere, and the line of the previous and subsequent coordinates of the typhoon’s center (0° < angle < 360°) (noting the spherical distance (d) between the typhoon’s centers during two continuous moments), corresponds with the values of certain physical variables in a previous moment, as well as the position of the typhoon’s center in the next moment; this is convenient for correlation reanalysis. The method for calculating the moving angle (angle) and distance (d) of a typhoon is as follows, in degrees and km, respectively:
The Haversine formula [29], where R is the radius of the Earth, and the value is 6371 km:
d = 2 sin - 1 sin ( lat 2 - lat 1 2 × π 180 ) 2 + cos ( lat 1 × π 180 ) cos ( lat 2 × π 180 ) sin ( lon 2 - lon 1 2 × π 180 ) 2 × R ,
When the typhoon’s center moves to the upper right corner of a previous position held by the typhoon’s center, the moving angle is calculated:
angle = cos - 1 ( | lat dis | d ) × 180 π ,
When the typhoon’s center moves to the right lower corner of a previous position held by the typhoon’s center, the moving angle is calculated:
angle = cos - 1 ( | lon dis | d ) × 180 π + 90 ,
When the typhoon center moves to the left lower corner of a previous position held by the typhoon’s center, the moving angle is calculated:
angle = cos - 1 ( | lat dis | d ) × 180 π + 180 ,
When the typhoon center moves to the upper left corner of a previous position held by the typhoon’s center, the moving angle is calculated:
angle = cos - 1 ( | lon dis | d ) × 180 π + 270 ,
where lat dis is the distance between the typhoon center points at two continuous moments in the latitudinal direction; lon dis is the distance between the typhoon center points at two continuous moments in the longitudinal direction; lat 2 is the subsequent latitudinal coordinate of the typhoon’s center; lat 1 is the previous latitudinal coordinate of the typhoon’s center; lon 2 is the subsequent longitudinal coordinate of the typhoon’s center; and lon 1 is the previous longitudinal coordinate of the typhoon’s center, as shown in Figure 1:
lat dis = | lat 2 - lat 1 | × 111 . 11 ,
lon dis = cos lat 1 π 180 × 111 . 11 × | lon 2 - lon 1 | ,
Moreover, there are total of 2046 combinations using 11 reanalysis physical variables. The physical variables group is taken as an independent variable for correlation analysis, and the moving angle and distance of the typhoon are taken as dependent variables for correlation analysis. Additionally, the moving direction and distance of the typhoon comprise two-dimensional vector data, whereas the traditional correlation analysis method is generally one-dimensional; therefore, in this paper, CCA is used to reduce the dimensions of the dependent variables and independent variable to one dimension.
Then, the correlation degree between the dependent variables and the independent variable is calculated using GRA to find the most correlated physical variables within a group, using 2046 combinations. The physical variables within the typhoon area, which are referred to in Section 2.2.3, are converted into heat maps using the Basemap library to locate the typhoon’s center on images. In this paper, the physical variables group included: 2 m dewpoint temperature, mean sea level pressure, surface pressure, significant height of combined wind waves and swell, and 10 m u-component of wind. The corresponding thermal diagrams are shown in Figure 2; however, the results achieved using the method which analyzes the correlation between the physical variables group and the moving angles and distance of a moving typhoon may be different based on data in different years. For example, the physical variables group that emerged from analyzing correlations with typhoon tracks data and reanalysis data from 2014 to 2021 included: 2 m dewpoint temperature, mean sea level pressure, mean wave period, surface pressure, sea surface temperature, 2 m temperature, total precipitation, and 10 m u-component of wind.

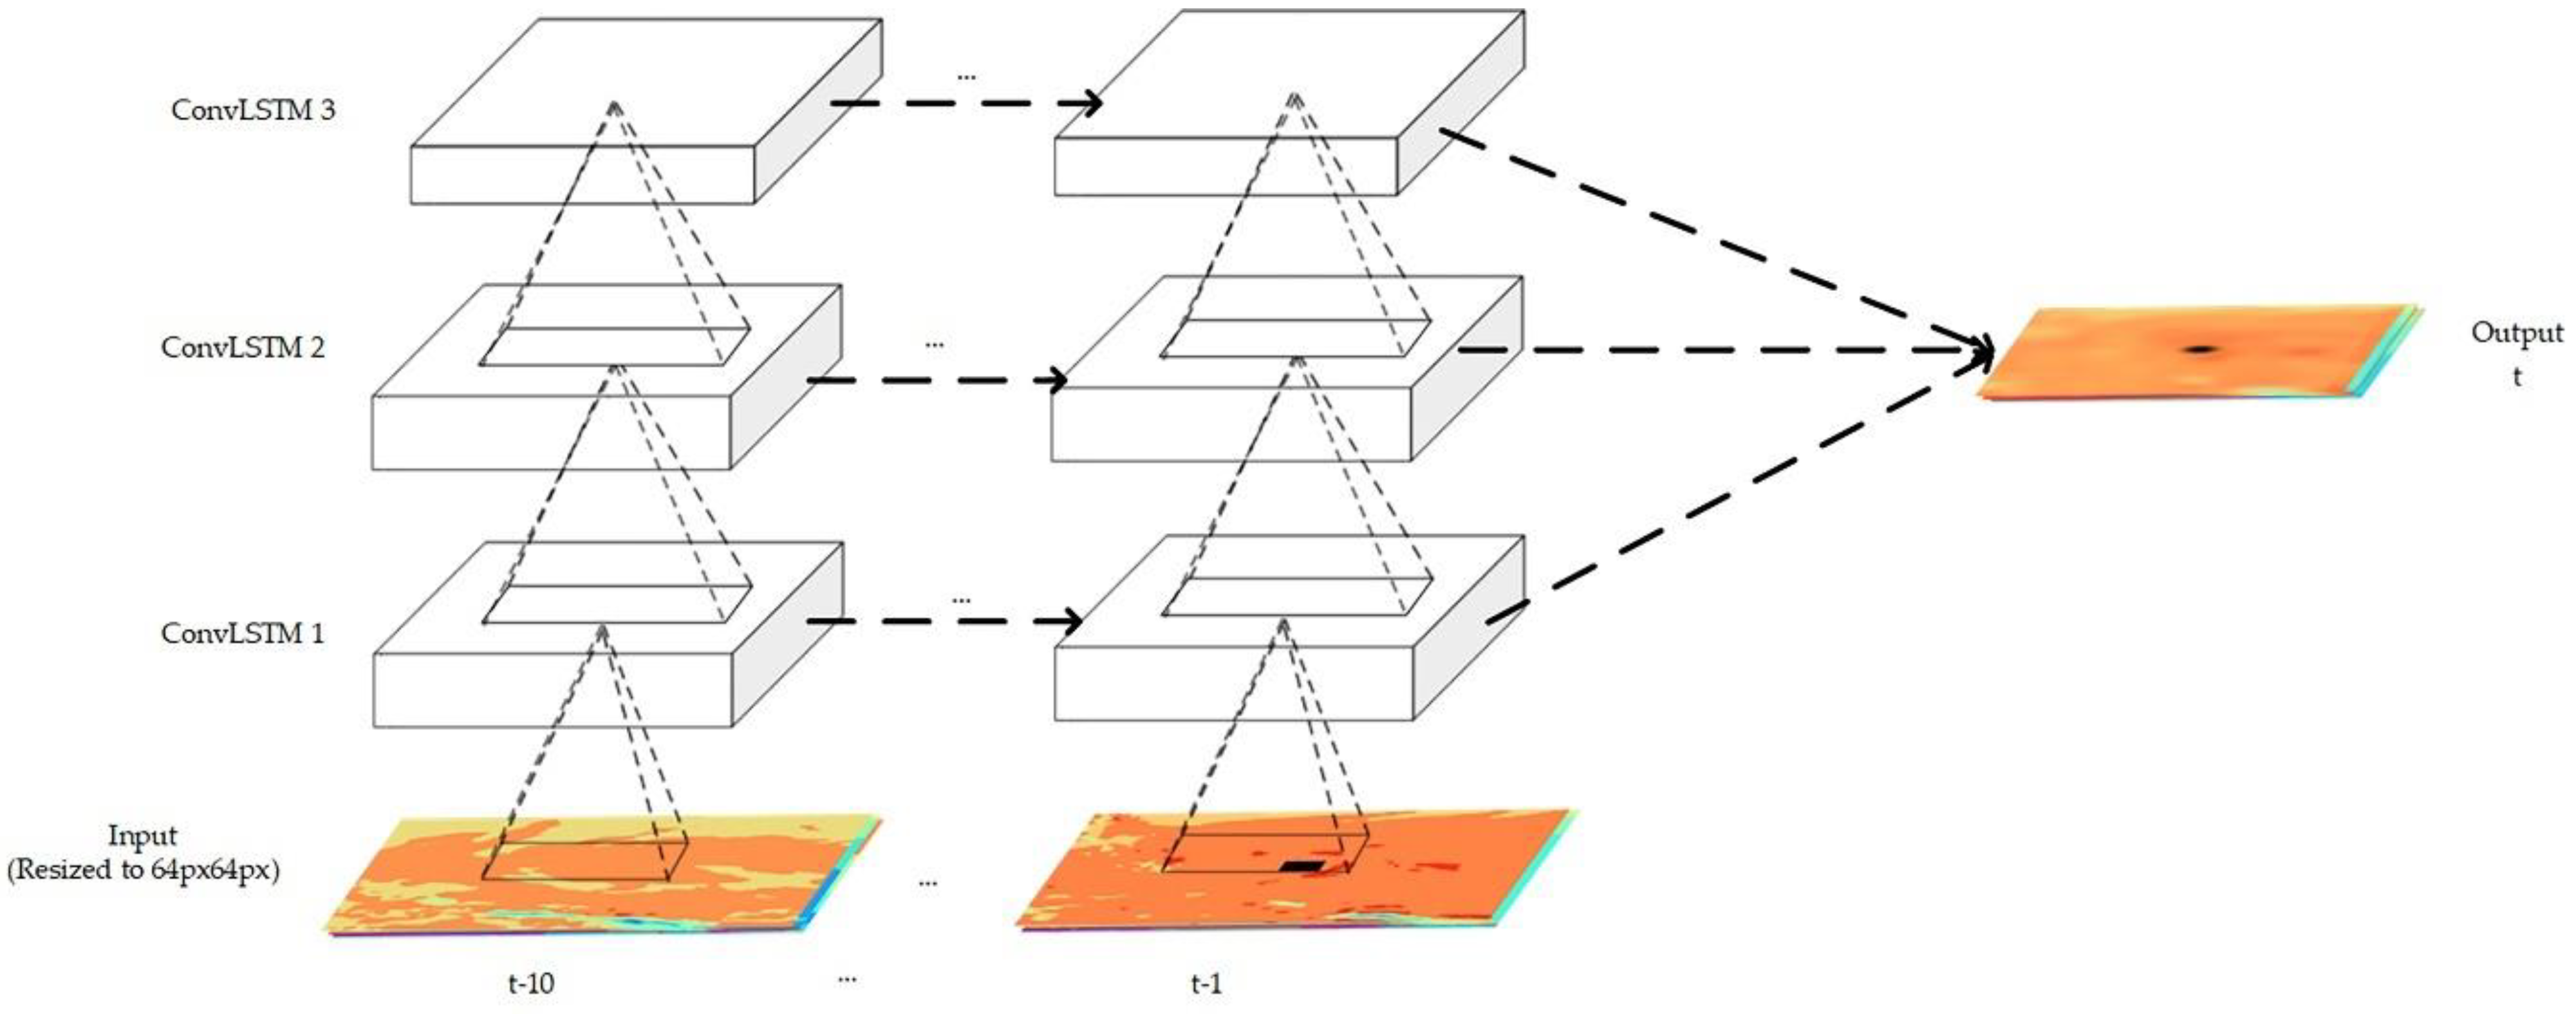
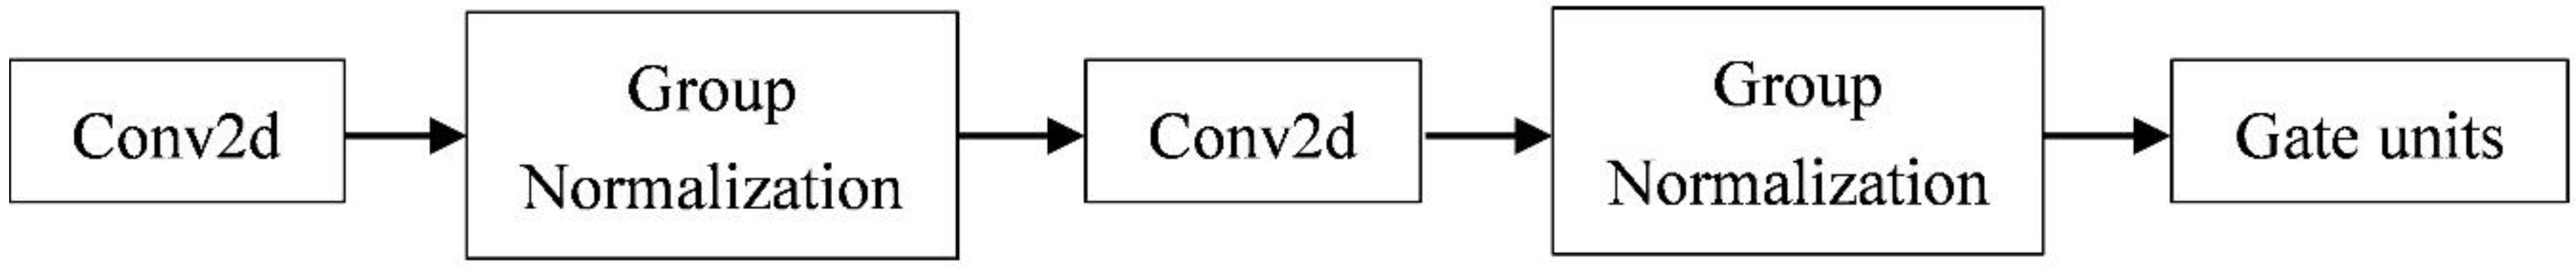
2.3.2. ConvLSTM Establishment and Improvement

The previous position of the typhoon’s center was marked on the image with a black block of 25 px ×   25 px, as shown in Figure 3, when generating the physical variable heat maps; this was done in order to obtain the final longitudinal and latitudinal coordinate predictions, and to obtain the relative previous position of the typhoon’s center and the subsequent position of the typhoon’s center on the images. It was also convenient as the ConvLSTM model was able to learn more of the features of the marked points. It is also useful as the model is able to learn more of the features of the marked points when there is a large area of marked points, thus enabling the accuracy of the model’s predictive abilities to be enhanced.
The proposed method in this paper used ConvLSTM as prediction model. The basic structure of the ConvLSTM model is composed of a convolution operation and a gate unit. In this study, two convolution operations are carried out in each ConvLSTM unit to extract as many image features as possible. Thermal maps of five physical variables, consisting of three channels (RGB), are resized to 64 px ×   64 px and subsequently cascaded to form images of 15 channels. The subsequent coordinates of the typhoon’s center are predicted using a time series consisting of images from ten moments; these comprise the input of the model. Figure 4 shows the training process of the ConvLSTM model.
This paper adds a convolution operation layer to each ConvLSTM unit in order to more adequately extract image features. The kernel size is set to 3 ×   3, and the convolution results are normalized after the convolution operation to ensure that the input gate, forgetting gate, and output gate values are not always 1 when calculating the gate unit. Figure 5 shows the ConvLSTM unit structure. The ConvLSTM model in this paper consists of three layers, and is in accordance with the above ConvLSTM unit structure, in order to fully extract the temporal and spatial features from the reanalysis images.
In addition, The MSE loss function is used to replace the original Cross Entropy loss function in the ConvLSTM model. The MSE loss function calculates the expected value of the square of the difference between the predicted value and the real value. The Cross Entropy loss function calculates the probability that the input sample belongs to a certain type. As this paper studies the time series prediction problem, MSE loss function is more suitable than Cross Entropy loss function.
According to the above design and improvement of the ConvLSTM model, the parameter settings of the ConvLSTM model used in this study are shown in Table 1.

2.3.3. Prediction of Tracks’ Coordinates

The contours of the predicted images obtained by the model are detected. The detected contour points are combined to fit the minimum circumscribed rectangle of the contour, and the center point of the rectangle is obtained to determine the (x, y) coordinates of the marked point on the images. In accordance with the previous longitudinal and latitudinal coordinates of the typhoon’s center, the relative position of the predicted point and the current center point of the typhoon (that is, the center point of the image) in the image are calculated using the longitudinal and latitudinal coordinates of the current center point of the typhoon. The calculation method is as follows, where lat cur is the current latitudinal coordinate of the predicted typhoon center, lon cur is the current longitudinal coordinate of the predicted typhoon center, lat pre is the previous latitudinal coordinate of the typhoon center, lon pre is the previous longitudinal coordinate of the typhoon center:
lat cur = lat pre + ( y - 32 )   ×   ( 23 . 4 ÷ 64 ) ,
lon cur = lon pre - ( x - 32 ) × 2 × 1300 111 × cos ( lat cur × π 180 ) 64 ,
Histogram Equalization is carried out for the prediction images that marked points cannot directly detect in order to obtain the longitudinal and latitudinal coordinates. The above process is repeated to enhance the recognition rate of the marked points. Moreover, at the end of the training process, the longitudinal and latitudinal prediction results correspond to each physical variable image of each typhoon sequence in the training set, which are then fitted with the true longitudinal and latitudinal coordinates of the current typhoon center using a sixth degree polynomial with five elements, and thus, the final longitudinal and latitudinal coordinates are obtained. The fitting model is saved for the test set so that adaptive fitting may occur.

3. Results

3.1. Experimental Environment

The experimental environment is shown in Table 2:

3.2. Evaluation Indicators of the Model

The accuracy of the predicted location of the typhoon’s center is evaluated by calculating the MAE for distance, longitude, latitude, and RMSE for distance. The absolute error is calculated using the Haversine formula, and then the Mean Absolute Error is calculated according to the sequence number (n) of the test set. The Root Mean Squared Error is also calculated according to the absolute error. The calculation formulas are as follows:
E = 2 R sin 1 sin ( l a t r e a l l a t p r e d 2 × π 180 ) 2 + cos ( l a t p r e d × π 180 ) cos ( l a t r e a l × π 180 ) sin ( l o n r e a l l o n p r e d 2 × π 180 ) 2 ,
MAE = 1 n i = 1 n E i ,
RMSE = 1 n i = 1 n E i 2 ,
MAE LAT = 1 n i = 1 n | lat real -   lat pred | ,
MAE LON = 1 n i = 1 n | lon real -   lon pred | ,
where lat real is the true latitudinal coordinate of the current typhoon center, lat pred is the predicted latitudinal coordinate of the current typhoon center, lon real is the true longitudinal coordinate of the current typhoon center, lon pred is the predicted longitudinal coordinate of the current typhoon center.
The accuracy of the predicted physical variables reanalysis images, according to the model, is evaluated using the average similarity of the images. The similarity of the two images is calculated using the cosine similarity formula. The closer the cosine value is to 1, the higher the similarity of the two images; otherwise, the similarity is lower. The cosine similarity formula and the average similarity are calculated as follows, where a and b are vectors of two images and n is the total number of predicted images:
Similarity = cos ( θ ) = a · b | | a | | × | | b | | ,
Similarity aver = Similarity n ,

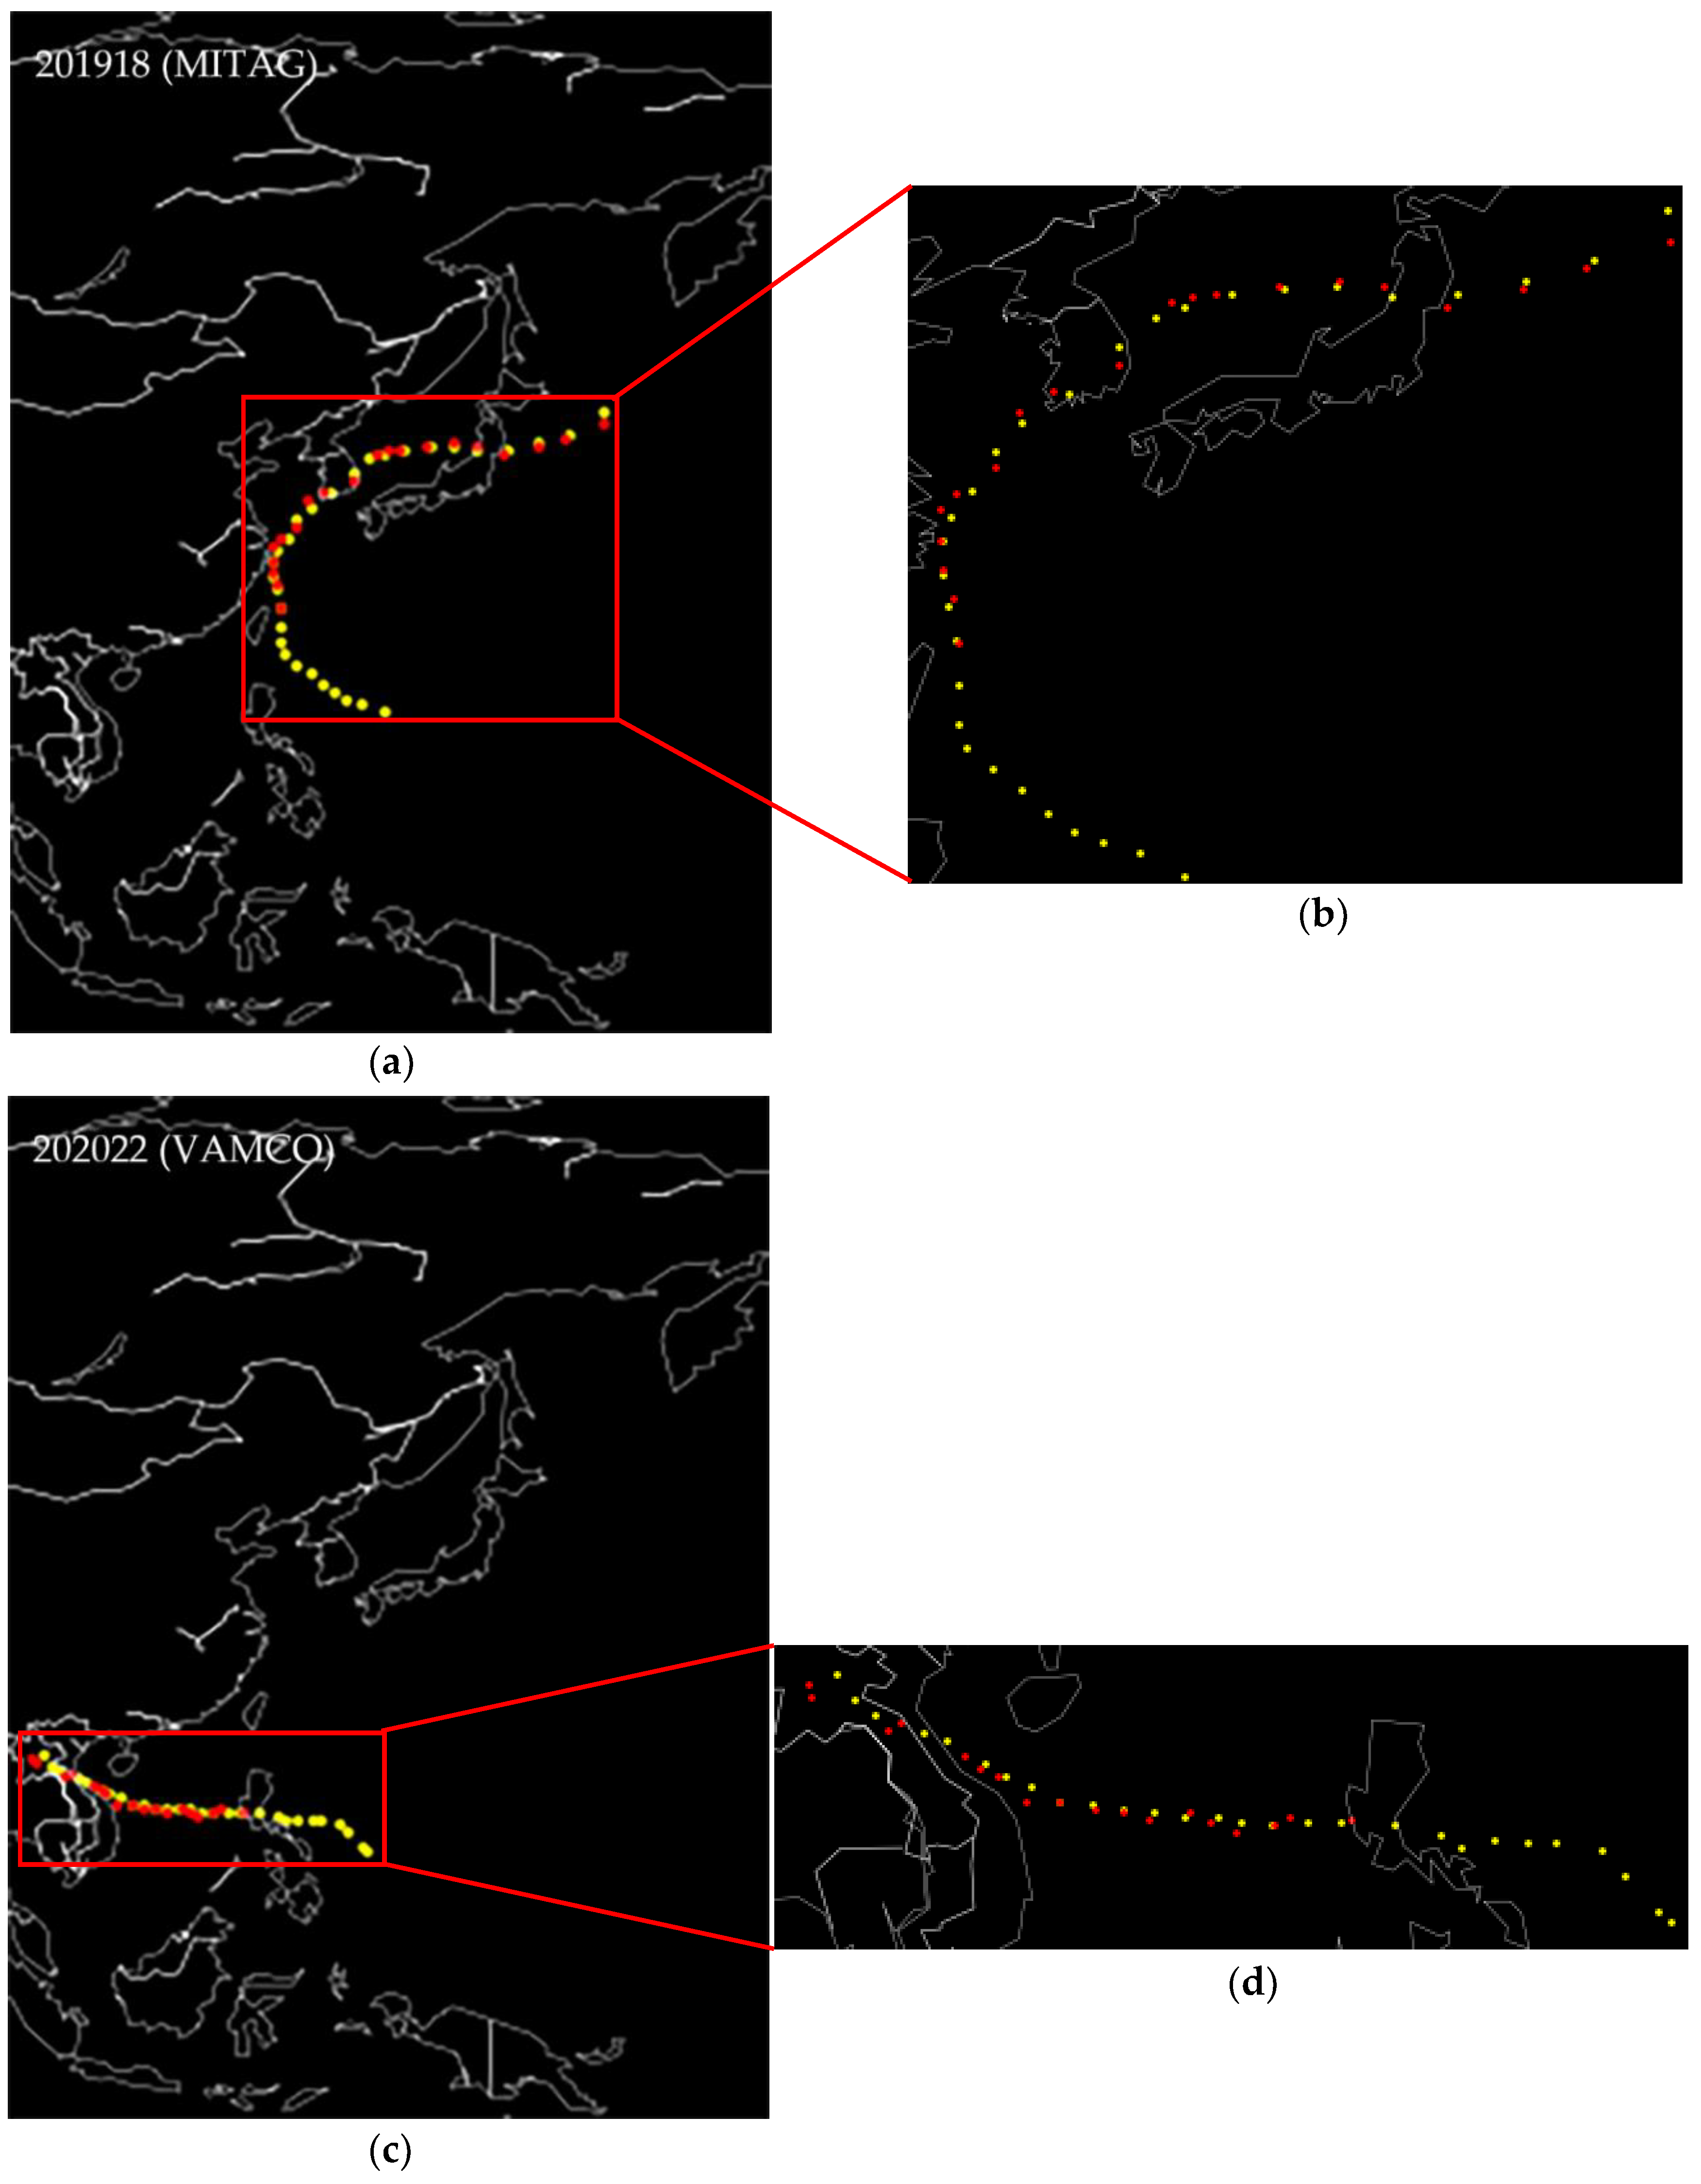
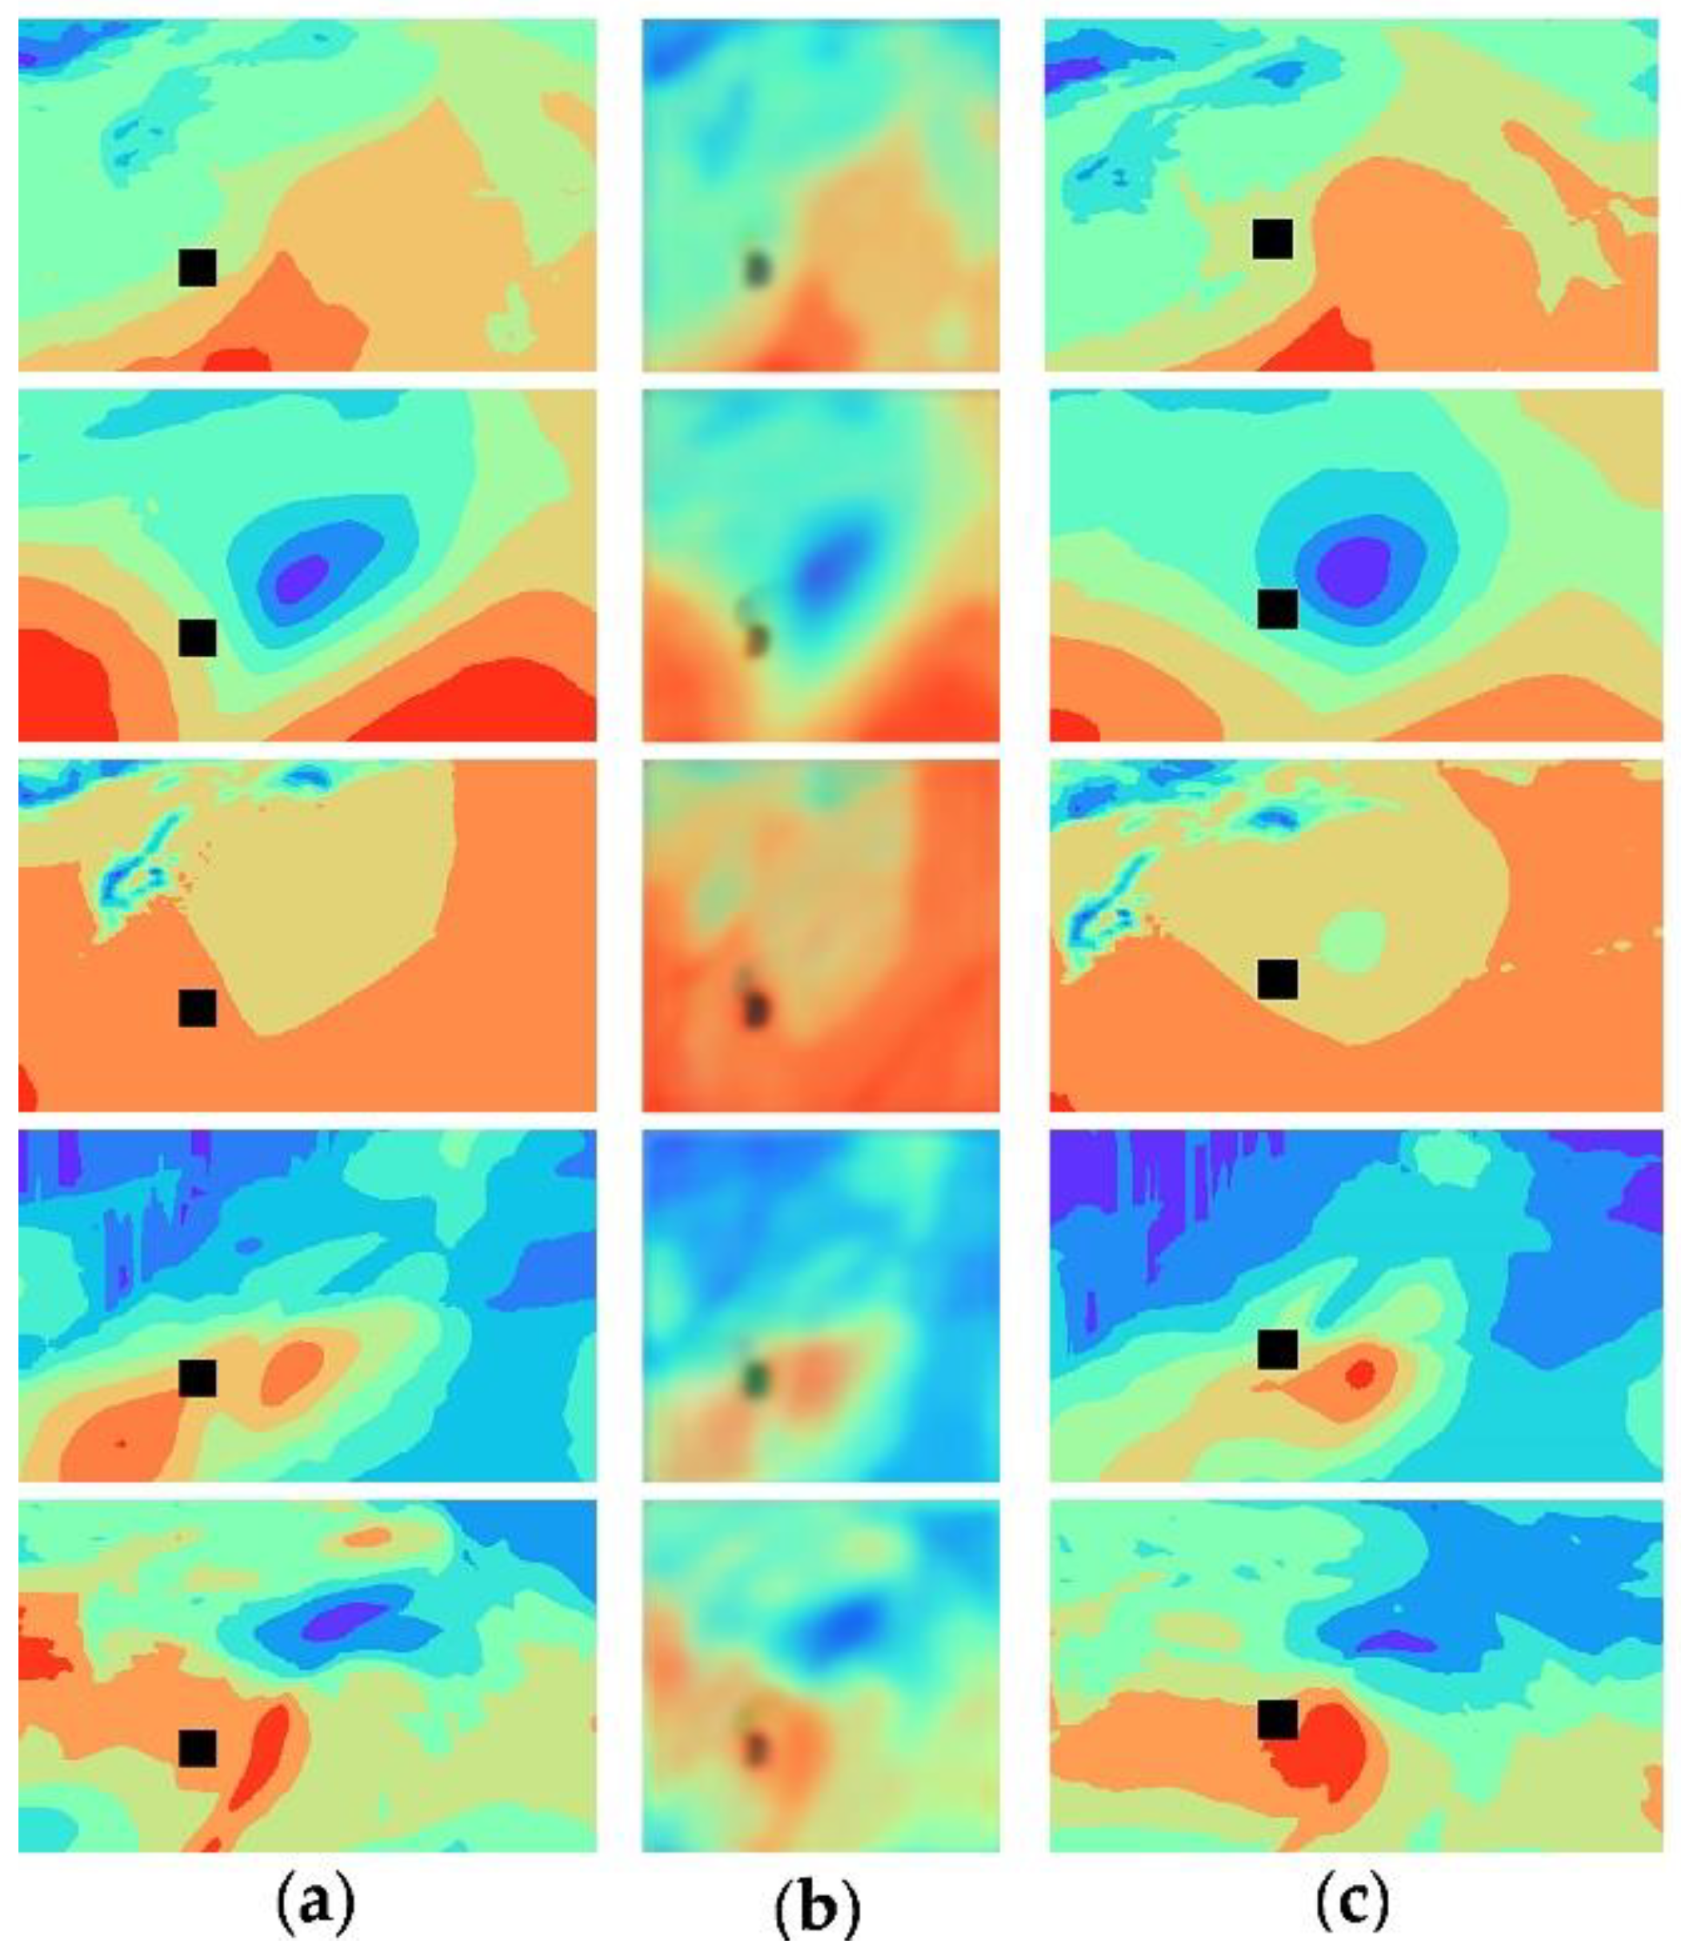
3.3. Experimental Results

During this experiment, the images of the physical variables were predicted by learning the features of the reanalysis image sequences of physical variables. These were fuzzy compared with the original images, but the similarity value of the images was high and the mean similarity value was 0.9927. Figure 6 shows the comparison between the predicted images of Typhoon PHANFONE (201929) at 0 o’clock on 26 December 2019, and the original images; all images are the same size.
The average margin of error for the spherical distance between the predicted longitudinal and latitudinal coordinates of the typhoon’s center and the true coordinates is small. Figure 7 shows the comparison between the predicted tracks and the real tracks of Typhoon MITAG (201918) and Typhoon VAMCO (202022), wherein the red series shows the predicted tracks and the yellow series shows the real tracks. It is evident that for both typhoons, the difference between the predicted tracks and the real tracks is small. The prediction error of Typhoon MITAG is 50.03 km, and it is 49.15 km for Typhoon VAMCO.
However, the method in this paper is also limited in that the model is sensitive to the changes of the physical variables; for example, the time range of images obtained from Typhoon HAGIBIS (201919) spans from 18 o’clock on 5 October 2019 to 18 o’clock on 14 October 2019, for a total of 10 days. Figure 8 shows that the reanalysis images at 6 o’clock on 14 October 2019 differs greatly from the reanalysis images at 0 o’clock on 14 October 2019, and the predicted images are more similar to earlier images, which means that the margin of error for the predicted longitudinal and latitudinal coordinates of the current typhoon center is large. This paper postulates that the reason for this is that it is difficult for the model to learn such features during the training process, meaning that when there are great differences between images at two continuous moments, the margin of error with regard to prediction results is large.
Furthermore, in order to compare the predicted results of the ConvLSTM model with only one convolutional ConvLSTM unit layer, a comparative experiment was carried out. With all other factors being equal, only the convolutional layer was changed. The similarity value between the predicted images of the ConvLSTM model with only one convolutional ConvLSTM unit layer and the ground truth images is 0.9923, which is less than the similarity value between the predicted images of the improved ConvLSTM model and the ground truth images (0.9927). Table 3 shows the comparison results between the ConvLSTM model with only one convolutional ConvLSTM unit layer and the improved ConvLSTM model. The comparison results prove that adding a convolutional ConvLSTM unit layer can improve the performance of the ConvLSTM model with the superiority of all four parameters (MAE, RMSE, MAELAT and MAELON).

3.4. Comparison with Other Methods

The prediction errors of the proposed method are compared with other methods in Table 4. The comparison results show that the proposed method is a highly accurate prediction method that uses the machine learning model.

4. Discussion

The experiment results prove that prediction with reanalysis images of physical factors, which are related to the typhoon’s movement, and the ConvLSTM model can achieve relatively clear predictive reanalysis images of physical factors, and thus, they can provide accurate predictive results; however, the predicted images produced by this proposed method are more similar to previous, rather than subsequent, ground truth results, which may increase error. Hence, future work should focus on adjusting the structure of the network and the weight of inputs to ensure that the network can extract more image features and predict in accordance with the general consistent direction of the typhoon’s movement to reduce error; nevertheless, predicting typhoon tracks accurately will be difficult in the future.

5. Conclusions

The paper proposes that the convolution layer of the ConvLSTM unit should be added to extract more reanalysis image features and achieve coordinates that show the subsequent positions of a typhoon’s center by marking the previous positions of a typhoon’s center. The predicted coordinates of the typhoon’s center would then be calculated and fitted in accordance with each of the physical variables. This paper uses reanalysis images of physical variables, and data comprising longitudinal and latitudinal coordinates to predict typhoon tracks. The most correlated physical variables group, which includes the moving angle and distance travelled by the typhoon, will be found by combining CCA with the GRA algorithm to avoid the influence of irrelevant physical variables on the prediction results, which would cause the margin of error to increase. The reanalysis data of the physical variables group is converted into reanalysis images, marking the previous position of the typhoon’s center on images. The temporal and spatial features of the reanalysis images are learned using the ConvLSTM model. The output results of the network are converted to longitudinal and latitudinal coordinates, and the final prediction results are obtained via fitting. The experimental results show that the proposed method can accurately predict the typhoon tracks.

Author Contributions

Data curation, A.S.; Methodology, M.X.; Project administration, P.L.; Writing—original draft, M.X.; Writing—review and editing, Z.W. and Z.Z. All authors have read and agreed to the published version of the manuscript.

Funding

This research was funded by Shanghai Science and Technology Innovation Plan Project, grant number 20dz1203800 and the Capacity Development for Local College Project, grant number 19050502100.

Conflicts of Interest

The authors declare no conflict of interest.

References

  1. Liu, D.; Pang, L.; Xie, B. Typhoon disaster in China: Prediction, prevention, and mitigation. Nat. Hazards 2009, 49, 421–436. [Google Scholar] [CrossRef]
  2. Liu, G.L.; Li, X.; Wang, J.; Kou, Y.; Wang, X. Research on the statistical characteristics of typhoon frequency. Ocean Eng. 2020, 209, 107489. [Google Scholar] [CrossRef]
  3. Takagi, H.; Esteban, M.; Shibayama, T.; Mikami, T.; Matsumaru, R.; De Leon, M.; Thao, N.; Oyama, T.; Nakamura, R. Track analysis, simulation, and field survey of the 2013 Typhoon Haiyan storm surge. J. Flood Risk Manag. 2017, 10, 42–52. [Google Scholar] [CrossRef]
  4. Hon, K. Tropical cyclone track prediction using a large-area WRF model at the Hong Kong Observatory. Trop. Cyclone Res. Rev. 2020, 9, 67–74. [Google Scholar] [CrossRef]
  5. Wang, S.W.; Cheng, D.H.; Li, J.; Ma, S. A numerical typhoon track prediction model and its application on the real-time operation. Mausam 2021, 48, 195–204. [Google Scholar] [CrossRef]
  6. Hsan, T.Z.; Sein, M.M. Combining Support Vector Machine and Polynomial Regressing to Predict Tropical Cyclone Track. In Proceedings of the IEEE 3rd Global Conference on Life Sciences and Technologies (IEEE LifeTech), Nara, Japan, 9–11 March 2021; IEEE: New York, NY, USA, 2021; pp. 220–221. [Google Scholar]
  7. Tan, J.K.; Chen, S.; Wang, J. Western North Pacific tropical cyclone track forecasts by a machine learning model. Stoch. Environ. Res. Risk Assess. 2021, 35, 1113–1126. [Google Scholar] [CrossRef]
  8. Chen, R.; Wang, X.; Zhang, W.; Zhu, X.; Li, A.; Yang, C. A hybrid CNN-LSTM model for typhoon formation forecasting. Geoinformatica 2019, 23, 375–396. [Google Scholar] [CrossRef]
  9. Gao, S.; Zhao, P.; Pan, B.; Li, Y.; Zhou, M.; Xu, J.; Zhong, S.; Shi, Z. A nowcasting model for the prediction of typhoon tracks based on a long short term memory neural network. Acta Oceanol. Sin. 2018, 37, 8–12. [Google Scholar] [CrossRef]
  10. Rüttgers, M.; Lee, S.; Jeon, S.; You, D. Prediction of a typhoon track using a generative adversarial network and satellite images. Sci. Rep. 2019, 9, 1–15. [Google Scholar] [CrossRef] [Green Version]
  11. Kim, S.; Kim, H.; Lee, J.; Yoon, S.; Kahou, S.E.; Kashinath, K.; Prabhat, M. Deep-hurricane-tracker: Tracking and forecasting extreme climate events. In Proceedings of the 19th IEEE Winter Conference on Applications of Computer Vision (WACV), Waikoloa Village, HI, USA, 7–11 January 2019; IEEE: New York, NY, USA, 2019; pp. 1761–1769. [Google Scholar]
  12. Hong, S.; Kim, S.; Joh, M.; Song, S.K. GlobeNet: Convolutional Neural Networks for Typhoon Eye Tracking from Remote Sensing Imagery. arXiv preprint 2017, arXiv:1708.03417. [Google Scholar]
  13. Dee, D.P.; Uppala, S.M.; Simmons, A.J.; Berrisford, P.; Poli, P.; Kobayashi, S.; Andrae, U.; Balmaseda, M.A.; Balsamo, G.; Bauer, P.; et al. The ERA-Interim reanalysis: Configuration and performance of the data assimilation system. Q. J. R. Meteorol. Soc. 2011, 137, 553–597. [Google Scholar] [CrossRef]
  14. Giffard-Roisin, S.; Yang, M.; Charpiat, G.; Bonfanti, C.K.; Kégl, B.; Monteleoni, C. Tropical Cyclone Track Forecasting Using Fused Deep Learning from Aligned Reanalysis Data. Front. Big Data 2020, 3, 1–13. [Google Scholar] [CrossRef] [Green Version]
  15. Lian, J.; Dong, P.P.; Zhang, Y.; Pan, J.; Liu, K. A Novel Data-Driven Tropical Cyclone Track Prediction Model Based on CNN and GRU with Multi-Dimensional Feature Selection. IEEE Access 2020, 8, 97114–97128. [Google Scholar] [CrossRef]
  16. Peng, J.; Qiao, R.L.; Liu, Y.; Blaschke, T.; Li, S.; Wu, J.; Xu, Z.; Liu, Q. A wavelet coherence approach to prioritizing influencing factors of land surface temperature and associated research scales. Remote Sens. Environ. 2020, 246, 111866. [Google Scholar] [CrossRef]
  17. Tan, R.P.; Zhang, W.D.; Chen, S. Decision-Making Method Based on Grey Relation Analysis and Trapezoidal Fuzzy Neutrosophic Numbers Under Double Incomplete Information and its Application in Typhoon Disaster Assessment. IEEE Access 2020, 8, 3606–3628. [Google Scholar] [CrossRef]
  18. Zheng, Z.; Zha, B.T.; Yuan, H.; Xuchen, Y. Edge Detection Algorithm based on Morphology and Grey Relation Analysis. In Proceedings of the 16th IEEE International Conference on Mechatronics and Automation (IEEE ICMA), Tianjin, China, 4–7 August 2019; IEEE: New York, NY, USA, 2019; pp. 945–950. [Google Scholar]
  19. Fekadu, K. Ethiopian Seasonal Rainfall Variability and Prediction Using Canonical Correlation Analysis (CCA). Earth Sci. 2015, 4, 112–119. [Google Scholar] [CrossRef]
  20. Moishin, M.; Deo, R.C.; Prasad, R.; Raj, N.; Abdulla, S. Designing Deep-Based Learning Flood Forecast Model with ConvLSTM Hybrid Algorithm. IEEE Access 2021, 9, 50982–50993. [Google Scholar] [CrossRef]
  21. Shi, X.J.; Chen, Z.R.; Wang, H.; Yeung, D.Y.; Wong, W.K.; Woo, W.C. Convolutional LSTM Network: A Machine Learning Approach for Precipitation Nowcasting. In Proceedings of the 29th Annual Conference on Neural Information Processing Systems (NIPS), Montreal, Canada, 7–12 December 2015; Neural Information Processing Systems (NIPS): La Jolla, CA, USA, 2015. [Google Scholar]
  22. Yang, X.H.; Liu, W.F.; Liu, W.; Tao, D. A Survey on Canonical Correlation Analysis. IEEE Trans. Knowl. Data Eng. 2021, 33, 2349–2368. [Google Scholar] [CrossRef]
  23. Li, Y.; Bin, G.Y.; Gao, X.; Hong, B.; Gao, S. Analysis of phase coding SSVEP based on canonical correlation analysis (CCA). In Proceedings of the 5th International IEEE Engineering-in-Medicine-and-Biology-Society (EMBS) Conference on Neural Engineering (NER), Cancun, Mexico, 27 April 27–1 May 2011; IEEE: New York, NY, USA, 2011; pp. 368–371. [Google Scholar]
  24. Tan, Y.J.; Zhou, W.G. Image Scrambling Degree Evaluation Algorithm Based on Grey Relation Analysis. In Proceedings of the 2010 International Conference on Computational and Information Sciences, Chengdu, China, 17–19 December 2010; IEEE: New York, NY, USA, 2010; pp. 511–514. [Google Scholar]
  25. Sallehuddin, R.; Shamsuddin, S.M.H.; Hashim, S.Z.M. Application of Grey Relational Analysis for Multivariate Time Series. In Proceedings of the 8th International Conference on Intelligent Systems Design and Applications (ISDA 2008), Kaohsiung, Taiwan, 26–28 November 2008; IEEE: New York, NY, USA, 2008; pp. 432–437. [Google Scholar]
  26. Kitamoto, A. Digital Typhoon: Near Real-Time Aggregation, Recombination and Delivery of Typhoon-Related Information. In Proceedings of the 4th International Symposium on Digital Earth (ISDE), Tokyo, Japan, 28–31 March 2005. [Google Scholar]
  27. Kitamoto, A. “Digital Typhoon” Typhoon Analysis based on Artificial Intelligence Approach. Tech. Rep. Inf. Processing Soc. Jpn. IPSJ 2000, CVIM123-8, 59–66. [Google Scholar]
  28. Hersbach, H.; Bell, B.; Berrisford, P.; Hirahara, S.; Horányi, A.; Muñoz-Sabater, J.; Nicolas, J.; Peubey, C.; Radu, R.; Schepers, D.; et al. The ERA5 global reanalysis. Q. J. R. Meteorol. Soc. 2020, 146, 1999–2049. [Google Scholar] [CrossRef]
  29. Mahmoud, H.; Akkari, N. Shortest Path Calculation: A Comparative Study for Location-Based Recommender System. In Proceedings of the World Symposium on Computer Applications and Research (WSCAR), Cairo, Egypt, 12–14 March 2016; IEEE: New York, NY, USA, 2016; pp. 1–5. [Google Scholar]
  30. Kordmahalleh, M.M.; Sefidmazgi, M.G.; Homaifar, A. A Sparse Recurrent Neural Network for Trajectory Prediction of Atlantic Hurricanes. In Proceedings of the Genetic and Evolutionary Computation Conference (GECCO), Denver, CO, USA, 20–24 July 2016; Assoc Computing Machinery: New York, NY, USA, 2016; pp. 957–964. [Google Scholar]
  31. Chen, J.X. Forecast of Tropical Cyclone Track based on Shape Index and SVM. J. Meteorol. Res. Appl. 2010, 31, 61–64. [Google Scholar]
  32. Chaudhuri, S.; Dutta, D.; Goswami, S.; Middey, A. Track and intensity forecast of tropical cyclones over the North Indian Ocean with multilayer feed forward neural nets. Meteorol. Appl. 2015, 22, 563–575. [Google Scholar] [CrossRef]
  33. Tekin, S.F.; Ilhan, F. CS559 Project Report Forecasting of Tropical Cyclone Trajectories with Deep Learning. 2021. Available online: https://sftekin.github.io/pdfs/hurricane.pdf (accessed on 5 September 2022).
  34. Wu, Y.Q.; Geng, X.Y.; Goswami, S.; Middey, A. Tropical Cyclone Forecast Using Multitask Deep Learning Framework. IEEE Geosci. Remote Sens. Lett. 2022, 19, 1–5. [Google Scholar] [CrossRef]
  35. Kim, S.; Kang, J.S.; Lee, M.; Song, S.K. DeepTC: ConvLSTM Network for Trajectory Prediction of Tropical Cyclone using Spatiotemporal Atmospheric Simulation Data. In Proceedings of the 32nd Conference on Neural Information Processing Systems (NIPS 2018), Montréal, Canada, 3–8 December 2018; Neural Information Processing Systems (NIPS): La Jolla, CA, USA, 2018. [Google Scholar]
Figure 1. Typhoon moving angle diagram.
Electronics 11 03279 g001
Figure 2. Heat maps of physical variables: (a) 2 m dewpoint temperature; (b) mean sea level pressure; (c) surface pressure; (d) significant height of combined wind waves and swell; (e) 10 m u-component of wind.
Electronics 11 03279 g002
Figure 3. Heat maps of physical variables marking the position of the typhoon’s center: (a) 2 m dewpoint temperature; (b) mean sea level pressure; (c) surface pressure; (d) significant height of combined wind waves and swell; (e) 10 m u-component of wind.
Electronics 11 03279 g003
Figure 4. The training process of the ConvLSTM model.
Electronics 11 03279 g004
Figure 5. ConvLSTM unit structure.
Electronics 11 03279 g005
Figure 6. Diagrams showing a comparison between the predicted images of Typhoon PHANFONE (201929) at 0 o’clock on 26 December 2019 and the original images. (a) Predicted images. (b) Original images.
Electronics 11 03279 g006
Figure 7. Diagrams comparing the predicted and real tracks of Typhoon MITAG and Typhoon VAMCO. (a) MITAG. (b) A partial enlargement of image (a). (c) VAMCO. (d) A partial enlargement of image (c).
Electronics 11 03279 g007
Figure 8. Diagrams comparing images at previous moments in time, depicting predicted images and current original images of Typhoon HAGIBIS. (a) Earlier images of Typhoon HAGIBIS. (b) Predicted images of Typhoon HAGIBIS. (c) Current original images of Typhoon HAGIBIS.
Electronics 11 03279 g008
Table 1. Parameters of model.
ParametersValues
Input dimension(batch_size, 10, 15, 64, 64)
Kernel sizes ( 3 × 3)
Number of Gate unit nodes15
Number of layers3
Table 2. Experimental environment.
Parameters and Device NameValues and Version
GPUNVIDIA GeForce RTX 3060
epoch50
batch_size10
learning rate0.001
Table 3. Comparison of the results between the ConvLSTM model with only one convolutional ConvLSTM unit layer and the improved ConvLSTM model.
ModelsMAE (km)RMSE (km)MAELATMAELON
Improved ConvLSTM54.6971.270.3030.393
ConvLSTM model with only one convolutional ConvLSTM unit layer56.6673.090.4540.609
Table 4. Comparison of the results with other methods.
MethodsMAE (km)RMSE (km)MAELATMAELON
Proposed method54.6971.270.3030.393
Sparse RNN [30]72.11-0.5490.299
GAN [10]69.1---
Deep-Hurricane-Tracker: ConvLSTM [11]-140.97--
SVM [31]57.6---
NNA 1 [32]55---
TrajGRU [33]66.6---
WCycleGAN + TCLNet [34]61---
DeepTC: ConvLSTM [35]--1.82.12
Publisher’s Note: MDPI stays neutral with regard to jurisdictional claims in published maps and institutional affiliations.

