Article

An Empirical Comparison of Pen-Testing Tools for Detecting Web App Vulnerabilities

1
School of Computer Science, Umm Al-Qura University, Mecca P.O. Box 715, Saudi Arabia
2
School of Computer Science, University College Dublin, Belfield, D04 V1W8 Dublin, Ireland
*
Author to whom correspondence should be addressed.
Electronics 2022, 11(19), 2991; https://doi.org/10.3390/electronics11192991
Submission received: 15 August 2022 / Revised: 16 September 2022 / Accepted: 17 September 2022 / Published: 21 September 2022
(This article belongs to the Section Computer Science & Engineering)

Abstract

:
Today, one of the most popular ways organizations use to provide their services, or broadly speaking, interact with their customers, is through web applications. Those applications should be protected and meet all security requirements. Penetration testers need to make sure that the attacker cannot find any weaknesses to destroy, exploit, or disclose information on the Web. Therefore, using automated vulnerability assessment tools is the best and easiest part of web application pen-testing, but these tools have strengths and weaknesses. Thus, using the wrong tool may lead to undetected, expected, or known vulnerabilities that may open doors for cyberattacks. This research proposes an empirical comparison of pen-testing tools for detecting web app vulnerabilities using approved standards and methods to facilitate the selection of appropriate tools according to the needs of penetration testers. In addition, we have proposed an enhanced benchmarking framework that combines the latest research into benchmarking and evaluation criteria in addition to new criteria to cover more ground with benchmarking metrics as an enhancement for web penetration testers and penetration testers in real life. In addition, we measure the tool’s abilities using a score-based comparative analysis. Moreover, we conducted simulation tests of both commercial and non-commercial pen-testing tools. The results showed that Burp Suite Professional scored the highest out of the commercial tools, while OWASP ZAP scored the highest out of the non-commercial tools.

1. Introduction

The aim of Web application penetration-testing (pen-testing) is to identify vulnerabilities that are caused by insecure development practices in software or website design, coding, and server configuration. Generally, web app pen-testing includes testing user authentication to verify that data cannot be compromised by user authentication; assessing the web app for vulnerabilities and flaws such as cross-site scripting (XSS); confirming secure configuration of web browsers and servers; identifying features that can result in minimum vulnerabilities; and ensuring web server security and database server security [1]. Pen-testing has become an essential requirement for identifying vulnerabilities and security flaws that cyberattackers can exploit [2]. With technological advancement, the complexities of pen-testing are increasing in terms of security. The Open Web Application Security Project (OWASP) [3] is a non-profit organization that is dedicated to promoting software security. The organization provides a wide range of services that help developers improve educational resources, social events, and tools. They also provide guidelines, including the recently updated OWASP Top 10 Application Security Risks. The updated list features considerable changes, such as the introduction of Broken Access Control, which moved from the fifth spot to the first position. According to information provided by the organization [3], 94% of the applications have undergone testing for broken access control, and “the 34 Common Weakness Enumerations (CWEs) mapped to Broken Access Control had more occurrences in applications than any other category”. Cryptographic failures also shifted to the second spot on the list owing to their link to system compromise and sensitive data exposure. Injection dropped down to the third position, though OWASP noted that they tested 94% of the applications for some sort of injection, which now entails cross-site scripting [3]. The fourth spot on the list is now occupied by a new category, “Insecure Design”, followed by Security Misconfiguration, which moved one step up compared to the 2017 list. The list’s authors stated that this was normal given that they tested 90% of the applications for misconfiguration and that there have been more changes to highly configurable software. In OWASP’s top 10 vulnerabilities in 2017, vulnerable and outdated components were ranked in the ninth position, but they have moved up to the sixth spot in the updated version. The authors noted that it is the only category that does not have any Common Vulnerabilities and Exposures (CVE) mapped to the included Common Weakness Enumerations (CWEs), so their scores have factored in the default exploit and impact weights of 5.0. Broken Authentication has been renamed to Identification, and Authentication Failures have dropped from the second spot to the seventh position, and OWASP explained that this was addressed by the increased availability of standardized frameworks. The 2021 list adds an entirely new category known as “Software and Data Integrity Failures” that focuses on assumptions linked to critical data, software updates, and CI/CD pipelines without integrity verification. OWASP said that among the highest weighted effects from CVE/CVSS data mapped to the 10 CWEs in this category, the larger category now includes Insecure Deserialization from 2017. Previously, security logging and monitoring failures occupied the last spot in the list, but they have now moved one spot up and been widened to factor in other types of failures. Closing the list is server-side request forgery, which features a relatively low incidence rate, but industry professionals cited it as high [3]. Overall, OWASP noted that three new categories were added to the 2021 list and the other four had their scopes or names changed (see Figure 1).
In order to understand the development of Pentest over the last few years, this work presents an empirical comparison of pen-testing tools. The paper provides a review of the literature on the work of various researchers in the field of pen-testing and discusses the various aspects of web application pen-testing. Most importantly, the study reviewed pen-testing tools in terms of their characteristics and performance.
  • We have conducted a literature review on the work done by various researchers in the area of web application pen-testing.
  • We have also studied the various tools used for PEN-testing in terms of their performance, vulnerability detection, test coverage, etc.
  • We have proposed an enhanced benchmarking framework for web application pen-testing tools.

2. Background

Web application pen-testing is a form of ethical hacking created specifically to assess the design, configuration, and architecture of a web application. The aim of conducting assessments is to identify security risks that could result in unauthorized access or data exposure [4]. This chapter compares the three major types of security testing technologies relied on by developers to help identify security flaws before software releases. There are three types of application security testing: dynamic application security testing (DAST), static application security testing (SAST), and interactive application security testing (IAST). SAST consists of technologies and tools designed for checking vulnerabilities and flaws in code. The operation of SAST tools involves scanning the codes at rest, meaning that the code is not executed by any program or human. The tool looks for the static code by following each instruction and line and conducting a comparison against a set of rules and obvious errors. SAST is regularly used by development teams to enforce compliance with coding standards and formats. DAST is a representation of multiple tools used for vulnerability checking in Web-based applications. While SAST can see the code base, DAST does not know the underlying code. DAST works by running the application in a staging environment to be probed by a hacker for weaknesses. IAST is a hybrid testing method that aims to solve the main failures of SAST and DAST by combining the best features of the two. Agents are tasked with continuously monitoring and analyzing the behavior of the Web application during automated or manual tests. When IAST is properly configured, it can identify information such as calls to other services, data flow, infrastructure data, HTTP traffic, or configuration options and access application components such as frameworks, libraries, and data within the back-end dependencies [5].

3. Problem Statement

There are numerous advantages to checking web applications for security vulnerabilities, but doing this manually requires a lot of skills and time. Various pen-testing tools are available that can automate the process, but they too have their limitations. For example, some of these Web application pen-testing tools are known to report false positives. A false positive can be equated to a false alarm, like a house alarm being triggered while there is no burglar. A false positive in web application security is when a web application security scanner indicates the presence of a vulnerability to a website, such as SQL injection, yet it is not there in reality. Pen-testers are experts in web security and use automated web app security scanners to simplify the pen-testing process. This is to ensure that all the attack surfaces of the web application are tested rapidly and comprehensively. However, automated tools can still result in problems as well. False positives lead to web application pen-testing consuming a considerable amount of time [6]. This is because pen-testing must go through all the reported security vulnerabilities and try to exploit them through manual verification. This is a lengthy process that makes web application security unaffordable for many businesses, though the problems caused by false positives go beyond just cost. Naturally, as human beings, we tend to ignore false alarms, and this also applies to pen-testing. For example, if a web app security scanner detects 100 cross-site scripting vulnerabilities, and if the first 25 variants were false positives, then there is a possibility of the pen-test assuming that all the remaining ones were false positives and ignoring the remaining ones. Therefore, this increases the chance of the real security vulnerabilities going undetected. While this is the issue, web app scanners also have limitations in terms of performance, scan speed, accuracy, and cost.

4. Related Work

Many developers of security-critical Web services face the problem of choosing the best vulnerability detection tools. Both practice and research indicate that state-of-the-art tools are not very effective in terms of false-positive rates and vulnerability coverage. The main issue is that these tools are limited in the detection techniques they adopt, and they are designed for application in very concrete scenarios. Therefore, using the wrong tool for vulnerability detection may result in the deployment of undetected vulnerability services. The authors of [7] proposed a benchmarking approach for assessing and comparing the effectiveness of vulnerability detection tools in Web services. The outcomes indicate that the proposed benchmarks accurately depict the effectiveness of vulnerability detection tools and suggest the application of the proposed benchmarking approaches in the field. The increased application of web vulnerability scanners and the difference in their effectiveness necessitate benchmarking of the scanners. Furthermore, the existing literature does not present a comparison of the results on the effectiveness of scanners from various benchmarks. The authors of [8] compared the performance of certain open-source vulnerability scanners by running them against the OWASP benchmark. The authors proceeded to compare the results from the OWASP benchmark with the existing outcomes from the Web Application Vulnerability Security Evaluation Project (WAVSEP) benchmark. The results from the study’s evaluation of the web vulnerability scanners confirmed that scanners perform differently based on the category. Thus, there is no single scanner that can perform all the tasks of scanning web vulnerabilities [8]. Pen-testing enables the person carrying out PEN-testing to check out the system’s functional aspects, that is, the extent to which a system is vulnerable to network security and intrusion attacks, and view the system’s defense mechanisms to mitigate these attacks. The authors of [9] conducted a comprehensive literature review of pen-testing and its applications. The study reviewed the work conducted in the field of pen-testing. The authors have tried to review various aspects that are related to PEN-testing. In addition, the work reviews the various pen-testing strategies and tools used for PEN-testing in terms of their technical specifications, platform compatibility, release date, and utility. It reviews the significance of pen-testing in detecting system vulnerabilities and how to protect a system from network attacks. The paper concludes that penetrating-testing is a proven and efficient technique for detecting system security flaws. Cybersecurity has become very crucial today due to the rise in cybercrime. Every firm is striving to avoid cybercrimes such as hacking and data breaches. The authors of [10] studied pen-testing processes and tools, focusing on the comparison of four different port scanning tools to show their effectiveness. The project tested different scanning tools in the Kali Linux environment in terms of discovered port numbers and the time that the tool took to discover the ports. Of the various scanning tools tested in the project, Sparta emerged as the most efficient tool for efficiency and ease of use. Its recommendation is backed by its availability in Kali Linux and the fact that it is a free tool, making it ideal for small businesses with less than 10 employees. Apart from the analysis, the project also included a study of various processes, types, and models of PEN-testing. It presents a detailed discussion of seven different types of penetration and two models of pen-testing. With the wide range of pen-testing tools on the market today, practitioners often find it confusing to make properly informed decisions when searching for suitable tools. A study by [11] provides an overview of pen-testing and a list of the criteria for selecting suitable pen-testing tools for a given purpose. The paper briefly describes the selected tools and then provides a comparison of the tools. As society continues to depend on technology, hacking remains an underlying security threat to computer systems. Authors in [12] analyzed the tools, techniques, and mathematics involved in pen-testing. The study introduced the idea of pen-testing and investigated the security and vulnerability of the server of Appalachian State University’s Computer Science Department. The work began by obtaining permission from the appropriate system administrators, including a discussion on the scope of the PEN test, before launching an attack on any of the systems. The project then obtained background information on the Department of Computer Science, followed by the formulation of a targeted attack focusing on the flaws in the Linux kernel, called Dirty COW or CVE-2016-5195. Eventually, root access was gained through Dirty COW, which enabled the fetching of both the /etc./passwd and /etc./shadow files. A total of 61.01% of all the passwords stored in the Shadow File were cracked using oclHashcat. The CVE-2016-5195 awareness campaign will enable the hardening of the Appalachian State University’s Computer Science Department’s server (student.cs.appstate.edu), preventing future exploitation of the vulnerability CVE-2016-5195 by malicious attackers. The work also contributed to the awareness of security vulnerabilities and their ongoing importance in the 21st century. There are two types of web vulnerability scanners (WVSs): open-source and commercial web vulnerability scanners. However, the two vary in terms of their vulnerability detection performance and capability. Authors in [13] conducted a comparative study to determine the capabilities of eight VWSs (Iron WASP, Skipfish, HP Web Inspect, Acunetix, OWASP ZAP, IBM App Scan, Arachni, and Vega) to detect vulnerabilities. The study examined the use of two Web apps: Web Goat and Damn Vulnerable Web Application. The study used multiple evaluation metrics to evaluate the performance of the eight VWSs. These include web application security scanner evaluation criteria, the OWASP benchmark, the Youden Index, recall, and precision. According to experimental results, other than commercial scanners, some open-source vulnerability scanners such as Skipfish and ZAP are also effective. The study recommended that there is a need to improve the vulnerability detection capability of commercial and open-source scanners to improve the detection rate and code coverage and minimize the number of false positives. While there are various open-source web application security scanners with similar functionalities, it is always important to choose the best one. In [14], the authors carried out a comparison and assessment study on different open-source web application security scanners, with a specific focus on the OWASP Top 10 (2013) Application Security Risks. One of the significant findings of this study was that Skipfish 2.07, Arachniv 0.40.0.3, and W3AF 1.2 emerged as the best among the sampled security scanners. The authors demonstrated the difference between open-source scanners that concentrated on session management, injection, cross-site scripting, and broken authentication. The growing requirement to perform pen-testing of network and web applications has increased the need for benchmarking and standardizing the techniques that penetration testers use. The author of [15] examined modern web pen-testing tools and compared them to an OWASP vulnerability list. The paper also addresses the lack of literature for scanner evaluation frameworks with a 360-degree view. Their research work indicates that scanners that have configured crawling and web proxies show better performance compared to shot and joint scanners. The author also observed that scanners that have an active maintenance cycle showed better performance. Thus, the study concluded that to obtain reliable results, penetration testers should use multiple automated scanning tools to detect multiple vulnerabilities. There is a difference in the design of the algorithms and techniques used by dynamic, interactive, and static security testing tools. Thus, each tool varies in the level or extent to which it detects the vulnerability that it is designed for. Moreover, because of their different designs, their percentage of false positives also differs. To take advantage of the potential synergies that various types of analysis tools may have, authors in [16] combined various dynamic, interactive, and static security testing tools into static application security testing (SAST), dynamic application security testing (DAST), and interactive application security testing (IAST), respectively. The study was aimed at ways of improving the effectiveness of security vulnerability detection while minimizing the number of false positives. Specifically, the authors combined two interactive security analysis tools and two dynamic security analysis tools to study their behaviors using specific OWASP Top 10 security vulnerability benchmarks. The study recommended using a combination of DAST, SAST, and IAST tools in both the development and testing phases of Web application development.

5. Research Methodology

In this section, we discuss the research methodology. Figure 2 shows steps undertaken in our research methodology for comparing and evaluating the selected web application pen-testing tools.

5.1. Selection of Top 6 Tools

We started our research work with a collection of tools based on the most repeated tools in the latest published academic comparison papers. Then, we surveyed the experts in the cybersecurity industry to choose the top six of them. The objective was to select and evaluate the top 6 tools that are preferred by experienced penetration testers in the cybersecurity industry. We also made certain that we had the most recent version of each tool available until the project deadline, as shown in Table 1.

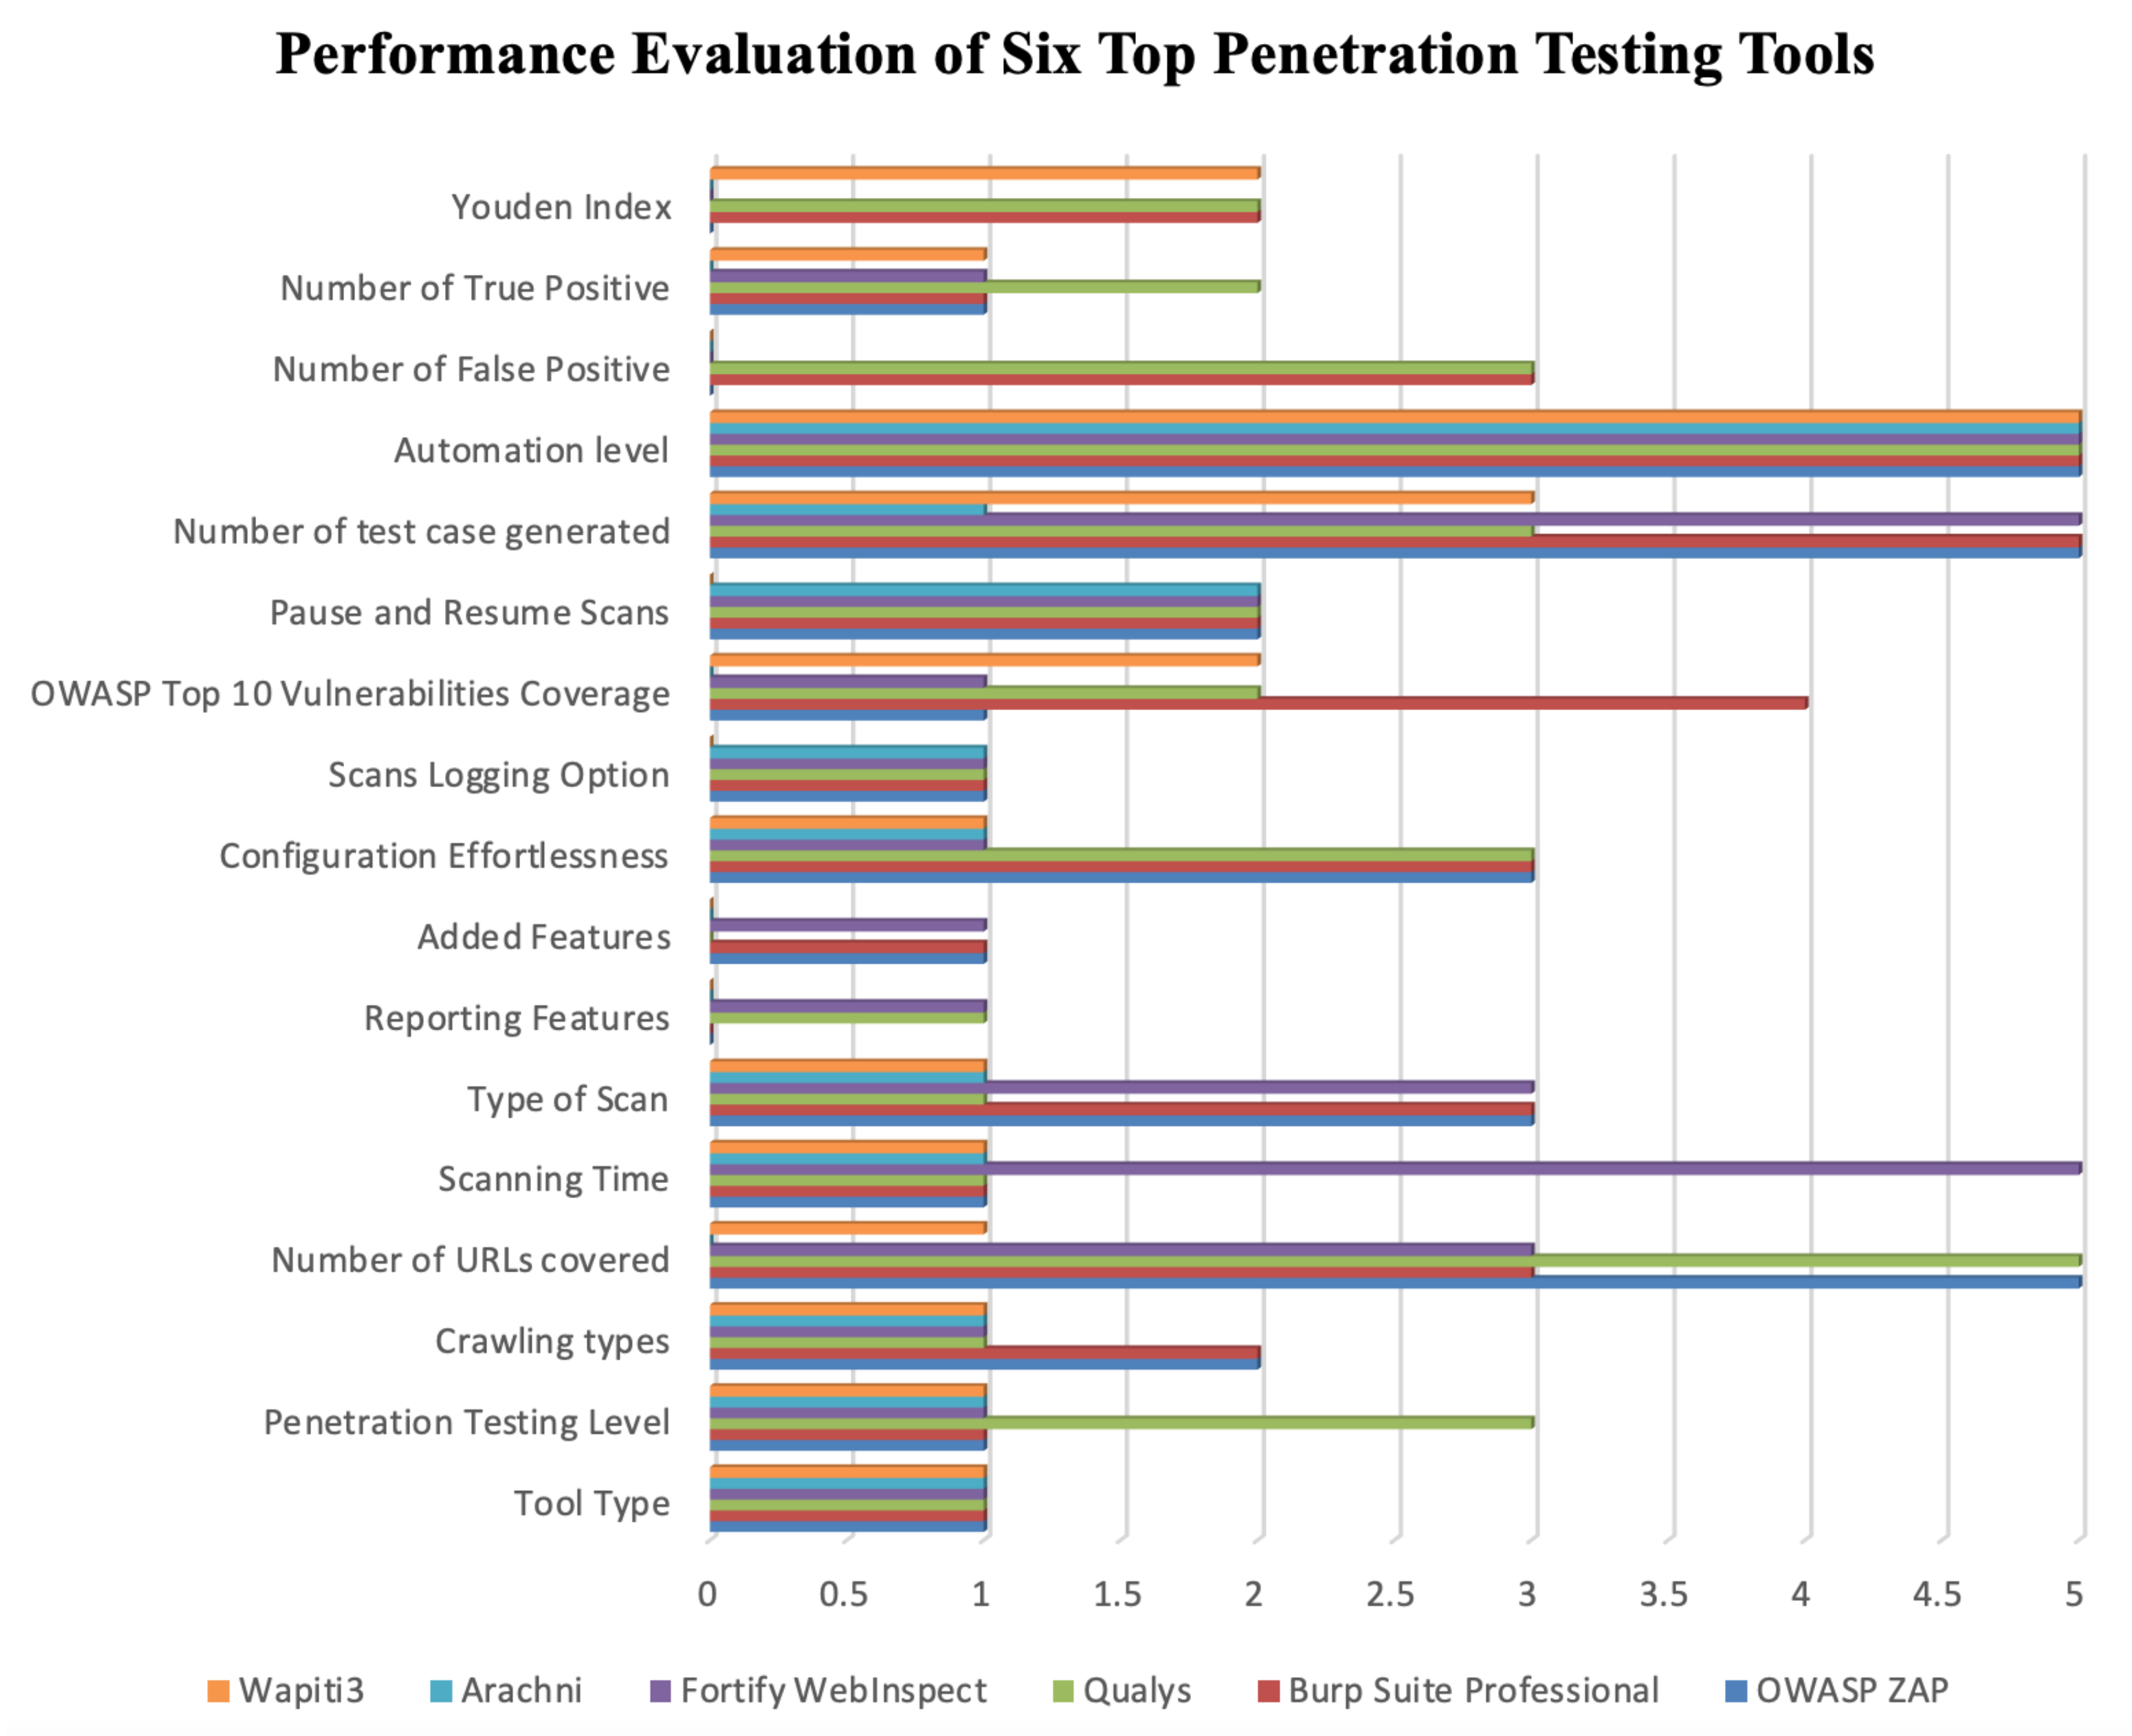
5.2. Design of a Framework for Evaluation Criteria

This subsection describes a comprehensive comparative benchmark framework to evaluate the selected top six pen-testing tools. We specified the selected metrics to evaluate the tools in all aspects. After considering existing web application scanner evaluation frameworks such as [10,11,17,18,19], we proposed a new framework that is similar to their methods but covers more ground with benchmarking metrics and criteria as an enhancement for seekers in the web pen-testing field. We looked at all of the criteria in [13,20,21,22] to build one framework that includes all of the following: test coverage criteria, attack coverage criteria, vulnerability detection criteria, and efficiency criteria.
Based on our evaluation of different web application scanner evaluation frameworks such as the OWASP Benchmarking Project, WAVSEP, and the Web Input Vector Extractor Teaser (WIVET), we found that most of them focused on specific areas of the automated scanners with limited metrics to validate the performance of the scanner. Therefore, we proposed a framework that covers more ground as compared to existing frameworks. We added more parameters, which we will be considering while evaluating the web application scanners. In addition, we used a scoring system that was used previously in [10] to comparatively analyze each tool. Each key parameter has a score system as follows:
  • Scanner Scoring System: The selected criteria will be kept in mind while benchmarking the top 6 web application PEN-testing tools. We use the proposed score system in [10] to evaluate the tools. Furthermore, each key metric has a point system of up to 5 points.
  • Criteria and Metric Selection: The used benchmarking metrics and criteria for tool evaluation are presented as follows:
    Graphic user interface (GUI);
    Command-line interface (CLI). The GUI interfaces are always preferred by most pen-testers in PEN-testing web applications, rather than CLI.
    Score for tool type:
    1: only CLI or only GUI;
    2: both CLI and GUI.
  • Penetration Testing Level: Recent scanning tools can grasp web application sessions and detect variations in web application source code. Most automated web application PEN-testing tools only use the black box test method in authenticated scans. Score for the type of penetration test:
    1: only use the black box test method;
    2: methods of black box and gray box testing;
    3: methods of testing in the black box, gray box, and white box.
  • Crawling Types: There are two types of crawling: passive crawl and active crawl. The active crawl is the first step before the active scanning, which catalogs the found links. However, the passive crawl is best for covering. Score for crawling ability:
    1: only passive crawler or only active crawler;
    2: active crawler and passive crawler.
  • Number of URLs Covered: Web application crawling is a part of the information gathering stage in the PEN-testing process [10]. In this stage, a penetration tester would like to gather as much information as possible about the web application. Crawler coverage can be signified by the number of URLs crawled by the scanner; the more URLs the scanner covers, the higher the score as follows. Score for covered URLs:
    1: less than 25% coverage;
    2: 25% to 50% coverage;
    3: 50% to 70% coverage;
    4: 70% to 90% coverage;
    5: more than 90% coverage.
  • Scanning Time: The automated tools developed by penetration testers cover a greater area in a large web application with less possible time. Therefore, the time taken is important for scanner evolution. Score for scanning time:
    1: more than 6 h;
    2: more than 3 h;
    3: more than 2 h;
    4: more than 45 min;
    5: less than 30 min.
  • Types of Scan: There are two types of scans in web application PEN-testing, passive and active. In this metric, the scanner with active and passive options takes the highest point. Score for scan type:
    1: only active scan or only passive scan;
    2: active and passive scan;
    3: active, passive, or policy scan.
  • Reporting Features: The reports can be formatted depending on the compliance policy that the penetration tester needs to analyze, which is a recent feature in scanners. Some of these standards are OWASP Top 10, HIPAA, and so on. There are several normal formats for reporting, such as HTML, PDF, and XML. The compliance policy reports are emptier and easier to analyze by the penetration tester. Score for reporting features:
    0: HTML, PDF, and XML reports;
    1: compliance standers report such OWASP Top 10 and HIPAA.
  • Added Features: Some automated tools have add-ons and extension features that improve the scanner performance in vulnerability detection. Most penetration testers take advantage from these features. Score for add-ons and extension features:
    0: no add-ons and extension features;
    1: with add-ons and extension features.
  • Configuration Effortlessness: A previous article [10] defined three levels of configuration (difficult, hard, and easy). The difficult level means needing requirements such as server and database configuration to launch the scanner; hard requires some dependencies before tool installation; easy does not need any obligations to launch the scan. Score for configuration level:
    1: difficult: requirements are needed, such as server and database configuration to launch the scanner;
    2: hard: some dependencies are needed for installation;
    3: easy: (plug-and-play) out-of-the-box ready-to-use application.
  • Scans Logging Option: The logs are essential in PEN-testing to monitor and detect thousands of requests and responses. Logging these processes is important to retrieve them when needed. Some automated tools provide these options to store logs in formats such as txt, csv, html, or xml [10]. Score for scan logs:
    0: no scan log option;
    1: scan log option.
  • Tool Cost: The cost of the tool is an important factor in choosing the right tool. More features with low cost are an essential metric for penetration testers and organizations. In addition, some frameworks have better performance depending on their brand and continued development by offered cost.
  • OWASP Top 10 Vulnerabilities Coverage: The OWASP Top 10 Vulnerabilities are essential for evaluating many organizations and penetration testers use penetrating tools to cover the top 10 vulnerabilities in their web applications and protect their assets from the known vulnerabilities. Developers and software testers are also trying to avoid these top 10 vulnerabilities. This metric will evaluate the degree of covered vulnerabilities from the total existing vulnerabilities in the OWASP benchmark. Score for vulnerabilities coverage:
    1: less than 25% coverage;
    2: 25% to 50% coverage;
    3: 50% to 70% coverage;
    4: 70% to 90% coverage;
    5: more than 90% coverage.
  • Pause and Resume Scans: The ability to pause and resume the scan from the same point is a strength factor for the scanner and it helps the pen-tester reduce the time for rescanning the web application. Score for test coverage:
    0: no ability to pause and resume scans;
    1: the ability to only pause or only resume scans;
    2: the ability to pause and resume scans.
  • Number of Test Cases Generated: This evaluates the number of test cases produced by a web application security scanner in a scanning session [13]. Score for the number of test cases generated:
    1: less than 100 test cases;
    2: 200–300 test cases;
    3: 500–700 test cases;
    4: 800–1000 test cases;
    5: more than 1000 test cases.
  • Automation Level: In this metric, we evaluate the scanner proficiency to automate the scan without penetration tester manual association. Score for automation level:
    1: 100% tester involvement needed;
    2: 80% tester involvement needed;
    3: 70% tester involvement needed;
    4: 50% tester involvement needed;
    5: less than 30% tester involvement needed.
  • Number of False Positives: The false positive is an unreal indicator for vulnerabilities in the OWASP benchmark reported by the scanner. Fewer false positive percentages are helpful for penetration.
    False positive formula:
    F P R = F P F P + T N × 100
    Score for false positive number:
    1: greater than 50%;
    2: greater than 30%;
    3: less than 30%.
  • Number of True Positives: The true positive means that the real vulnerability number in the OWASP benchmark is detected correctly by the scanner. It is the most important metric in vulnerability detection criteria.
    True positive formula:
    T P R = T P T P + F N
    Score for true positive number:
    1: less than 10%;
    2: up to 25%;
    3: up to 50%;
    4: 50% and higher.
  • Youden’s Index: The Youden index was proposed to evaluate the performance of analytical (diagnostic) tests [11]. The Youden equation outputs either 1 or −1, as follows:
    {1} means that the scanner detected the vulnerabilities absolutely with no false-positive vulnerabilities;
    {−1} means that the scanner detects only false-positive vulnerabilities with no actual vulnerabilities;
    {0} means that the tool outputs the same expected result from the web application (FP, TP). The formula of the Youden index [11] and our scoring system are as follows:
    Youden index formula:
    J = T P T P + T N + T N T N + F P 1
    Score for Youden’s index:
    1: only FP no TP {−1};
    2: same expected {0};
    3: detected vulnerabilities absolutely {1}.
We have enhanced the framework above with additional metrics covering all evaluation criteria aspects for web application PEN-testing scanners, as summarized in Table 2. Our framework sets a scoring up to 53 points, as listed in Table 2. We can benchmark any web PEN-testing tool to choose the better one depending on the needed metrics.

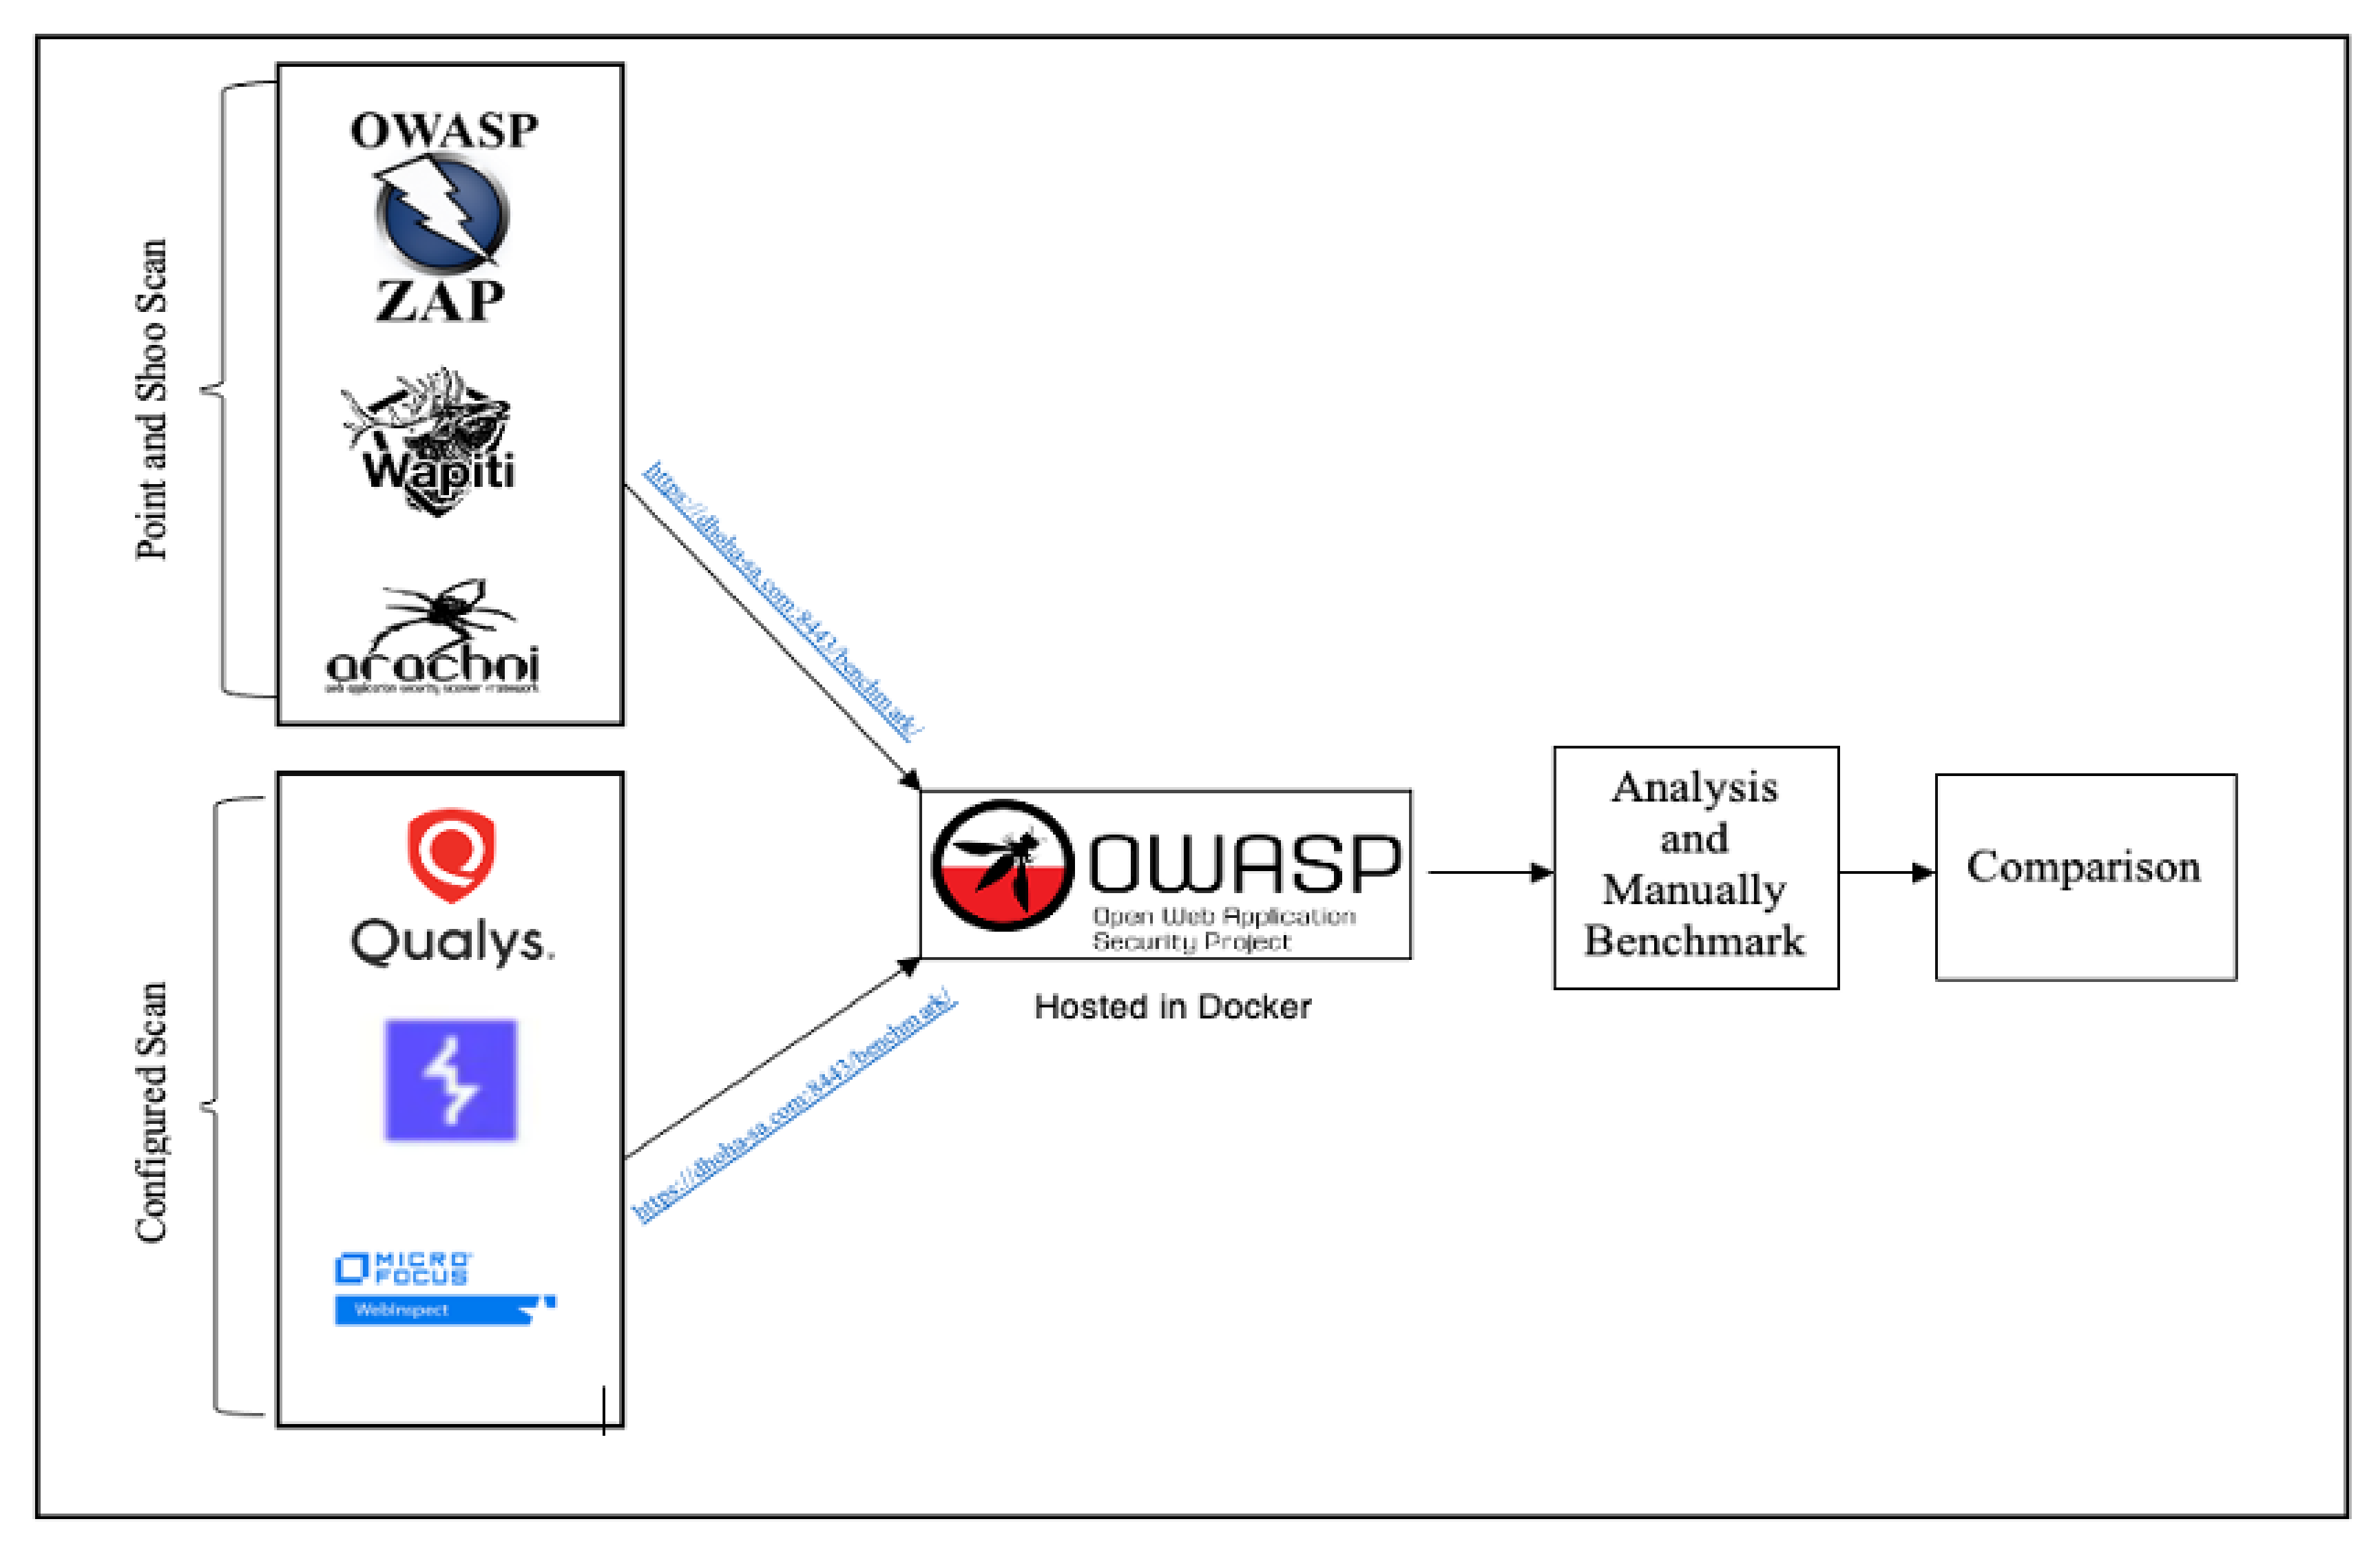
6. Experimental Setup

In this section, we describe our implementation approaches. We have taken two main test implementation approaches. Firstly, we did the environment setup, then we configured the scan configuration and started the benchmarking, using the OWASP benchmark test tool to evaluate the scanner’s crawling and vulnerability detection coverage. After benchmarking, we analyzed the results and compared them using our proposed method of evaluation.

6.1. Environment Setup

Our tools’ installation and evaluation environment are detailed in Table 3.

6.2. Evaluation Approach

Our test approach was as below:
  • Download the OWASP Benchmark Project in docker.
  • Register DNS with GoDaddy to make the OWASP Benchmark Project publicly available.
  • Set a port-forwarding in our home router.
  • Download the top 6 tools, each tool has its own needed environment as detailed in Table 3.
  • Set the configuration for each tool depending on the type of pre-scan selected.
  • Start attacking the OWASP Benchmark Project with the tools.
  • Generate the results in XML format.
  • Put the results into the OWASP Benchmark Project.
  • Run the score calculator by the OWASP Benchmark Project against the XML reports for the tools.
  • Take the score results and start our manual benchmarking using our proposed framework.
  • Compare the tools after the overall benchmarking.
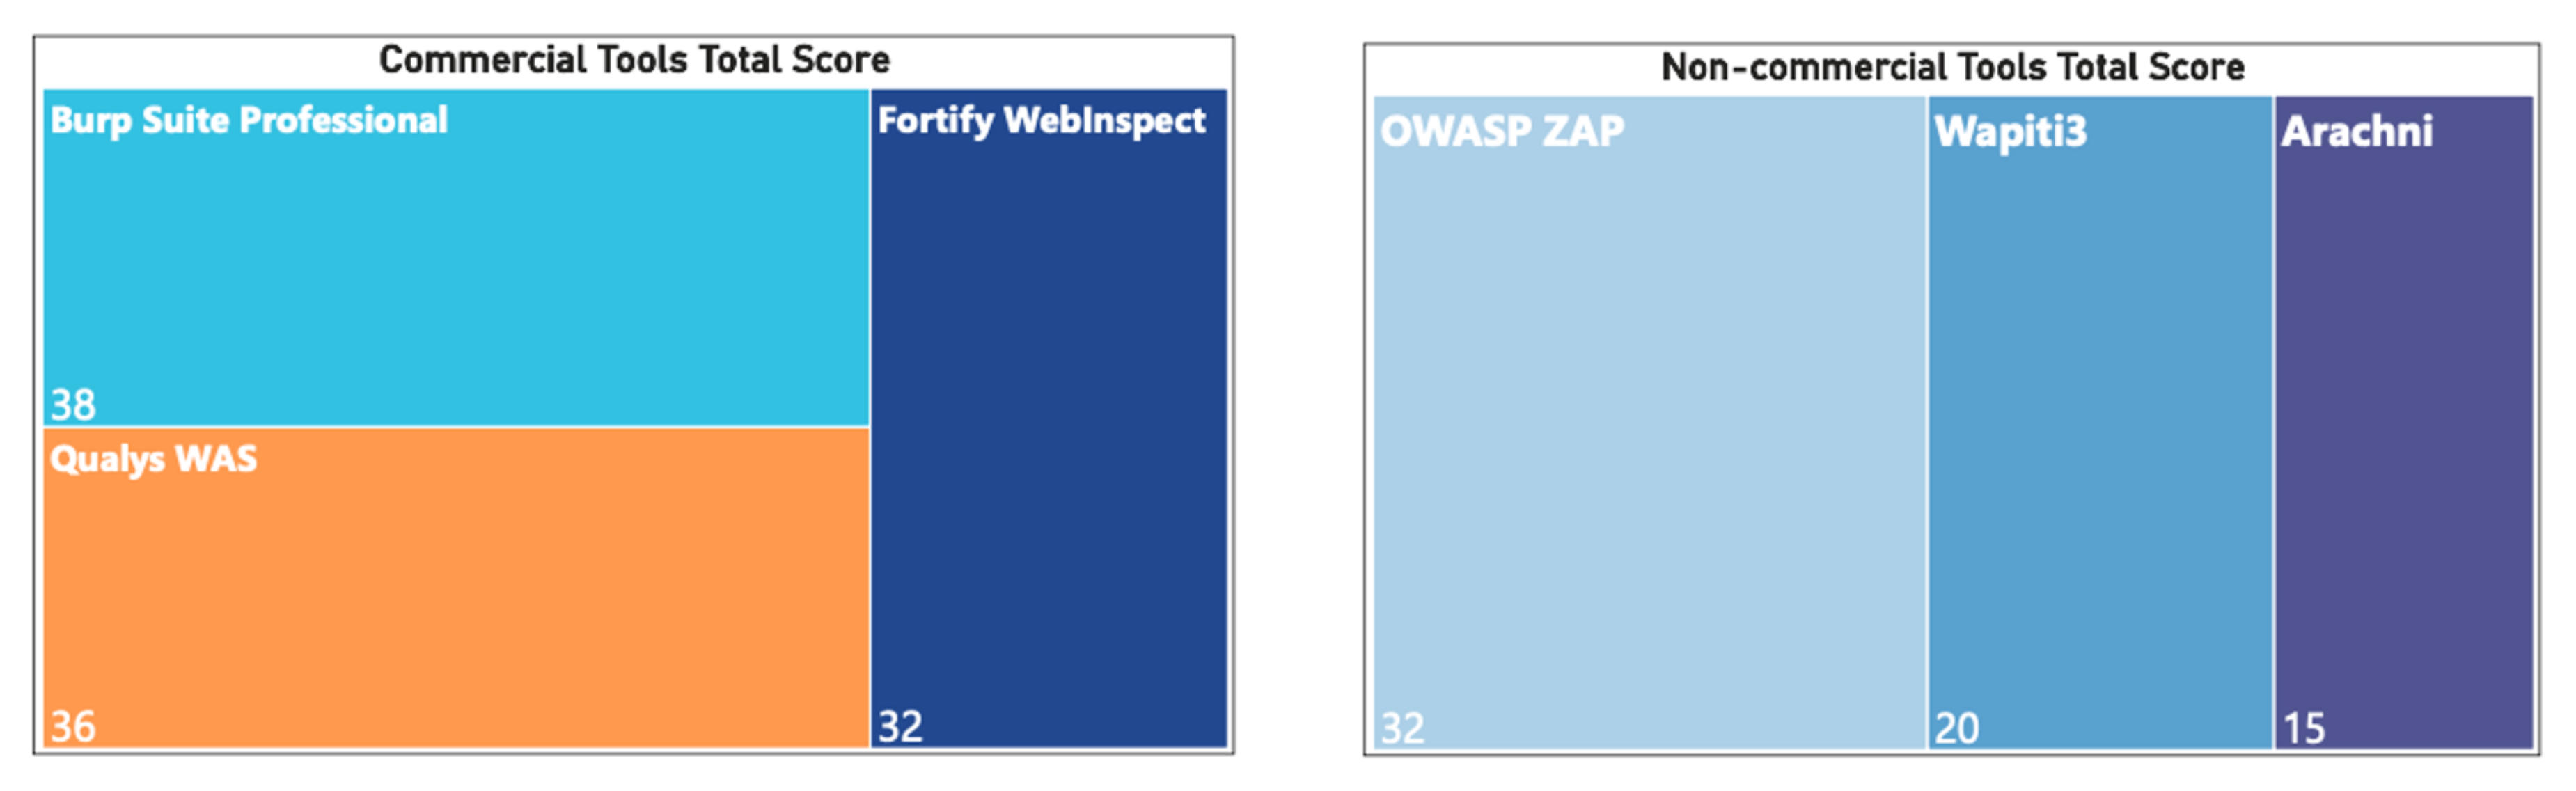
The summary of our implementation process is shown in Figure 3.
We used the Open Web Application Security Project’s (OWASP) list of vulnerable web applications as a test to see how well our top six pen-testing tools could find vulnerabilities in web applications. The OWASP Benchmark is an open-source project that covers all the top 10 vulnerabilities and is commonly used for WAVS benchmarking. It also has an accurate scoring process.

7. Result

In this section, we divided the best six tools into two categories. In the first category, commercial tools including Qualys WAS, Fortify WebInspect, and Burp Suite Professional are compared and contrasted. In the second category, we examined the disparities between free, open-source software programs such as OWASP ZAP, Arachni, and Wapiti3. Our results from benchmarking serve as the basis for the comparisons.

7.1. Case One: Commercial Tools

Tool Type: The Graphic User Interface (GUI) is helpful for penetration testers to catch all the tool’s features easily. Because most commercial tools use graphical user interfaces (GUI), Burp Suite Professional, Qualys WAS, and Fortify WebInspect each received 1 point for using only GUI.
pen-testing Level: Qualys WAS obtained 3 points in view of its capability to penetration test all black box, gray box, and white box test methods. On the other hand, Burp Suite Professional and Fortify WebInspect get 1 point because they only use the black box method.
Crawling types: Burp Suite Professional gets a higher score (2 points) than Qualys WAS and Fortify WebInspect. It has the ability to apply active and passive crawling, whereas Qualys WAS and Fortify WebInspect scored 1 point since they can only crawl actively.
The Number of URLs covered: Qualys WAS scored 5 points, then Burp Suite Professional and Fortify WebInspect scored 3 points, they covered 50% to 70% of the benchmark URLs. Qualys WAS crawled 4979 URLS, which is 90.5% of 5500 URLs. On the other hand, Burp Suite Professional crawled 3231 URLs, which is 58%; Fortify WebInspect crawled 3598 URLs, which is 65%. However, Qualys WAS received the highest score in this metric.
Scanning Time: Scanning speed is important for the pen-tester, especially for vulnerability detection. Fortify WebInspect gets the highest score (5); its scan took 15 min. In comparison, Qualys WAS and Burp Suite Professional both received a score of 1. The Qualys WAS scan took 24 h and did not cover the whole site. Burp Suite Professional took over 12 h.
Type of Scan: Fortify WebInspect and Burp Suite Professional use active and passive scan modes. Fortify WebInspect also has scan by policy mode, which is a new and helpful feature. It can let you choose a known policy, or you can create your own one. However, Fortify WebInspect and Burp Suite Professional received 3 points. Conversely, Qualys WAS uses only active scan modes such as discovery scan and vulnerability scan (1 point).
Reporting Features: Fortify WebInspect and Qualys received 1 point each. Besides their ability to generate standard reports in HTML and PDF, they can also generate a report depending on the needed compliance with OWASP Top 10, ISO, or a custom template. On the other hand, Burp Suite Professional only generates standard reports in HTML or PDF.
Added Features: Qualys was scored 0 because it does not support any features that can be added. On the contrary, Fortify WebInspect and Burp Suite Professional got support for adding features (1 point). Fortify WebInspect has simulated attack tools for SQL injection, HTTP editor, server analyzer, web proxy, traffic viewer, and SWF scan. They are available during the scan, manually and automatically. With Burp Suite, a professional pen-tester can configure the scanner specifications as he needs, and he can also download add-ons from the updated marketplace.
Configuration Effortlessness: Qualys was scored and Burp Suite Professional received 3 points because it was configured easily (Plug and Play) out of the box and was ready to use after installation. Qualys is a cloud-based platform, whereas Burp Suite Professional was an easily installed application. On the contrary, Fortify WebInspect required dependencies before completing installation such as SQL Server; for this difficulty, the score is 1 point.
Scanning Logging Option: Burp Suite Professional, Fortify WebInspect, and Qualys WAS all received the same: 1 point. Burp Suite Professional logs all requests and responses during the scan, whereas Qualys logs all scans with a date filtering option. Fortify WebInspect logs all scans with their results and gives you the ability to generate reports for them.
Tool Cost: Each tool has its own installation features and cost, depending on what the consultant pen-tester or organization requires. Qualys costs USD 30,000 per year to cover WAS and VM Security, which are additional services. Burp Suite Professional costs USD 399 per year for personal or consulting pen-tester use, while Fortify WebInspect costs USD 24,000 per year.
OWASP Top 10 Vulnerabilities Coverage: Burp Suite Professional covered 5% command injection, 8% cross-site scripting, 3% insecure cookie, 4% LDAP injection, 3% path traversal, 8% SQL injection, and 7% XPath injection. The scanner covers 70% of the OWASP Top 10. In complement to this, Burp Suite Professional scored 5 points, which is higher than the rest of the tools. QUALYS covered the following categories in one scan: 24% command injection, 38% cross-site scripting, 53% insecure cookies, and 32% SQL injection. Qualys covered 40% of the OWASP Top 10 vulnerabilities and scored 2 points. As was not expected, Fortify WebInspect only detected one SSL cipher, and the rest of the vulnerabilities were best practice. In the OWASP Top 10 Vulnerabilities Coverage, it could be 14 percent or less. After comparison, Burp Suite Professional is the best in OWASP’s Top 10 Vulnerabilities Coverage (see Table 4).
Pause and Resume Scans: Burp Suite Professional, Fortify WebInspect, and Qualys WAS have the capability to pause and resume scans. They all scored the same (2).
Number of test case generated: Burp Suite Professional and Fortify WebInspect received 5 points. However, Fortify WebInspect is the highest generator of test cases. It sent 68,730 attacks in one scan, whereas Burp Suite Professional generated 3235 test cases in one scan. In dissimilarity, Qualys WAS generated fewer test cases; it generated 591 test cases in one scan and scored 3 points.
Automation level: Burp Suite Professional, Fortify WebInspect, and Qualys WAS received 5 points in this metric. They do not need any involvement by a pen-tester during the scan.
Number of False Positives: Qualys WAS and Burp Suite Professional received 3 points each. They resulted in the lowest false positive vulnerabilities. The number of FP vulnerabilities in Qualys WAS is 3, 3/591 × 100 = 0.50%. On the other hand, FP vulnerabilities in Burp Suite Professional are 3, 3/3235 × 100 = 0.09%. In Fortify WebInspect, the scan results only covered 1%. Therefore, no FP vulnerabilities.
Number of True Positive: Fortify WebInspect and Burp Suite Professional received 1 point less than Qualys WAS. In Fortify WebInspect, the TP number is 261 (261/2741 × 100) which is 9.5% less than 10%. Burp Suite Professional’s TP number is 56, 56/3235 × 100 = 1.73%. Qualys WAS received a higher score (2). The TP number is 233, which is 233/591 × 100 = 39.4%. Qualys WAS detected a higher number of true positive vulnerabilities.
Youden Index: Fortify WebInspect and Burp Suite Professional received 2 points in the Youden Index. The Youden Index for Qualys WAS is 0.14%, which means that the tool outputs the same expected result as the web application (FP, TP). Likewise, Burp Suite Professional (0.0%) also outputs the same expected result. While this is the case, Fortify WebInspect did not detect any FP; therefore, there was no calculation for the Youden Index. To sum up the comprehensive comparison between Fortify WebInspect, Burp Suite Professional, and Qualys WAS, the scores in Figure 4 illustrate the strongest features of each tool.
Qualys WAS is a fully automated tool and solid in web application crawling coverage.
Burp Suite Professional is the best in OWASP top 10 vulnerability coverage and the highest in test case generation. It has the ability to automate the scans fully or partially. In addition, it can scan actively or passively with a customized scan template. In addition, it has less false positive vulnerabilities with a high true positive detection capability. Fortify WebInspect is the best in scanning speed, scan customization, report features, adding features/add-ons to the scan. In addition, it can impressively intercept the HTTP requests and simulate the attack (see Figure 5).

7.2. Case Two: Non-Commercial Tools

In the non-commercial category, we compared Arachni, Wapiti3, and OWASP ZAP using our framework to determine which metric is a tool’s strength or weakness.
Tool Type: Arachni, OWASP ZAP, and Wapiti3 scored the same (1 point) because they were using only the command line interface (CLI) or only the graphic user interface (GUI). Arachni and OWASP ZAP use only graphic user interface (GUI). On the contrary, Wapiti3 uses only a command line interface (CLI).
Pen-testing Level: Most open-source tools use black box pen-testing levels, especially open-source vulnerability detection tools, as we see in the kali toolkit. While this is the case Arachni, OWASP ZAP, and Wapiti3 are using only the black box method. As a result, they both received the same (1 point).
Crawling types: According to its ability to use both active and passive crawlers at the same scan, OWASP ZAP received 2 points, which is higher than Arachni and Wapiti3. Conversely, Arachni and Wapiti3 scored 1 point each because they are only able to crawl actively.
Number of URLs covered: OWASP ZAP scored higher points than Arachni and Wapiti3 in coverage of the benchmark’s URLs. OWASP ZAP received 5 points for coverage of more than 90% of the OWASP benchmark. OWASP benchmark has nearly 5500 URLs, and OWASP ZAP was able to discover 30,369 URLs, which means it covered all the benchmark URLs. Arachni did not crawl, although it should have crawled as said by the tool site, so it scored 0. In contrast, Wapiti3 scored 1 for crawling 621 URLS, which is 11% of the nearly total 5500 URLs.
Scanning Time: All the three tools (OWASP ZAP, Wapiti3 and Arachni) scored the same (1 point). It took all of them over 6 h to finish one scan. The Wapiti3 scan time was over 21 h, and yet, Arachni took over 48 h. That aside, OWASP ZAP scanning time was over 7 h, which is less than that of the others. At least, OWASP ZAP was faster after comparison.
Type of Scan: Then again, OWASP ZAP scored higher points than Arachni and Wapiti3 in scan types. OWASP ZAP received 3 points, which is the maximum score according to its ability to use both active and passive scan modes. Despite this, Wapiti3 and Arachni can only scan in active mode, so they scored the same (1 point).
Reporting Features: OWASP ZAP, Arachni, and Wapiti3 scored 0 in this metric, rendering their expected standard reports. They do not have additional reporting features.
Added Features: Then again, OWASP ZAP scored higher points than Arachni and Wapiti3 in its ability to add extensions and add-ons for stronger scanner and better vulnerability detection. In addition, it has an updated marketplace for installing add-ons. Arachni and Wapiti3 scored 0, due to their incapability to add extensions and add-ons to their scanner.
Configuration Effortlessness: As expected, OWASP ZAP scored higher points than Arachni and Wapiti3 in the effortlessness of configuration. However, Arachni needs JAVA JRE, PostgreSQL server to complete the installation. Likewise, it requires dependencies such as JAVA JRE, Python 3.x, httpx, BeautifulSoup, yaswfp, tld, Mako, and httpx-socks to complete the installation.
Scanning Logging Option: OWASP ZAP and Arachni received 1 point, which is higher than Wapiti3 according to their ability to log the scans. OWASP ZAP can log all requests and responses during the scan, whereas Arachni logs all scans but without the results of vulnerability detection. Conversely, Wapiti3 scored 0 since it has no logging option.
Tool Cost: All three tools (OWASP ZAP, Wapiti3 and Arachni) are free. However, WASP ZAP is more rapidly updated than the others, which is a great feature to keep up with the new vulnerability detection.
OWASP Top 10 Vulnerabilities Coverage: Unexpectedly, Wapiti3 scored two points, which is higher than OWASP ZAP and Arachni in coverage of the top 10 vulnerabilities by one scan. In one scan, Wapiti3 covered the following categories: 9% Command Injection, 9% Cross-Site Scripting, 1% Path Traversal, 3% SQL Injection. Wapiti3 covered 40% of the OWASP Top 10 Vulnerabilities. On the other hand, OWASP ZAP only covered 1% of the Cross-Site Scripting category, which was not a predictable result. In addition, as considered by the OWASP ZAP official site, a pen-tester needs to add some add-ons to improve the ZAP scanner’s detection of the top 10 OWASP vulnerabilities. On the contrary, Arachni scored 0 because it did not detect any vulnerability. This issue was in version 0.5.12 [10], and the updated version v1.5.1 did not patch the issue we considered. Table 5 compares the coverage percentages of the top ten OWASP vulnerabilities.
Pause and Resume Scans: OWASP ZAP and Arachni scored higher than Wapiti3 in this metric. They both can pause and resume functionality, whereas Wapiti3 did not. OWASP ZAP and Arachni scored 2 points each, whereas Wapiti3 received 0.
Number of test cases generated: OWASP ZAP received the maximum points (5) in test case generation, then Wapiti3 (3), followed by Arachni (1). OWASP ZAP generated 8799 test cases in one scan, whereas Wapiti3 generated 621 test cases in one scan and Arachni generated nearly 50 test cases in one scan.
Automation level: The three tools (OWASP ZAP, Wapiti3 and Arachni) scored 5 points since they needed less than 30% pen-tester involvement.
Number of False Positive: According to benchmark results, OWASP ZAP, Wapiti3 and Arachni did not report false positive vulnerabilities.
Number of True Positive: OWASP ZAP scored 1 point since the scan results only covered 1% in the Cross-Site Scripting category; however, the result of benchmarking the rest was 0%. Therefore, there were no FP vulnerabilities, and the TP number was 3. Similarly, Wapiti3 scored 1 point because the TP number is 42, which is less than 10%. On the contrary, Arachni did not detect any vulnerability.
Youden Index: Wapiti3 received a higher score (2 points) than OWASP ZAP and Arachni. The Youden Index for Wapiti3 is 0.03%. This means that the tool outputs the same expected result from the web application in (FP, TP). On the other hand, OWASP ZAP and Arachni did not detect any FP, so there was no possible calculation for the Youden Index. Finally, each tool has its own strength and weakness. Here, you can find some of the strengths:
OWASP ZAP is the top tool in crawling coverage, crawling, and scanning actively/passively and yet generated the highest test cases. It is a fully automated tool with zero configuration efforts (see Figure 6).
Figure 7 presents an empirical comparison of the top 6 web application pen-testing tools using our proposed benchmark framework. Appendix A represents the benchmarking results and evaluation score for OWASP ZAP, Burp Suite Professional, Qualys WAS, Arachni, Wapiti3, and Fortify WebInspect in detail.

8. Discussion

The effectiveness of all web vulnerability scanners should be evaluated using a set of “benchmark” web applications and all OWASP Top 10 types of vulnerabilities. We proposed benchmarking, which extends the framework to new metrics and applies the benchmarking methodology. Consequently, new standards and benchmark Web applications were developed. These standards covered the majority of Web application domains. This ensures that the results of Web vulnerability scanners are comparable and complete. Due to the lack of standardization in most of the literature, it is challenging to measure and compare our results with previous studies. In addition, Web vulnerability scanners should also be evaluated based on their usability and performance. This research found that only a small number of surveys and overviews of black box web vulnerability scanners with limited metrics have been done. The majority of these surveys and overviews instead focus on summarizing the general ideas of the approaches without focusing on their effectiveness and characteristics [8,23,24,25]. On the other hand, the current study includes a systematic review of the literature about the most popular web vulnerability scanners, extending the framework to new metrics and applying the benchmarking approach, summarizing their features, and discussing the performance of different scanners to find common web application vulnerabilities.

9. Conclusions

We presented an empirical comparison of the top six web application pen-testing tools (OWASP ZAP, Burp Suite Professional, Qualys WAS, Arachni, Wapiti3, Fortify WebInspect) using our proposed benchmark framework. Then, we split the top six tools into two common use cases: commercial tools and non-commercial tools. We aimed to make our proposed framework comprehensive and adequate with all the required features to suit pen-tester needs. Generally, the penetration tester should take advantage of all the strengths of each tool separately, according to their needs. Moreover, each tool has strengths and weaknesses. For instance, Burp Suite Professional, and Qualys WAS are the best in vulnerability detection, notwithstanding their delay in performing the task completely. On the other hand, the automated tool, Fortify WebInspect, did not detect any vulnerabilities in a 15 min scan, but if the pen-tester used the manual attack simulation feature, it would be helpful to use it to manually assess known vulnerabilities. In addition, OWASP ZAP and Burp Suite Professional are crawling powerfully. Future work will include extending the framework to more new metrics and applying the benchmarking approach to other new tools. The OWASP Top 10 Benchmark Project can be extended to other benchmarks and real-life vulnerable environments as long as it is possible to provide deep results that help in choosing the best tool depending on the required task.

Author Contributions

M.A.: concept and design research, supervision, and final revision. M.A. and D.A.: study concept and design; writing of the initial draft; data extraction, analysis, and interpretation. A.J.: review, analysis, and interpretation of the full text; manuscript preparation. M.A. and A.J.: abstract screening, data extraction, analysis, and interpretation. A.J. and D.A.: full text review, analysis and interpretation, and manuscript preparation. All authors have read and agreed to the published version of the manuscript.

Funding

This research received no external funding.

Data Availability Statement

Datasets used to support the findings of this study are included within the article.

Conflicts of Interest

The authors declare that they have no conflict of interest.

Appendix A

Table A1. Results of benchmarking OWASP ZAP using our proposed framework in detail.
MetricScoreScore DetailsScore Reason
Tool Type11 point for Only Command line interface (CLI) or only Graphic user interface (GUI)GUI As Expected
Penetration Testing Level11 point for Only Black box test methodIt uses Only Black box test method
Crawling types22 points for Active crawler and Passive crawlerIt uses both Active crawler and Passive crawler in the same scan
Number of URLs covered55 points for More than 90% coverageOWASP benchmark has nearly 5500 URLs and ZAP was able to discover 30,369 URLs which is covered all the benchmark project
Scanning Time11 point for More than 6 hThe scan time was over 7 h
Type of Scan33 points for Active and Passive or policy scanIt uses both Active and Passive scan modes
Reporting Features00 for only HTML or PDF or XML reportsIt produces only standard reports
Added Features11 point for add-ons and extension featuresIt has updated Marketplace for installing add-ons
Configuration Effortlessness33 points for EasyIts config Easy (Plug and Play) out of the box ready to use application
Scans Logging Option11 point for scan log optionIt logs all request and response during the scan
Tool Cost Free Tool
OWASP Top 10 Vulnerabilities Coverage11 point for Less than 25% coverageThe scan results only covered 1% of Cross-Site Scripting category; however, the result of benchmarking the rest was 0%
Pause and Resume Scans22 points for The ability to pause and resume scansOWASP ZAP can pause and resume the scan
Number of test cases generated55 points for More than 1000 test casesOWASP ZAP generated 8799 test cases in one scan which is more than 1000 test cases
Automation level55 points for Less than 30%, needs tester involvementno need for pen-tester interaction
Number of False Positives00 for NoneThe scan results only covered 1% of Cross-Site Scripting category; however, the result of benchmarking the rest was 0%. Therefore, no FP vulnerabilities
Number of True Positives11 point for Less than 10%The scan results only covered 1% of Cross-Site Scripting category; however, the result of benchmarking the rest was 0%. Therefore, no FP vulnerabilities and the TP number is 3 which is less than 10%
Youden’s Index00 for NoneThe benchmark did not detect any FP; therefore, no calculation for Youden’s Index
Total score 32
Table A2. Results of benchmarking Burp Suite Professional using our framework in detail.
MetricScoreScore DetailsScore Reason
Tool Type11 point for Only Command line interface (CLI) or only Graphic user interface (GUI)GUI As Expected
Penetration Testing Level11 point for Only Black box test methodIt uses Only Black box test method
Crawling types22 points for Active crawler and Passive crawlerIt uses both Active crawler and Passive crawler
Number of URLs covered33 points 50% to 70% coverageThe crawled URLs is 3231 which is 58% of the benchmark URLs
Scanning Time11 point for More than 6 hIt took over 12 h
Type of Scan33 points for Active and Passive or policy scanIt uses both Active and Passive scan modes
Reporting Features00 for only HTML or PDF or XML reportsIt uses Only standard reports
Added Features11 point for add-ons and extension featuresPen-tester can configure the scanner specifications and download add-ons as needed
Configuration Effortlessness33 points for EasyIts configuration is Easy (Plug and Play), out of the box ready to use application
Scans Logging Option11 point for scan log optionIt logging all request and response during the scan
Tool Cost USD 399 Per Year
OWASP Top 10 Vulnerabilities Coverage44 points for 70% to 90% coverageIn one scan Burp Suite Professional covered 5% Command Injection, 8% Cross-Site Scripting, 3% Insecure Cookie, 4% LDAP Injection, 3% Path Traversal, 8% SQL Injection, 7% XPath Injection. The scanner covers 70% from OWASP Top 10.
Pause and Resume Scans22 points for the ability to pause and resume scansBurp Suite Professional can pause and resume the scan
Number of test cases generated55 points for More than 1000 test casesBurp Suite Professional generated 3235 test cases in one scan which is more than 1000 test cases
Automation level55 points for Less than 30%, needs tester involvementno need for pen-tester interaction
Number of False Positives33 points for Less than 30%The number of FP vulnerabilities in Burp Suite Professional is 3, 3/3235 × 100 = 0.09% which is less than 30%
Number of True Positives11 point for Less than 10%The TP number is (56) which is less than 10%, 56/3235 × 100 = 1.73%
Youden’s Index22 points for Same expected {0}The Youden Index for Burp Suite Professional is (0.0%) means the tool outputs the same expected result from the web application (FP,TP)
Total score 38
Table A3. Results of benchmarking Qualys WAS using our framework in detail.
MetricScoreScore DetailsScore Reason
Tool Type11 point for Only Command line interface (CLI) or only Graphic user interface (GUI)GUI As Expected
Penetration Testing Level33 points for Black box/Grey box/White box test methodsIt uses all test methods
Crawling types11 point for Only passive crawler or Only Active crawlerIt uses only Active crawler
Number of URLs covered55 points for More than 90% coverageQualys WAS crawled 4979 URLS which is 90.5% of 5500 URLs
Scanning Time11 point for More than 6 hThe scan took 24 h and did not cover the hole site
Type of Scan11 point for Only active scan or only passive scanIt uses only Active scan modes such as discovery scan and vulnerability scan
Reporting Features11 point for compliance standers reportIt uses compliance standard reports
Added Features00 for none add-ons and extension featuresQualys WAS not using add-ons
Configuration Effortlessness33 points for EasyIts configuration is Easy (Plug and Play), out of the box ready to use application
Scans Logging Option11 point for scan log optionIt logs all scans with date filtering option
Tool Cost USD 30,000 per year to cover WAS and VM Security
OWASP Top 10 Vulnerabilities Coverage22 points for 25% to 50% coverageQualys WAS covered the following categories in one scan: 24% Command Injection, 38% Cross-Site Scripting, 53% Insecure Cookie, 32% SQL Injection. Qualys Was covered 40% of the OWASP Top 10 Vulnerabilities.
Pause and Resume Scans22 points for the ability to pause and resume scansQualys WAS can pause and resume the scan
Number of test cases generated33 points for 500–700 test casesQualys WAS generated 591 test cases in one scan.
Automation level55 points for Less than 30%, needs tester involvementno need for pen-tester interaction
Number of False Positives33 points for Less than 30 %The number of FP vulnerabilities in Qualys WAS is 3, 3/591 × 100 = 0.50% which is less than 30%
Number of True Positives22 points for Up to 25%The TP number is (233) which is less than 10%, 233/591 × 100 = 39.4%
Youden’s Index22 points for Same expected {0}The Youden Index for Qualys WAS is (0.14%) means the tool outputs the same expected result from the web application (FP,TP)
Total score 36
Table A4. Results of benchmarking Fortify WebInspect using our framework in detail.
MetricScoreScore DetailsScore Reason
Tool Type11 point for Only Command line interface (CLI) or only Graphic user interface (GUI)GUI As Expected
Penetration Testing Level11 point for Only Black box test methodIt uses black box method
Crawling types11 point for Only passive crawler or Only Active crawlerIt uses Active crawler
Number of URLs covered33 points 50% to 70% coverageFortify WebInspect crawled 3598 URLS which is 65% of 5500 URLs
Scanning Time55 points for Less than 30 minthe scan was 15 min
Type of Scan33 points for Active and Passive or policy scanIt uses Active and passive scan modes, also scan by policy
Reporting Features11 point for compliance standers reportIt uses standard reports HTML, PDF also reports by needed policy
Added Features11 point for add-ons and extension featuresIt has simulated attack tools for SQL injection, HTTP editor, server analyzer, web proxy, traffic viewer, SWFscan. They are available during the scan, manually and automatically.
Configuration Effortlessness11 point for Difficultrequire dependencies like SQL server for installation
Scans Logging Option11 point for scan log optionIt logs all scans with its results and gives the ability to generate reports for the logs
Tool Cost USD 24,000.00 peer Year
OWASP Top 10 Vulnerabilities Coverage11 point for Less than 25% coverageOnly detect one SSL cipher and the rest of vulnerabilities was best practice. It might be 1% or less in OWASP Top 10 Vulnerabilities Coverage
Pause and Resume Scans22 points for The ability to pause and resume scansFortify WebInspect can pause and resume the scan
Number of test cases generated55 points for More than 1000 test casessent 68,730 attacks in one scan which is more than 1000 test cases
Automation level55 points for Less than 30%, needs tester involvementno need for pen-tester interaction
Number of False Positives00 for NoneThe scan results only covered 1% of SSL cipher; however, the results of benchmarking the rest was 0%. Therefore, no FP vulnerabilities.
Number of True Positives11 point for Less than 10%The scan results only covered 1% of SSL cipher; however, the result of bechnmarking the rest was 0%. Therefore, the TP number is 261 (261/2741 × 100) which is 9.5% less than 10%. The number of expected vulnerabilities from the OWASP benchmark project are 2741.
Youden’s Index00 for NoneThe benchmark did not detect any FP; therefore, no calculation for Youden’s Index
Total score 32
Table A5. Results of benchmarking Arachni using our framework in detail.
MetricScoreScore DetailsScore Reason
Tool Type11 point for Only Command line interface (CLI) or only Graphic user interface (GUI)GUI a newer version recently
Penetration Testing Level11 point for Only Black box test methodIt uses only the blackbox method
Crawling types11 point for Only passive crawler or Only Active crawlerIt uses Active crawler
Number of URLs covered00 for NoneArachni did not crawl
Scanning Time11 point for More than 6 Hoursthe scan was over 48 h
Type of Scan11 point for Only active scan or Only passive scanIt uses only Active scan modes
Reporting Features00 for only HTML or PDF or XML reportsIt uses standard reports HTML, PDF
Added Features00 for none add-ons and extension featuresno features
Configuration Effortlessness11 point for DifficultIt need JAVA JRE, PostgreSQL server for installation
Scans Logging Option11 point for scan log optionIt logs all scans but without the results
Tool Cost Free Tool
OWASP Top 10 Vulnerabilities Coverage00 for NoneArachni did not detect any vulnerability. This issue was in version 0.5.12 in paper [10], and the updated version v1.5.1 did not patch the issue as we considered it.
Pause and Resume Scans22 points for The ability to pause and resume scansArachni can pause and resume the scan
Number of test cases generated11 point for Less than 100 test casesArachni generated nearly 50 test cases in one scan which is less than 100 test cases
Automation level55 points for Less than 30%, needs tester involvementno need for pen-tester interaction
Number of False Positives00 for NoneArachni did not detect any vulnerability; therefore, no FP vulnerabilities
Number of True Positives00 for NoneArachni did not detect any vulnerability; therefore, no FP and the TP vulnerabilities.
Youden’s Index00 for NoneThe benchmark did not detect any FP; therefore, no calculation for Youden’s Index
Total score 15
Table A6. Results of benchmarking Wapiti3 using our framework in detail.
MetricScoreScore DetailsScore Reason
Tool Type11 point for Only Command line interface (CLI) or only Graphic user interface (GUI)CLI As Expected
Penetration Testing Level11 point for Only Black box test methodIt uses only the black box method
Crawling types11 point for Only passive crawler or Only Active crawlerIt uses Active crawler
Number of URLs covered11 point for Less than 25% coveragecrawled 621 URLS which is 11% of 5500 URLs
Scanning Time11 point for More than 6 Hoursthe scan was over 21 h
Type of Scan11 point for Only active scan or Only passive scanIt uses only Active scan modes
Reporting Features00 for only HTML or PDF or XML reportsIt uses standard reports HTML, PDF
Added Features00 for none add-on and extension featuresNone
Configuration Effortlessness11 point for Difficultrequire dependencies such as JAVA JRE, Python 3.x, httpx, BeautifulSoup, yaswfp, tld, Mako, httpx-socks for installation
Scans Logging Option00 for no scan logging optionno logs
Tool Cost Free Tool
OWASP Top 10 Vulnerabilities Coverage22 points for 25% to 50% coveragecovered the following categories in one scan: 9% Command Injection, 9% Cross-Site Scripting, 1% Path Traversal, 3% SQL Injection. Wapiti3 covered 40% of the OWASP Top 10 Vulnerabilities.
Pause and Resume Scans00 for No ability to pause and resume scansWapiti3 cannot pause or resume the scan
Number of test cases generated33 points for 500–700 test casesWapiti3 generated 621 test cases in one scan
Automation level55 points for Less than 30%, needs tester involvementno need for pen-tester interaction
Number of False Positives00 for Noneno FP vulnerabilities seen in benchmark results
Number of True Positives11 point for Less than 10%The TP number is (42) which is less than 10%
Youden’s Index22 points for Same expected {0}The Youden Index for Wapiti3 is 0.03% which means that the tool outputs the same expected result from the web application (FP,TP)
Total score 20

References

  1. Im, J.; Yoon, J.; Jin, M. Interaction Platform for Improving Detection Capability of Dynamic Application Security Testing. In Proceedings of the 14th International Joint Conference on e-Business and Telecommunications, Madrid, Spain, 26–28 July 2017; pp. 474–479. [Google Scholar]
  2. Li, J. Vulnerabilities mapping based on OWASP-SANS: A survey for static application security testing (SAST). Ann. Emerg. Technol. Comput. (AETiC) 2020, 4, 1–8. [Google Scholar] [CrossRef]
  3. OWASP Top 10:2021. 2021. Available online: https://owasp.org/Top10/ (accessed on 14 November 2021).
  4. Pan, Y. Interactive application security testing. In Proceedings of the 2019 International Conference on Smart Grid and Electrical Automation (ICSGEA), Xiangtan, China, 10–11 August 2019; pp. 558–561. [Google Scholar]
  5. Meyers, B.S.; Almassari, S.F.; Keller, B.N.; Meneely, A. Examining Penetration Tester Behavior in the Collegiate Penetration Testing Competition. ACM Trans. Softw. Eng. Methodol. 2022, 31, 1–25. [Google Scholar] [CrossRef]
  6. Scanlon, T.P. Fundamentals of Application Security Testing Tools; Carnegie Mellon University: Pittsburgh, PA, USA, 2021. [Google Scholar]
  7. Antunes, N.; Vieira, M. Assessing and Comparing Vulnerability Detection Tools for Web Services: Benchmarking Approach and Examples. IEEE Trans. Serv. Comput. 2015, 8, 269–283. [Google Scholar] [CrossRef]
  8. Mburano, B.; Si, W. Evaluation of web vulnerability scanners based on owasp benchmark. In Proceedings of the 2018 26th International Conference on Systems Engineering (ICSEng), Sydney, NSW, Australia, 18–20 December 2018; pp. 1–6. [Google Scholar]
  9. Vats, P.; Mandot, M.; Gosain, A. A Comprehensive Literature Review of Penetration Testing & Its Applications. In Proceedings of the 2020 8th International Conference on Reliability, Infocom Technologies and Optimization (Trends and Future Directions) (ICRITO), Noida, India, 4–5 June 2020; pp. 674–680. [Google Scholar]
  10. Shebli, H.M.Z.A.; Beheshti, B.D. A study on penetration testing process and tools. In Proceedings of the 2018 IEEE Long Island Systems, Applications and Technology Conference (LISAT), Farmingdale, NY, USA, 4 May 2018. [Google Scholar]
  11. Yadav, D.; Gupta, D.; Singh, D.; Kumar, D.; Sharma, U. Vulnerabilities and Security of Web Applications. In Proceedings of the 2018 4th International Conference on Computing Communication and Automation (ICCCA), Greater Noida, India, 14–15 December 2018. [Google Scholar] [CrossRef]
  12. Zuehlke, A.K. An Analysis of Tools, Techniques, and Mathematics Involved in a Penetration Test. Doctoral Dissertation, Appalachian State University, Boone, NC, USA, 2017. [Google Scholar]
  13. Amankwah, R.; Chen, J.; Kudjo, P.K.; Towey, D. An empirical comparison of commercial and open-source web vulnerability scanners. Softw. Pract. Exp. 2020, 50, 1842–1857. [Google Scholar] [CrossRef]
  14. Saeed, F.A.; Elgabar, E.A. Assessment of open source web application security scanners. J. Theor. Appl. Inf. Technol. 2014, 61, 281–287. [Google Scholar]
  15. Shah, M.P. Comparative Analysis of the Automated Penetration Testing Tools. Master’s Thesis, National College of Ireland, Dublin, Ireland, 2020. [Google Scholar]
  16. Syaikhuddin, M.M.; Anam, C.; Rinaldi, A.R.; Conoras, M.E.B. Conventional Software Testing Using White Box Method. In Kinetik: Game Technology, Information System, Computer Network, Computing, Electronics, and Control; Universitas Muhammadiyah Malang: Kota Malang, Indonesia, 2018; pp. 65–72. [Google Scholar]
  17. Seng, L.K.; Ithnin, N.; Said, S.Z.M. The approaches to quantify web application security scanners quality: A review. Int. J. Adv. Comput. Res. 2018, 8, 285–312. [Google Scholar] [CrossRef]
  18. Bacudio, A.G.; Yuan, X.; Bill Chu, B.T.; Jones, M. An Overview of Penetration Testing. Int. J. Netw. Secur. Appl. 2011, 3, 19–38. [Google Scholar] [CrossRef]
  19. Goutam, A.; Tiwari, V. Vulnerability Assessment and Penetration Testing to Enhance the Security of Web Application. In Proceedings of the 2019 4th International Conference on Information Systems and Computer Networks (ISCON), Mathura, India, 21–22 November 2019. [Google Scholar] [CrossRef]
  20. Alazmi, S.; De Leon, D.C. A Systematic Literature Review on the Characteristics and Effectiveness of Web Application Vulnerability Scanners. IEEE Access 2022, 10, 33200–33219. [Google Scholar] [CrossRef]
  21. Qiu, X.; Wang, S.; Jia, Q.; Xia, C.; Xia, Q. An automated method of penetration testing. In Proceedings of the 2014 IEEE Computers, Communications and IT Applications Conference, Beijing, China, 20–22 October 2014. [Google Scholar] [CrossRef]
  22. Shanley, A.; Johnstone, M. Selection of penetration testing methodologies: A comparison and evaluation. In Proceedings of the 13th Australian Information Security Management Conference, Perth, Australia, 30 November–2 December 2015. [Google Scholar] [CrossRef]
  23. Dalalana Bertoglio, D.; Zorzo, A.F. Overview and open issues on penetration test. J. Braz. Comput. Soc. 2017, 23, 2. [Google Scholar] [CrossRef]
  24. Kritikos, K.; Magoutis, K.; Papoutsakis, M.; Ioannidis, S. A survey on vulnerability assessment tools and databases for cloud-based web applications. Array 2019, 3–4, 100011. [Google Scholar] [CrossRef]
  25. Mirjalili, M.; Nowroozi, A.; Alidoosti, M. A survey on web penetration test. Adv. Comput. Sci. Int. J. 2014, 3, 107–121. [Google Scholar]
Figure 1. Updated OWASP Top 10 Vulnerabilities [3].
Electronics 11 02991 g001
Figure 2. Research Methodology.
Electronics 11 02991 g002
Figure 3. Implementation Process.
Electronics 11 02991 g003
Figure 4. Top commercial and non-commercial pen-testing tools scores.
Electronics 11 02991 g004
Figure 5. Comparison by metric score for commercial tools.
Electronics 11 02991 g005
Figure 6. Comparison by metric score for non-commercial tools.
Electronics 11 02991 g006
Figure 7. Evaluation performance of top 6 pen-testing tools.
Electronics 11 02991 g007
Table 1. Coverage percentage for non-commercial tools.
Tool NameTool TypeLicenseVersionLast UpdatePrice
OWASP ZAPProxyApache license Version 2.0Version: 2.11.0October 2021Free
BurpSuite ProfessionalProxyCommercialVersion: 2021.9.1October 2021USD 399 per year
Qualys WASScannerCommercialVersion: 8.12.55-1self-updatingUSD 30,000 per year
ArachniScannerArachni Public Source License Version 1.0Version: 1.5.1November 2017Free
Wapiti3ScannerGNU General Public License version 2Version: 3.0.5May 2021Free
Fortify WebInspectScannerCommercialVersion: 21.2.0December 2021USD 24,000 peer year
Table 2. Framework summary for Evaluation Criteria and Scoring System.
CriteriaMetricScore Range
Test coverageTest Coverage1–5
pen-testing Level1–3
Number of URLs covered1–5
Attack coverageNumber of test case generated1–5
EfficiencyScanning Time1–5
Vulnerability detectionOWASP Top 10 Vulnerabilities Coverage1–5
Number of False Positive1–3
Number of True Positive1–4
Youden Index1–3
Automation level1–5
Other NewCrawling types1–2
Added features0–1
Reporting Features0–1
configuration Effortlessness1–3
Scans Logging Option0–1
Tool CostNA
Tool TypeNA
Scan Type1–3
Pause and Resume Scans0–2
Table 3. Evaluated tools profile.
Tool NameTool-Hosed EnvironmentAttack Route
OWASP ZAPMacBook Pro 2.3 GHz 8-Core Intel Core i9 RAM 64 GB 2667 MHz DDR4External
Burp Suite ProfessionalMacBook Pro 2.3 GHz 8-Core Intel Core i9 AM 64 GB 2667 MHz DDR4External
Qualys WASCloud BasedExternal
ArachniMacBook Pro 2.3 GHz 8-Core Intel Core i9 RAM 64 GB 2667 MHz DDR4External
Wapiti3Kali Linux hosted in Parallels MacBook Pro 2.3 GHz 8-Core Intel Core i9 RAM 64 GB 2667 MHz DDR4External
Fortify WebInspectWindows 10 Pro hosted in Parallels MacBook Pro 2.3 GHz 8-Core Inte RAM 64 GB 2667 MHz DDR4External
Table 4. Coverage percentage for commercial tools.
Burp Suite ProfessionalQualys WASFortify WebInspect
70%40%1%
Table 5. Coverage percentage for non-commercial tools.
Wapiti3OWASP ZAPArachni
40%1%0%
Publisher’s Note: MDPI stays neutral with regard to jurisdictional claims in published maps and institutional affiliations.

