1. Introduction
Fraud detection is a set of activities to prevent acquiring money or property through false claims. It is pragmatically applied in various online and offline services, such as internet services of banking or cryptocurrencies. Due to the development of artificial intelligence and data mining techniques, the need to share the most diverse data has increased; meanwhile, fraudulent activities have also emerged extremely in internet services. Unfortunately, the generation of this data belongs to several different security areas, so there is difficulty in sharing it, especially when there is information related to privacy and security. The inclusion of automation in the blockchain has led to the rapid adoption of technology in different sectors involving online finance, the internet of things, supply chain management, healthcare, insurance, etc. [
1]. Blockchain is a shared and immutable ledger that facilitates the process of recording transactions between receiving and sending parties, and tracking assets in the business network [
2,
3]. Meanwhile, Ethereum is a decentralized blockchain platform that creates a peer-to-peer network that securely implements and verifies application code, named smart contract accounts. Smart contracts allow participants to transact with each other without a trusted central authority. The blockchain is a globally shared transaction database [
4,
5,
6]. A block includes many transactions, and a transaction in Ethereum is a message sent from one account address to another, which carries the import information, for example, a function parameter, a contract bytecode, etc. Ethereum has two categories of accounts typically involved in the transactions on the platform: externally owned accounts and smart contract accounts. The substantial variance is that the smart contract account includes executable code, while the externally owned account does not [
7].
Ethereum, the most popular platform for smart contract accounts, has a market capitalization of over USD
$21 billion [
8,
9]. When smart contract accounts are written in a high-level language such as Solidity, they must be compiled into bytecode, and then uploaded to Ethereum to be executed and validated by each Ethereum node. As a popular and open-source blockchain platform, Ethereum publishes many smart contract accounts to implement different businesses. At the same time, the technical characteristics come from a combination of many advanced technologies based on data-driven approaches, which increases the complexity of the blockchain and leads to increased technical limitations between smart contract accounts and investors. High technical limitations prevent investors from familiarizing themselves with the specific trading logic of smart contract accounts that run on the Ethereum network. These obstacles allow fraudsters to introduce abnormal contract accounts into the blockchain investment ecosystem.
The abnormal contract accounts such as High Yield Investment Programs (HYIP) or Ponzi schemes are a deceptive investment masquerading as a hopeful high rate of return for investors. Abnormal contracts are smart contract accounts with special characteristics. Due to their fraudulent nature, abnormal contracts differ from other contracts in several ways: (i) in most cases, abnormal contracts send Ether to their investors; (ii) it is possible for some accounts to receive more payments than their investment counts, such as the creator who frequently charges fees through contracts; and (iii) to maintain the image of fast and high returns, abnormal contracts might pay back investors once they have sufficient balances, resulting in a low balance [
10]. On the other hand, a normal contract account on blockchain refers to a smart contract, which is a type of Ethereum account. Therefore, they can send transactions via the network since they have a balance. Although they are not controlled by users, they are deployed to the network and run according to their programming. Users can then submit transactions that execute the functions defined in a smart contract. The smart contract account can be used to define rules that are automatically enforced by the code, just like a regular contract. By default, smart contract accounts cannot be deleted, and interactions with them cannot be undone. The abnormal contract accounts create returns to early investors by getting new investors. They present automated peer-to-peer transactions while taking advantage of the decentralization benefits provided by blockchain technology. As stated by [
10], from August 2015 to May 2017, 191 abnormal contract accounts alive on Ethereum raised almost
$500,000 from over 2000 different users. Recently, online financing systems such as crowdfunding and peer-to-peer networking have become very popular. At the same time, abnormal contract accounts appeared in between, causing a very bad social impact [
11]. Scientists note that abnormal contracts embedded in the blockchain are pervasive.
Data-driven security (DDS) effectively balances such impacts by an activity compelled with data derived from any security application instead of theoretical or personal experience. DDS is an evolving interdisciplinary area that concentrates on research and development by applying machine learning, data mining, data science, and deep learning approaches to tackle the high-security issues in the HYIP. In order to achieve success in this balance, there is a need to use effective security measures through DDS to minimize losses and prevent crimes for blockchain and cryptocurrency investors. However, there are quite a few studies on detecting abnormal contracts through DDS in Ethereum.
Existing abnormal contract detection techniques on the blockchain mostly include manual analysis or machine learning [
10,
12,
13]. Manual analysis techniques employ etherscan.io, an analytics platform for observing transactions and wallet addresses on the Ethereum blockchain, to retrieve contracts that have been verified with the source code and manually inspect the contract source code to confirm the type of smart contract account. However, these detection techniques are challenging to analyze the many new contracts being created daily on the blockchain system for DDS. Thus, it is impractical to detect smart contract accounts only through manual analysis. Recent detection methods [
14,
15,
16,
17] depend on opcodes or account data of contract accounts using machine learning methods to detect abnormal contract accounts automatically.
However, previous machine learning methods for identifying abnormal contract accounts suffer from the following problems: first, it is difficult to obtain features that can effectively detect abnormal schemes, and statistical work around the features is also unhelpful. Extracting effective features is an important task in a machine learning-based fraud detection solution. Some new features may be limited due to the technical enhancement of blockchain technologies. Overall, feature extraction is a difficult process and researchers continue to monitor any potential feature, which can improve the fraud detection performance of malicious contracts by conducting experiments on the standard dataset. Second, although some work has been done using machine learning methods to detect fraud in smart contract accounts, the accuracy is inadequate for data-driven analysis. For instance, the random forest method achieves a 95% precision rate and 69% recall rate [
15] which is due to the smaller number of instances of abnormal contracts compared to normal contracts. It is obvious that abnormal contract accounts can be detected more accurately. A number of applications, including critical power system applications, have utilized ensemble learners to enhance performance. By compensating for the weaknesses of individual classifiers with the strengths of others, ensemble learning provides a superior performance [
17]. Using Gradient Boost algorithms and Extra-Tree algorithms, we developed an ensemble classification model to detect abnormal contract accounts more accurately. Third, the problem of severe data imbalance may affect the performance of machine learning classification algorithms on large datasets. As indicated by research [
18], 96% of Ethereum smart contract accounts are duplicates. As stated by a report on etherscan.io, the total number of normal accounts and transactions on Ethereum is over 500 million and 3.8 billion, respectively. In contrast, the total number of phishing accounts deployed on etherscan.io is only 2041 and searching for abnormal smart contracts is like searching for a needle in a haystack [
19]. This issue will lead to overfitting and weak generalization of the detection model.
Therefore, this paper presents a data-driven robust solution to detect fraud-based abnormal contract accounts over the Ethereum blockchain, which extracts three-fold features from contract opcodes, transaction history, and contract source code. In particular, we propose a hybrid feature set including n-gram opcodes features of contract account without expert participation, different transaction features from contract account transaction data, and TF-IDF character level features from contract account source code. These features are integrated and fed to train the proposed method through an ensemble of Extra-Trees and Gradient Boosting Machine classifiers based on weighted soft voting to enhance the fraud detection efficiency for abnormal contract accounts. Extensive experiments show that the proposed detection method has competitively performed on real Ethereum blockchain datasets in various evaluation metrics. Accordingly, this paper presents the following main contributions.
This paper proposes a robust fraud detection method with a supervised learning-based data-driven solution, which can automatically and accurately identify abnormal contracts using a hybrid feature set of a contract account.
In terms of feature extraction, we combine various transaction features with opcode n-grams and source code characters features extracted by the TF-IDF model to get more comprehensive features and then compare various machine learning techniques using these features set to measure efficiency.
We released a public dataset of addresses, codes, and their transaction history for Ethereum contract accounts, which can hopefully be used to further research and applications on this topic.
We designed an ensemble classification model combining Extra-Trees and Gradient Boost algorithms to enhance the detection accuracy of abnormal contract accounts.
The rest of this paper is structured as follows.
Section 2 presents a brief review of related work on the detection of abnormal contracts. A detailed explanation of the data collecting and prepossessing, extracted features, and classification model is provided in
Section 3. Empirical results and analysis are summarized in
Section 4. Finally, we conclude the paper in
Section 5.
2. Literature Review
This section reviews some of the current relevant work related to the detection of abnormal contract accounts. Recently, many scams have appeared frequently on finial online models [
20,
21] and have caused huge losses to investors. Thus, the detection of abnormal contract accounts aroused the interest of researchers.
Bian et al. proposed a machine-learning-based Initial Coin Offerings (ICOs) rating system called ICORATING. They analyzed 2251 smart contract accounts for ICO and relative information such as white papers, founding team, GitHub repository, website, etc., to correlate the life span and the price change of a digital currency with various levels [
22]. Our method employs the Ethereum network information and considers all abnormal contracts, thus not only deceptive ICOs. Vasek and Moore anatomized 1780 bitcoin-based Ponzi schemes from
http://bitcointalks.org (accessed on 1 July 2022) and denoted that the social interaction between scammers and victims influences the lifespan of frauds [
13]. Bartoletti et al. [
10] provided a comprehensive review of Ponzi contracts on Ethereum. They analyzed the behavior of the Ponzi schemes for smart contract accounts using similarities between the contract account bytecodes to classify 184 of them. However, these methods cannot handle the large number of new contracts being constructed every day. Nerurkar et al. [
23] proposed a supervised learning model to detect illegal activities in bitcoin. Nine features were designed to train the proposed model, and 1216 bitcoin users are categorized into 16 classes.
To detect abnormal activity on the Ethereum blockchain, Farrugia et al. classified accounts based on their transaction data using the XGBoost algorithm. A total of 42 account features were obtained using the collected transactions. The time differences between the first and last transaction, the total Ether balance, and the minimum Ether value received by an account was identified as the most significant three features [
24]. Depending on the two dominant account types—externally owned accounts (EOA) and smart contract accounts—Kumar et al. [
25] identified malignant nodes using supervised machine learning-based fraud detection in the account’s transactions data. Wuet et al. [
18] developed a network embedding algorithm named trans2vec to obtain the features of Ethereum accounts and built a one-class SVM to classify the malicious nodes. Chen et al. [
26] proposed a deep learning-based solution called MTCformer for detecting Ponzi schemes. The MTCformer first employs Structure-Based Traversal (SBT) method to create the token sequence to hold the structural information and then uses a TextCNN and a multichannel transformer to automatically obtain the structural and semantic features from the source-code and to find out the long-term dependencies between the tokens. Wang et al. [
27] presented a Ponzi schemes detection approach based on oversampling-based Long Short-Term Memory (LSTM). The proposed approach integrates the features of transaction data with opcodes features of smart contract accounts to detect Ponzi schemes on Ethereum blockchain. In the work of Chen et al. [
28], a semantic-aware detection model has been proposed to detect Ponzi contracts in the Ethereum. They provided a guiding symbolic implementation approach to first creating semantic information for each potential pathway in smart contracts and then defining investor-related conversion behaviors and approved distribution strategies through strict adherence to the definition of Ponzi schemes. Liang et al. [
29] proposed a data driven security system for detecting a Ponzi scheme. The system employs a dynamic graph embedding technique to automatically recognize the representation of an account based on the account’s opcode and transaction data.
In a bid to moderate illicit activity through the Ethereum blockchain via detecting Ponzi schemes deployed as contract accounts. Fan et al. [
30] classified contracts based on their operation codes (opcodes). They proposed an anti-leakage smart Ponzi schemes detection (Al-SPSD) method based on the idea of ordered boosting. The method of [
16] applied data-mining techniques to identify bitcoin addresses relative to Ponzi scheme contracts. Their method was able to classify 31 out of 32 Ponzi schemes with a 1% false positive. Rahouti et al. [
31] reviewed data-mining-based techniques for detecting anomalies in bitcoin, including [
16]. However, it inspired the approach of [
15], which describes a similar method using transaction features but also added opcode features based on contract bytecode stored on the blockchain. They created three classification models, account, opcode, and account + opcode, using a random forest classifier, and the best outcomes come from opcode model, with an f1-score at 73% and recall at 82%. Jung et al. [
32] extracted more transaction features based on the [
15] method, but the data set simplification is probably causing the method to overfitting. We have taken four different steps in building our detection method. First, we extended the abnormal contracts dataset that has been verified by etherescan.io [
10]. Second, we extracted new opcodes and transaction features that are more effective in detecting abnormal contracts; furthermore, the method and strategy of the observational with respect to the interpretation of these features [
15] are implemented differently in our method. Third, we added source code features, which we call TF-IDF source code features. Fourth, we used a different classification model and achieved better performance.
Table 1 shows a detailed comparison of the abnormal contract detection methods.
The features extracted in some existing works are based on manual analysis and need extra labor because these features require resetting according to the dataset, which may affect the generalization of abnormal contract detection methods. We proposed three new feature sets to improve the accuracy of detecting abnormal contract accounts. We got the impetus from the above works and proposed our method in which the current work extracts n-gram features from opcodes without expert intervention, various transaction features from transaction data, and TF-IDF characters level features from contract account source code. Moreover, our method integrates and trains these features through a combination of bagging and boosting tree algorithms to detect new abnormal contract accounts. The further details of these feature sets and the proposed detection methods are comprehensively presented in
Section 3.
3. Proposed Methodology
In this section, the proposed work for detecting abnormal contracts in the Ethereum network is presented, including workflow, data acquisition and preprocessing of extracted features, and classification model.
Figure 1 illustrates the general workflow of our method in four phases.
The proposed method consists of four primary modules to create an efficient method for detecting abnormal contracts on Ethereum, which are explained below.
Data Preparation: The bytecodes, transactions, and source code of all the contract accounts in our data are obtained from etherescan.io. Then, the duplicate smart contracts bytecodes are removed and decoded into opcodes, and their transactions are preprocessed and saved into one table.
Feature Transformation: Three types of features such as n-grams, behavior, and TF-IDF characters are extracted from the opcodes, transaction data, and source code of smart contract accounts.
Ensemble Learning Model: The ensemble classifier combines extra-trees classifier (ETC) and gradient boosting machine (GBM) to train the extracted features. To synthesize more abnormal account contracts, the adaptive synthetic sampling (ADASYN) approach is used to sample density in the abnormal contracts to match the number of normal contracts.
Abnormal Contracts Detection: The process to differentiate whether the unknown contract accounts are abnormal or not.
3.1. Data Preparation
A training dataset is required for both normal and abnormal contract accounts in Ethereum. Obtaining data is often the most difficult for fraud detection projects, which require manual analysis and careful research to classify abnormal from normal contracts. To this end, we used a web crawler to obtain unique bytecodes for 1904 contracts verified by etherscan.io, engaged in at least ten transactions, which were labeled as abnormal contracts (308) and normal contracts (1596). The abnormal addresses are obtained from [
33], while the normal ones are obtained from [
34].
We converted these bytecodes into opcodes using a disassembler called the pyevmasm library (
https://github.com/crytic/pyevmasm, accessed on 1 July 2022), and removed the operands after some opcodes, for example, PUSH5 and its operands (such as 0x174876e800). We have also crawled the source codes of addresses collected using Etherscan API [
35]. Moreover, we obtained all the corresponding transactions that reacted with these contract accounts using the Etherscan API [
36]. The transactions include an ‘isError’ field, which indicates whether the transaction is successful or not. We use all the successful and unsuccessful transactions in our method. We used the DBMS (i.e., pgAdmin) with Python to import and setup the dataset. Our data consists of three files: the first file contains the bytecode of normal and abnormal smart contract accounts, while the second file contains the transaction records for these contracts. This file is extremely large, including 3,575,183 transaction records, making it necessary to include a varying number of transactions for each contract. Finally, the source code for these contract accounts is included in a last file as well. The data set was randomly divided into 80:20 ratios for training and testing, respectively. Our dataset of contract accounts and all the transaction data are available at this link:
https://github.com/abdul-rasool/Abnormal-Contracts-Detection (accessed on 1 July 2022).
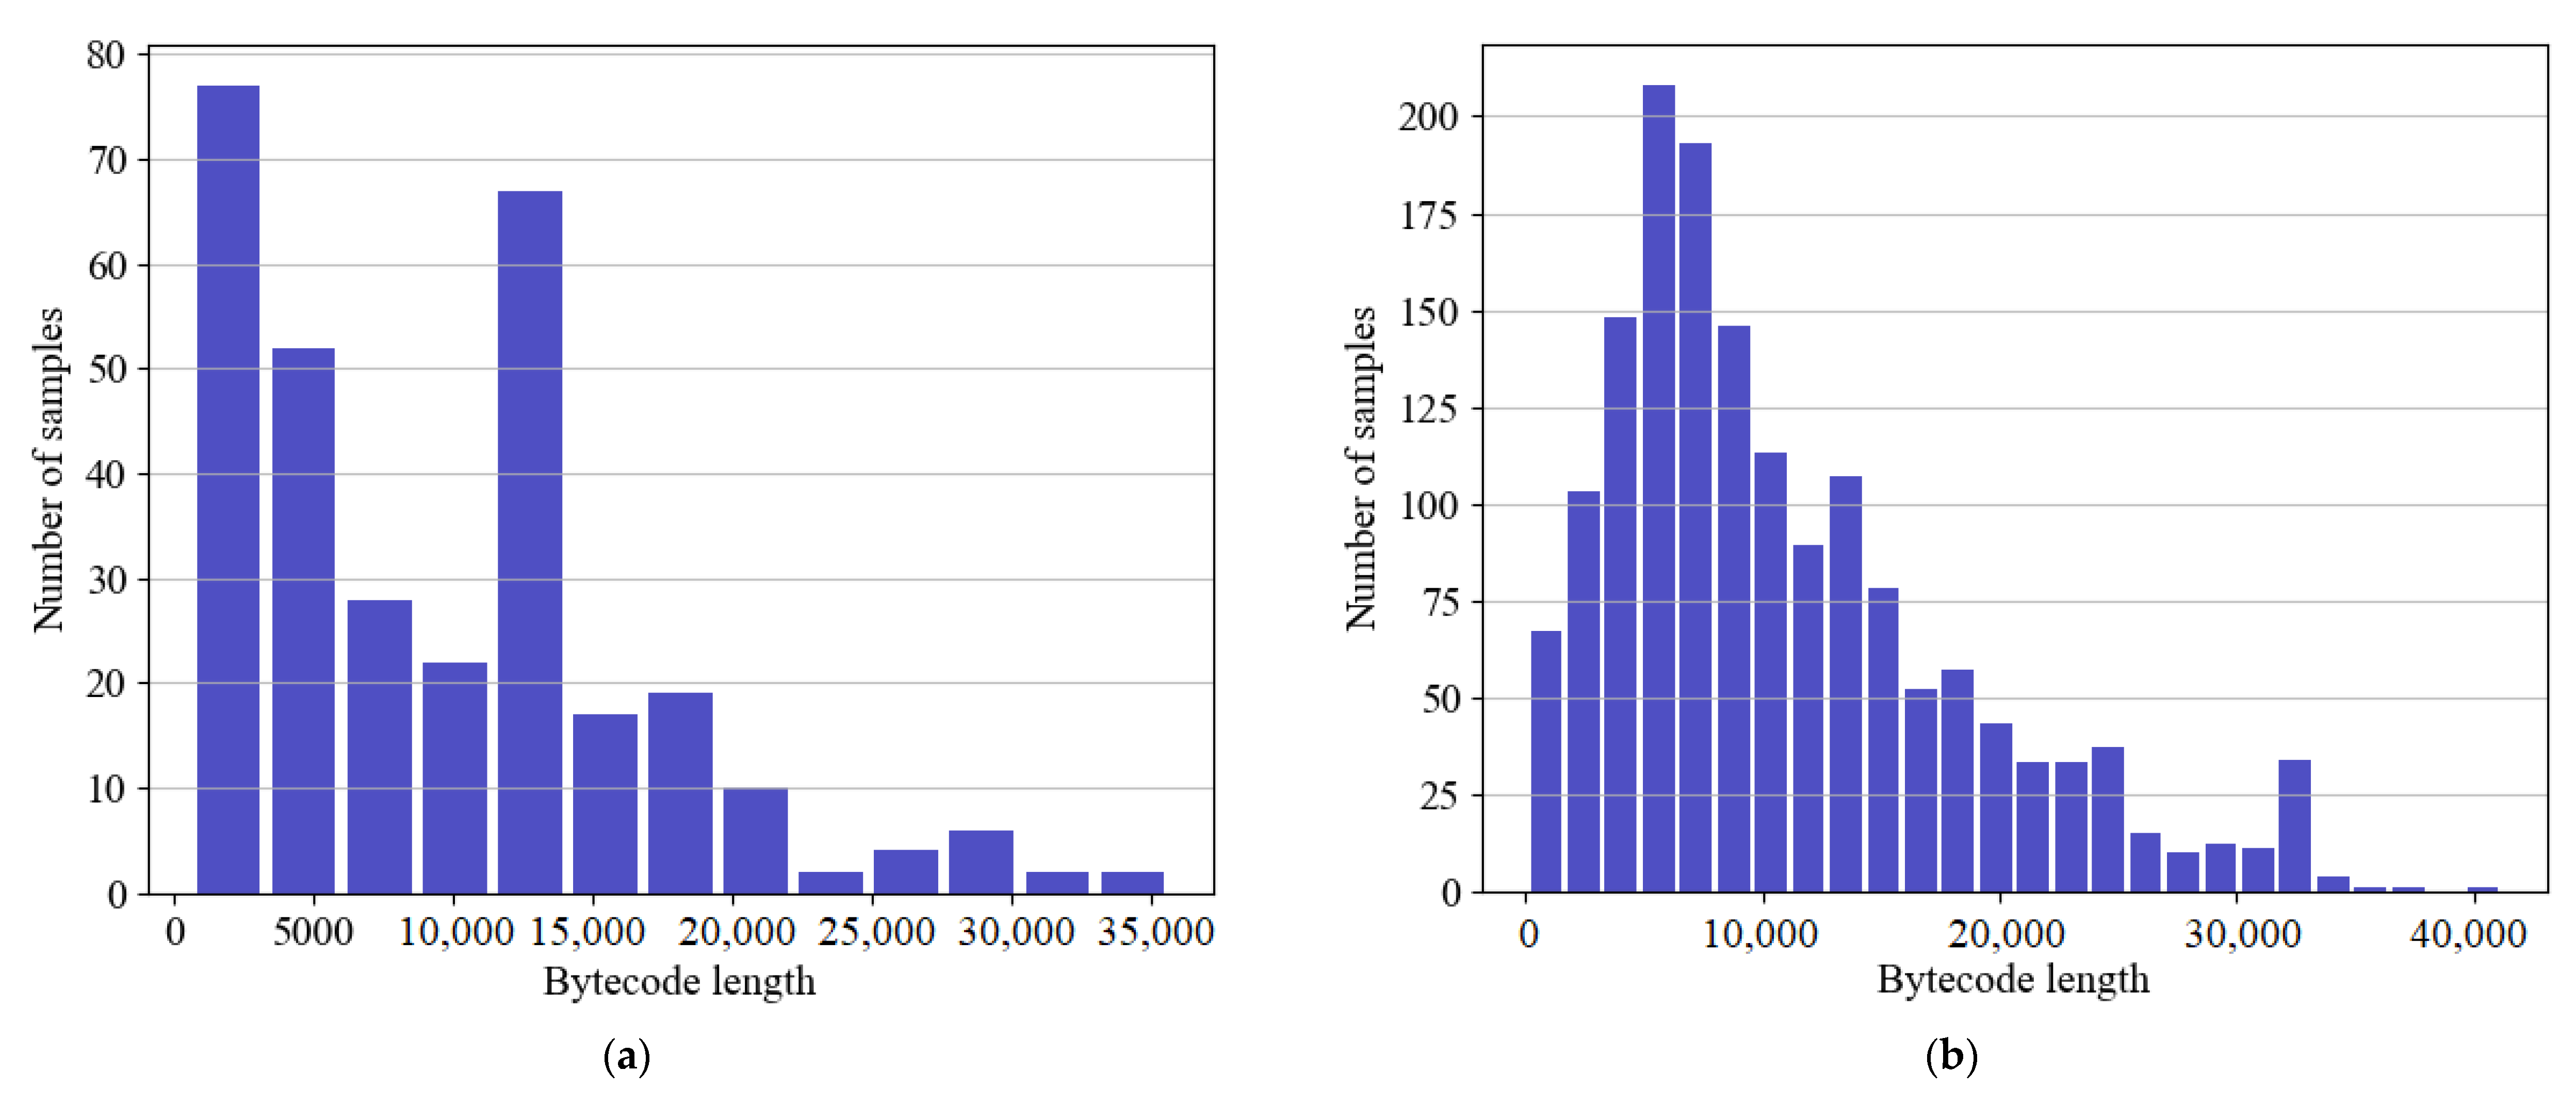
Figure 2 shows bytecode length distributions in our dataset for both abnormal and normal contract accounts. As shown in the figure, most normal contracts have a length of between 5000 and 8000 bytes, while most abnormal contracts contain lower than 5000 bytes. The highest length of the normal contract accounts is 45,000, and the highest length of abnormal contract accounts is 35,000.
Data Resampling Procedure
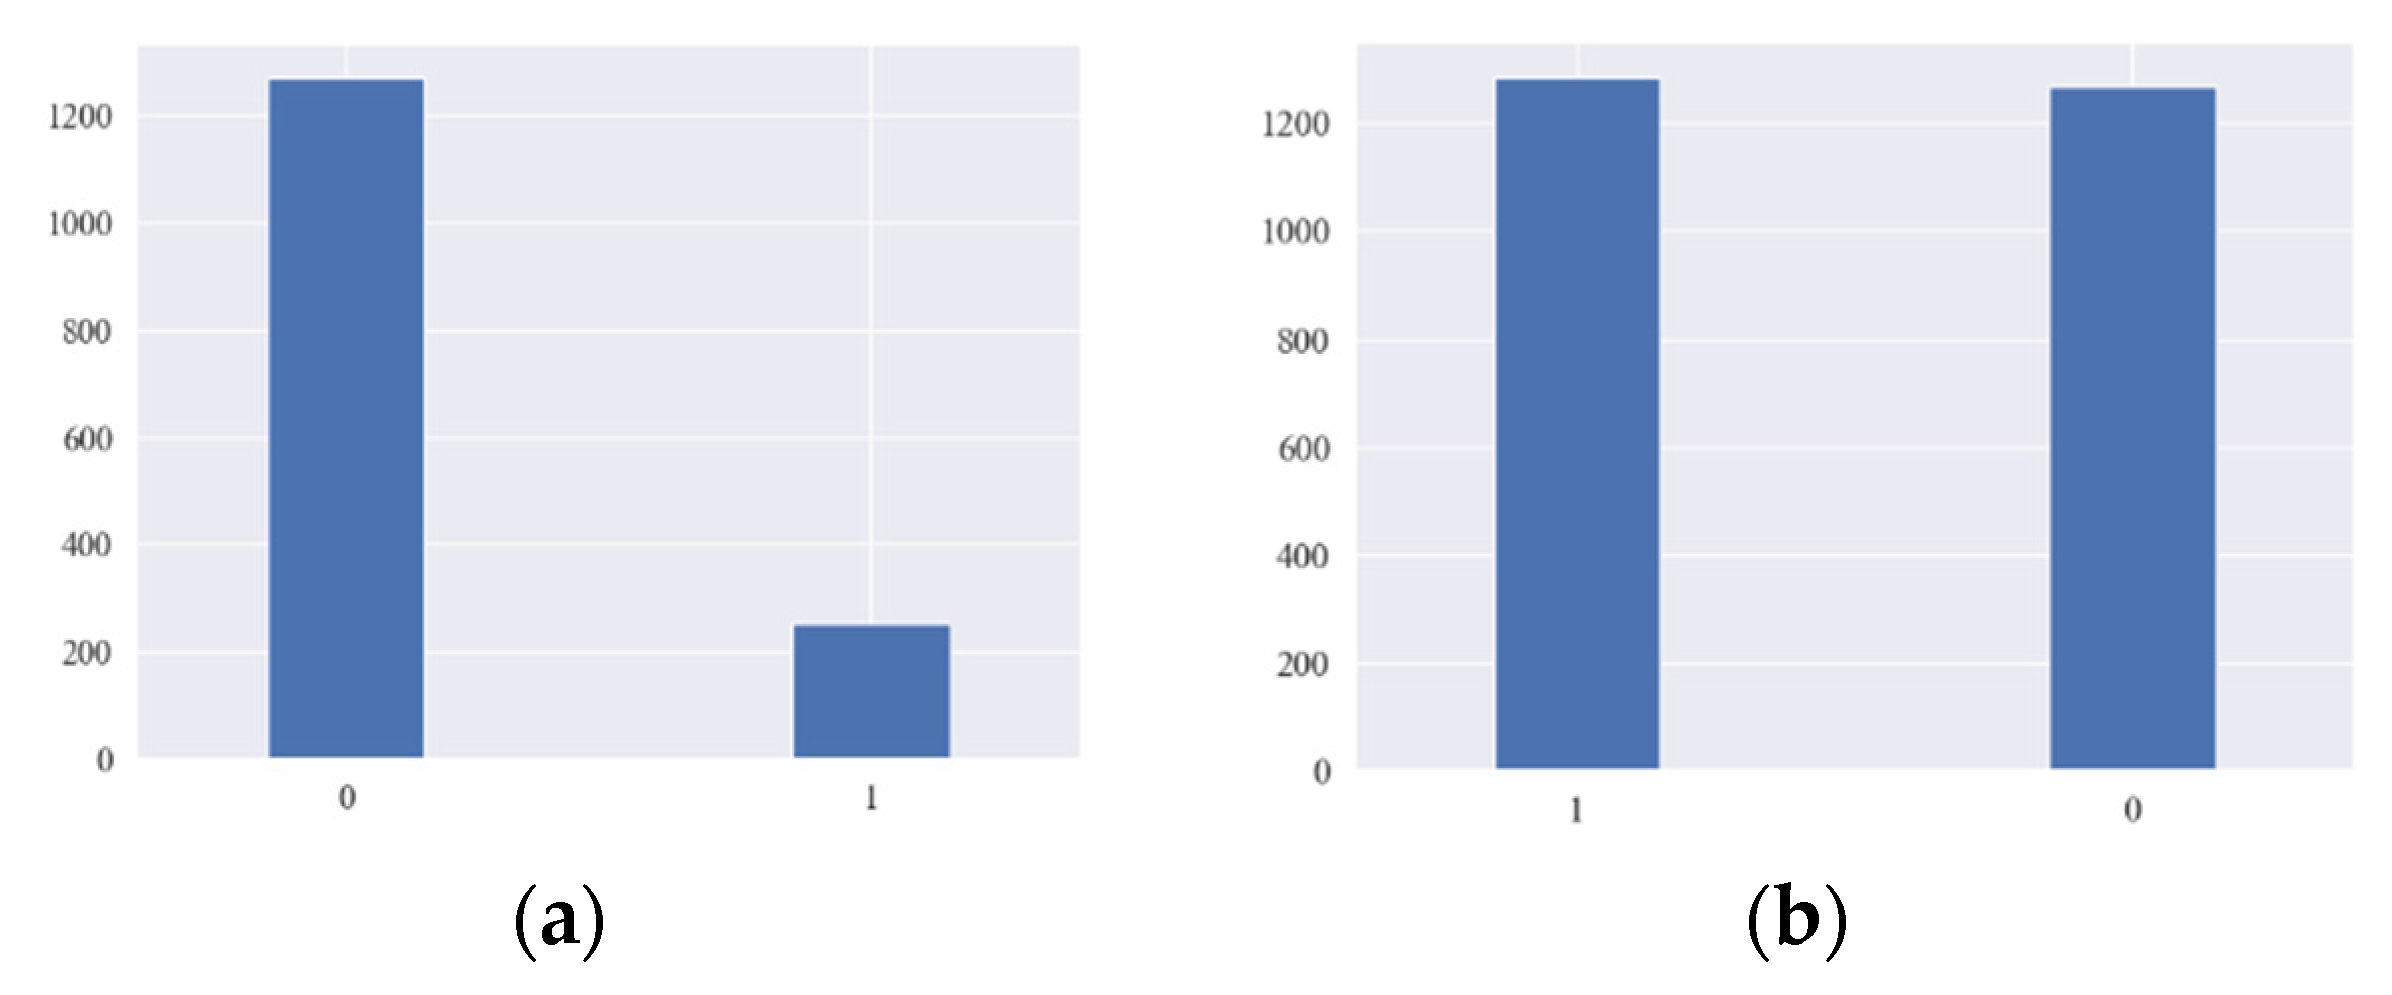
The defiance of working with imbalanced-class datasets is that most machine learning techniques will ignore and therefore perform incompletely in the rare class, although their performance in the rare class is the most important. One method to deal with imbalanced-class datasets is to oversample the rare class. The simplest method involves iterating tuples into the classes of interest class until there are an equal number of positive and negative tuples. Alternatively, new tuples can be made from existing tuples. In our training data, the ratio of abnormal contract accounts to normal contracts is 1:5. We employ Adaptive Synthetic Sampling (ADASYN) algorithm to generate more abnormal contract accounts to match the number of normal contract accounts to improve efficiency. The ADASYN algorithm uses the density distribution as a criterion to indicate the number of synthetic tuples that must be automatically created for each rare data tuple [
37]. The purpose of adaptive synthetic sampling is to generate fewer synthetic examples in regions of the feature space where minority examples are low, and more or none in regions where minority examples are dense. In ADASYN, data samples of minority classes are adaptively generated according to their distributions, with a greater amount of synthetic data being produced for minority class samples that are difficult to learn than those minority samples that are easier to learn. In this way, biased training will be prevented against a particular group in the data set.
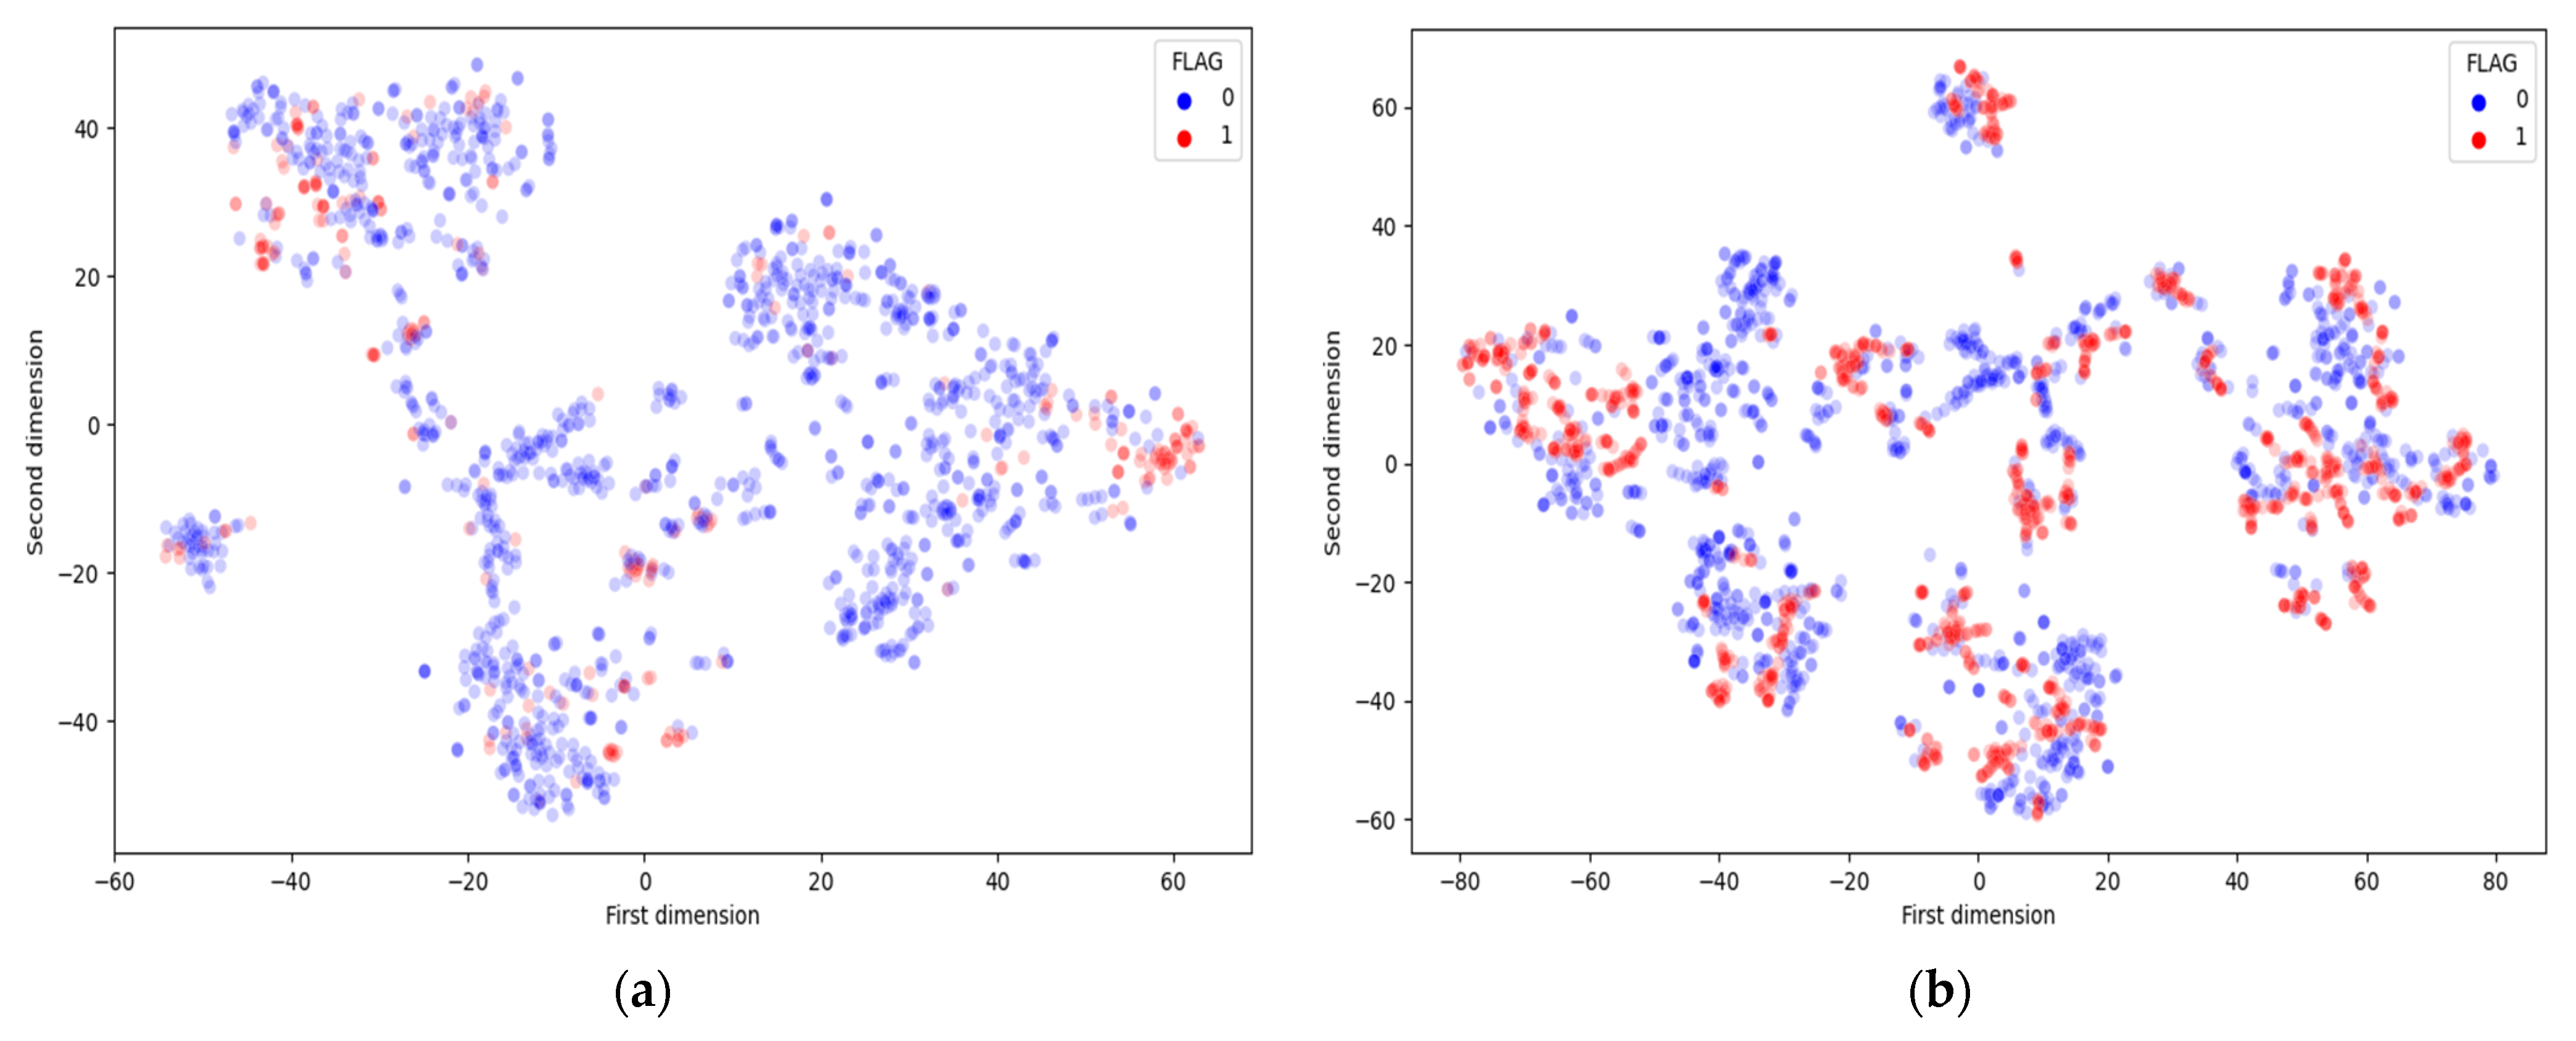
Figure 3 shows the distribution of normal and abnormal contracts before and after balancing our data. As part of the training stage, we used only ADASYN to analyze the training data, but the test data was not equally distributed or visible. The t-Distributed Stochastic Neighbor Embedding (t-SNE) is a nonlinear dimensionality reducing approach in which interrelated high dimensional data is mapped into low-dimensional data while preserving the significant structure of original high dimensional data [
38].
Figure 4 illustrates the t-SNE transformation implemented to the original feature space concerning the smart contract class label (normal or abnormal).
3.2. Feature Extraction and Transformation
In Python, a custom code has been implemented that takes the account contract as an input and obtains information based on opcodes, transaction history, and source code for that account. To determine if a particular contract account is an abnormal contract or not, these extracted features are fed into a machine learning model. The extracted contract account-based features are categorized into three sets:
Opcode n-grams;
Transaction data;
Source code characters.
3.2.1. Opcode N-Gram Features
The Ethereum contract account is composed of a chain of hexadecimal representations of contracts on the Ethereum blockchain. By converting the bytecodes to opcodes, which are similar to natural language, the opcodes become readable to humans. As shown in
Table 2, the opcodes comprise instructions mnemonics (i.e., ADD, SSTORE JUMP, LT, MOD, etc.) as well as their operands.
The use of operation codes has been successfully applied to various fundamental issues of contract accounts in previous studies [
18,
39]. Therefore, we extract the n-gram features from the opcode sequences of the contract accounts to detect abnormal schemes. The n-grams are used frequently in the field of natural language processing (NLP). However, it is also very common in malware detection tasks. In this section, opcodes for contract accounts are analyzed using n-grams without relying on any other interventions from experts to characterize them. N-grams are set between 2 and 3 bytes in length, making them language independent. However, they can be large for large documents, resulting in great computational complexity [
40].
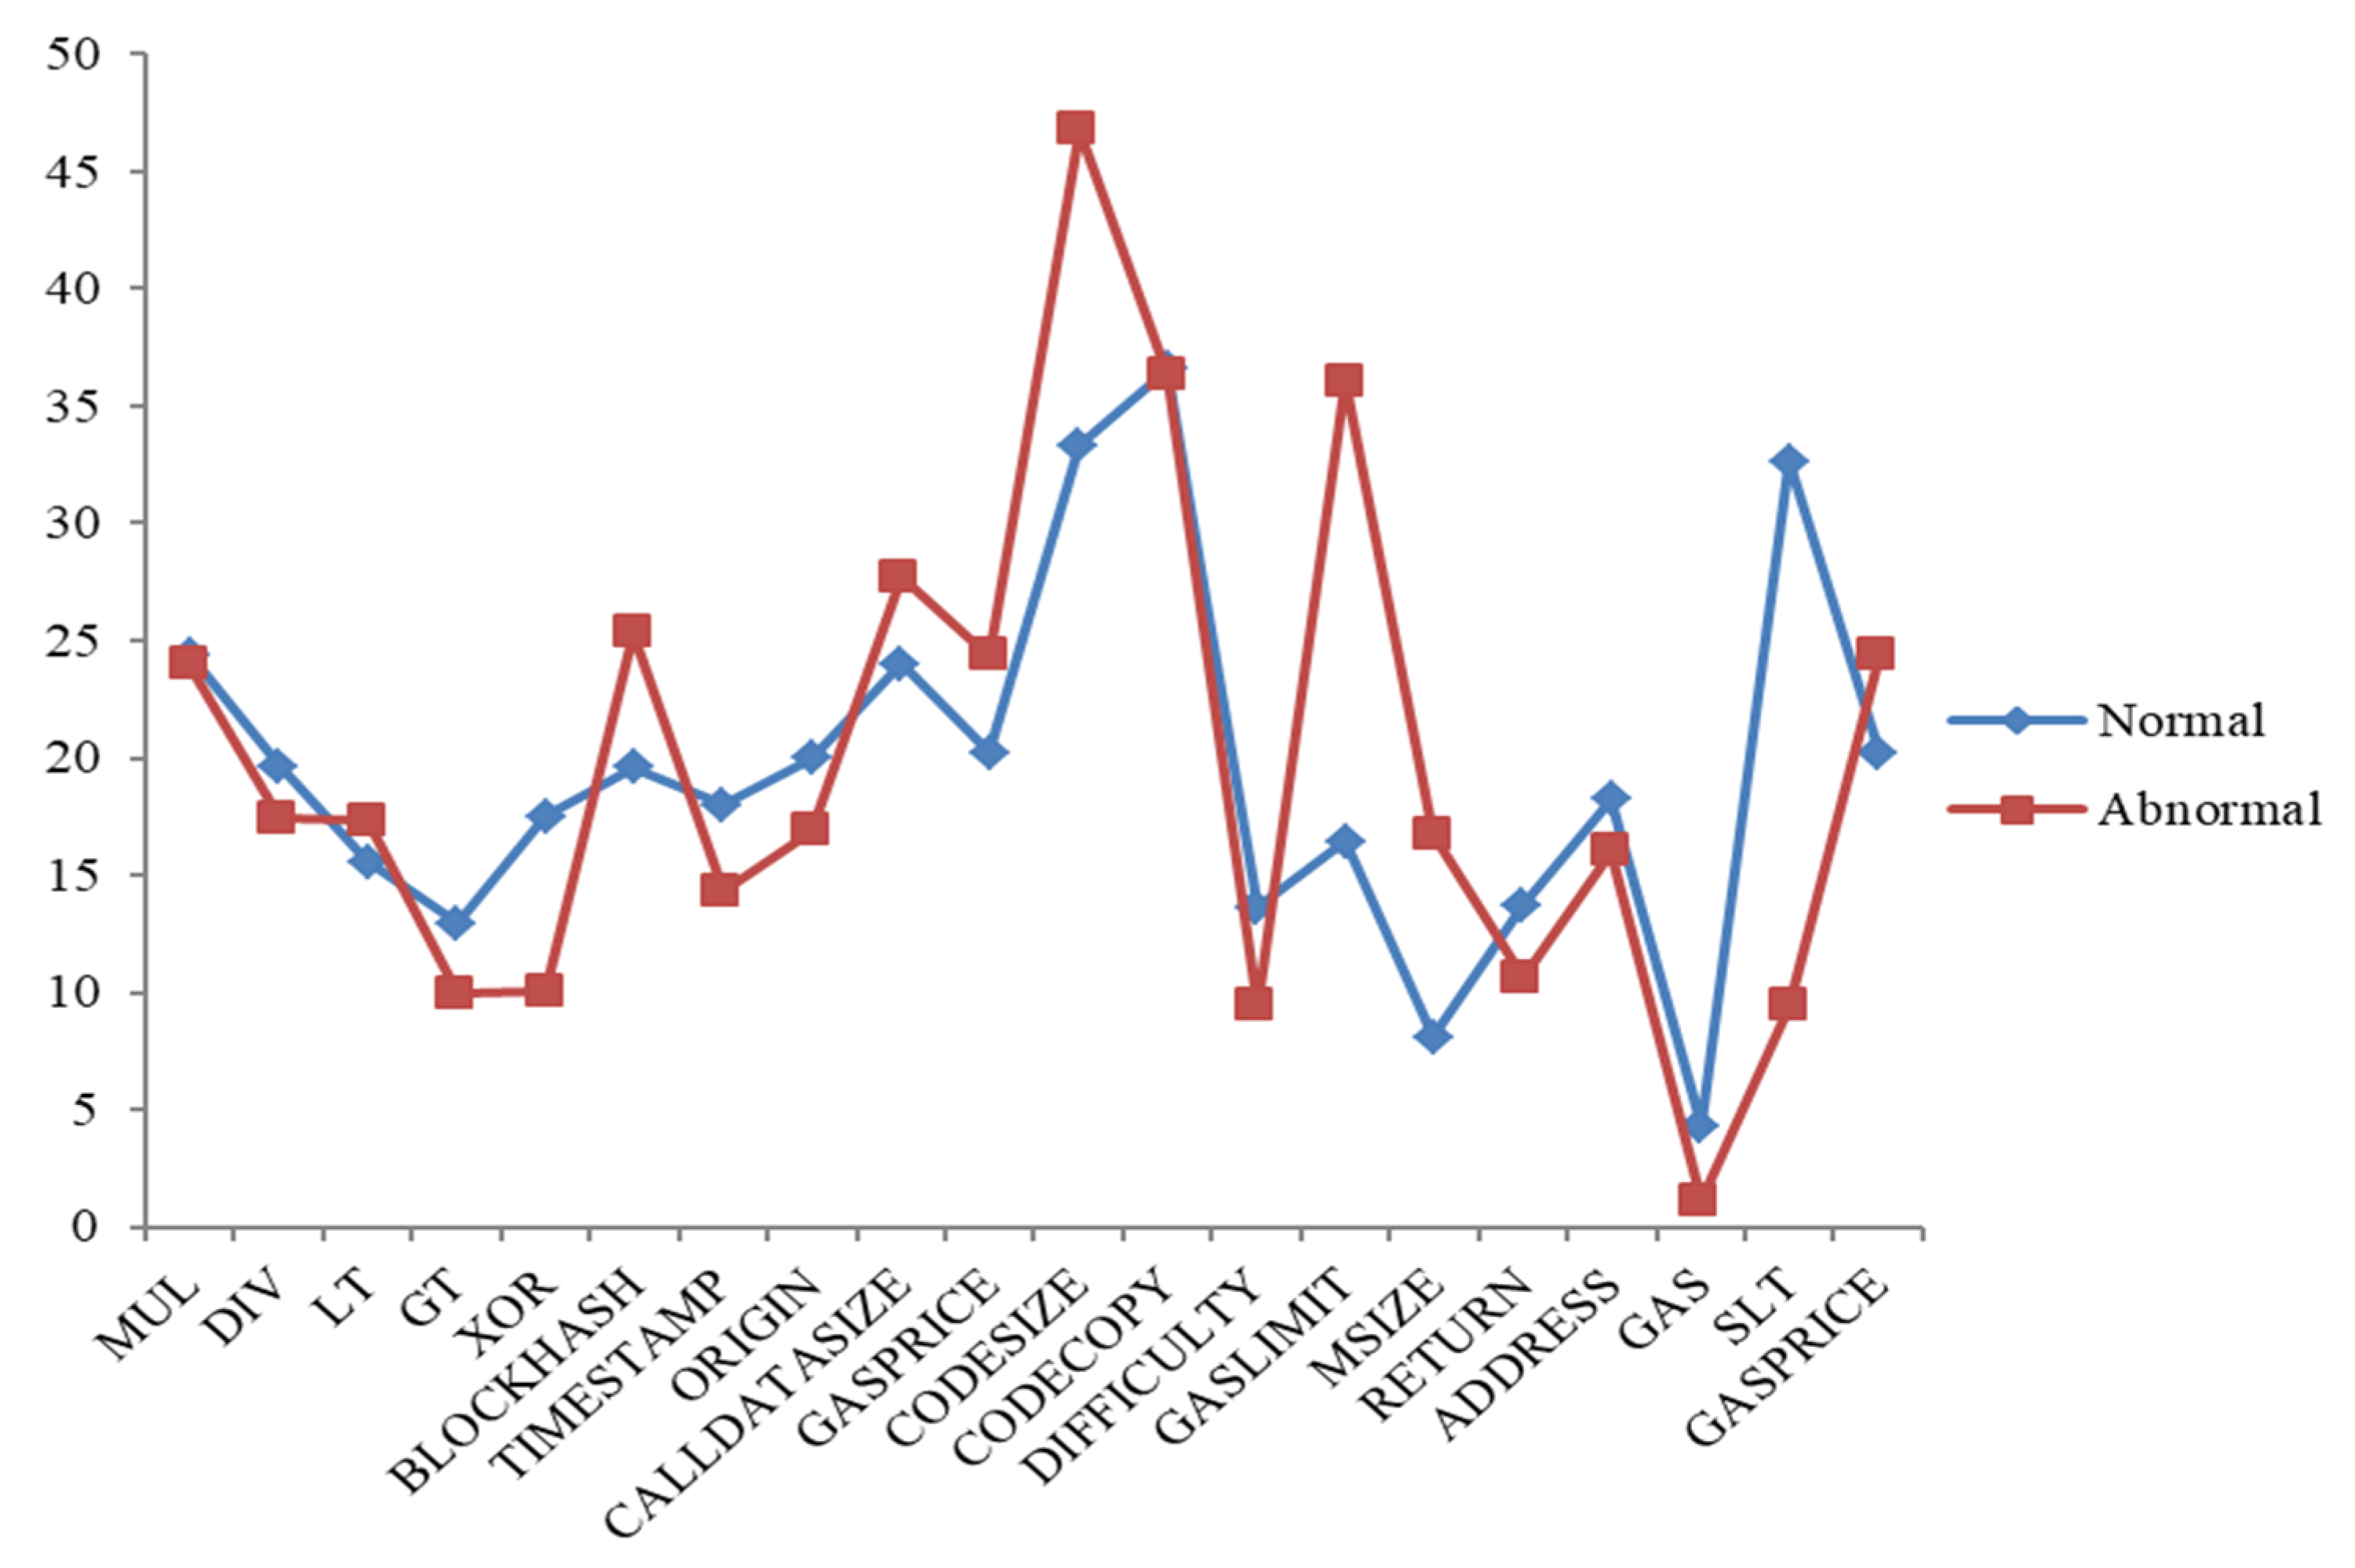
Figure 5 shows a comparison of some normal and abnormal opcodes based on average frequency values for each opcode in our data. The occurrence of each contract’s opcode is calculated and saved in the database. Opcodes that frequently occur, such as PUSH, DUP, and SWAP, and those with a frequency less than zero, are filtered out. Fifty-nine different opcodes were extracted from 1904 contract accounts. The Ethereum yellow paper appendix [
41] includes a complete list of EVM opcodes.
3.2.2. Transaction Features
Investors who join abnormal contracts receive a huge payout when they invest early, but later investors receive only a small payout. Many investors never get their money back from abnormal contracts due to the fact that the sooner one invests, the bigger the reward. Behavior-based features use contract’s intelligent interactions with its users, i.e., transactions. These features catch logical and relevant insights that reflect the behavior of contract accounts. Smart abnormal contracts are characterized by their intrinsic characteristics, which can be used to determine if they are smart abnormal schemes. Using the Ethereum blockchain data, we are able to obtain all transactions made by normal and abnormal contracts that reflect the main behavior of a contract. All transactions are stored in a JSON file format. We use the JSON library in Python to load the file, analyze it, and extract portions of information from stored transactions. For these transactions, we get the respective fields defined in
Table 3 to perform feature extraction. The respective fields include information such as which account paid the amount of Ether to the respective contract account and when. This information is then used to observe the behavior of the contract account and convert them into features for classification. In our feature extraction stage, we created 57 explanatory variables concerning transaction data to analyze smart contract accounts. Explanatory variables are described in
Table 4. A small subset of the features extracted was comparable to those gained in similar works [
15,
32,
42]. Although all extracted transaction features are not necessary for classifier training, some of them do not participate in improving the efficiency of the classification model. Thus, we use the XGBboost feature importance algorithm as a feature-reducing method to decrease the dimensions of the feature vector component. We choose the top 32, with the highest score in information gain, as shown in
Figure 6.
Based on our dataset,
Table 5 shows the frequency of the top 10 transaction-based features among abnormal and normal contract accounts. It is evident from the table that abnormal and normal contracts have very different statistics. As a first point of observation, normal contracts have larger standard deviations than abnormal contracts for most features. It implies that smart abnormal contracts may behave similarly, leading to lower standard deviations. It is apparent that abnormal contracts are a special type of smart contract account based on the significant differences in statistics of some features. In normal contracts, for example, the total number of transactions sent and received, the total number of failed received transactions, and the total number of failed sent transactions are greater than those in abnormal contracts. Normal contract accounts use a greater number of gas price values and gas values in their sent transactions than abnormal contract accounts. Using the MinMaxscaler technique, we scaled each input feature in the 0–1 range separately before modeling in order to achieve maximum precision.
3.2.3. Source Code Features
TF-IDF stands for Term Frequency-Inverse Document Frequency. A term’s significance is directly proportional to how many times it appears in a set of documents. The weight of the TF IDF is a statistical measure that represents the significance of a term in a set of documents. The weight of a TF-IDF is calculated by multiplying two different scales:
Term frequency (TF): There are several ways to calculate this frequency, the simplest being the number of instances where a term appears in a document. Then, there are ways to adapt the frequency, depending on the length of the document or the raw frequency of the most common term in the document.
Inverse document frequency (IDF): This means the importance of a term in the entire corpus. The closer it is to 0, the more common a term is. This metric can be computed by taking the total number of documents, dividing it by the number of documents containing a term, and computing the logarithm.
The TF-IDF score for the term t in document
d from the collection of documents
D is calculated as follows [
40]:
where
and
N is documents count in
D.
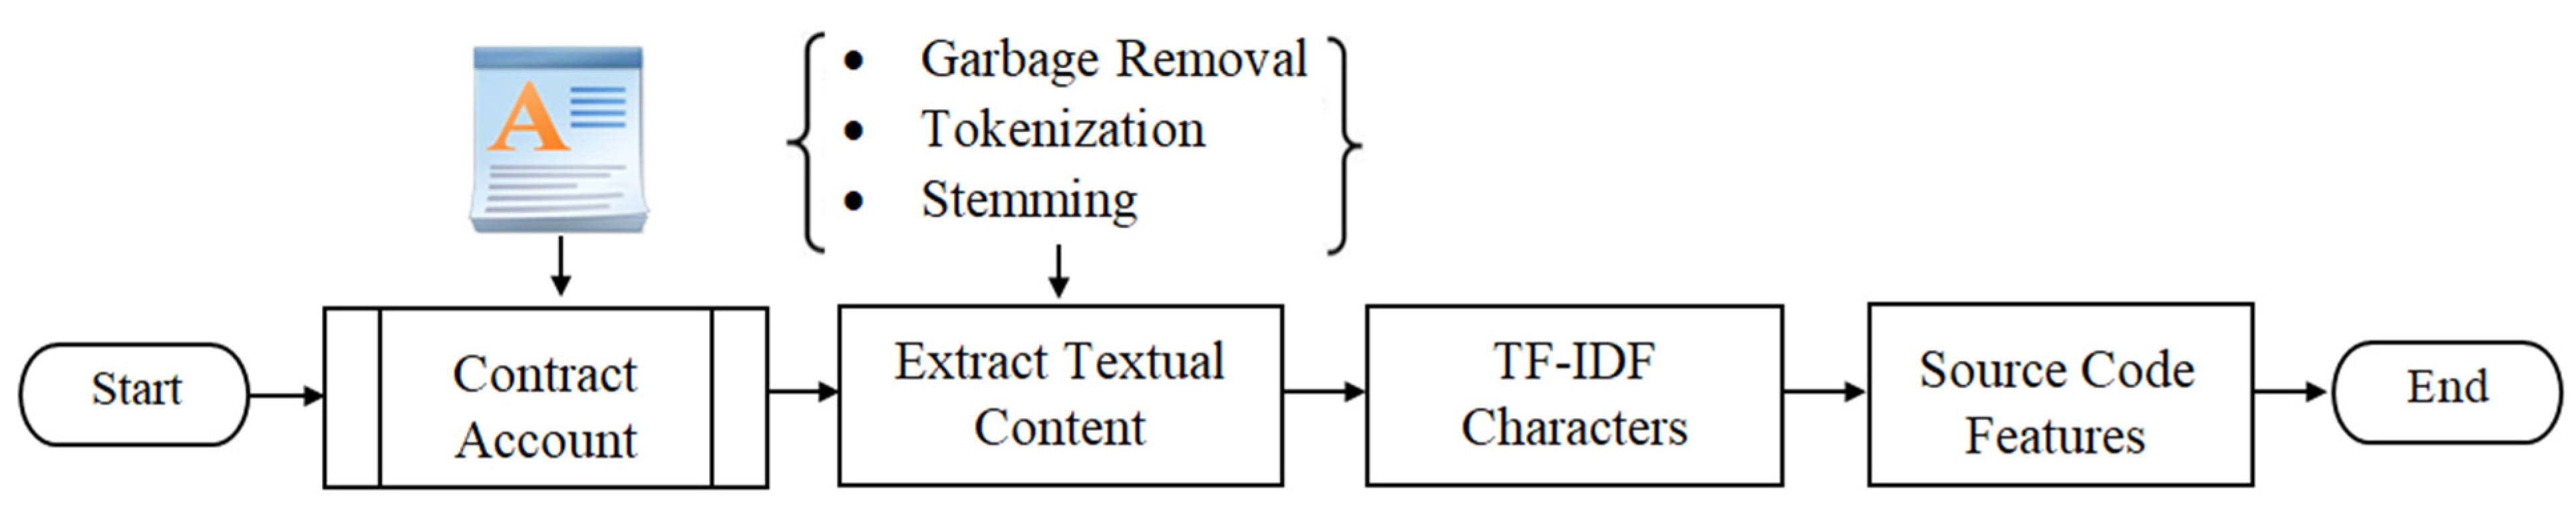
There are different levels of input tokens that can be generated using the TF-IDF technique (words, letters, and n-grams). One limitation is that the TF-IDF technique may fail if the extracted keywords are irrelevant, misspelled, or skipped. The source code for the contract account is written in high-level language programming (i.e., solidity [
5]). Since solidity source code in our method is extracted from the selected contract account using JSON parser, the TF-IDF character level technique is employed with max features as 10,000. To get appropriate text information of the contract account source code, the extra parts are removed by regular expressions, including punctuation symbols, numbers, spaces, newline, etc., as shown in
Figure 7. Finally, the TF-IDF object is used in order to transform the text of the smart contract source code.
3.3. Ensemble Learning Model
In order to construct a labeled dataset, we apply feature vectorization to extract the features for each smart contract. We combine opcode n-grams with source code characters and transaction features to generate a feature vector needed for training the proposed method through an ensemble classifier of Extra-Trees and grading boosting machine algorithms. Our goal in combining bagging with boosted models is to create a strong classifier that balances the weaknesses of individual classifiers in a given data set. There are different approaches to create an ensemble of classifiers [
43]. A soft voting ensemble learning model is applied using the scikit-learn package (
http://scikit-learn.org, accessed on 1 July 2022), and features are extracted using Python. Extremely Randomized Trees (Extra-Trees Classifier, ETC) is a type of bagging learning model which builds randomized trees whose structures are independent of the output values of the learning sample. Bagging, also known as (bootstrap aggregation), is an ensemble learning method commonly used to reduce variance within a noisy data set. In bagging, random subsets
of data in the training set
is chosen with replacement. In this case, the average or majority of votes is used for the prediction of all trees and is therefore more powerful than a single decision tree. A base learner
is trained based on the random subsets
, and the prediction of the ETC classifier is voted as follows [
44]:
where
is the characteristic function to finding the best parameters that best fit the training data
and labels,
is the set of unique class labels, and
is the number of a base learner.
Meanwhile, another classifier, Gradient Boosting Machine (GBM), is a machine learning classifier for tree boosting used in classification and regression tasks. It provides a strong predictive model in the form of a group of weak learning models, which are usually decision trees [
45]. Suppose there are
contract accounts in the dataset
, where
are the extracted features associated with the
i-th contract account
are the class label, such that
if and only if the contract account is a labeled abnormal contract. The GBM introduces additive modeling, which means that first builds a model, find its residual, and build another model
on the residual. Thus, the generalized equation for a boosting algorithm at iteration
can be calculated by following the mathematically model [
45]:
The term gradient boost comes from incorporating gradient descent into boosting. A method based on gradient descent is used to determine the alpha
or step size that minimizes the average value of the loss function on the training set. For alpha computation, at step
, first pseudo-residual
or negative gradient is calculated, and the new model
(or base learner, e.g., tree) is generated on the training set
. The pseudo-residual is calculated by [
45]:
Now, compute
so that the
function is minimized [
45].
The rate calculation in the GBM classifier requires two steps: (i) calculate pseudo-residual and (ii) calculate step size . So, we can plug in those values of and to update the model and get . Finally, we are ready to get new predictions by adding our base GBM model with the new tree we made on residuals . The contract accounts are classified into two possible categories: abnormal and normal using a binary classifier. When the contract account is uploaded to the Ethereum Blockchain, the trained classifier determines the prediction of a particular account contract from the created feature vector.
Ensemble methods can be used to increase overall accuracy by learning and integrating several base classification models. The ensemble method can be generated from different classification algorithms, for example, Extra-Trees, GBM, etc. Alternatively, the same base classification algorithm can also be used, imposing different subsets of the training data set. Given a new data set to classify, each classifier votes to name that set’s class. The ensemble method collects votes to return the final class prediction
.
Figure 8 illustrates the concept of our ensemble method using the weighted soft voting strategy.
The ensemble method includes a sequential four-step process: (i) split the dataset into a training and test set; in the training process, the training data is passed after balanced to the ensemble model; the dataset was randomly divided into 80:20 ratios for training and testing, respectively; (ii) training base classifiers (Extra-Trees, GBM) on the training set; (iii) use the test set and its predictions to create an ensemble-classifier; and (iv) make final predictions using this classifier. During the testing process, the ensemble model determines whether or not the unknown contract account is abnormal. The hybrid model, after training, outputs predictive values between zero and one for each record in the examination data.
The ensemble vote classifier is a set of classifiers whose individual decisions are integrated in some way (usually by hard or soft voting) to identify new examples. In hard voting, data is classified based on class labels and the weights associated with each classifier. On the other hand, a soft voting classifier classifies the data based on the probabilities and weights associated with each classifier. We employ Extra-Trees and GBM algorithms to design an ensemble meta-classifier with a soft voting strategy. Meanwhile, weights are the learnable parameters of some machine learning models, including ensemble models, and are commonly referred to as
. Since we have a binary classification problem with class labels
and an ensemble of two base classifiers (ETC and GBM), let us assume that the two classifiers return the following class membership predications for a particular sample
:
and
for normal and abnormal contracts of ETC classifier,
and
predictions for normal and abnormal contracts of GBM classifier. We can then calculate the individual probability of first-class label
using a weighted soft vote as follows:
where
and
refer to the predicted probabilities of the ETC and GBM classifiers, respectively, for class label
. It has been trained on our dataset and applied to test data when forecasting the likelihood of a particular contract, such as whether the contract is normal or not. Similarly, we can write the weighted soft vote of the predicted second-class label
as follows:
where
and
refer to the predicted probabilities of the ETC and GBM classifiers for class label
. While
and
are the weights associated with the two classifiers of Equations (8) and (9), weights are usually randomly generated as default values between 0 and 1 to speed up the training process of machine learning algorithms [
43]. When
, the contract account to be identified is normal; otherwise, it is abnormal contract.
where
and
are the weighted soft vote of the predicted first- and second-class labels according to Equations (8) and (9).
3.4. Abnormal Contracts Detection
The prediction stage includes building a robust model using the ensemble classifier, bagging, and boosted models. The ensemble method includes using many base learners to enhance the efficiency of any single one of them individually. This method can be represented as techniques that use a group of weak learners together to generate a robust, aggregated one. Here, an ensemble model is employed on a combined feature set to build a robust classifier for abnormal contract account detection. Using a binary classifier, contract accounts are categorized into two possible values: abnormal contracts and normal contracts. The ensemble classifier is trained using the feature vectors collected from each contract account in the training set. Once trained, the classifier establishes whether the contract account is abnormal. The transaction features component generates 32-dimensional feature vector as:
and the opcode n-grams features component generates a D-dimensional feature vector as:
whereas source code characters component generates K-dimensional feature vector as:
where
and
are the sizes of dictionaries calculated from the textual content corpus; the source code vector contains
features, the opcodes n-gram contains
features, and a transaction feature contains 32 features. From our experiments, we note that
and
each contain 17,047 and 10,303 elements, respectively. The above three feature vectors are integrated to create the final feature vector, fed as an input parameter to the ensemble learning model to identify the probability of anomaly
of contract account
as shown in Algorithm 1.
| Algorithm 1: Abnormal Contract Detection Algorithm |
| Input: The contract account addresses , |
| Output: The probability of anomaly , 0—normal, 1—abnormal |
Initialize the contract addresses set H = //represents the validation feature set For each contract do Initialize feature vectors Compute transaction features component using Equation (11) Generate opcodes n-grams vector using Equation (12) Create source code chars features using Equation (13) Concatenate to form final feature vector using Equation (14) Append the final feature vector to the validation feature set End for Fetch the predictions of first-class label for validation feature set using Equation (8) Compute the predictions of second class for validation set Equation (9) Predict the probabilities of anomaly of validation set based on predictions and using Equation (10) Return:
|
4. Implementation and Evaluation
A desktop machine with a Core™ i7 processor with a clock speed of 3.4 GHz and 16 GB of RAM is used to implement the proposed detection method. The proposed method is implemented using Python, since it provides substantial support for its libraries and is relatively simple to compile. The JSON library is used to parse the transaction data and source code of the selected contract account. The proposed method takes suspicious contract account as input and outputs the type of the contract account scheme as normal or abnormal. The prior extracted three features (Opcode n-gram features, Transaction features, and Source code characters features) are integrated into hybrid features.
We used a variety of performance statistics to measure the efficiency of our proposed method, including true positives, true negatives, false positives, false negatives, accuracy, precision, and F1 scores. Each is defined below.
4.1. Evaluation of Features
We have evaluated the performance of our proposed features (opcode n-grams, source code characters, and transaction features). The results shown in
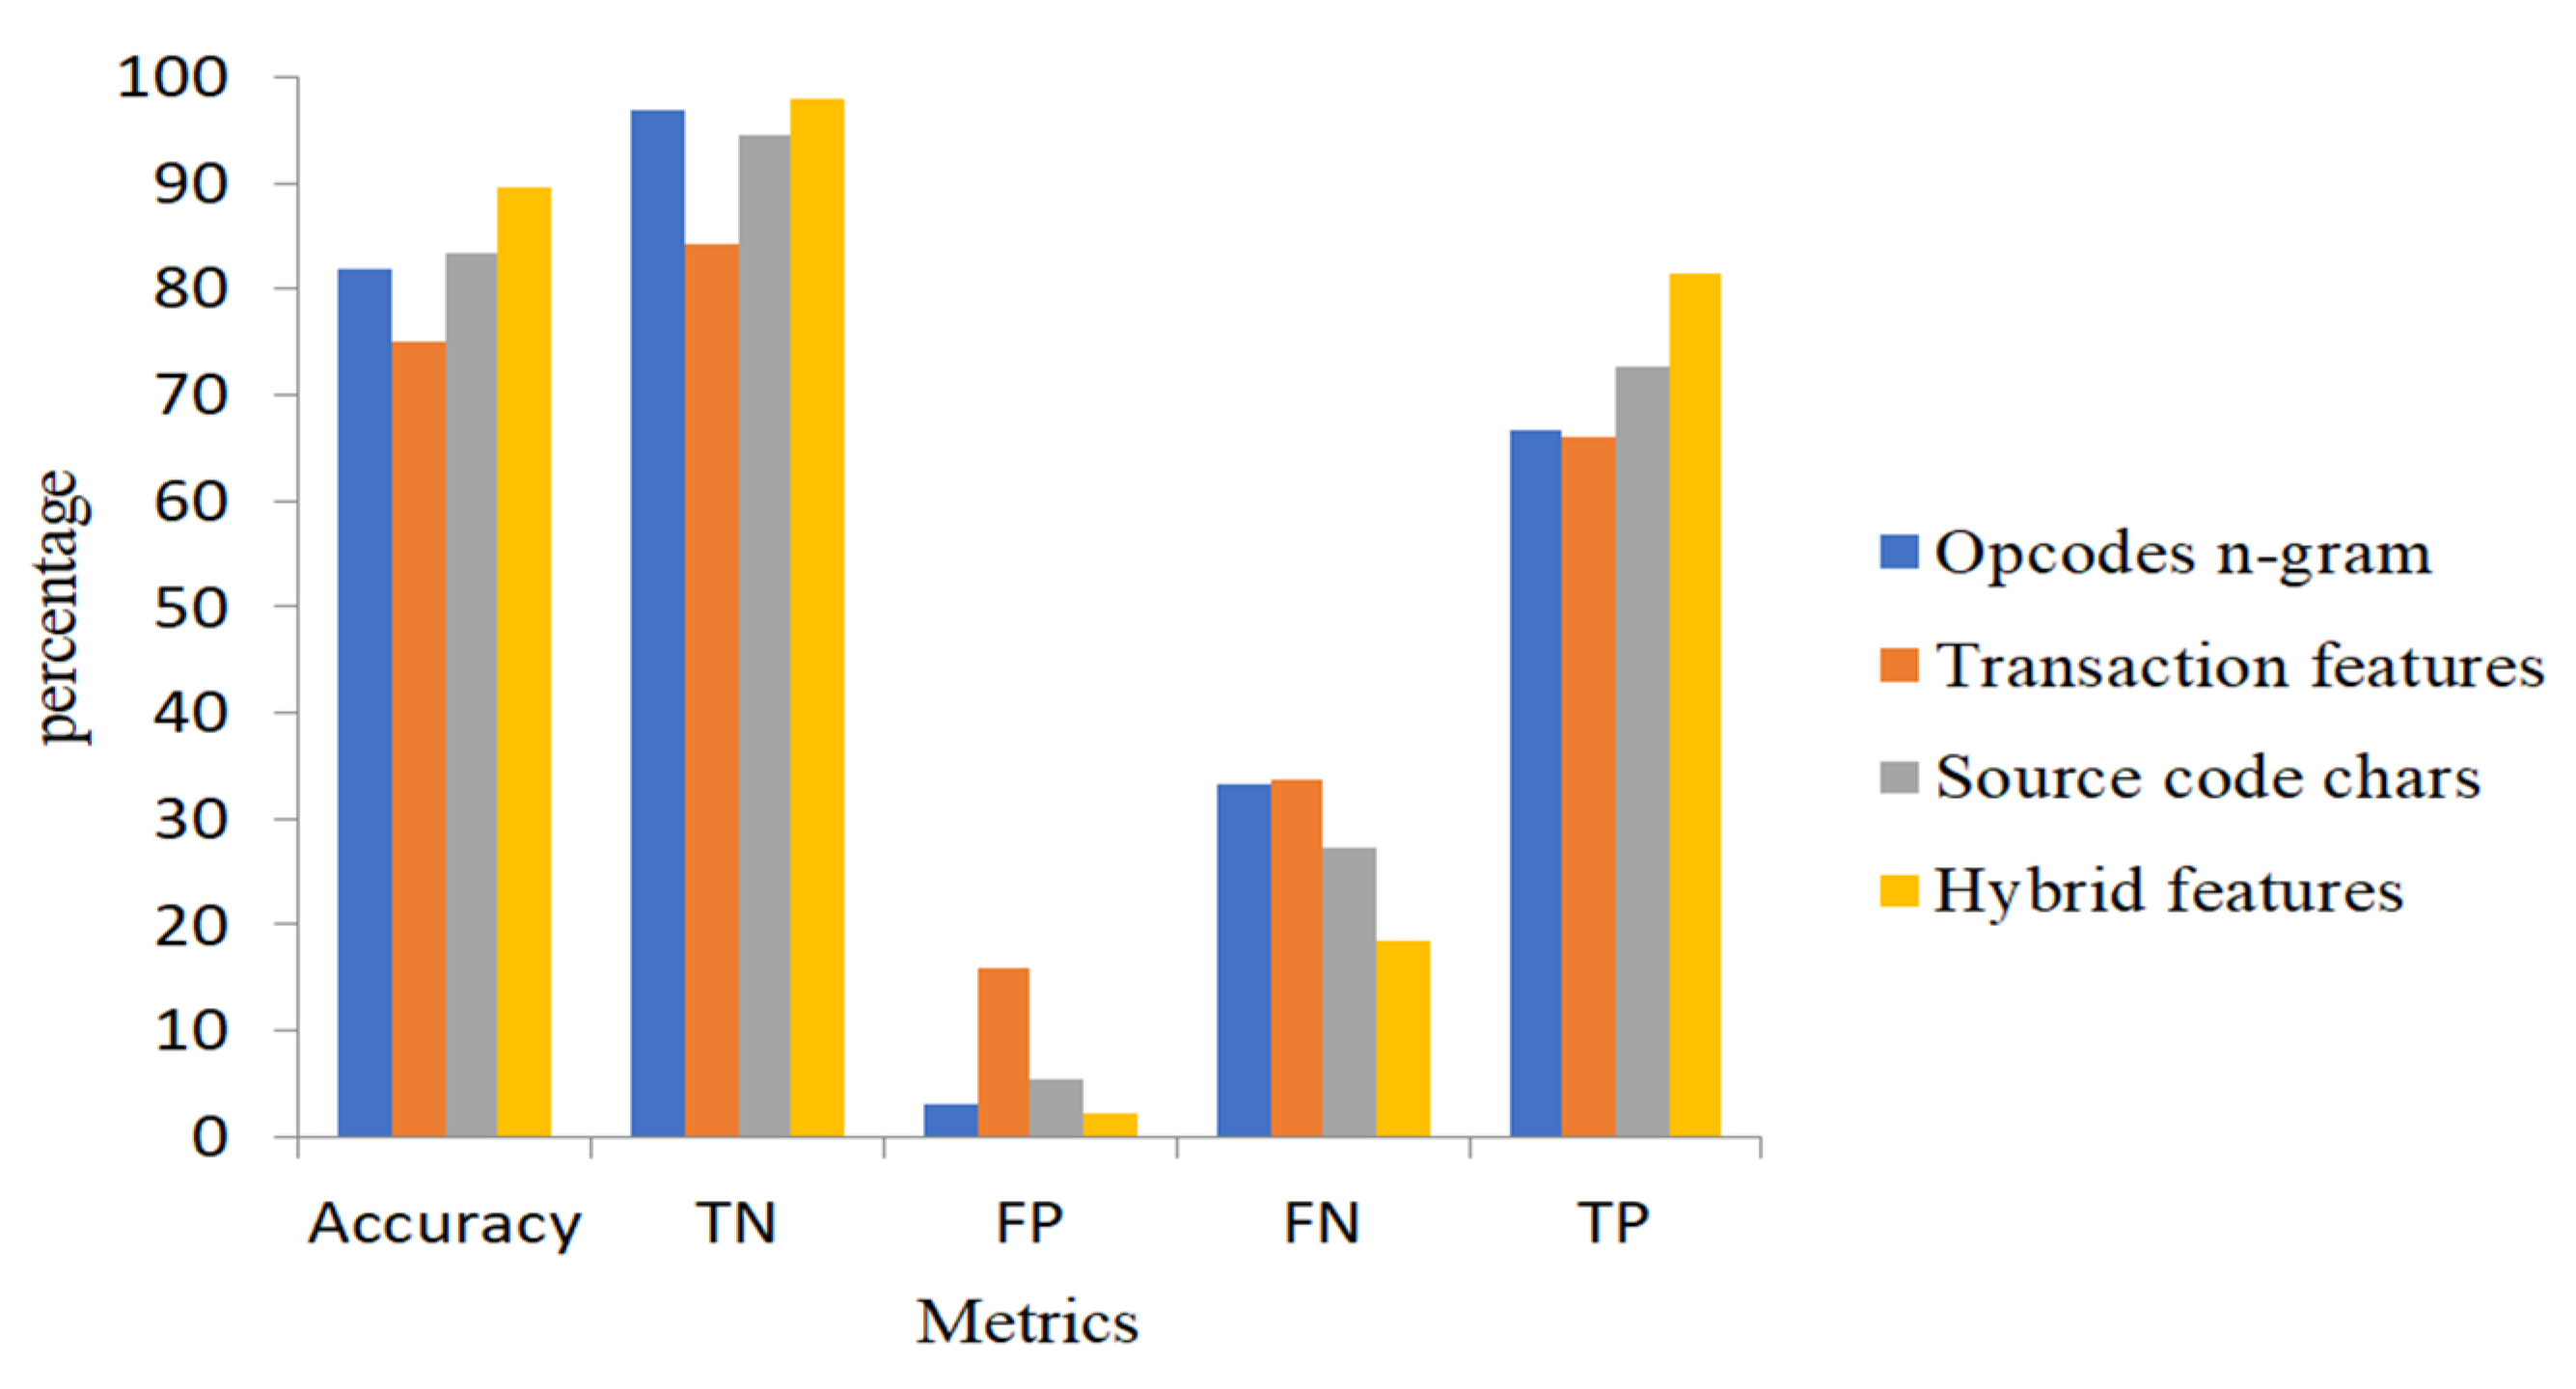
Table 6 demonstrate that the proposed individual feature sets are useful in abnormal contract detection. However, one type of feature is not appropriate to detect all types of abnormal contract accounts and does not result in high accuracy. Therefore, we have combined all features (hybrid features) to get more comprehensive features and better accuracy of the proposed method.
In
Figure 9, we compare the four feature sets in terms of accuracy, i.e., TNR, FPR, FNR, and TPR. From
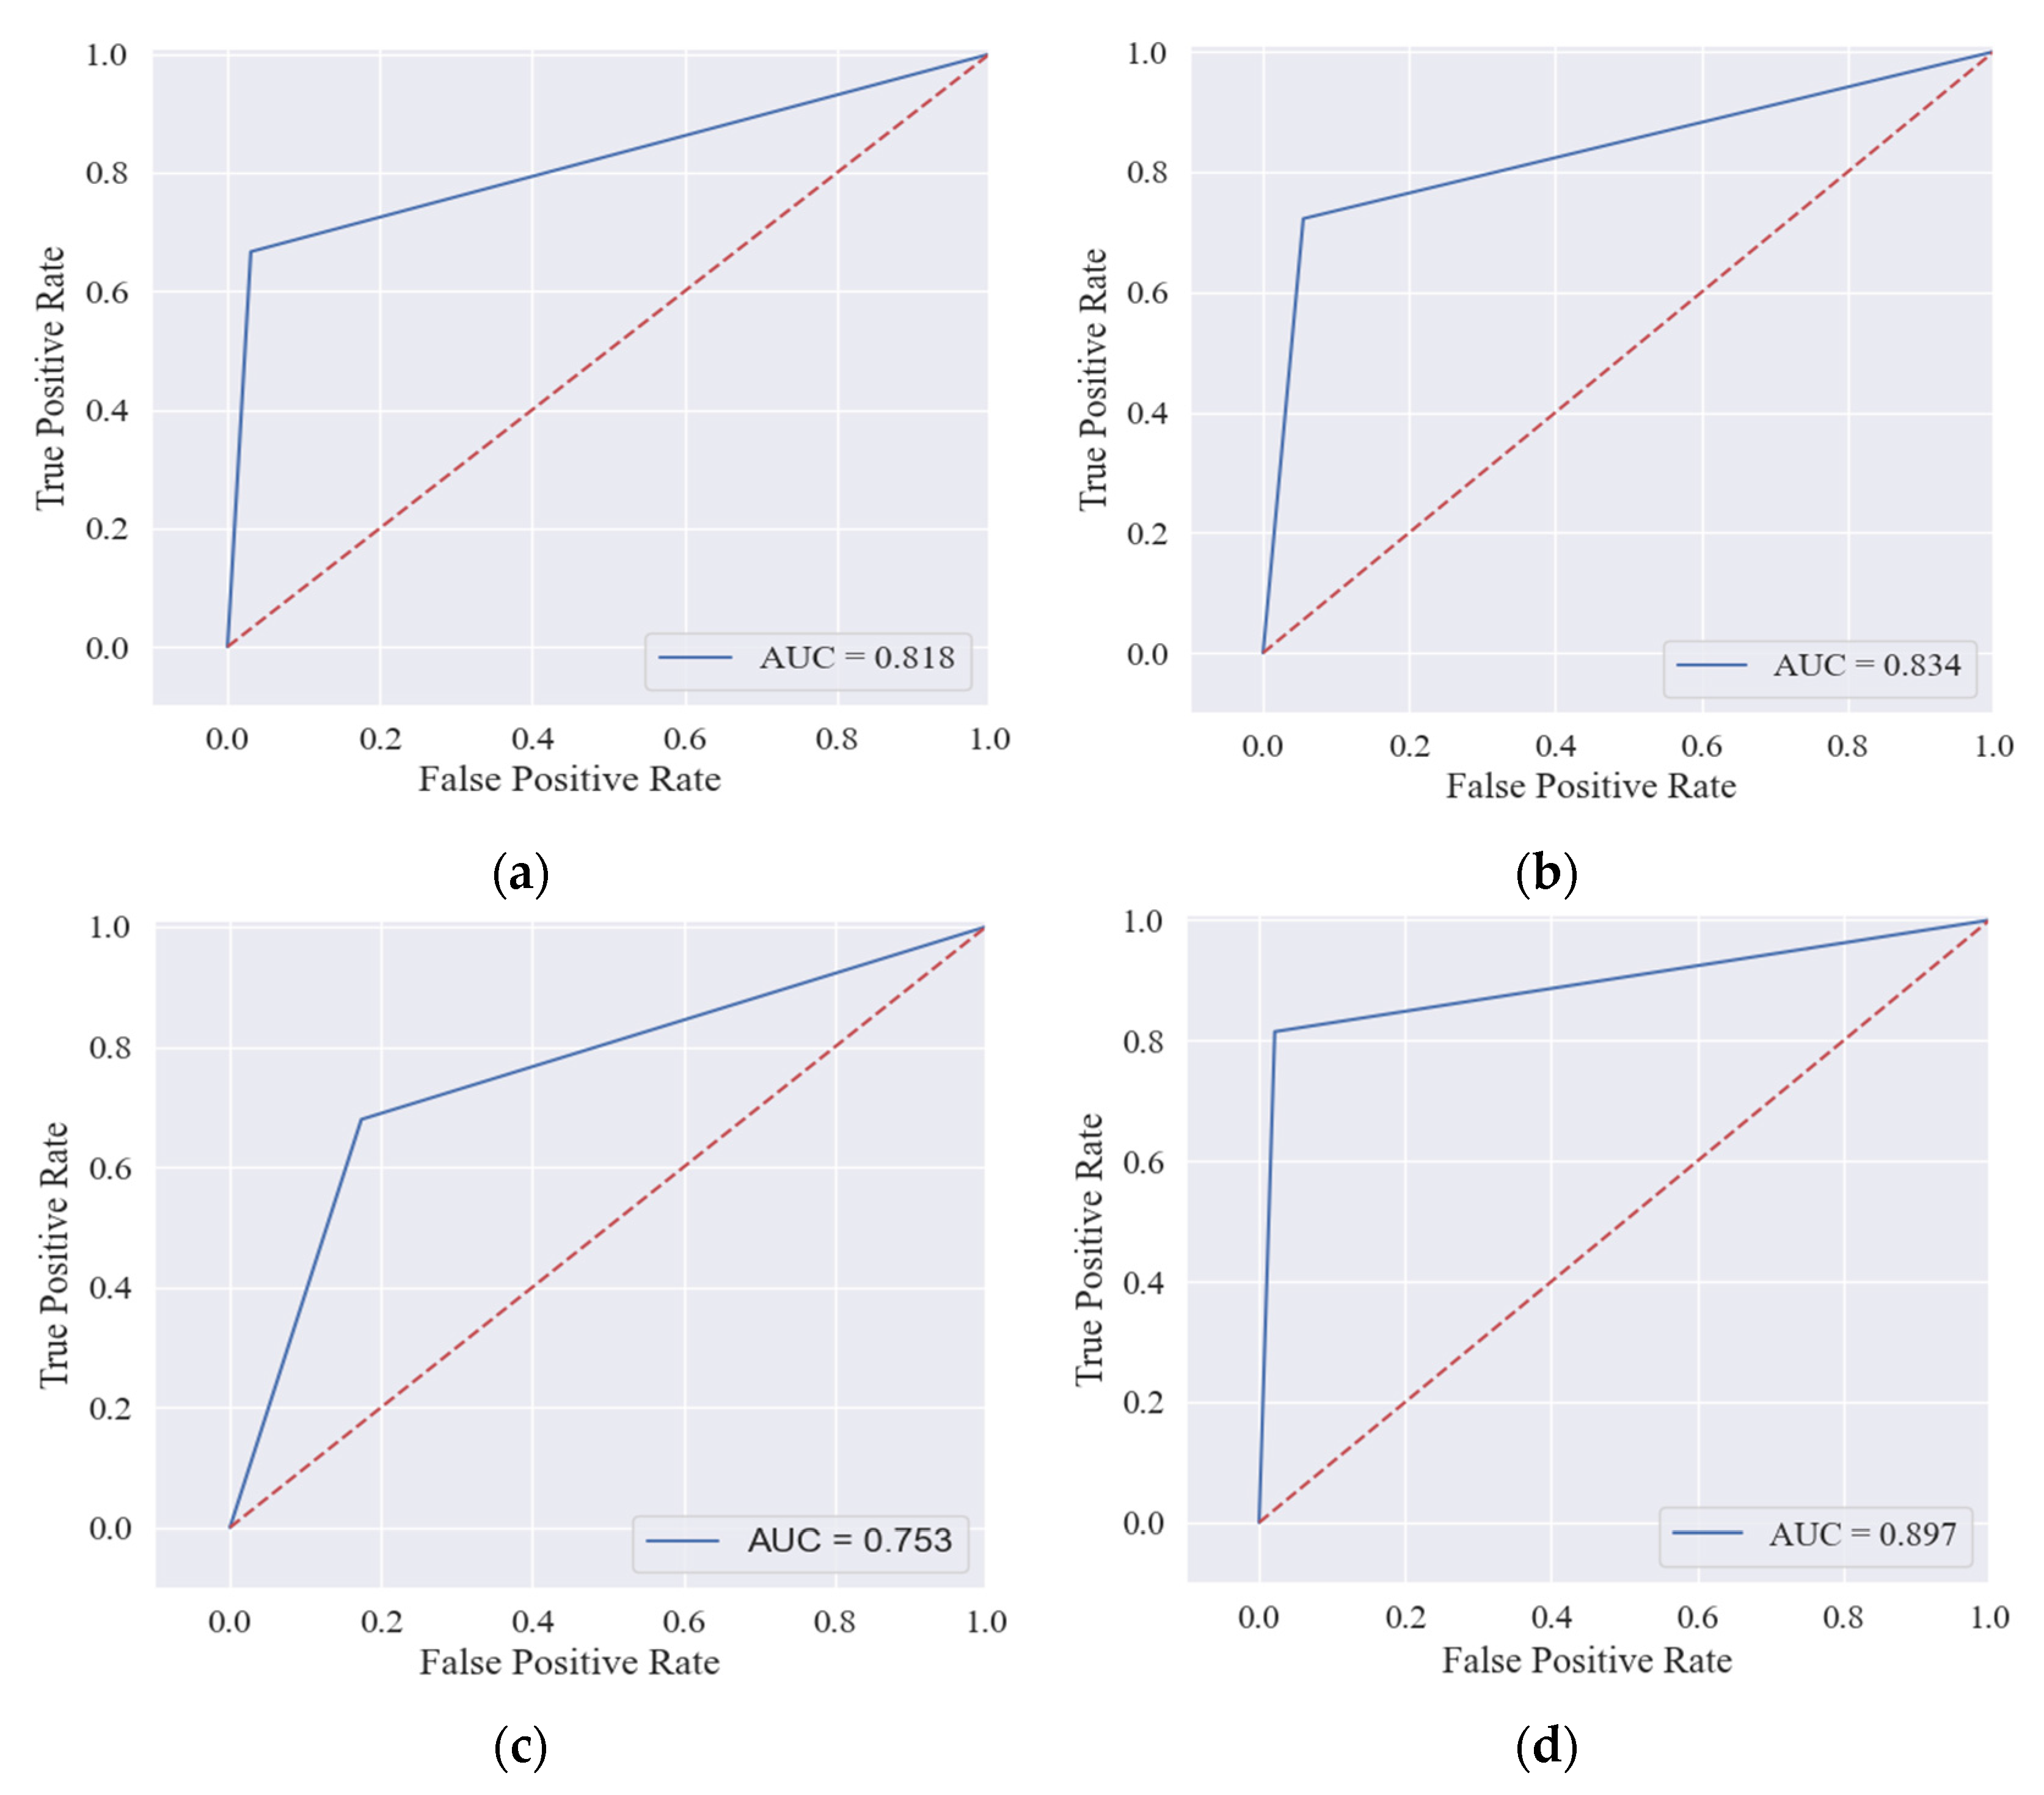
Table 7, we construct a confusion matrix for the proposed feature sets by using the ensemble model to detect 381 contracts in our test data. The hybrid feature set accurately identifies 320 normal contracts and 44 abnormal contracts and includes 10 FNs and 7 FPs, which is much better than other features. Opcodes n-grams and transaction features have 10 and 51 FPs, but FNs reach 18 and 19, respectively. The number of FNs and FPs for the source code features is 15 and 18, respectively, which is more impressive than n-gram opcodes and transaction features. A receiver operating characteristic (ROC) curve represents TPR on the
Y axis and FPR on the
X axis (
Figure 10). The large area under the curve (AUC) indicates that the classifier is performing perfectly when applied to the data.
4.2. Evaluation of Ensemble Model
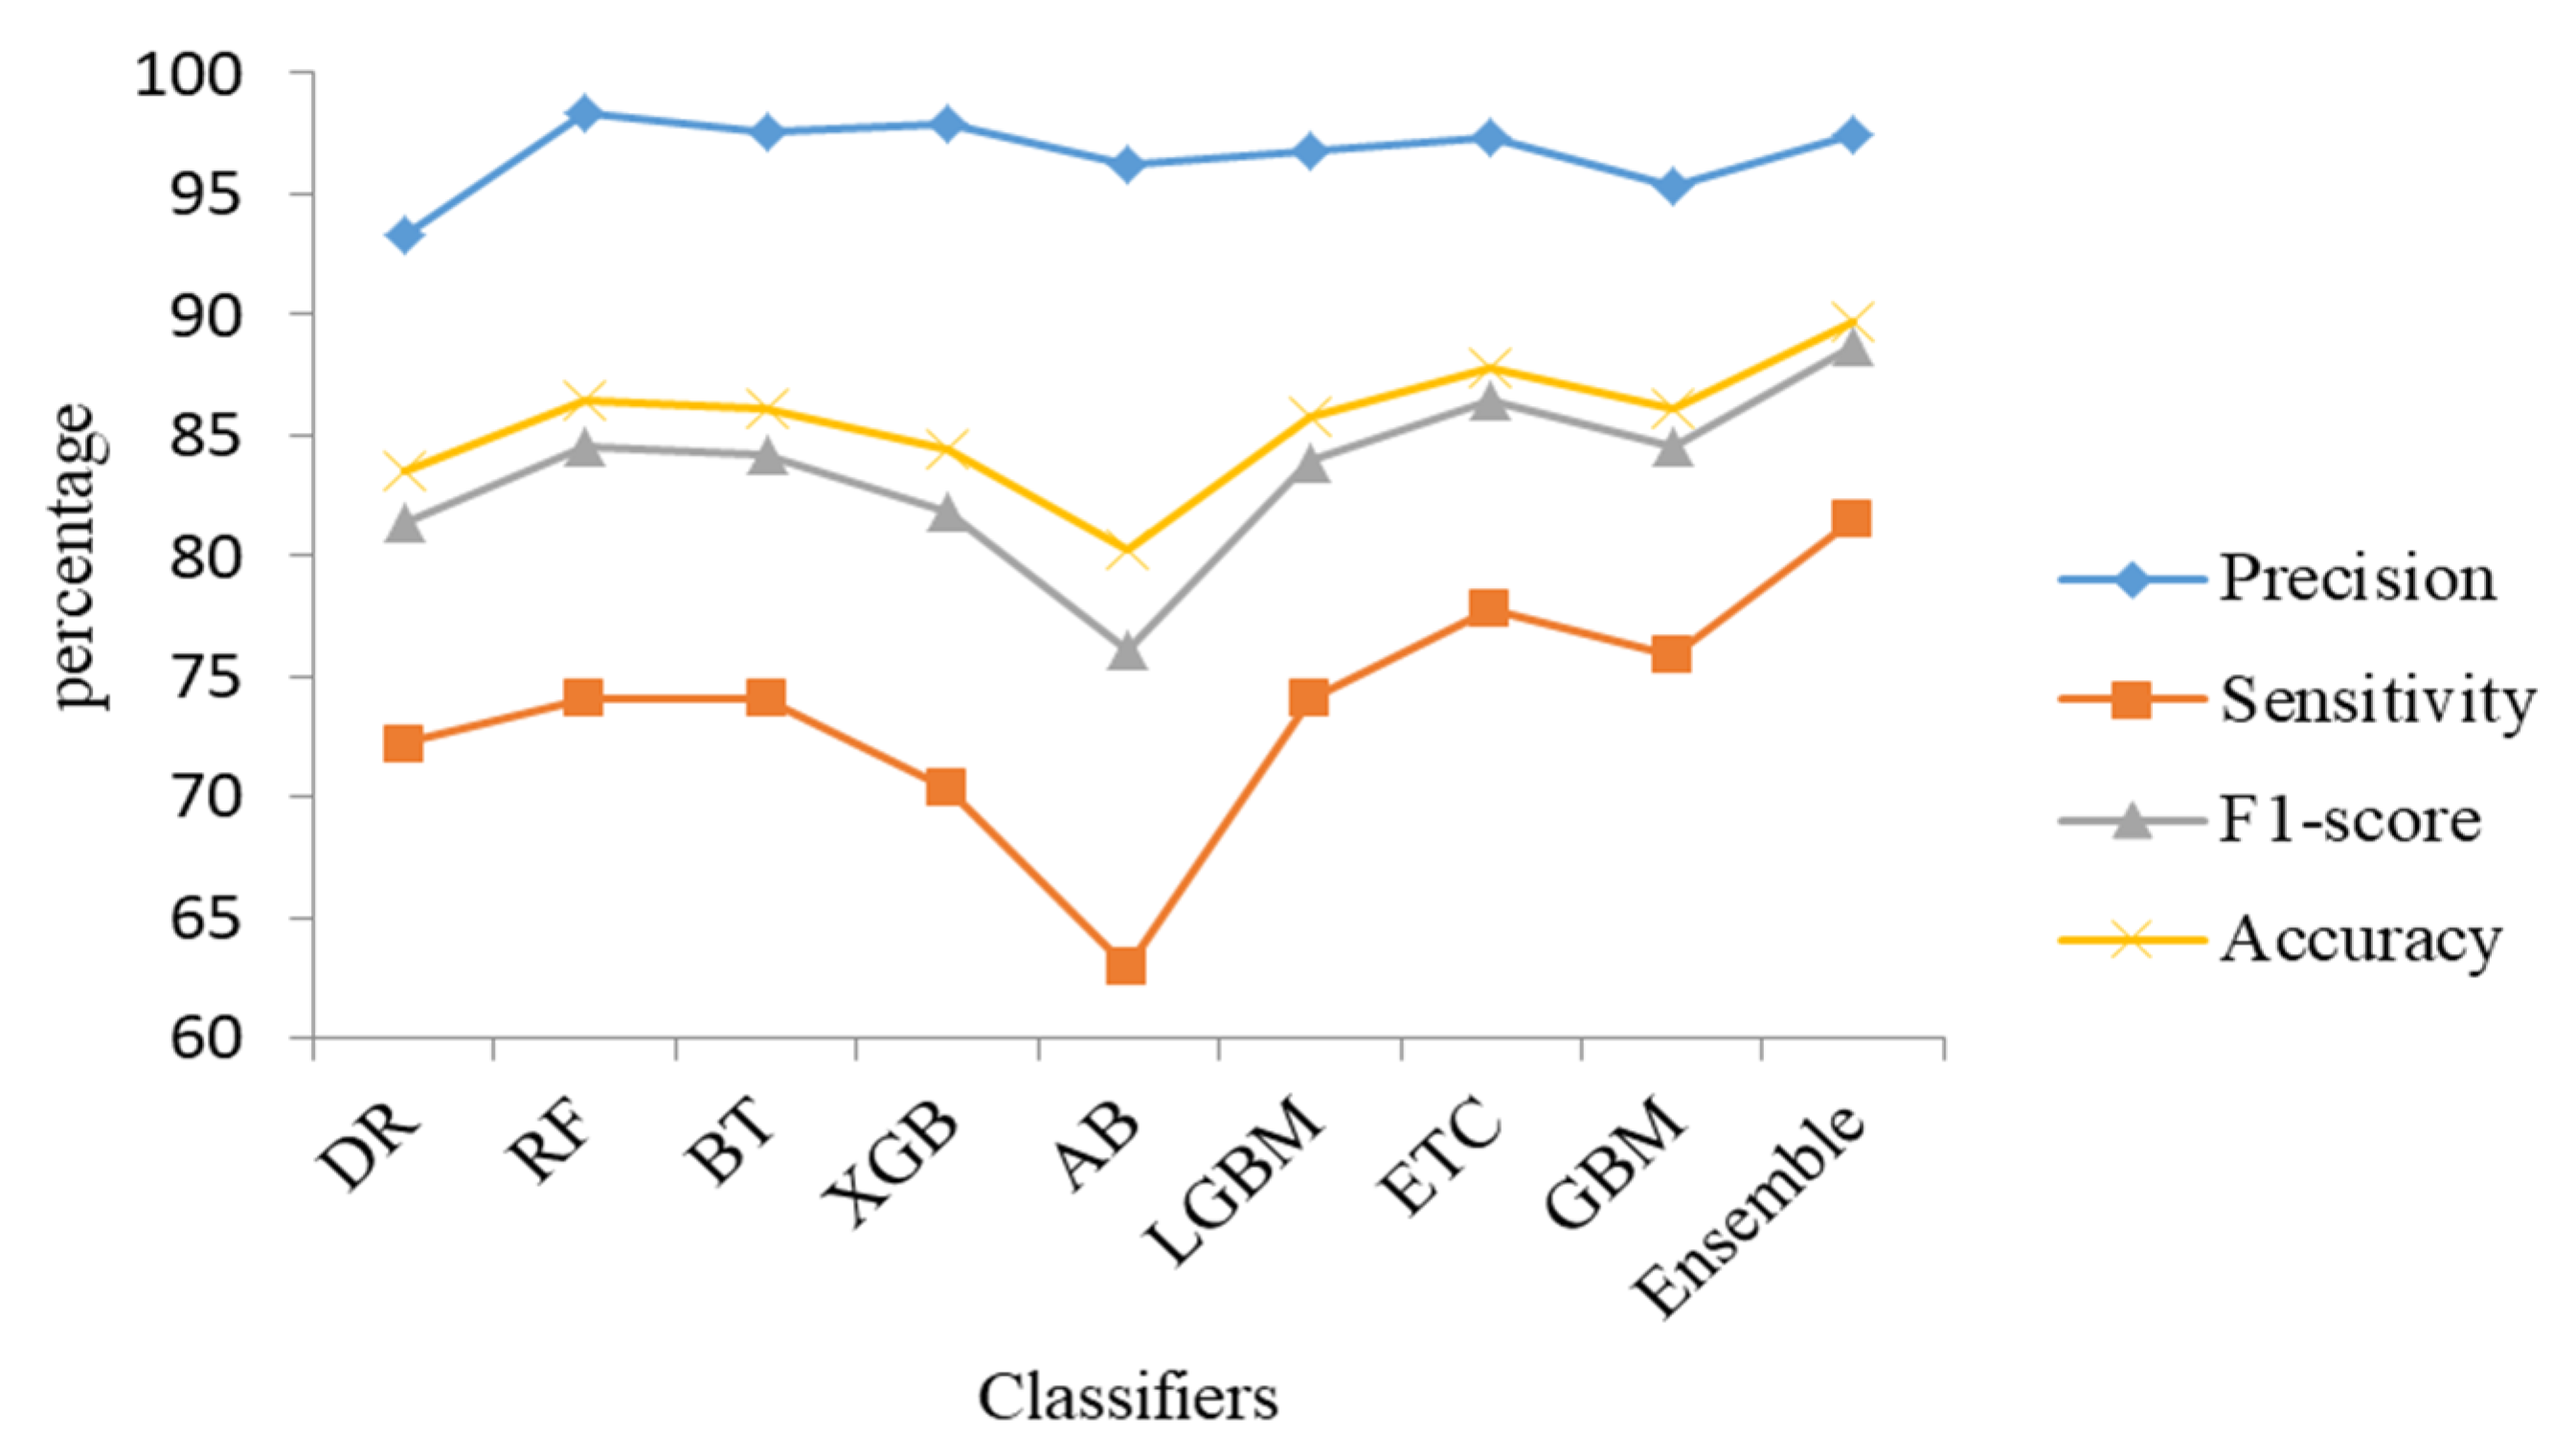
In this section, we have applied various bagging algorithms (i.e., random forest, extra trees, bagging tree, etc.) and boosting models (i.e., AdaBoost, gradient boosting machine, XGBoost, light gradient boosting, etc.) to train our proposed hybrid features. This experiment aims to create a robust ensemble classifier by combining bagging and boosted techniques. The experimental results are shown in
Table 8. Random forest, extra-trees, and bagging-tree are bagging algorithms and outperformed the other classifiers with adequate accuracy. On the other hand, AdaBoost, XGBoost, gradient boosting, and light gradient boost are a type of boosting tree algorithms that convert weak learners into strong learners; thus, they have high precision, accuracy, sensitivity, and F1-score. We noticed that Extra-Trees and gradient boosting machine performed well from bagging and boosting models, respectively, so we chose these two algorithms to generate an ensemble classifier with a soft voting approach. This classifier outperformed other methods in terms of accuracy, precision, F1-score, and sensitivity, and achieved a high-performance rate. The results of various classifiers of the hybrid features set are also shown in
Figure 11.
To illustrate the learning capability of the proposed method, as shown in
Figure 12, we include both classification errors and log losses in our training and test data set with respect to how many iterations the ensemble model executes for each epoch. Log loss, short for logarithmic loss, refers to the price paid for incorrect predictions in classification. According to the figure, the learning model reaches convergence after approximately 30 iterations.
4.3. Comparison with Existing Works
A comparison between the proposed method and other competing methods was conducted. We applied Chen et al. [
14] and Chen et al. [
15] methods on our dataset D1 to evaluate the performance of our proposed method. The main purpose of choosing these methods is due to the likewise in the features extracted from both transaction history and opcodes of contract accounts. Furthermore, we evaluated our method against the data (D2) presented by Chen et al. [
15] in regard to the three evaluation metrics used in the paper. The results of this comparison are presented in
Table 9. As a result of our method’s superior performance over other methods, our method is more effective at detecting abnormal contracts.
As part of the analysis, we also attempted to determine the entire training time and testing time for the proposed method in light of a hybrid feature set for detecting abnormal contracts based on datasets D1 and D2. The results are shown in
Table 10.
4.4. Complexity of the Proposed Method
In the proposed method, the computational complexity depends on how the proposed features are extracted and computed. The opcode n-grams features and source code features are extracted using TF-IDF algorithm. The TF-IDF is based on the frequency of each term and indexing a document of tokens, which required linear time and space complexity. The transaction-based features are extracted using python and SQL queries. SQL queries are executed based on the square of the database size and the manner in which the query will be processed by the SQL engine. Therefore, many of the transaction features in our method (i.e., Total_Txn, Avg_Eth_Sent, Total_Txn_Fee, Failed_Txn_Sent, Gas_Sent, Success_Txn_Received, etc.) require logarithmic time complexity , while others (i.e., Unique_Txn_Received, Unique_Address_Received, Avg_Time_Diff, etc.) require linearithmic time complexity . The learning model of our method is an ensemble of extra-trees and gradient boost machine based on weighted soft voting. In case the training data contains points with dimensions, the extra-trees algorithm has the following train time complexity , where is the number of decision trees in the tree. The space complexity consists of , where represents the number of nodes within the tree, and the run time complexity consists of , where represents the depth of the tree. Accordingly, gradient boost algorithms have a train time complexity of , a space complexity of as it is multiplied with models, and a runtime complexity of .
5. Conclusions
With the rapid growth of online finance, abnormal and fraudulent contract accounts are also growing. This results in substantial economic losses for users of blockchain technology, i.e., Ethereum. Therefore, an effective solution is demanded to detect fraud-based abnormal contracts on Ethereum to avoid such malware and maintain the data-driven security of the blockchain system. The abnormal contract accounts look similar to normal contracts, and the challenge is how to distinguish them. One of the biggest obstacles to detecting abnormal contract accounts on Ethereum is the severe data imbalance. This issue will lead to overfitting and poor generalization of the detection method in the absence of over-sampling of training data.
This paper uses data mining techniques to provide a robust method for abnormal contract detection on the Ethereum network. First, we collected abnormal and normal contracts data from Ethereum and solved the problem of imbalanced data by performing adaptive synthetic sampling. Next, we defined three types of features set based on the operation code n-grams, transaction data, and TF-IDF source code characters of contract accounts and combined them to get more comprehensive features. Finally, we designed an ensemble classification model combining Extra-Trees and gradient boosting classifiers to improve the classification accuracy of abnormal contracts compared to other methods.
There are abnormal scheme contract accounts that do not follow the patterns of existing abnormal contracts. This may also lead to misclassifying such abnormal contract accounts as normal contracts. For future work, we plan to build a neural network model against the latest abnormal contract accounts based on contract account bytecodes. Furthermore, we would like to investigate the applicability of our method to permissioned blockchains.


