Article

Prediction of Highway Blocking Loss Based on Ensemble Learning Fusion Model

1
Faculty of Information Engineering and Automation, Kunming University of Science and Technology, Kunming 650500, China
2
Yunnan Key Laboratory of Computer Technology Applications, Kunming 650500, China
*
Author to whom correspondence should be addressed.
Electronics 2022, 11(17), 2792; https://doi.org/10.3390/electronics11172792
Submission received: 24 July 2022 / Revised: 27 August 2022 / Accepted: 1 September 2022 / Published: 5 September 2022

Abstract

:
Road blocking events refer to road traffic blocking caused by landslides, debris flow, snow disasters, rolling stones and other factors. To predict road blocking events, the limit gradient lifting model (XGBoost), random forest regression model (RF regression) and support-vector regression model (SVR) are used as the prediction meta-models, and then the meta-models are fused by a logical regression algorithm to construct a road blocking loss prediction fusion model based on ensemble learning. The actual road blocking event data are used to train the model. Using the same blocking location and similar blocking loss characteristics between adjacent points to fill in the missing value and conducting one-hot encoding for other short character sets with obvious category characteristics such as letters, numbers, and Chinese characters overcomes the problems of inherent data loss, error and time logic disorder in the blocking event data set. The test results show that the R2 score based on the stacking fusion model reaches 0.91, which is 18% higher than RF and 11% and 5.8% higher than SVR and XGBoost, respectively, and the RMSE and MAE values are 0.1707 and 0.0341, respectively. Therefore, the proposed road blocking data preprocessing method and road blocking loss prediction fusion model can be used to predict the amount of blocking event loss.

1. Introduction

Road blocking events refer to road traffic blocking caused by landslides, debris flow, snow disasters, rolling stones and other factors. Road blocking loss represents the economic losses caused by road blocking events, that is, the loss of RMB/USD. As an important premise of highway accident emergency management, the loss prediction of highway blocking events is conducive for the road traffic management department to make reasonable decisions, carry out the corresponding road dredging work, allocate the optimal guarantee resources and reduce the possible subsequent losses, and help travelers to reasonably plan their own travel routes. At the same time, the prediction results can provide strong support for the loss statistics, follow-up repair measures, engineering construction, finance, audit and other related work.
The prediction of highway blocking loss is mainly based on the logical relationship of blocking events [1,2], time series [3,4], text data statistics, analysis, data mining and prediction [5,6,7]. Nantes et al. proposed real-time traffic state estimation in urban corridors from heterogeneous data [8]. Nanthawichit et al. proposed an application of probe-vehicle data for real-time traffic-state estimation and short-term travel-time prediction on a freeway [9]. At present, there are few relevant studies directly predicting the amount of loss caused by highway traffic blocking, but the research on the prediction of various highway events has achieved good results [10,11]. This includes, for example, the prediction of the short-term traffic flow by the improved K-nearest neighbor (KNN) algorithm of Xie H [12]. Allstr et al. proposed a hybrid approach for short-term traffic state and travel time prediction on highways [13]. Xu et al. proposed a short-term passenger flow prediction method integrating a dynamic factor model and support-vector machine considering space-time correction [14]. Fusco et al. proposed short-term traffic predictions on large urban traffic networks by using applications of network-based machine learning models and dynamic traffic assignment models [15]. Seng [16] et al. used a deep neural network and a regular grid cyclic neural network to capture the spatial dependence of traffic flow prediction and proposed an irregular regional traffic flow prediction model based on a multi-graph convolution network and gated cyclic unit (MGCN-GRU). Hashemi et al. proposed real-time traffic network state estimation and prediction with decision support capabilities for applications to integrated corridor management [17]. Lu [18] et al. proposed a mountain expressway accident severity prediction model integrating a depth inverse residual and attention mechanism, which processes the influencing factors into the form of picture classification. Kampffmeyer et al. proposed semantic segmentation of small objects and modeling of uncertainty in urban remote sensing images using deep convolutional neural networks [19]. However, prediction models based on deep learning [20,21,22] require a lot of training data and high computing power [23], thus resulting in high hardware requirements, large amounts of calculation and complex model design. Yang [24] and others proposed a gradient lifting regression tree (GBRT) traffic accident model based on a time-series relationship. The model predicts the number of traffic accidents, the number of deaths and the number of vehicles involved. Wang [25] et al. used a KNN algorithm as a nonparametric regression method to develop a traffic event duration prediction model. Another investigation studied different distance measures and improved prediction accuracy based on a decision tree [26]. An improved K-nearest neighbor search strategy was proposed to predict traffic conditions. However, the model was based on a single machine learning algorithm [27,28], which is very sensitive to the expression form of data, requires independent features [29], struggles to deal with missing data and is easy to overfit [30]. With the wide application of the ensemble learning algorithm [31,32], Yang et al. and Zhiyuan et al. [33,34] proposed a fully convolutional model based on semantic segmentation technology to research a spatio-temporal ensemble method for large-scale traffic state prediction. They constructed an ensemble framework designed for spatio-temporal data to predict large-scale online taxi-hailing demands, where an attention-based deep ensemble net was designed to enhance prediction accuracy. Guzman [35] proposed a taxonomy for classifying app reviews into categories relevant to software evolution, demonstrating that the ensembles obtained better performance than the individual classifiers. Li et al. [36] used ensemble learning to build a route network segment traffic congestion state recognition model to realize the segment traffic state recognition. Hu et al. [37] realized the prediction of the remaining service life of electric vehicle batteries through the integration of a stacking model. Thomas, Neves, and Solt [38] described a method that builds majority voting ensembles of contrasting machine learning methods and conducts relation extraction for drug-drug interactions using ensemble learning.
To sum up, at present, a large amount of highway blocking event information is recorded in the text, which is difficult to process numerically. Due to the influence of data type and data accuracy, the existing research methods struggle to meet the actual needs in terms of timeliness, prediction accuracy and data mining degree.
The main contributions of this paper are summarized as follows:
(1)
For the missing data in the data set, the missing values are filled in using the same blocking location and similar blocking loss characteristics between adjacent points. For other short character sets with obvious characteristics such as letters, numbers and Chinese characters, one-hot encoding is conducted to overcome the inherent data loss in the blocking event, data set errors and confusion of time logic.
(2)
A prediction model of highway blocking loss based on the ensemble learning fusion model is proposed. Using three performance evaluation criteria, the ensemble learning method we designed is compared with three meta-model algorithms, XGBoost, RF regression and SVR, on a data set, and the performance of each model under different learning rates is compared.
(3)
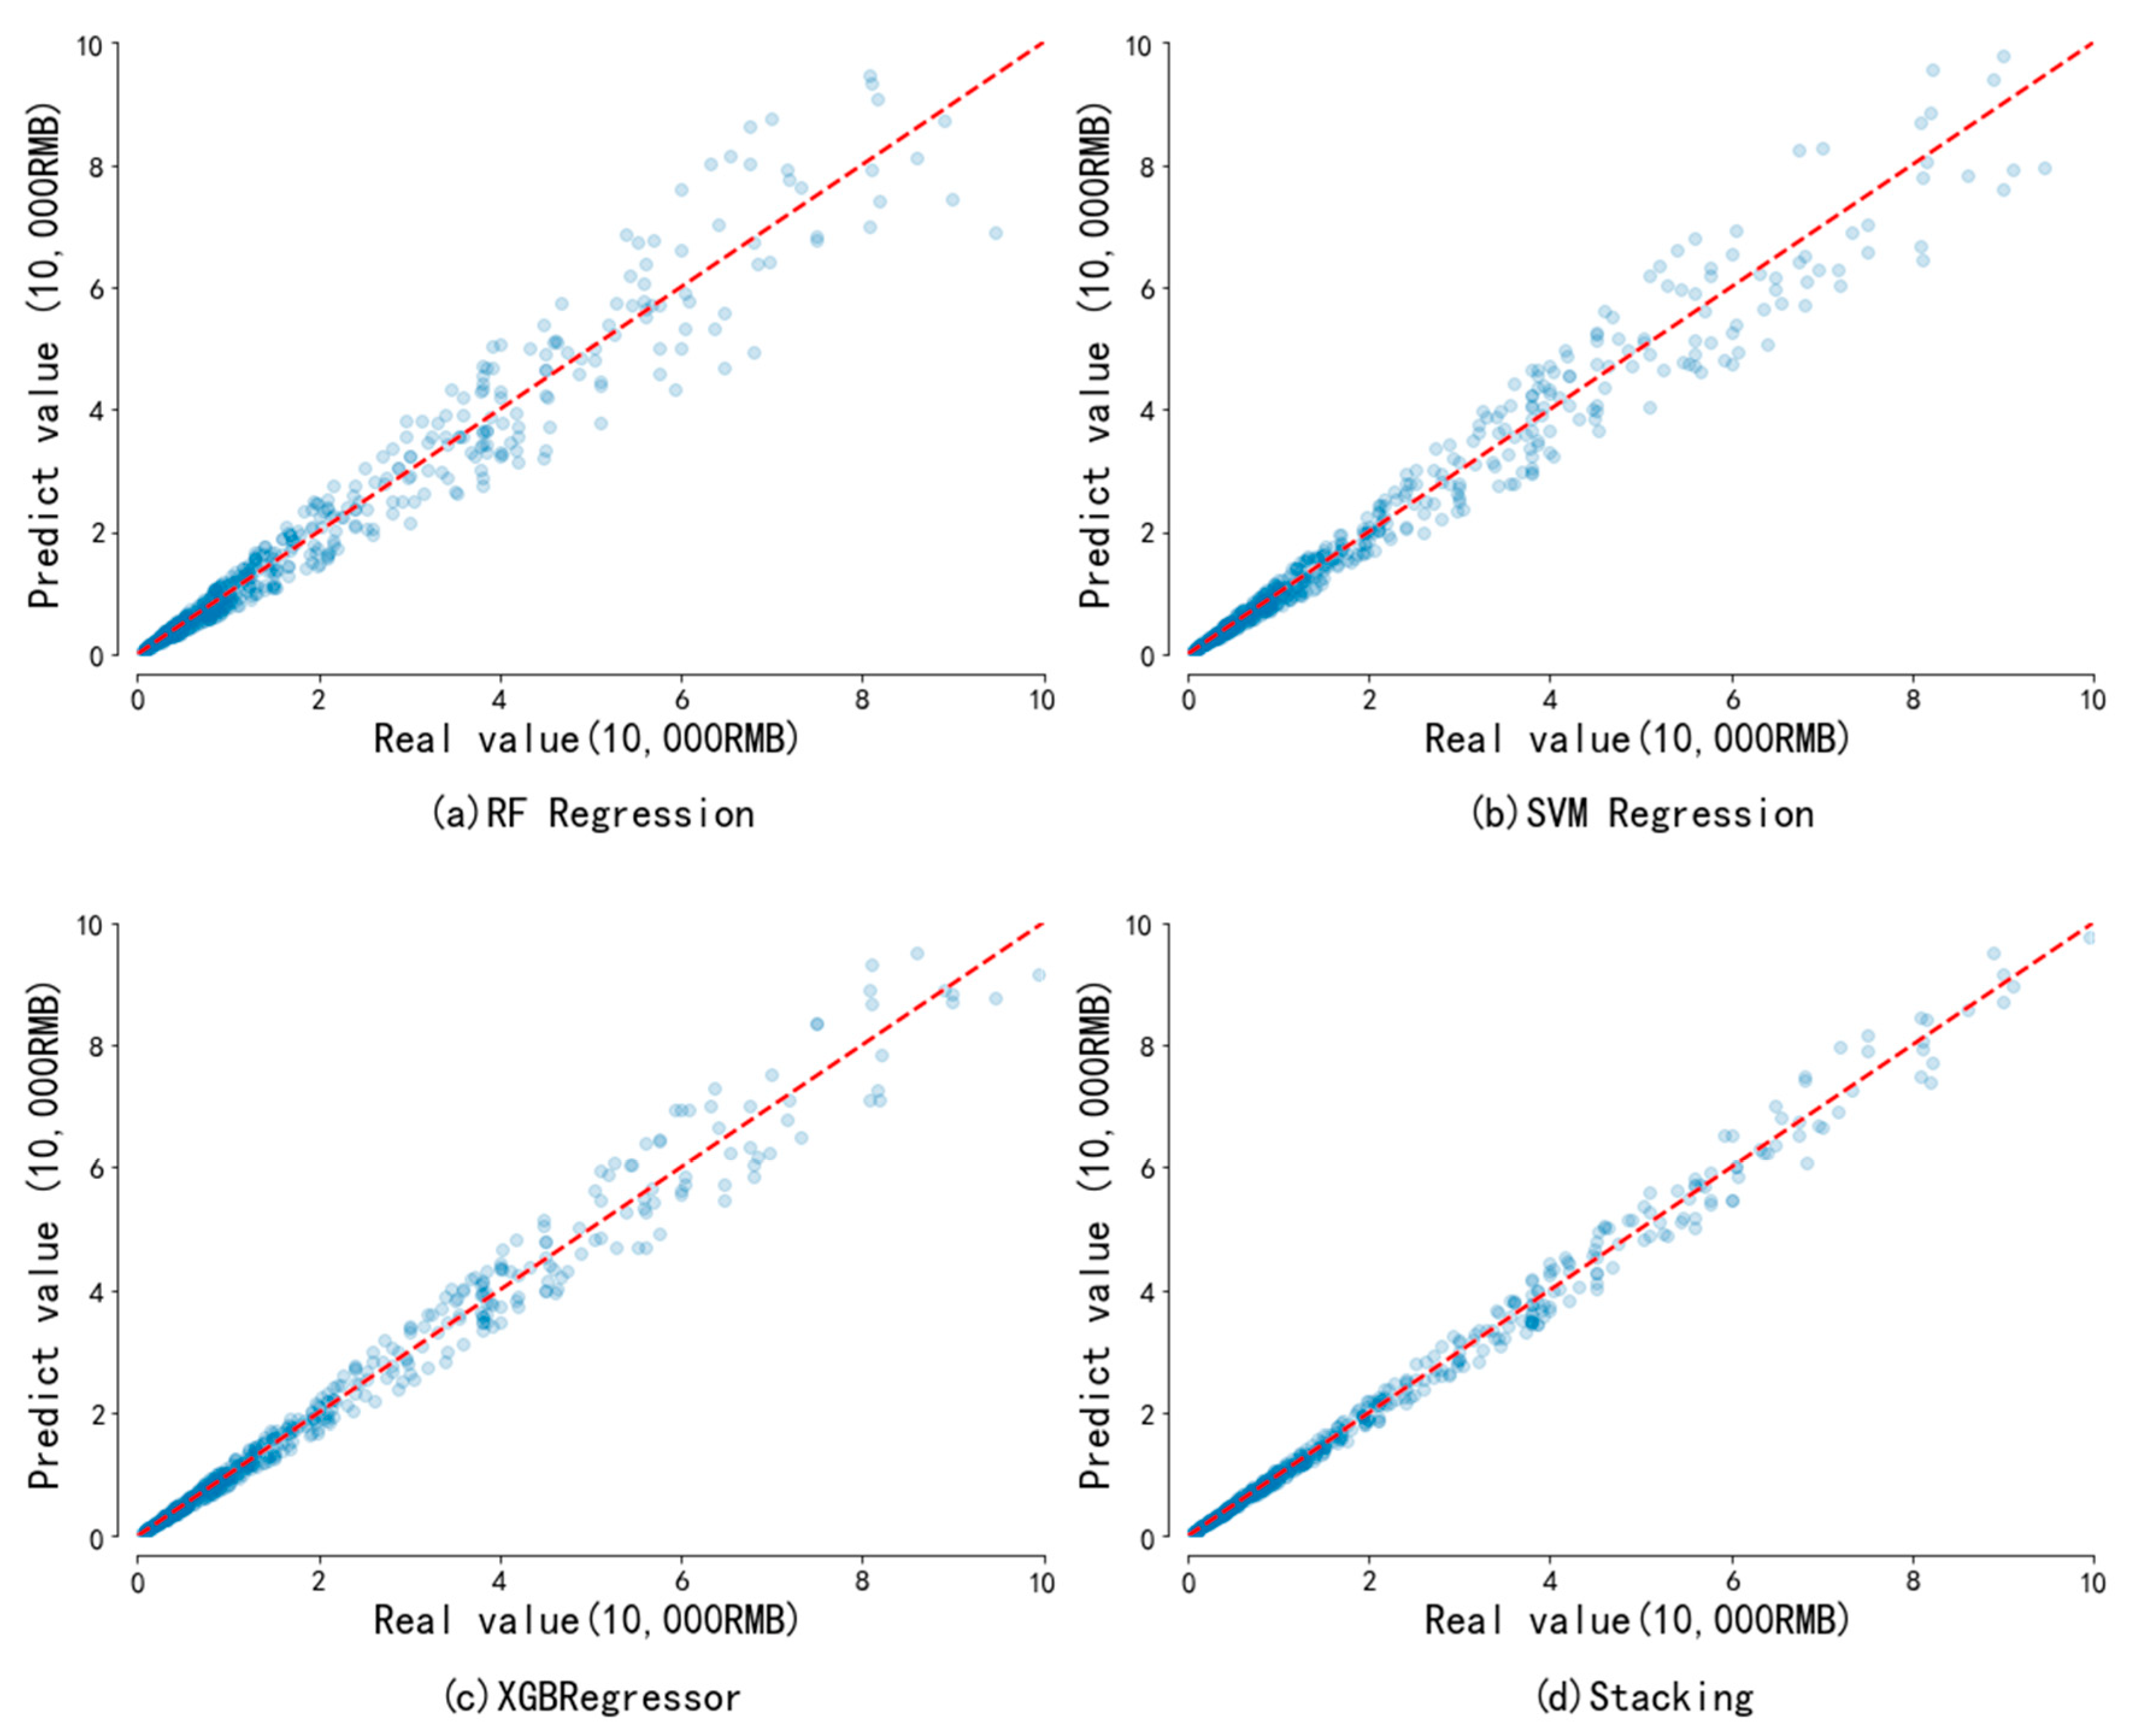
The test set is used to verify the prediction results of the model. The results show that compared with the three meta-models, RF regression, SVR and XGBoost, the R2 value predicted by the stacking fusion model reaches 0.91. The stacking fusion model proposed in this paper has high prediction accuracy, which provides an intelligent prediction method for the loss prediction of highway blocking events.

2. Related Works

2.1. XGBoost

XGBoost is a classical limit gradient lifting algorithm that was proposed by Tianqi Chen and Carlos in 2016 [39]. It is mainly used for classification and regression, and it is a type of iterative tree algorithm. The XGBoost algorithm uses not only the first derivative but also the second derivative, which makes the prediction results more accurate. The regularization term can also prevent overfitting. XGBoost uses parallel optimization to specify the default branch directions for missing values, which greatly improves the efficiency of the algorithm.
XGBoost’s highway blocking loss prediction grows a tree by continuously adding trees and continuously splitting features. Adding a tree each time is equivalent to learning a new function to fit the residual of the last prediction. XGBoost can be expressed as
y ^ i ( t ) = k = 1 t f k ( x i ) = y ^ i ( t 1 ) + f t ( x i )     , f k F
In Equation (1), k is the number of decision trees, F corresponds to the set of all decision trees, and f k is the kth decision tree generated by the kth iteration. The resulting loss function can be expressed by the predicted values y i and y ^ i as L = i = 1 n l ( y i , y ^ i ) , where n is the number of samples. The objective function O is composed of the loss function L and the regular terms Ω for suppressing model complexity, which is defined as
O = i = 1 n l ( y i , y ^ i ) + t = 1 t Ω ( f i )
In Equation (2), i = 1 t Ω ( f i ) is the sum of the complexity for all trees. Adding the sum of the complexity to the objective function as a regularization term prevents the overfitting of the model. Since XGBoost is an algorithm in the boosting family, it follows the previous step-by-step addition. Taking the model in step t as an example, the predicted value of the model for the ith sample x i is
y ^ i ( t ) = y ^ i ( t 1 ) + f t ( x i )
where y ^ i ( t 1 ) is the predicted value given by the XGBoost in step t 1 and f t ( x i ) is the residual value of the new spanning tree to be added this time. Then, we can expand Equation (3) according to the Taylor formula to obtain the objective function
O ( t ) i = 1 n g i f t ( x i ) + 1 2 h i f t 2 ( x i ) + Ω ( f t )
The function of each step can be obtained from Equation (4). Finally, according to the addition model, an overall XGBoost highway blocking loss prediction model is obtained.

2.2. RF Regression

The random forest algorithm is used to establish multiple decision trees and integrate them to obtain a more accurate and stable model. It is a combination of bagging and random selection features. When it is necessary to predict the road blocking loss, one must count the prediction results of each tree in the forest for the sample and then select the final result from these prediction results by the voting method.
The random forest has a faster convergence speed and more efficient operation. It can deal with high-dimensional features without dimensionality reduction. It has a good algorithm to deal with the missing value of highway blocking loss data, which can measure the similarity between blocking event data samples. Based on this similarity, clustering and screening outliers for samples can avoid overfitting calculations to a certain extent.

2.3. SVR

SVR is an application of a support-vector machine, SVM, to a regression problem. SVM is a maximum interval classifier used to solve binary classification problems. It tries to find the hyperplane with the largest interval to distinguish different categories of samples. The purpose of the SVR algorithm is to simulate the regression relationship between input x and result y, which can be expressed as
y = f ( x ) = i = 1 n ω i x i + b
When using SVR for regression tasks, training samples D = ( x 1 , y 1 ) , ( x 2 , y 2 ) , , ( x m , y m ) , ( y i R ) are given. We hope to get a regression model to make f ( x ) as close as possible to y . Here, ω and b are the model parameters to be determined. In SVR, it is assumed that for the sample ( x , y ) , the maximum deviation of ε between f ( x ) and y can be tolerated, which is equivalent to constructing a spacing band with width 2 ε centered on f ( x ) . If the training sample falls into this spacing band, it is considered that the prediction is correct. Thus, the SVR problem can be expressed as
min ω , b 1 2 ω 2 + C i = 1 m l ε ( f ( x i ) y i )
l ε ( z ) = 0 ,       i f z ε z ε ,       o t h e r w i s e
In Equation (7), C is the regularization constant, l ε is the insensitive loss function, and the relaxation variables ξ i and ξ ^ i are introduced, which can be expressed as
min ω , b , ξ i , ξ ^ i 1 2 ω 2 + C i = 1 m ( ξ i + ξ ^ i )
In order to solve the nonlinear regression problem in the prediction of highway blocking loss, the kernel mapping method is introduced. The mapping function Ø is used to map the variable x to the high-dimensional nonlinear space. The kernel function k ( x i , x j ) = Ø ( x i ) T Ø ( x j ) is introduced to avoid calculating the inner product in the same characteristic space, which can transform the nonlinear prediction in the prediction of highway blocking loss into linear prediction. Finally, the SVR linear regression expression can be obtained as follows:
f ( x ) = i = 1 m ( α ^ i α i ) k ( x , x i ) + b

2.4. Prediction Model of Highway Blocking Loss Based on Ensemble Learning

Stacking is a method of combining one learning machine with another individual learning machine by training the learning machine. The basic idea of stacking is firstly using the road blocking data training set to train the primary learning machine, then using the output of the primary learning machine as the input features, and finally using the corresponding original marks as the new marks to form a new data set to train the secondary learning machine. The primary learning machine can use different learning algorithms or the same learning algorithm. In this paper, heterogeneous learning machines are used to construct the stacking highway blocking loss prediction model.
In the training stage of stacking, the primary learning machine needs to generate a new data set. If the real data of the primary learning machine are used to generate a new data set and used to train the secondary learning machine, there will be a high risk of overfitting. Therefore, the original data used to generate the new dataset are excluded from the training samples of the primary learning machine and validated using cross-validation. This paper uses 5-fold cross-validation, which is a method for model training, adjustment and evaluation and can provide an approximate unbiased estimation of the real model error. Firstly, the original data set D is randomly divided into five data sets D1D5, of the same size. Let Dj and D(−j) = D/Dj be the corresponding test set and training set for the jth execution. Given T kinds of learning algorithms, the tth learning algorithm is used to train the primary learning machine h t ( j ) . For each sample x i in the test set, Dj is executed for the jth time, setting z i t as the output result of the learning machine h t ( j ) on x i . At the end of all cross-validation processes, the following new data sets can be generated through T individual learning machines
D = ( z i 1 , , z i T , y i ) i = 1 m
This paper proposes a highway blocking loss prediction model based on ensemble learning, as shown in Figure 1. From Figure 1, the prediction model firstly carries out data collection, data cleaning and preprocessing of highway blocking events, and then divides the obtained data set into a training set and testing set, which are input into the primary learning machine. The primary learning machines are the three different learning algorithms, XGBoost, RF regression and SVR, which will be used to obtain the prediction results for 5-fold cross verification. We then splice the results as the input of the secondary learning machine logistic regression and obtain the final prediction result.

3. Data Preprocessing

3.1. Data Description

The data in this paper come from the original event record data of a provincial highway from 2014 to 2019, including route number, blocking interval, blocking reasons, blocking time, recovery time, emergency repair measures, collapse places, number of landslides and loss amount (10,000 RMB/1459 USD). Some original text data are shown in Table 1.
Among G213 and S101, in the route number, S represents a provincial highway, and G represents a national highway. K183 + 580 represents the length from this stake (the name is “K183 + 580”) to the starting point of the road. The distance from the K183 + 580 stake to the starting point of the road is 183 km + 580 m = 183.58 km. The number of landslides represents the number of landslides and earth rocks cleared in this accident, unit: m3. The loss amount represents the amount of economic loss caused by this blocking event.

3.2. Data Cleaning

Since the data come from the summary of different local staff records, there are many problems, such as missing data and inconsistent formats, that need to be dealt with. Making preliminary statistics on the missing data and the performance is shown in Table 2. Adjacent data have the same blocking location and similar blocking loss characteristics. Therefore, in order to ensure data integrity, the average value before and after the time point of missing data is used to fill in the missing data. Then, we analyze the data, check the consistency, and delete duplicate and invalid values.

3.3. Data Processing

(1)
Route numbers, such as G213, S304 and “Yuanmeng xian”, have obvious characteristics of letters, numbers and Chinese characters. They are short character sets and unstructured languages with noise. After unifying the data format, they are processed by one-hot encoding. It transforms the language used by human communication into machine language that can be understood by machines.
(2)
The characteristics of starting point stake number and ending point stake number have great relevance to the prediction of the loss amount in this paper. Firstly, the stake number can be used as information to determine the exact location of the event, that is, somewhere on the road. In addition, the road mileage affected by an accident can be calculated by combining the starting point and ending point.
(3)
For the interruption time and recovery time, the day of month method is used for timestamp, which will generate a series of hour numbers. The corresponding hour information data (integer from 0 to 23) can be subtracted to obtain the blocking time.
(4)
The text description information of emergency repair measures in the data is very different, but after sorting, it can be divided into three categories: manual processing, mechanical and man-machine cooperation. Therefore, the method of assigning weight is adopted for processing. After assigning weight, it is input with numerical characteristics.
(5)
The place and quantity of landslides caused by the event can be input using the one-hot coding and number of cubic meters, respectively.
(6)
Blocking reason is used to specifically describe the causes of highway blocking events. This feature requires manual classification of data into snow disasters, debris flow, landslides, collapses, rolling stones and other types of disasters. The loss amount (10,000 RMB/1459 USD) is used as the predicted value. All the data samples are preprocessed to obtain the training set.

4. Results and Analysis

The validity of the proposed method is demonstrated by comparing several groups of experiments. Firstly, the prediction of XGBoost, RF regression and SVR are compared and analyzed and then compared with the proposed fusion model.

4.1. Evaluating Indicators

The loss amount prediction model is evaluated by the root-mean-square error (RMSE), mean absolute error (MAE) and R2 score, as shown below.
RMSE = i = 1 n ( y i y ^ i ) 2 n
MAE = i = 1 n y ^ i y i n
R 2 ( y , y ^ ) = 1 i = 0 n 1 ( y i y ^ ) 2 i = 0 n 1 ( y i y ¯ ) 2
RMSE and MAE reflect the average deviation between the predicted loss amount and the real loss amount. The R2 score is the most commonly used index in the evaluation of regression models. The value of R2 is between 0 and 1. When R2 is closer to 1, the better the prediction effect.

4.2. Model Training

When using a machine learning method, parameter adjustment is an important part of the training model. Appropriate penalty parameters for the model λ and γ can effectively prevent overfitting (when λ and γ are too small) and underfitting (when λ and γ are too large). Both overfitting and underfitting mean that the model cannot accurately capture the internal laws of the data, which affects the accuracy of the model.
During the fine-tuning of model parameters, 5 parameters are adjusted, and each parameter is set with at least 4 values. The specific settings of each parameter are shown in Table 3. N-estimators are the number of decision trees in the model, Ref-lambda and Min-split-loss denote regularization parameters, respectively, λ and γ. The subsample indicates the ratio of data used in data subsampling. The learning rate is the step size.

4.3. Experimental Result

During the experiment, the experimental results of the single model and stacking fusion model under different learning rates were recorded, as shown in Table 4 and Table 5. It can be seen from Table 4 and Table 5 that the learning rate ranged from 0.02 to 0.1. The minimum RMSE values of XGBoost, RF regression, SVR, directly weighted models and stacking fusion models are 0.2571, 0.4119, 0.2705, 0.3415 and 0.1707, respectively, and the minimum MAE values are 0.0491, 0.0736, 0.0541, 0.0598 and 0.0341, respectively. The RMSE and MAE values of the stacking fusion model are smaller than other models, and the prediction accuracy is better.
In order to further analyze the prediction effect and overall change trend of the single model and stacking fusion model, the RMSE and MAE of the prediction results of each model under different learning rates are shown in Figure 2.
It can be seen from Figure 2 that when the learning rate increases from 0.02 to 0.1, the RMSE and MAE values of different models increase as a whole, and the RMSE and MAE of the stacking fusion model are lower than that of the single model. When the learning rate is 0.05, the RMSE and MAE values of the XGBoost and stacking fusion models are the smallest, and when the learning rate is 0.03 and 0.06, the RMSE and MAE values of RF regression and SVR are the smallest. The MAE of directly weighted models is the smallest when the learning rate is 0.03, and the RMSE is the smallest when the learning rate is 0.06. Under the best learning rates, the RMSE, MAE and R2 values of each model are shown in Table 6. It can be seen from Table 6 that the RMSE, MAE and R2 values of the stacking fusion model are 0.1707, 0.0341 and 0.91, respectively. The RMSE values of the stacking fusion model were reduced by 0.2412, 0.0998, 0.0864 and 0.1708, respectively, compared with RF, SVR, XGBoost and directly weighted models. For the MAE value, the stacking fusion model is reduced by 0.0395 compared with RF regression and 0.02 compared with SVR. The synthetic evaluation value R2 of the stacking fusion model is 18% higher than RF regression, 11% higher than SVR and 5.8% higher than XGBoost. It can be seen that the prediction results of the stacking fusion model are the best.
Figure 3 shows the comparison between the predicted and real values of the single and the stacking fusion model. The dotted line (y = x) represents the real value, and the scattered point represents the predicted value. The closer the point of the predicted value is to the dotted line, the higher the prediction accuracy is. The scatter distribution in Figure 3a deviates from the dotted line by the largest distance, while the scatter distribution in Figure 3d is closest to the dotted line, indicating that compared with the single models of XGBoost, SVR and RF regression, the proposed stacking fusion model has the highest prediction accuracy, and the predicted amount of blocking event loss is the closest to the actual value.

5. Conclusions and Future Work

In this paper, a highway blocking loss prediction fusion model based on ensemble learning has been proposed and investigated. The actual highway blocking data are used as the training set and testing set. The missing values are filled using the mean value with similar blocking loss characteristics between adjacent points. For the short character sets with obvious category characteristics such as letters, numbers and Chinese characters, one-hot encoding is used to overcome the problems of inherent data loss, error and time logic disorder in the blocking event data set. The XGBoost, RF and SVR algorithms are used as meta-models. The XGBoost is a classical limit gradient lifting algorithm that uses the regularization term to prevent overfitting. RF regression can process high-dimensional features without dimensionality reduction and can well handle missing data of highway blocking loss. SVR can transform the nonlinear prediction into a linear prediction. Considering the characteristics of each meta-model for the prediction of blocking loss data sets, the meta models are fused by logistic regression to obtain a highway blocking loss prediction model based on ensemble learning. The results show that compared with the three meta-models of RF regression, SVR and XGBoost, the R2 value predicted by the stacking fusion model reaches 0.91, which indicates that the proposed intelligent prediction method can be used to predict the loss of highway blocking events.
In fact, because about 95% of the loss amount in the data set is less than 100,000 RMB/14,590 USD, and the other input features of the model, such as blocking location, blocking reason, blocking time, etc., have no definite relationship with the loss amount, the model will have a good performance in the loss prediction of prone small-scale and small-loss-amount blocking events. Therefore, for the blocking events with large losses, the number of data sets will be expanded to enrich the sample characteristics in future research to improve the prediction accuracy.

Author Contributions

This paper was completed by the authors in cooperation. H.G. carried out theoretical research, data analysis, experiment analysis and paper writing. J.Z. (Jing Zhang) and Y.L. provided constructive suggestions, and J.Z. (Jiahong Zhang) revised the paper. All authors have read and agreed to the published version of the manuscript.

Funding

This work was supported by the National Natural Science Foundation of China (62162034) and the general projects of the Yunnan basic research plan (202201AT070189).

Data Availability Statement

Data sharing is not applicable.

Conflicts of Interest

The authors declare no conflict of interest.

References

  1. Li, Y.; Ma, Z.; Pan, Z.; Liu, N.; You, X. Prophet model and Gaussian process regression based on user traffic prediction in wireless networks. Sci. China Inf. Sci. 2020, 63, 207–214. [Google Scholar] [CrossRef]
  2. Hofleitner, A.; Herring, R.; Abbeel, P.; Bayen, A. Learning the Dynamics of Arterial Traffic From Probe Data Using a Dynamic Bayesian Network. Ieee Trans. Intell. Transp. Syst. 2012, 13, 1679–1693. [Google Scholar] [CrossRef]
  3. Sun, J.; Zhang, L. Vehicle actuation based short-term traffic flow prediction model for signalized intersections. J. Cent. South Univ. 2012, 19, 287–298. [Google Scholar] [CrossRef]
  4. Lin, P.; Xia, Y.; Zhou, C. Freeway travel time prediction based on spatial temporal characteristics of road networks. J. South China Univ. Technol. Nat. Sci. Ed. 2021, 49, 1–11. [Google Scholar]
  5. Zhao, S.; Zhang, B. Traffic flow prediction of urban road network based on LSTM-RF model. J. Meas. Sci. Instrum. 2020, 11, 135–142. [Google Scholar]
  6. Tian, Y.; Zhang, K.; Li, J.; Lin, X.; Yang, B. LSTM-based Traffic Flow Prediction with Missing Data. Neurocomputing 2018, 318, 297–305. [Google Scholar] [CrossRef]
  7. Li, Y.; Ren, C.; Zhao, H.; Chen, G. Investigating long-term vehicle speed prediction based on GA-BP algorithms and the road-traffic environment. Sci. China Inf. Sci. 2020, 63, 121–123. [Google Scholar] [CrossRef]
  8. Nantes, A.; Ngoduy, D.; Bhaskar, A.; Miska, M.; Chung, E. Real-time traffic state estimation in urban corridors from heterogeneous data. Transp. Res. Part C Emerg. Technol. 2016, 66, 99–118. [Google Scholar] [CrossRef]
  9. Nanthawichit, C.; Nakatsuji, T.; Suzuki, H. Application of Probe-Vehicle Data for Real-Time Traffic-State Estimation and Short-Term Travel-Time Prediction on a Freeway. Transp. Res. Rec. J. Transp. Res. Board 2003, 1855, 49–59. [Google Scholar] [CrossRef]
  10. Zhang, L.; Alharbe, N.R.; Luo, G.; Yao, Z.; Li, Y. A Hybrid Forecasting Framework Based on Support Vector Regression with a Modified Genetic Algorithm and a Random Forest for Traffic Flow Prediction. Tsinghua Sci. Technol. 2018, 23, 479–492. [Google Scholar] [CrossRef]
  11. Li, Y.; Liu, G.; Cheng, Y.; Wu, J.; Xiong, Y.; Ma, R.; Wang, Y. Application of Artificial Intelligence Technology in Traffic Flow Forecast. J. Phys. Conf. Ser. 2021, 1852, 022076. [Google Scholar] [CrossRef]
  12. Xi, H.; Dai, X.; Qi, Y. Improved k-nearest neighbor algorithm for short-term traffic flow forecasting. J. Transp. Eng. 2014, 14, 87–94. [Google Scholar]
  13. Allström, A.; Ekström, J.; Gundlegård, D.; Ringdahl, R.; Rydergren, C.; Bayen, A.M.; Patire, A.D. Hybrid Approach for Short-Term Traffic State and Travel Time Prediction on Highways. Transp. Res. Rec. J. Transp. Res. Board 2016, 2554, 60–68. [Google Scholar] [CrossRef] [Green Version]
  14. Xin-yue, X.U.; Yu-hang, W.U.; Ying-nan, Z.H.A.N.G.; Xue-qin, W.A.N.G.; Jun, L.I.U. Short-term passenger flow forecasting method of rail transit under station closure considering spatio-temporal modification. J. Transp. Eng. 2021, 21, 251–264. [Google Scholar]
  15. Fusco, G.; Colombaroni, C.; Comelli, L.; Isaenko, N. Short-term traffic predictions on large urban traffic networks: Applications of network-based machine learning models and dynamic traffic assignment models. In Proceedings of the 2015 International Conference on Models and Technologies for Intelligent Transportation Systems (MT-ITS), Budapest, Hungary, 3–5 June 2015. [Google Scholar]
  16. Seng, D.; Lv, F.; Liang, Z.; Shi, X.; Fang, Q. Forecasting traffic flows in irregular regions with multi-graph convolutional network and gated recurrent unit. Front. Inf. Technol. Electron. Eng. 2021, 22, 1179–1193. [Google Scholar] [CrossRef]
  17. Hashemi, H.; Abdelghany, K.F. Real-time traffic network state estimation and prediction with decision support capabilities: Application to integrated corridor management. Transp. Res. Part C 2016, 73, 128–146. [Google Scholar] [CrossRef]
  18. Pu, L.Y.U.; Qiang, B.A.I.; Lin, C.H.E.N. A model predicting the severity of accidents on mountainous expressways based on inverted residuals and attention mechanisms. Chin. J. Highw. 2021, 34, 205–213. [Google Scholar]
  19. Kampffmeyer, M.; Salberg, A.B.; Jenssen, R. Semantic Segmentation of Small Objects and Modeling of Uncertainty in Urban Remote Sensing Images Using Deep Convolutional Neural Networks. In Proceedings of the IEEE Conference on Computer Vision and Pattern Recognition (CVPR) Workshops, Las Vegas, NV, USA, 26 June–1 July 2016. [Google Scholar]
  20. Zhao, H.; Li, X.; Cheng, H.; Zhang, J.; Wang, Q.; Zhu, H. Deep Learning-Based Prediction of Traffic Accidents Risk for Internet of Vehicles. China Commun. 2022, 19, 214–224. [Google Scholar] [CrossRef]
  21. Jiang, W.; Zhang, L. Geospatial Data to Images: A Deep-Learning Framework for Traffic Forecasting. Tsinghua Sci. Technol. 2019, 24, 52–64. [Google Scholar] [CrossRef]
  22. Luo, H.; Cai, J.; Zhang, K.; Xie, R.; Zheng, L. A multi-task deep learning model for short-term taxi demand forecasting considering spatiotemporal dependences. J. Traffic Transp. Eng. Engl. Ed. 2021, 8, 83–94. [Google Scholar] [CrossRef]
  23. Ioffe, S.; Szegedy, C. Batch Normalization: Accelerating Deep Network Training by Reducing Internal Covariate Shift. Int. Conf. Mach. Learn. 2015, 37, 448–456. [Google Scholar]
  24. Yang, W.; Zhang, Z.; Wushouer, S.; Wen, J.; Fu, Y.; Wang, L.; Wang, T. GBRT traffic accident prediction model based on time series relationship. J. Univ. Electron. Sci. Technol. 2020, 49, 615–621. [Google Scholar]
  25. Wang, S.; Li, R.; Guo, M. Application of nonparametric regression in predicting traffic incident duration. Transport 2015, 33, 22–31. [Google Scholar] [CrossRef]
  26. Oh, S.; Byon, Y.J.; Yeo, H. Improvement of Search Strategy With K-Nearest Neighbors Approach for Traffic State Prediction. Ieee Trans. Intell. Transp. Syst. 2016, 17, 1146–1156. [Google Scholar] [CrossRef]
  27. Li, Y.; Chen, M.; Lu, X.; Zhao, W. Research on optimized GA-SVM vehicle speed prediction model based on driver-vehicle-road-traffic system. Sci. China Technol. Sci. 2018, 61, 782–790. [Google Scholar] [CrossRef]
  28. Li, R.; Huang, Y.; Wang, J. Long-term Traffic Volume Prediction Based on K-means Gaussian Interval Type-2 Fuzzy Sets. IEEE/CAA J. Autom. Sin. 2019, 6, 1344–1351. [Google Scholar] [CrossRef]
  29. Nabian, M.A.; Meidani, H. Deep Learning for Accelerated Seismic Reliability Analysis of Transportation Networks. Comput. Aided Civ. Infrastruct. Eng. 2018, 33, 443–458. [Google Scholar] [CrossRef] [Green Version]
  30. Singh, S.; Hoiem, D.; Forsyth, D. Swapout: Learning an ensemble of deep architectures. Adv. Neural Inf. Process. Syst. 2016, 29, 28–36. [Google Scholar]
  31. Dietterich, T.G. Ensemble Methods in Machine Learning. proc international workshgp on multiple classifier systems. In International Workshop on Multiple Classifier Systems; Springer: Berlin/Heidelberg, Germany, 2000. [Google Scholar]
  32. Kingma, D.P.; Ba, J. Adam: A Method for Stochastic Optimization. Comput. Sci. 2014. [Google Scholar] [CrossRef]
  33. Liu, Y.; Liu, Z.; Vu, H.L.; Lyu, C. A spatio-temporal ensemble method for largescale traffic state prediction. Comput. Aided Civ. Inf. 2020, 35, 26–44. [Google Scholar] [CrossRef]
  34. Liu, Y.; Liu, Z.; Lyu, C.; Ye, J. Attention-Based Deep Ensemble Net for Large-Scale Online Taxi-Hailing Demand Prediction. Ieee Trans. Intell. Transp. Syst. 2020, 21, 4798–4807. [Google Scholar] [CrossRef]
  35. Guzman, E.; EL-haliby, M.; Bruegge, B. Ensemble Methods for App Review Classification: An Approach for Software Evolution (N). In Proceedings of the IEEE/ACM International Conference on Automated Software Engineering, Lincoln, NE, USA, 9–13 November 2015. [Google Scholar]
  36. Li, G.; Guo, M.; Luo, Y. Traffic congestion identification of air route network segment based on ensemble learning algorithms. Transp. Syst. Eng. Inf. 2020, 20, 166–173. [Google Scholar]
  37. Hu, J.; He, C.; Zhu, X.-l.; Yang, G.-y. Prediction remaining useful life of electric vehicle battery based on real vehicle data. Transp. Syst. Eng. Inf. 2022, 22, 292–300. [Google Scholar]
  38. Thomas, P.; Neves, M.; Solt, I.; Tikk, D.; Leser, U. Relation extraction for drug-drug interactions using ensemble learning. Training 2011, 4, 402–425. [Google Scholar]
  39. Chen, T.; Guestrin, C. XGBoost: A Scalable Tree Boosting System. In Proceedings of the 22nd ACM SIGKDD International Conference on Knowledge Discovery and Data Mining, San Francisco, CA, USA, 13–17 August 2016; pp. 785–794. [Google Scholar]
Figure 1. Diagram of the proposed highway blocking loss prediction model.
Electronics 11 02792 g001
Figure 2. (a) Root-mean-square error of each model under different learning rates; (b) average absolute error of each model under different learning rates.
Electronics 11 02792 g002aElectronics 11 02792 g002b
Figure 3. Comparison between predicted and real values for different models.
Electronics 11 02792 g003
Table 1. Original data of partial blocking events.
Route NumberStarting Point StakeEnding Point StakeBlocking ReasonBlocking TimeRecovery TimeEmergency Repair MeasuresNumber of
Collapse Sites
Number of LandslidesLoss Amount
S101K183 + 580K183 + 640Slope collapse24 June 2014 10:0024 June 2014 16:001140.00.16
S237K139 + 287K139 + 307Debris flow6 April 2016 4:306 April 2016 9:30314000.32
G213K148 + 758K158 + 758Snowstorm8 February 2018 15:409 February 2018 20:103183,96583.97
Table 2. Missing data statistics.
FeaturesMissing ValuesPercent of Total Values (%)
Stop station1043.3
Blocking reason341.1
State and city280.9
County (township)270.9
Table 3. Model parameters.
ParameterExplanationDistribution
N-estimatorsNumber of trees[50, 1050]
Ref-lambdaΛ[0, 10]
Min-split-lossΓ[0, 1]
SubsampleSubsample ratio[0.3, 1]
Learning-rateStep size shrinkage[0.02, 0.1]
Table 4. Root-mean-square error of each model under different learning rates.
Learning RateRMSE
XGBoostRFSVRDirectly Weighted ModelsStacking
0.020.29350.47450.37530.38110.2796
0.030.28650.41190.35890.35240.2681
0.040.27840.45550.31240.34880.1809
0.050.25710.47620.29310.34210.1707
0.060.28220.47180.27050.34150.2136
0.070.33910.48210.29790.37300.2479
0.080.35220.49360.37940.40840.2874
0.090.33450.51480.42110.42350.3115
0.100.46650.56820.47780.50420.3452
Table 5. Average absolute error of each model under different learning rates.
Learning RateMAE
XGBoostRFSVRDirectly Weighted ModelsStacking
0.020.05070.07490.05550.06040.0355
0.030.05130.07360.05440.05980.0443
0.040.04940.07910.05510.06120.0471
0.050.04910.09110.05770.06600.0341
0.060.05210.08460.05410.06360.0361
0.070.06170.08770.06020.06990.0576
0.080.05510.08790.06710.07000.0554
0.090.05730.08820.08140.07560.0617
0.100.07730.09760.09420.08970.0665
Table 6. Comparison of the prediction results for the single and stacking model.
MethodRMSEMAER2
XGBoost0.25710.04910.86
RF0.41190.07360.77
SVR0.27050.05410.82
Directly weights models0.34150.05980.82
Stacking0.17070.03410.91
Publisher’s Note: MDPI stays neutral with regard to jurisdictional claims in published maps and institutional affiliations.

