1. Introduction
As a new type of intelligent material [
1], piezoelectric actuators (PEAs) have been widely used in high-precision manufacturing fields [
2] such as aerospace, electronic communication, and intelligent medical engineering. The piezoelectric actuator is made out of the converse piezoelectric effect [
3] of piezoelectric materials, which possesses advantages of high precision, low power consumption, fast responses, and high-resolution results. In recent years, with the continuous emergence of high-tech, higher positioning accuracies are increasingly required with respect to piezoelectric materials. On the other hand, the inherent hysteresis nonlinearity of PEA severely affects positioning precision and limits the development of piezoelectric materials in some fields. In particular, the application of PEA in the field of active vibration control is mainly aimed at low-frequency signals under 100 Hz. And when PEA is used for active vibration control, the control accuracy is easily affected by noise points brought by the external environment, which leads to vibration controls possessing higher precision requirements for hysteresis nonlinear modeling, but traditional modeling methods cannot meet the requirements. Therefore, overcoming the influence of noise points in active vibration control and establishing an accurate model of PEA are significant areas of research.
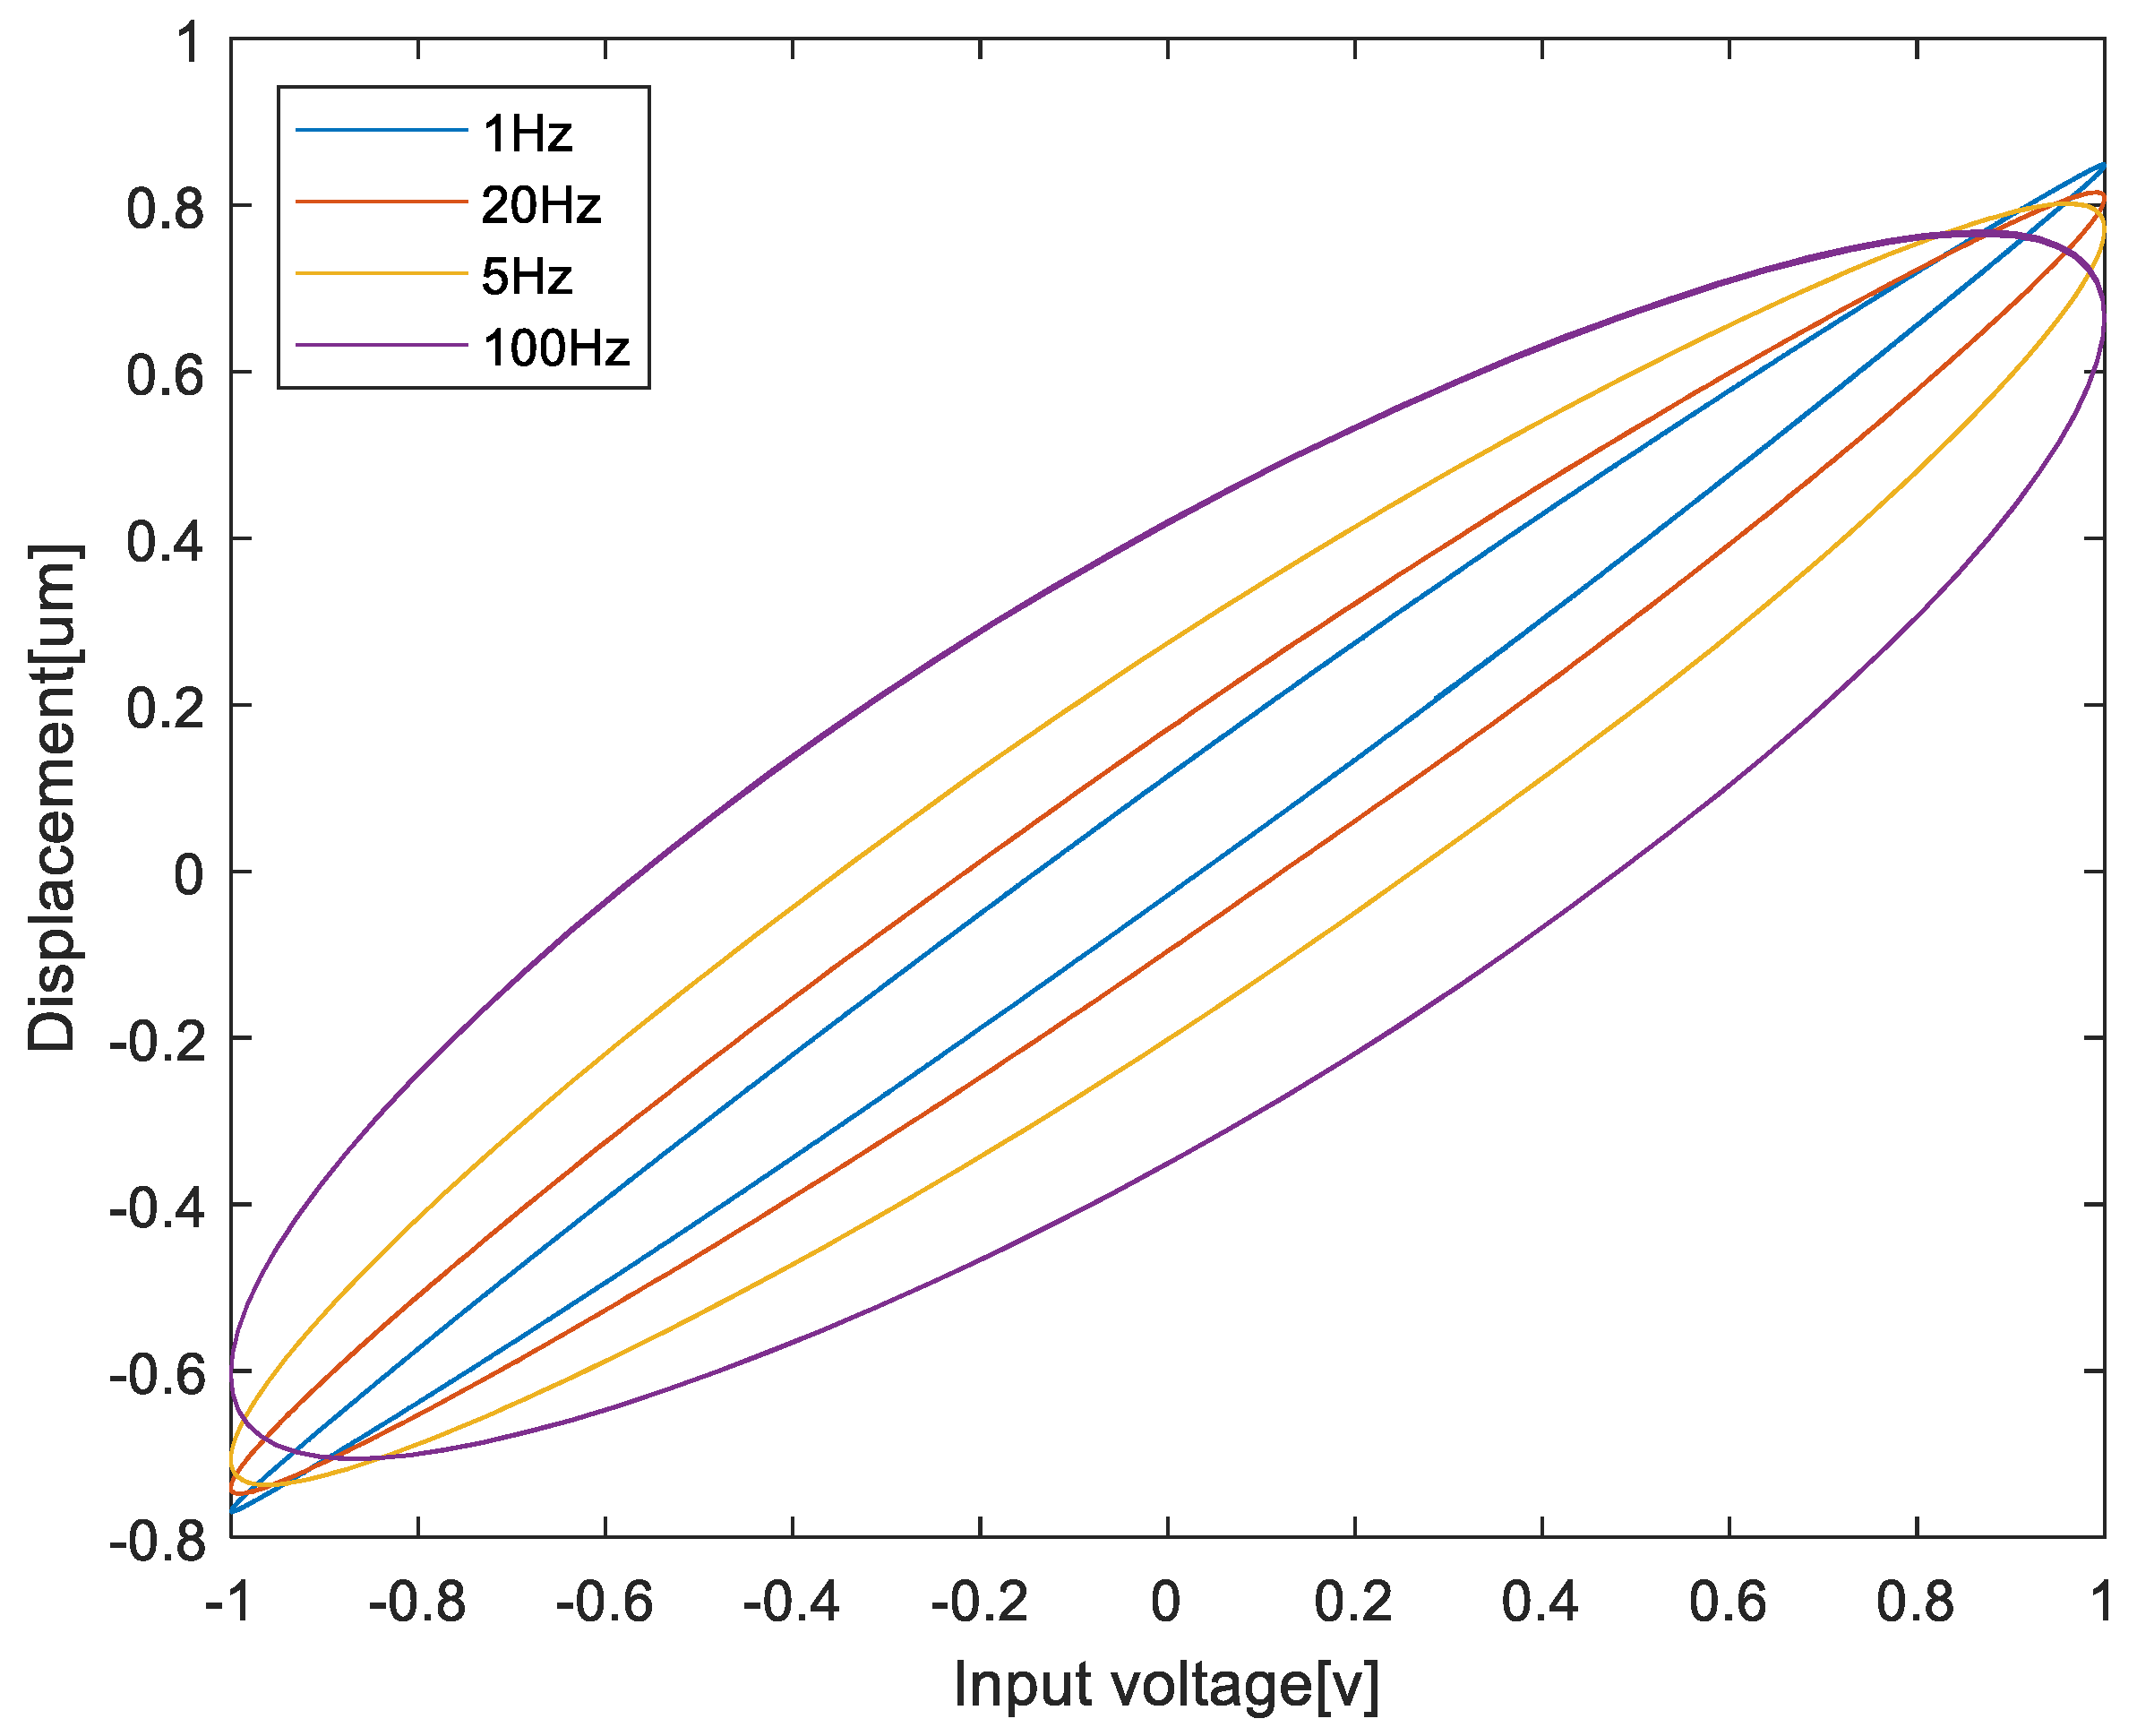
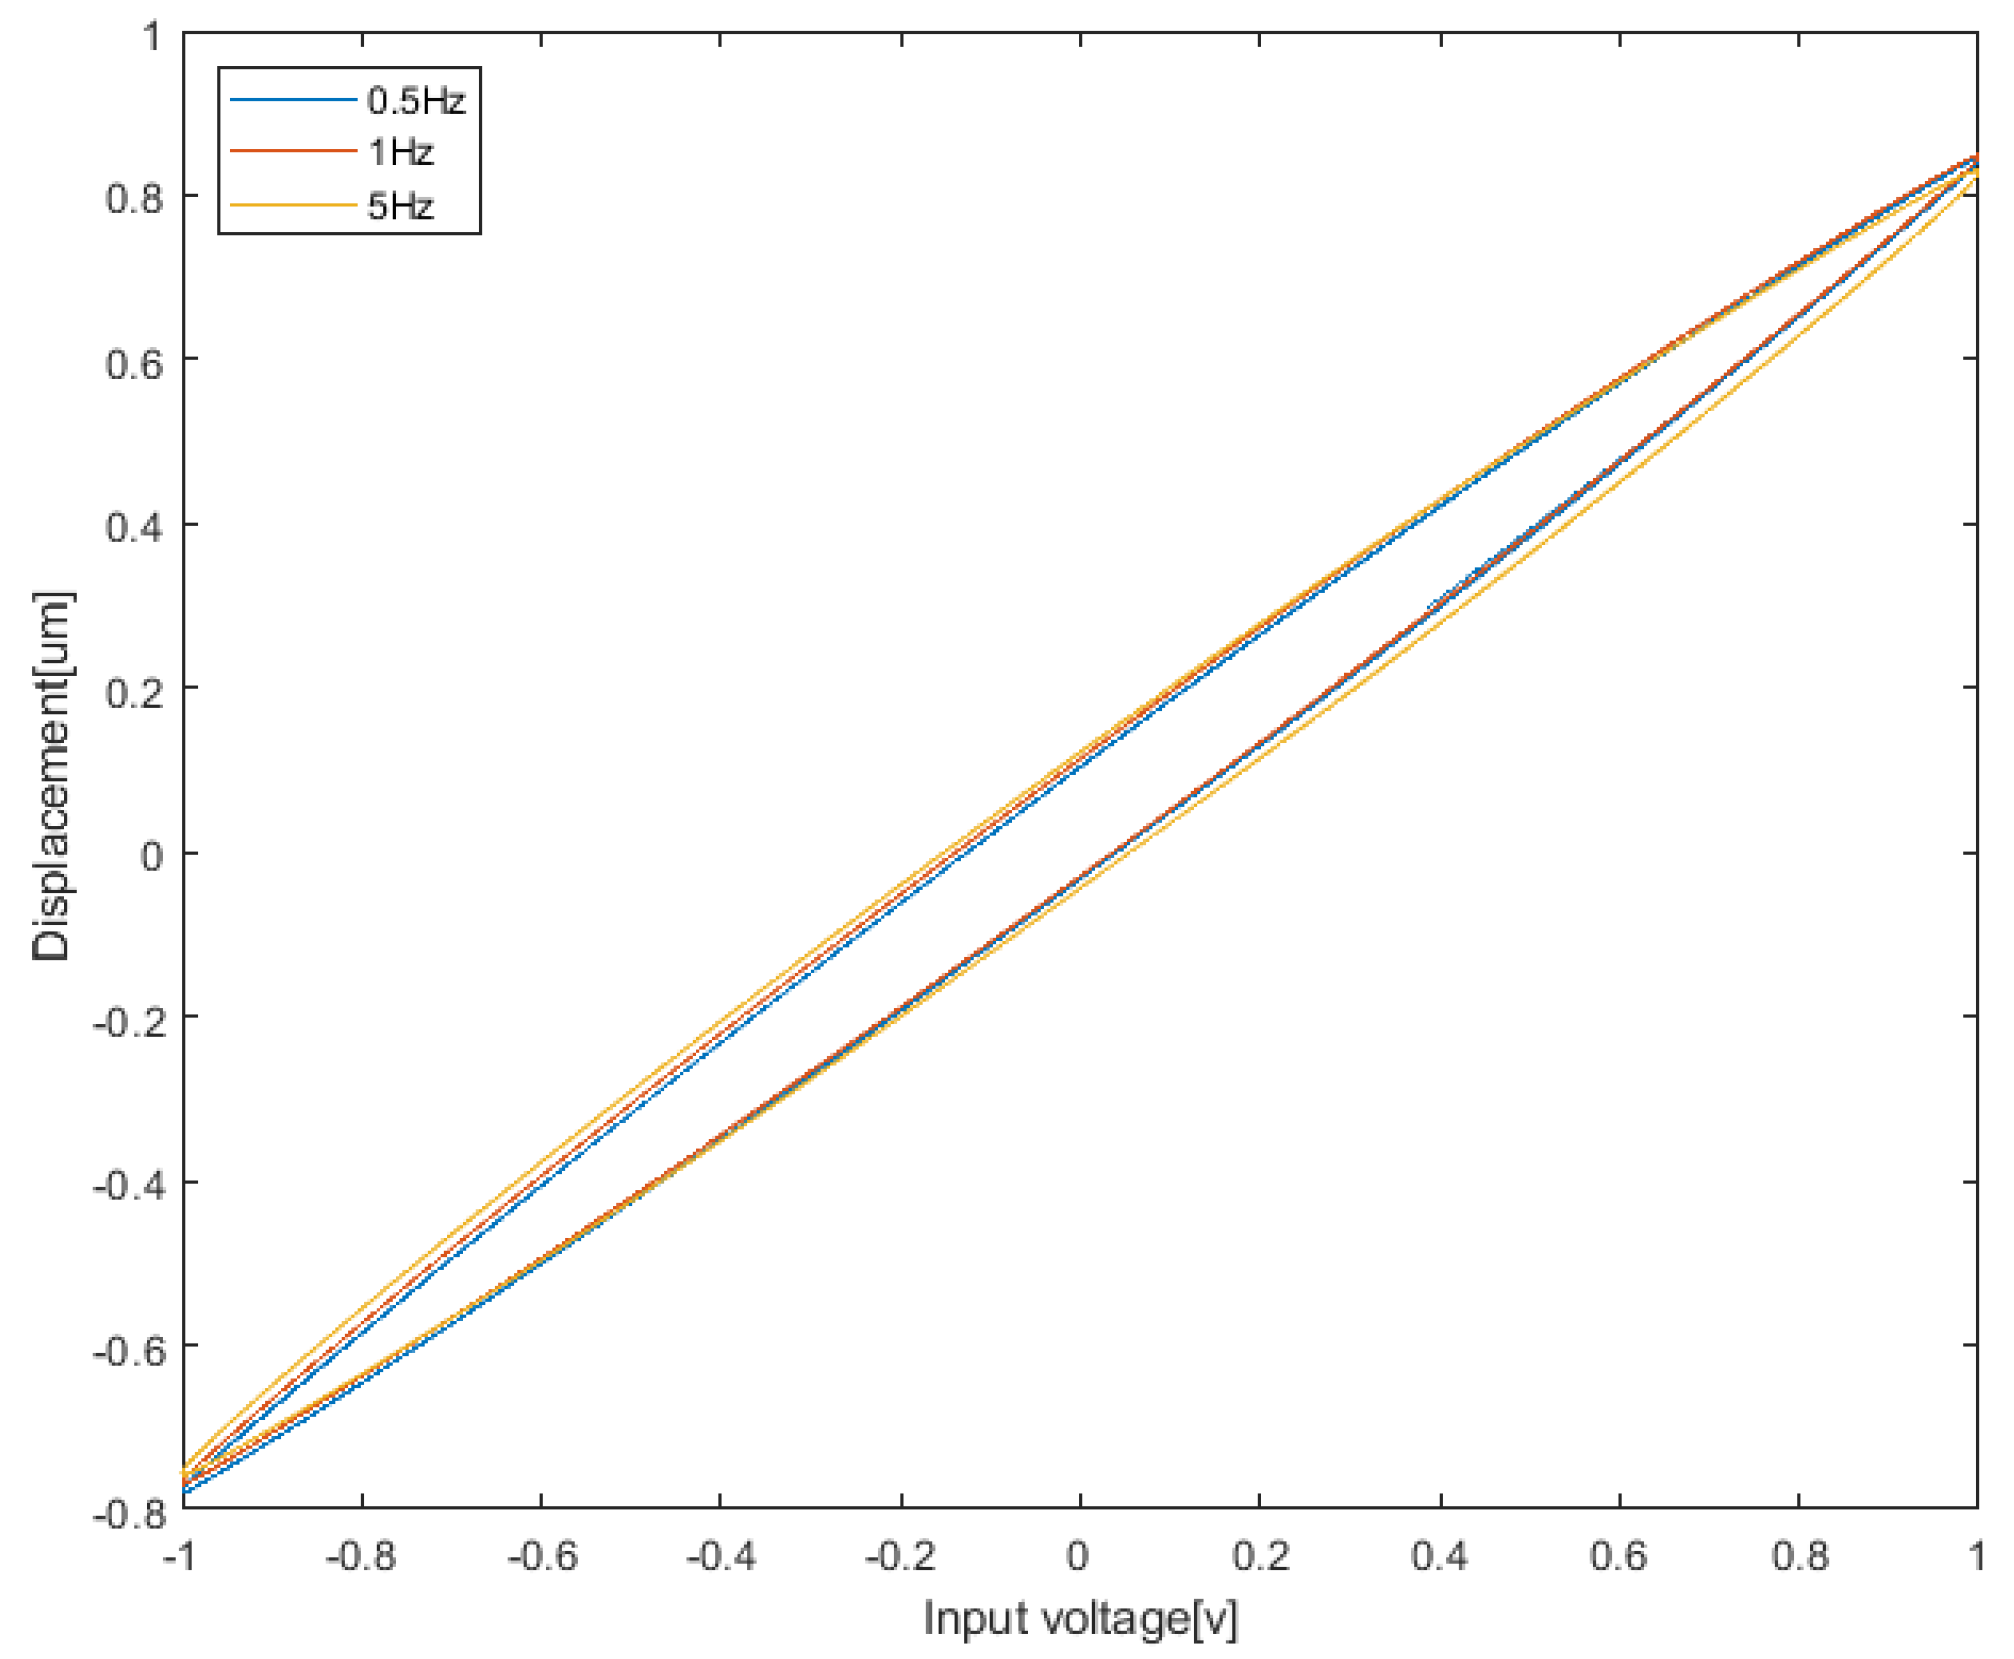
The hysteresis nonlinearity of PEA comprise very complex nonlinearities, which usually manifest as rate dependence and multi-valued mapping [
4], as shown in
Figure 1. From the figure, we can observe that when sine signals with the same voltage and different frequencies are applied to the PEA, its hysteresis model will change with the frequency. Currently, some scholars have conducted substantial research on the hysteresis nonlinear modeling of PEA, and mainstream modeling approaches can be classified into three types. The first one is a physical model based on the physical characteristics of piezoelectric materials, such as the Bouc–Wen model [
5] and Duhem model [
6]. This model is a “white-box” model based on actual physical phenomena and physical laws; thus, the model relies too much on specific physical laws and is not practical. The second type of model comprises phenomenological models based on input and output data, for instance, the Preisach model [
7] and the Prandtl–Ishlinskii model [
8]. This model is a “black box” model of a system based on the actual input and output data; thus, this type of system is not limited by physical characteristics. The last type of model comprises intelligent models based on various intelligent algorithms, such as the T-S fuzzy model [
9]. For this type of model, intelligent algorithms are used to train the model in order to meet constraints and obtain an accurate model of the system.
The T-S fuzzy model is diffusely used in system modeling, predictive control [
10,
11], and other fields because of its simple structure and its capacity to approach complex nonlinear systems [
12] with arbitrary accuraiesy. In order to identify the T-S fuzzy model, a series of identification algorithms have been proposed, such as the improved Gustafson–Kessel clustering algorithm [
13] and the subtractive clustering algorithm [
14] based on the fuzzy C-means (FCM) clustering algorithm [
15]. These clustering algorithms are hyperspherical clustering algorithms based on Euclidean distances. Then, Hathaway introduced the FCRM algorithm for the first time [
16], which is a type of hyperplane clustering algorithm. It overcomes a problem in which traditional clustering methods cannot approximate regression models well. Currently, many scholars improved FCRM, and examples include probability c regression clustering [
17], robust c regression clustering [
18], hyperplane clustering [
19,
20], interval type-2 regression clustering [
21,
22], and robust probability c regression clustering [
23,
24]. The purpose of these methods is to increase the model’s precision. In order to solve the hysteresis nonlinear modeling problem of PEA, some methods are proposed, such as TS fuzzy modeling based on extended space [
25] and adaptive fuzzy modeling [
26]. However, the above methods either have problems related to sensitivities with respect to noisy data or they still use the traditional hypersphere membership function [
27]. To summarize, in order to solve the above problems and establish an accurate hysteresis nonlinear model of PEA, the research contents and innovations of this paper are as follows:
A new clustering algorithm is proposed to identify the antecedents of the fuzzy model, which can effectively avoid the influence of noise points generated by the external environment during data acquisition.
On the basis of the hyperplane membership function proposed by Li, a new hyperplane membership function is introduced to ensure an effective connection between fuzzy antecedents and fuzzy consequent.
The proposed method is used to establish the T-S fuzzy model of PEA hysteresis nonlinearity. Moreover, experimental data illustrate that the improved model can better approximate the PEA hysteresis’ nonlinearity than compared to the T-S fuzzy model established by FCRM and PCRM.
The paper is organized as follows:
Section 2 mainly introduces the T-S fuzzy model of PEA.
Section 3 proposes the modified T-S fuzzy model identification method, including the proposed clustering algorithm, the introduction of a new hyperplane-shaped membership function, and the parameter identification of fuzzy consequents.
Section 4 mainly introduces the experimental design and discussion and verifies the effectiveness of the modified model by comparing several different models.
2. T-S Fuzzy Model of PEA
In this section, a three-input single-output fuzzy system is established for the nonlinear modeling of PEA. The system consists of several IF-THEN rules, each of which represents a linear subsystem. Rule i can be represented by the following set of IF-THEN rules.
is the input data of T-S fuzzy model.
is denoted as fuzzy sets, and c represents the number of fuzzy rules.
is the fuzzy consequent parameter.
is the output of the subsystem. The output of the T-S fuzzy system is the weighted average output of each subsystem.
represents the weight of rule i, calculated from the following expression.
is the membership function, and usually takes the minimizing operation.
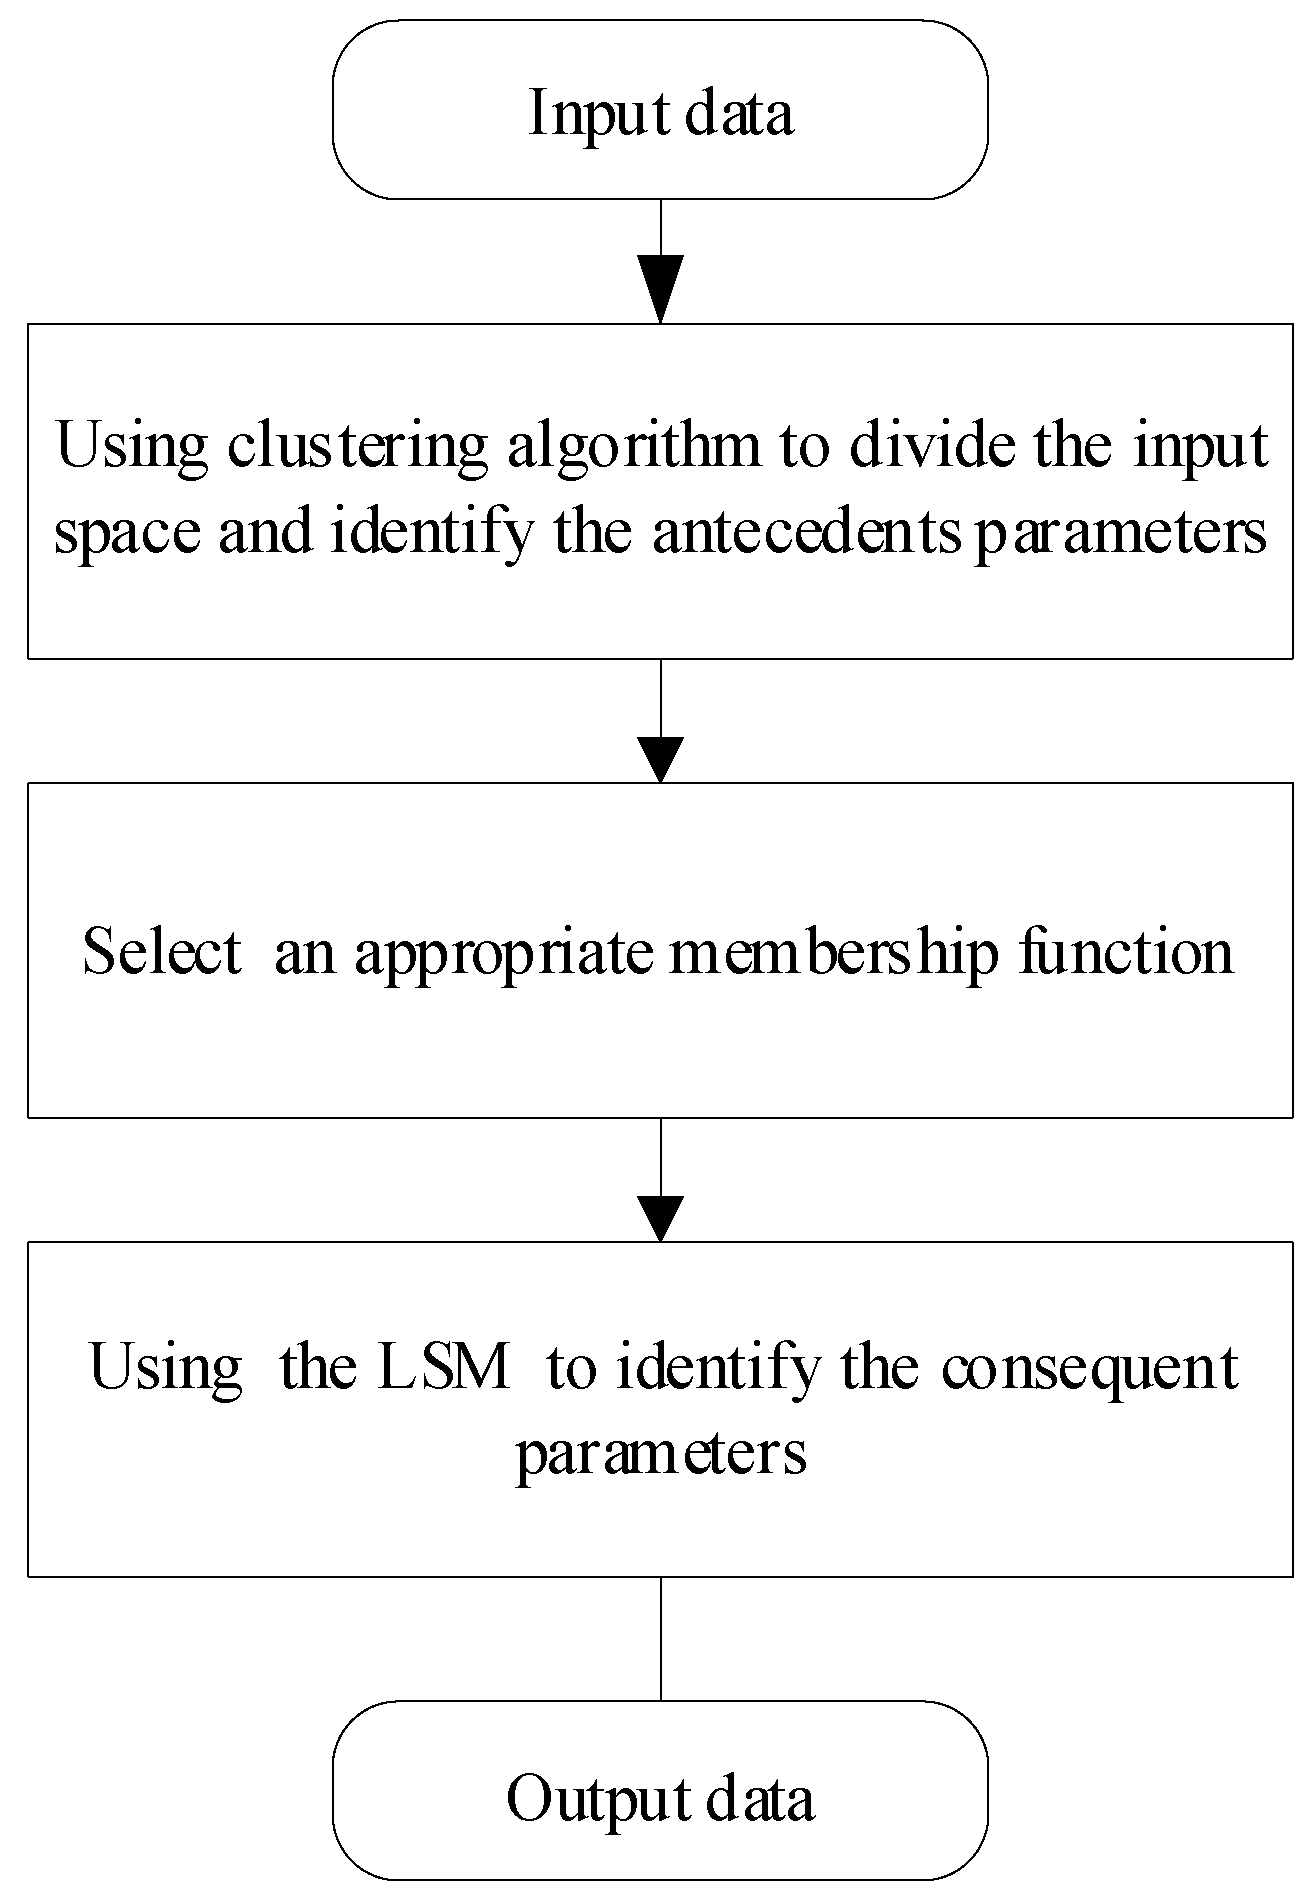
The modeling process of the T-S fuzzy model roughly divided into the following steps: identify the antecedents of the fuzzy model, select the membership function, and identify the consequent parameters of fuzzy model. Fuzzy antecedent identification is realized by clustering algorithms, such as FCRM. The connection between the antecedents and consequents of the fuzzy model requires the selection of an appropriate membership function, such as the commonly used Gaussian membership function. The identification of fuzzy consequent parameters is based on the least squares method (LSM). The detailed steps are shown in
Figure 2.
3. Identification of the T-S Fuzzy Model
This section provides a specific identification method for the T-S fuzzy model. In
Section 3.1, a modified clustering algorithm is proposed to solve the problem in which traditional clustering is sensitive to noisy data. In
Section 3.2, a new hyperplane-shaped membership function is introduced to solve the problem in which the Gaussian membership function does not match the hyperplane clustering algorithm. In
Section 3.3, the LSM is used to identify the consequent parameters so as to establish a precise hysteresis nonlinear model.
3.1. Fuzzy Antecedent Identification
Consider the fuzzy system in
Section 2, where the output of rule i can be described as follows.
,
indicates the parameter to be identified. The objective function of PCRM is described as follows.
The fuzzy weighted exponent is
, usually m = 2.
is the membership function.
is the element of fuzzy partition matrix U,
.
In order to overcome the noise sensitivity problem and further improve modeling accuracies, we propose a modified objective function that is founded on the objective function of the PCRM algorithm.
is the distance from the jth data to the ith hyperplane, which is denoted by the following.
represents the membership degree of the noise point, which can effectively reduce the influence of noise points on the objective function.
is the parameter to be identified in the regression model, which can be solved by the weighted least squares method:
is the input data for the system. is the diagonal matrix composed of the ith row of the membership function. is the output data of the system.
By introducing a Lagrange operator to minimize (8), the iterative formula of
can be obtained as follows.
can also be written as follows.
Set
; it is an improved version of harmonic mean distances. Thus, we can obtain the following.
In summary, the specific algorithm relative to modified regression clustering is as follows:
The number of initial clustering models c, fuzzy weighted index m, and iteration termination threshold : Generate initial membership matrix . Set the iteration counter as r = 1.
According to Equation (10), calculate .
According to Equation (9), calculate .
According to Equation (6), calculate .
Update U iteratively according to Formula (12).
Compare the values of and , if ; then, the iteration terminates. Otherwise, r = r + 1; jump to 2.
3.2. Selection of Membership Function
A membership function is a node connecting the fuzzy antecedent and fuzzy consequent, which plays a significant role in the fuzzy identification process. The Gaussian membership degree has been widely used in fuzzy identifications and can be expressed by the following formula.
is used to determine the center of the curve, and
is used to confirm the curve width. It can be solved by the following expression.
However, the traditional membership function belongs to the hypersphere membership function, as shown in Equation (12), which does not match the above hyperplane clustering algorithm. Aiming at the clustering method in
Section 3.1, a hyperplane membership function is proposed as follows.
is a constant that adjusts the membership function.
is restricted by the output data; thus, the membership function is easily affected by the measured data in practice. In order to solve this problem, the following distance formula is introduced to solve
in the membership function.
3.3. Identification of Fuzzy Consequent Parameters
The LSM is applied to identify fuzzy posterior parameters, and the output of the model can be observed in
Section 2.
By setting
, we can obtain the following.
Insert the input and output data into (17), and we can obtain the following.
Y is the actual output of the system,
, P is the consequent parameter of the system to be identified,
. Using the least squares method, we obtain the following.
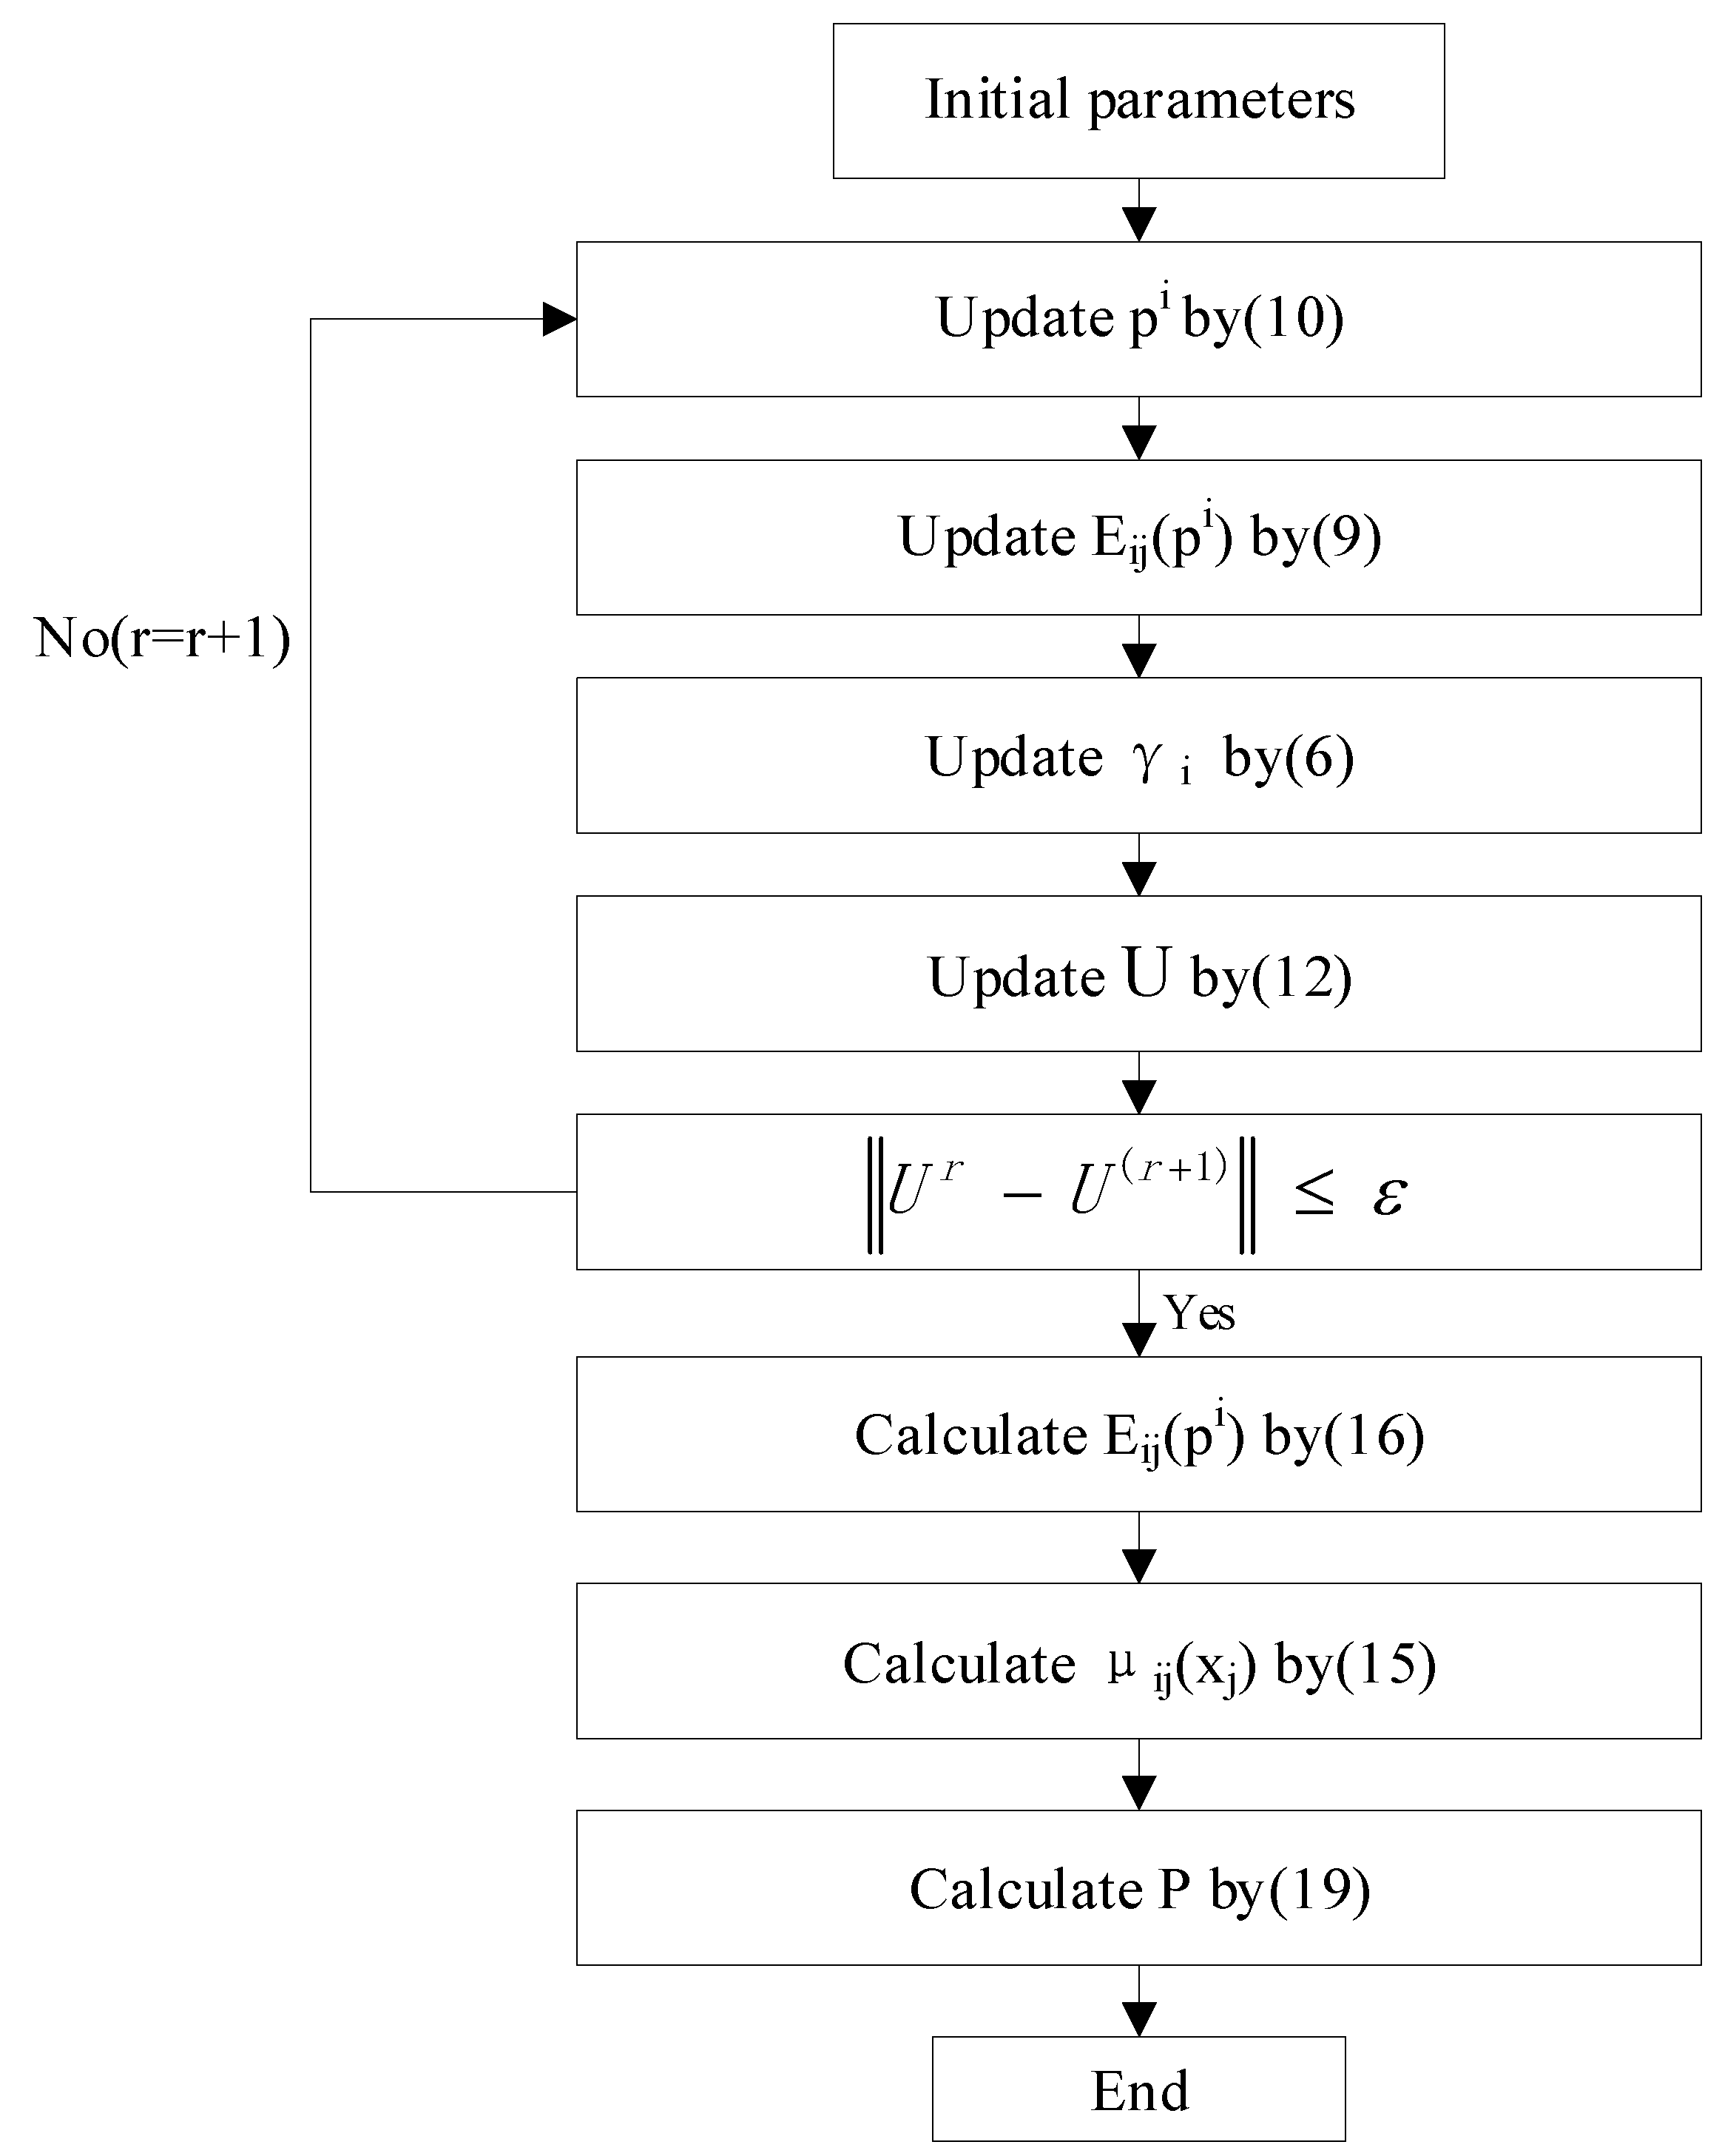
The modified T-S fuzzy modeling method first applies the clustering algorithm in
Section 3.1 to divide the fuzzy space and identify antecedent parameters. Then, the hyperplane-shaped membership function introduced in
Section 3.2 is taken as a node to allow improved connections between the fuzzy predecessor and the fuzzy successor. In
Section 3.3, we use the LSM to identify fuzzy consequent parameters. The specific modeling steps are shown in
Figure 3.
4. Experimental Confirmation and Discussion
In this section, the modified T-S fuzzy model is used to conduct hysteresis modeling experiments of PEA, and its effectiveness is verified by comparing other models. The maximum error and root mean square error (RMSE) is introduced to establish the model’s precision.
, represents the n pairs of input/output data; is the actual output data; is the output data of the model.
4.1. Experimental Equipment
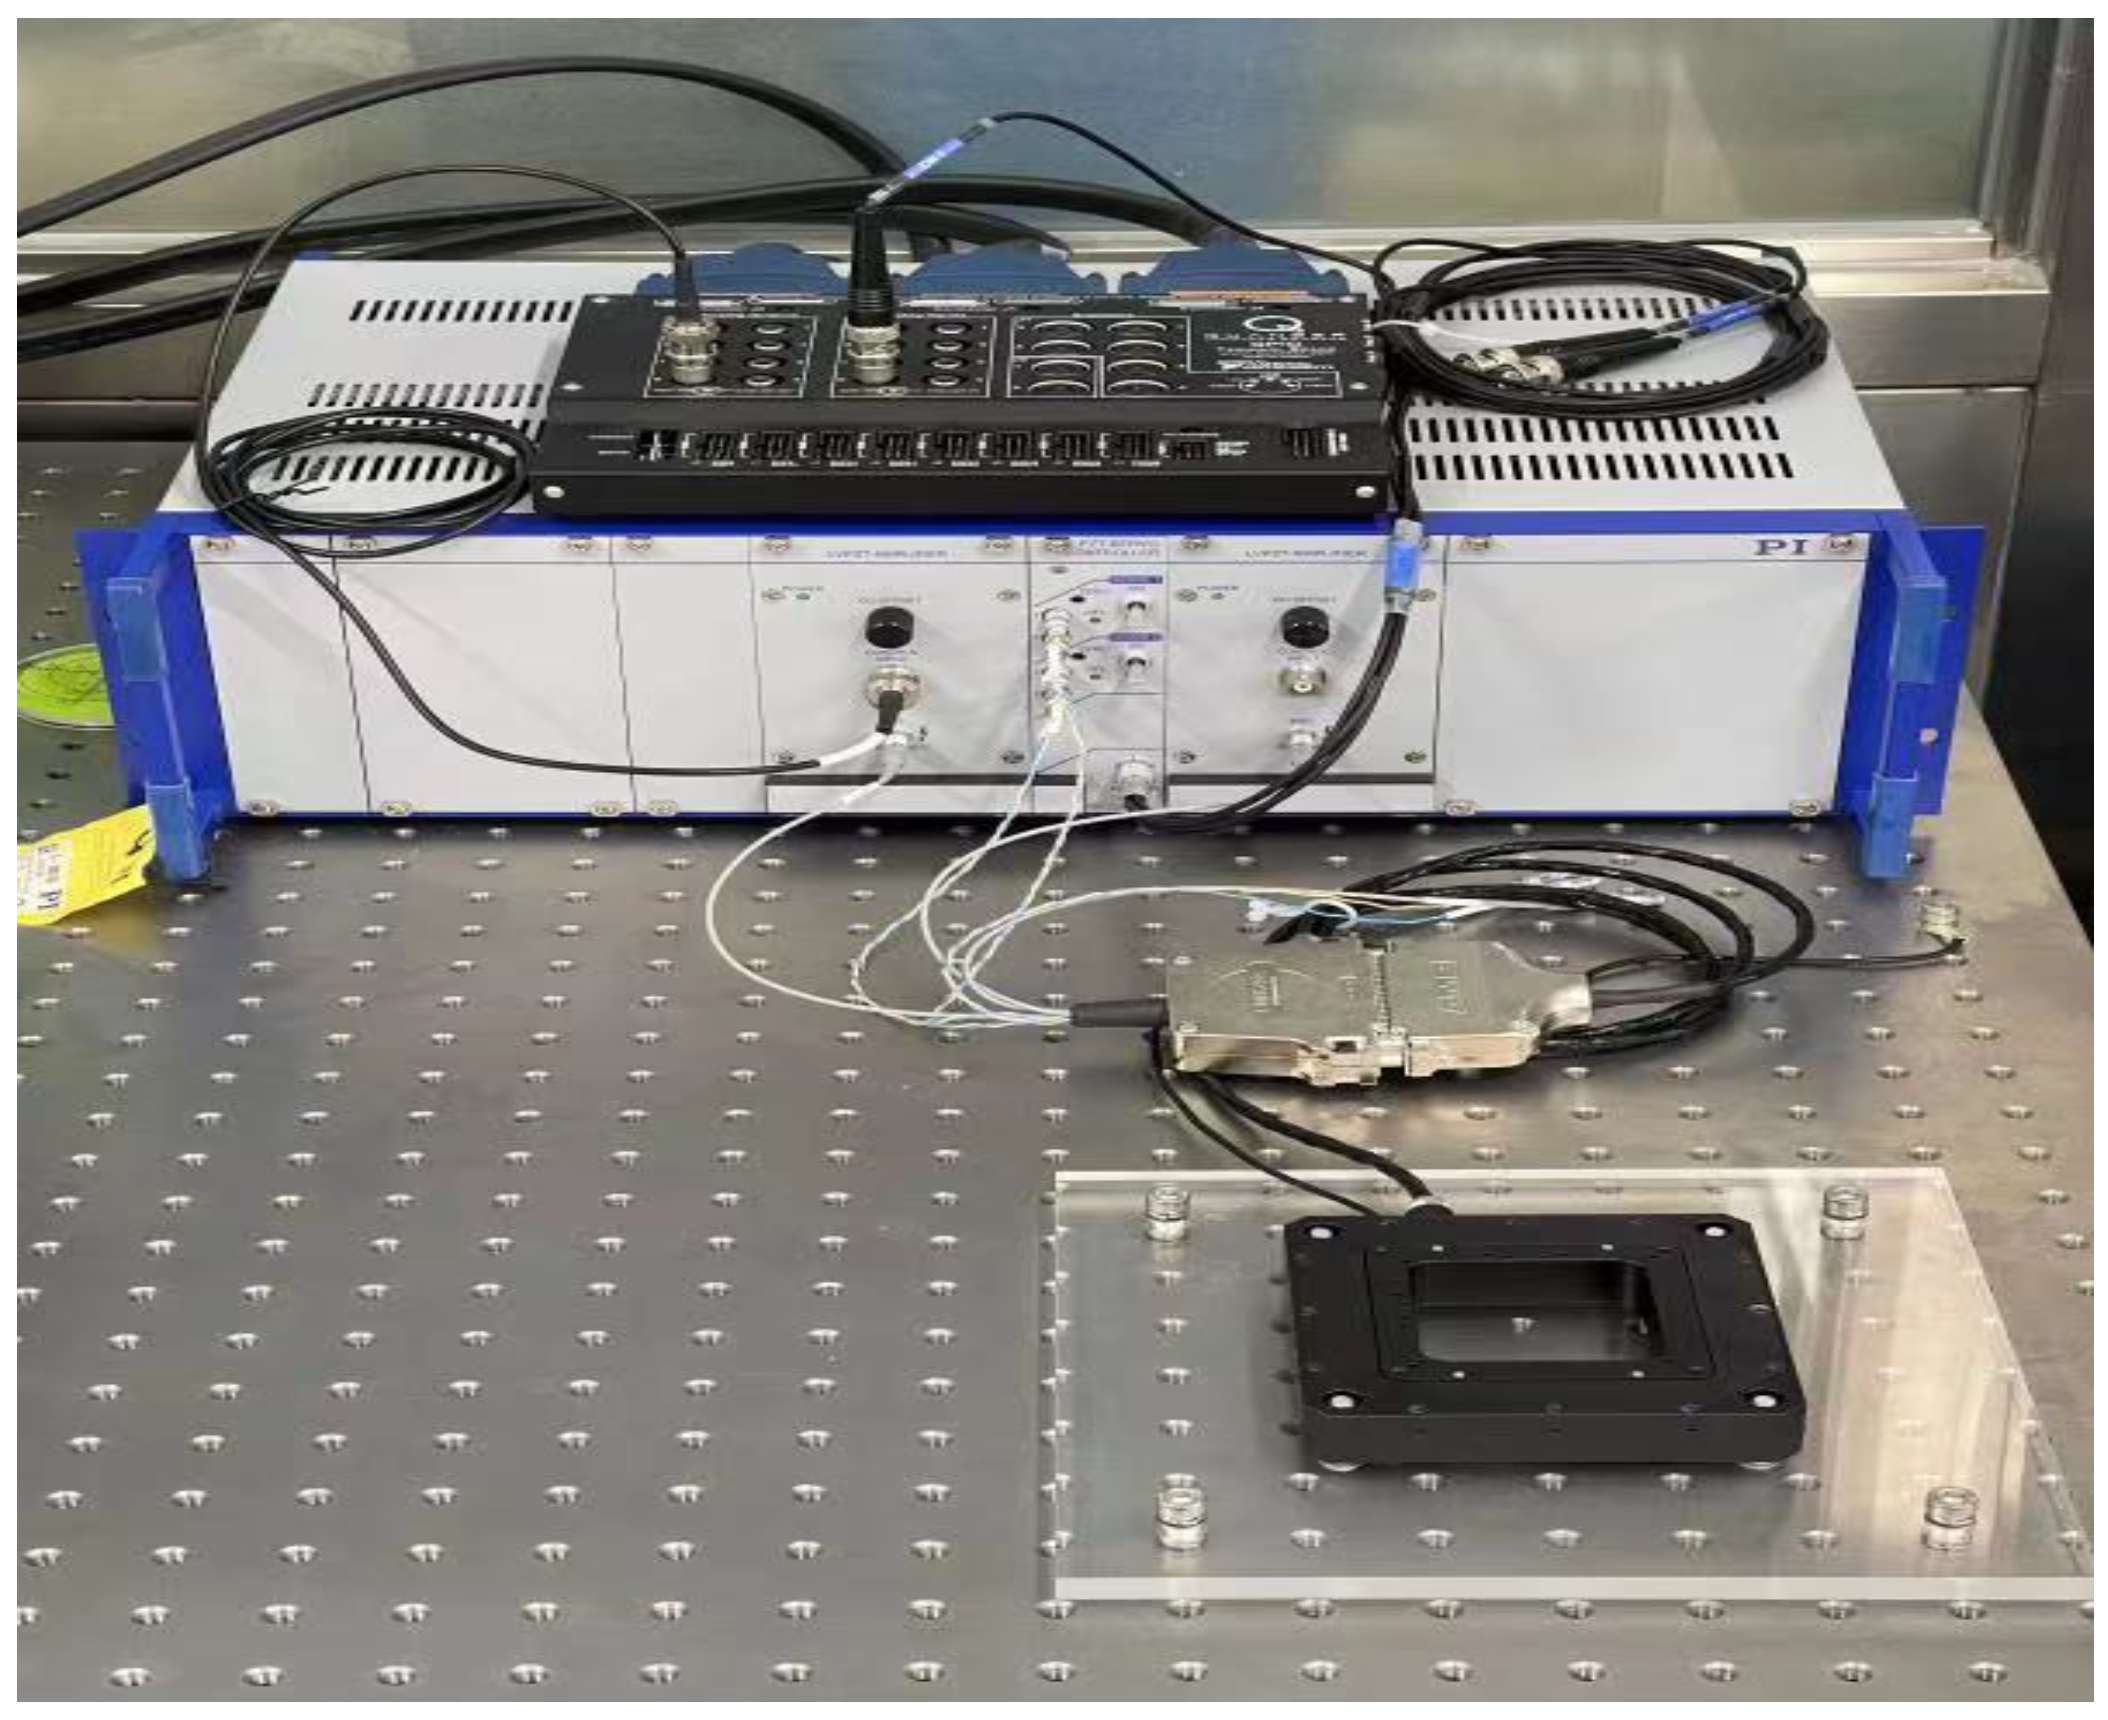
The experimental equipment of the PEA data acquisition experiment includes hardware and software systems. The hardware system includes a computer, a Piezo nano-positioning device, a data-acquisition card, and an integrated drive controller, as shown in
Figure 4. The Piezo nano-positioning device used in the experiment is the P-733.2CD model from the Physik Instrument (PI) company, Karlsruhe, Germany. which has integrated displacement sensors that can directly measure output displacements. The data-acquisition card is a PCI-6251 produced by NI Company, Texas, America, Un which does not need to write additional driver programs and can be directly connected to the device. The integrated drive controller is an E-509.C2A dual-axis drive controller from PI, which contains a voltage amplifier module to drive the PEA. The software system uses the Matlab2020a(Math-Works company, Natick, United States) program preinstalled in the Win10 environment. The initial signal of the experiment is generated by MATLAB software in the computer and transmitted to the integrated drive controller across the data-acquisition card. The voltage signal processed by the driving controller can be used as the driving voltage of the Piezo nano-positioning device. After receiving the voltage signal, the Piezo nano-positioning device outputs the corresponding displacement, and the displacement signal is fed back to the computer across the data-acquisition card.
4.2. Model Identification
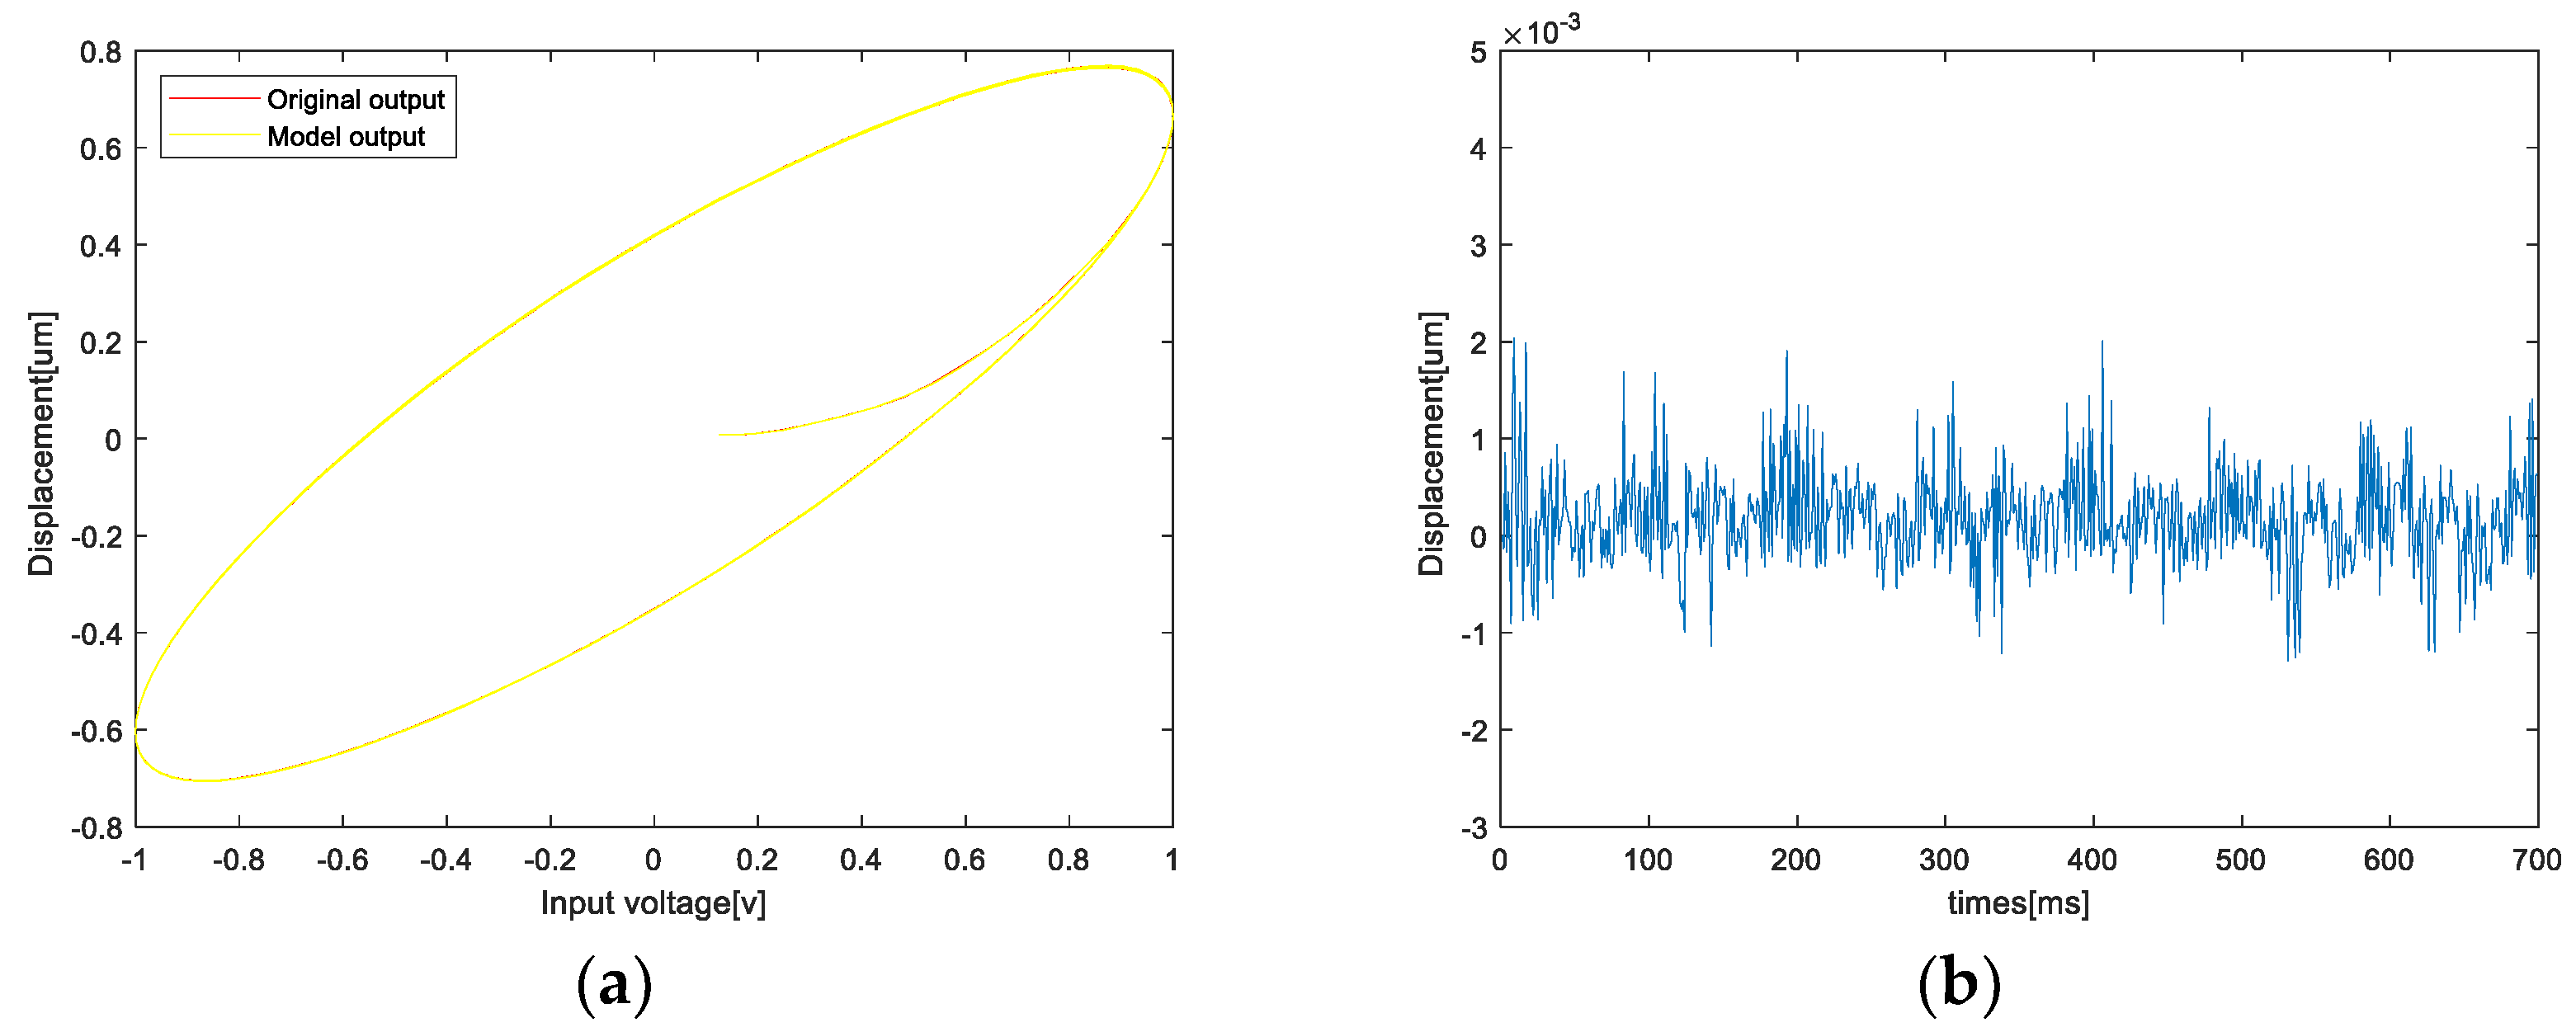
For purpose of verifying the effectiveness of the above modified model, the three-input single-output T-S fuzzy model is established in the study, which not only ensures the output’s accuracy but also ensures the relative simplicity of the model’s structure and facilitates subsequent controller designs. Experimental results show that the shape of PEA does not change significantly when the frequency is lower than 5 Hz, as shown in
Figure 5. Therefore, the data ranging at 5 Hz–100 Hz are selected as the model’s test data to reflect the effectiveness of the model.
Select
, m = 2, c = 3, r = 500,
, and the input signal as
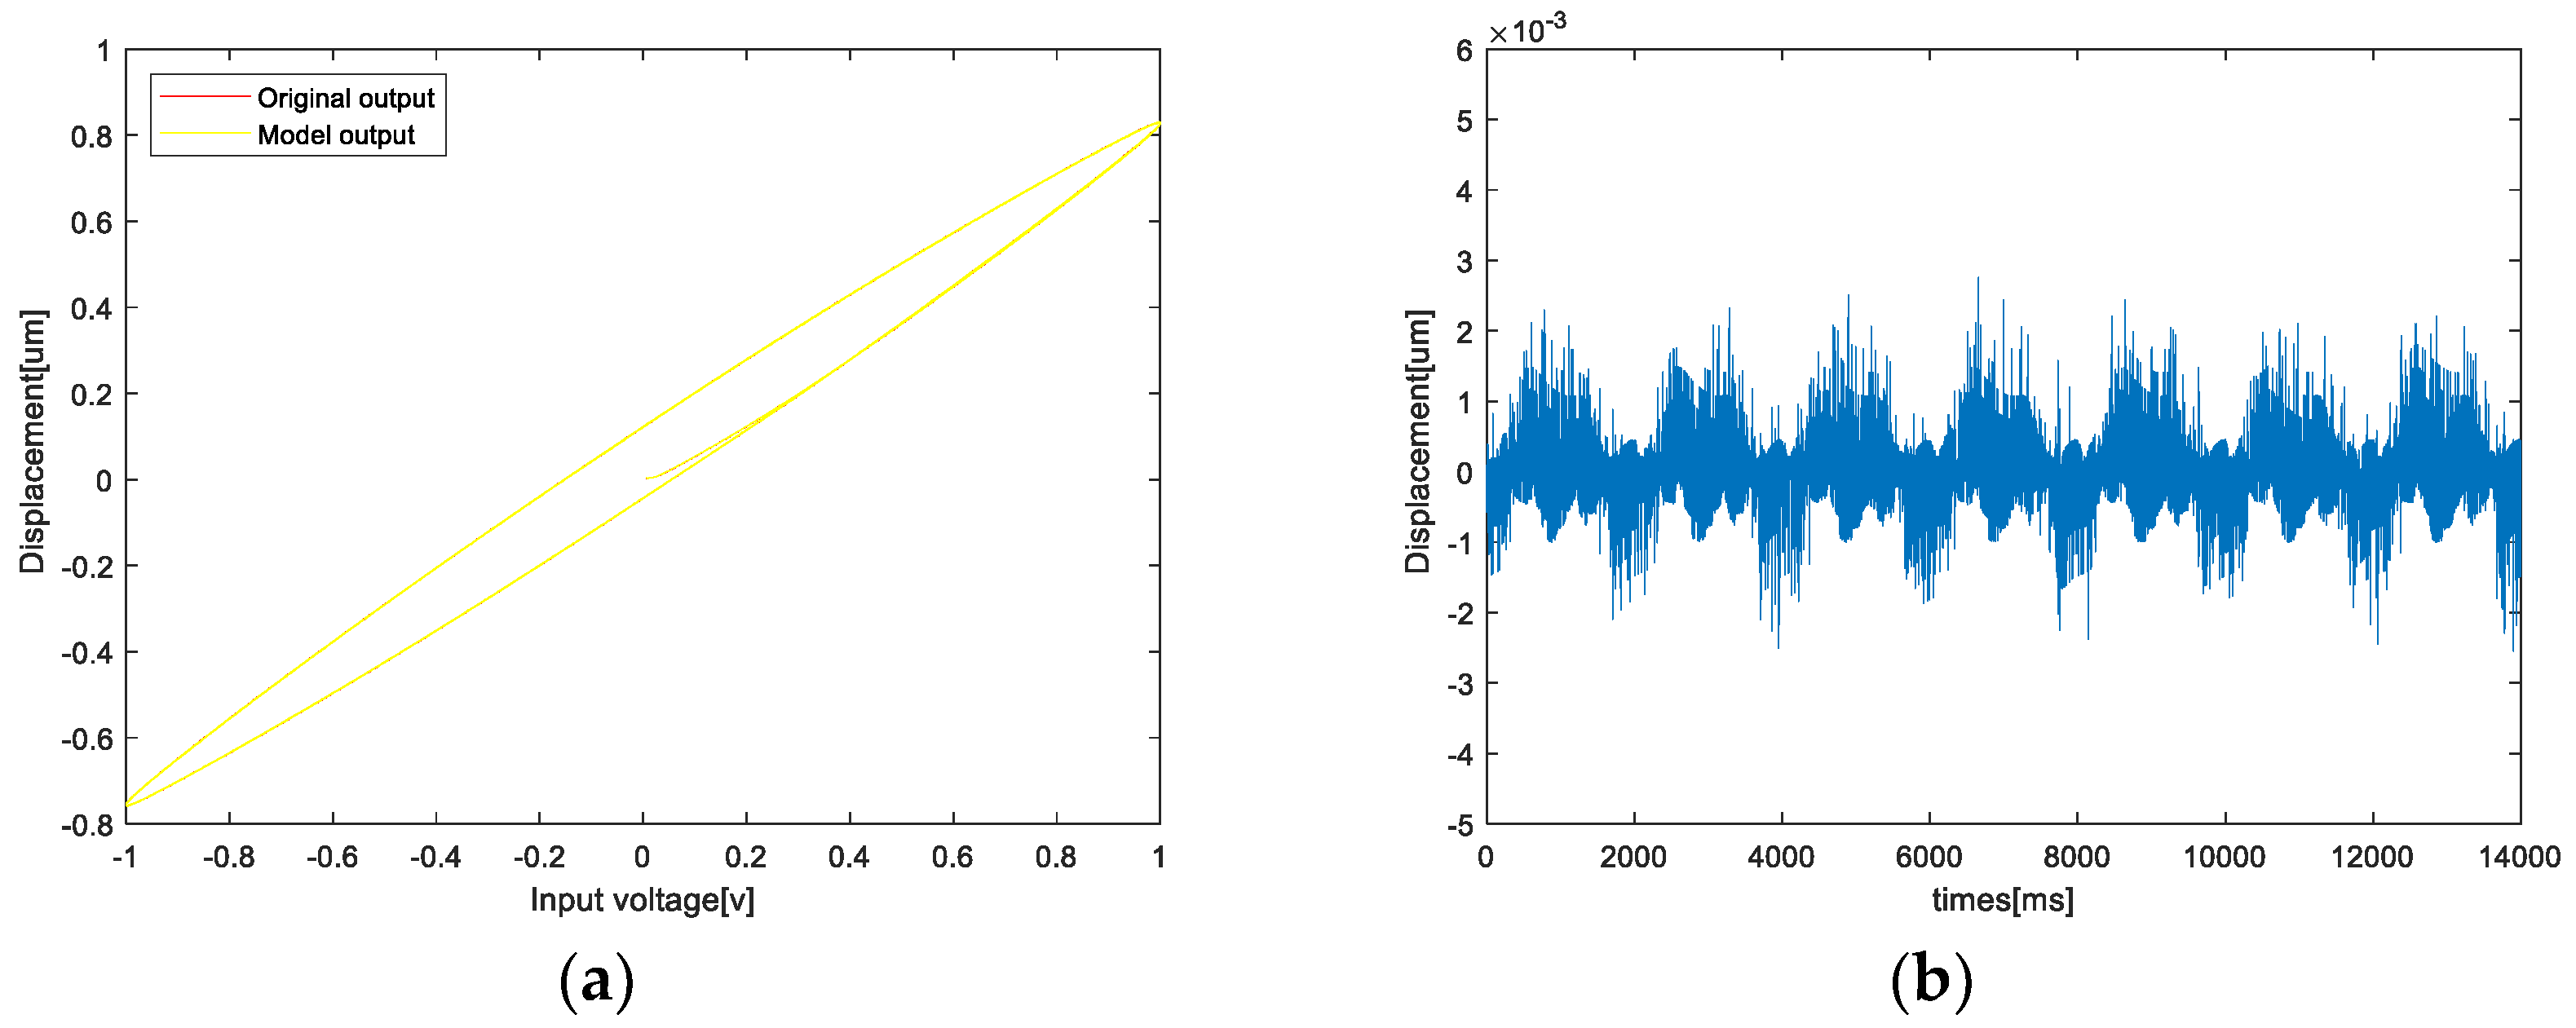
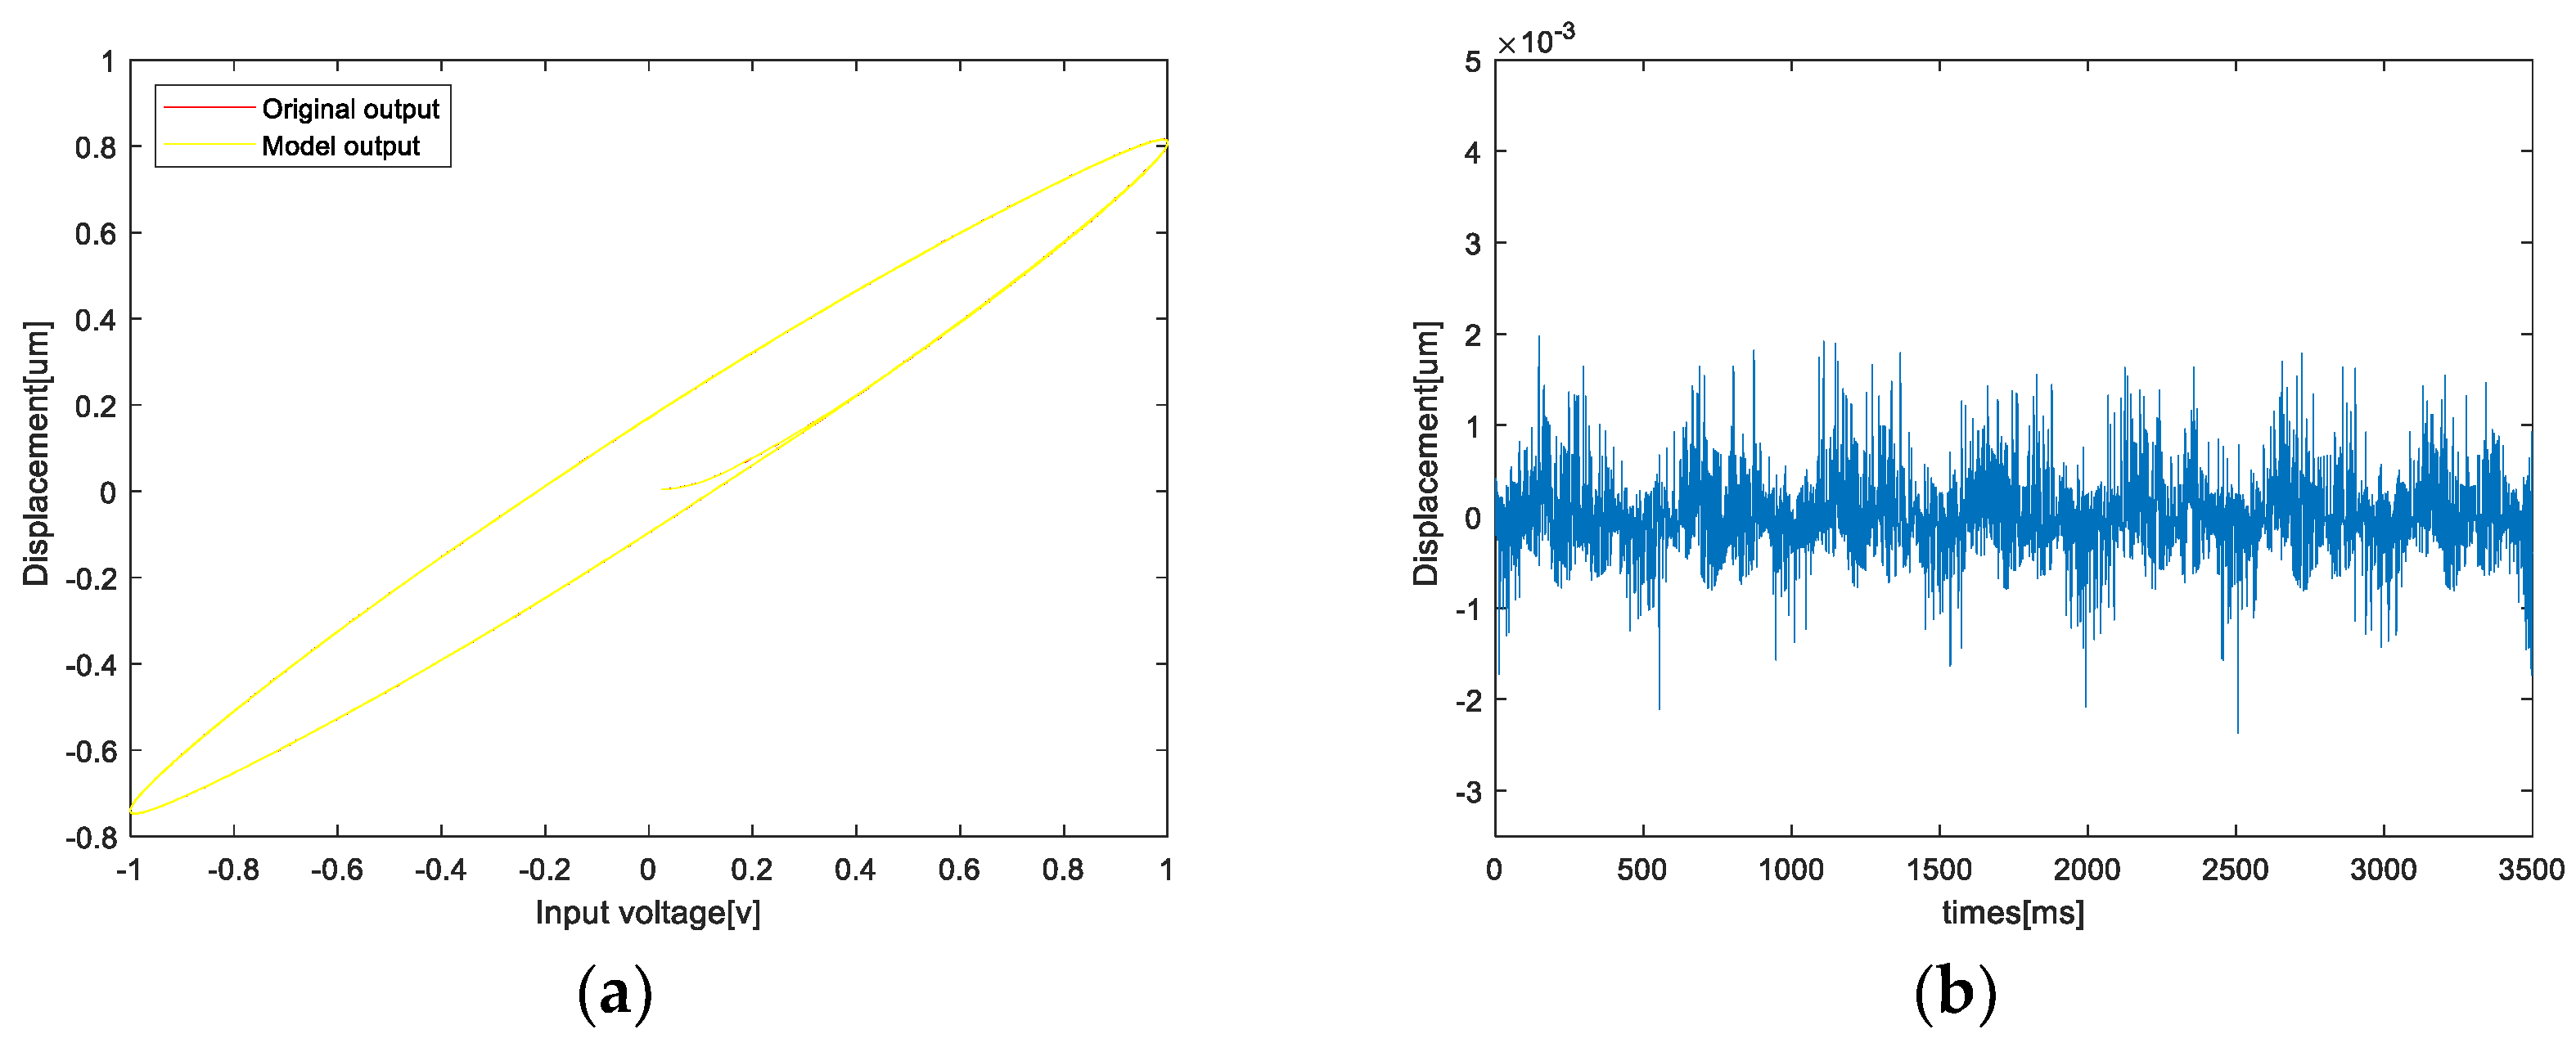
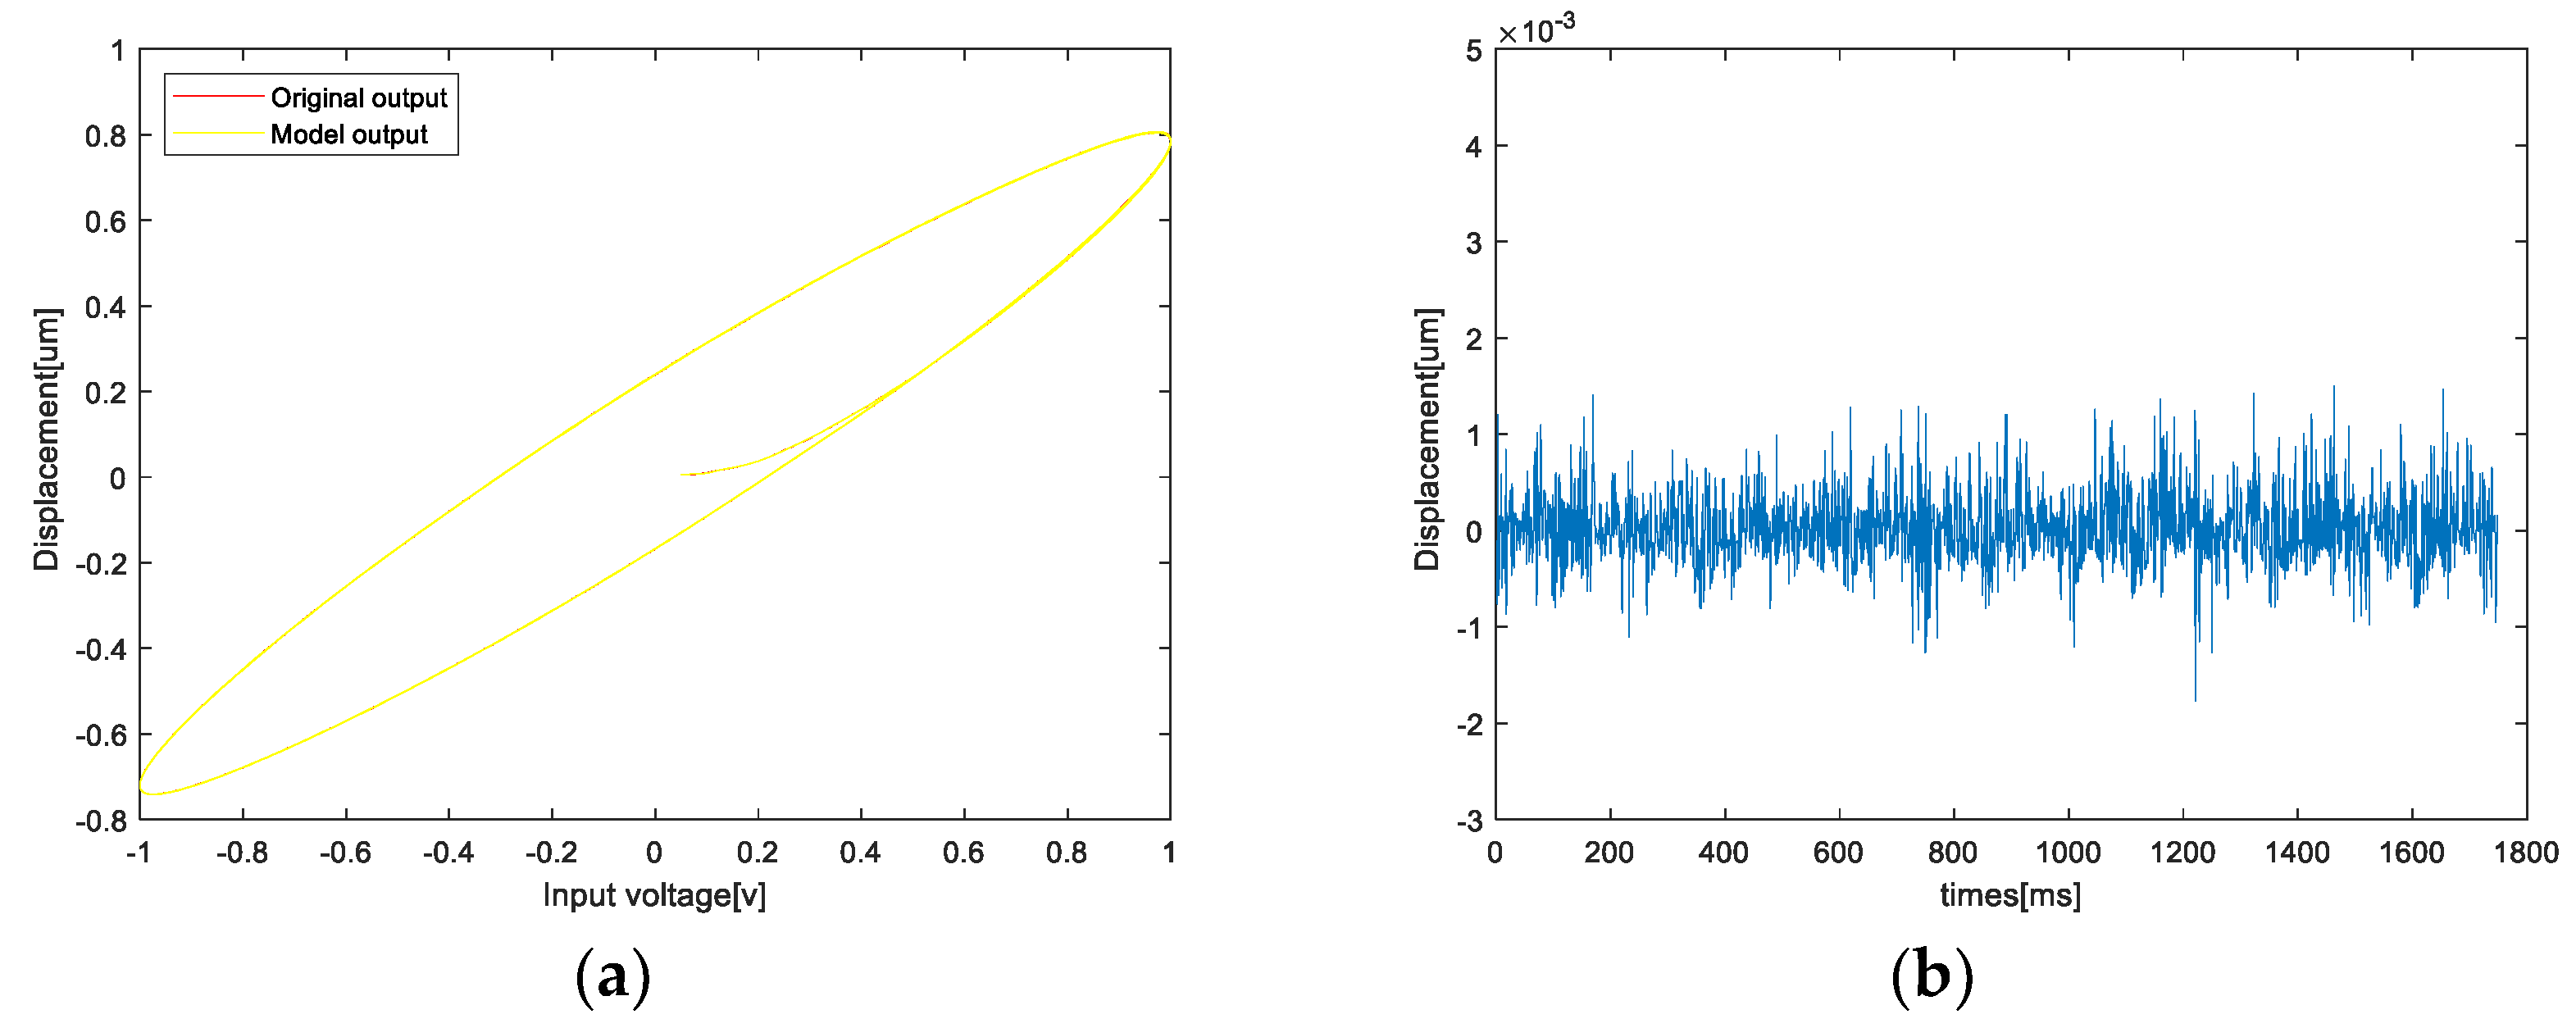
. Moreover, the sweep signal is used as the training parameter to identify each parameter of the T-S fuzzy model. Data at frequencies of 5 Hz, 20 Hz, 40 Hz, and 100 Hz were used as the model’s test data.
Table 1 shows the identification of fuzzy consequent parameters.
Figure 6,
Figure 7,
Figure 8 and
Figure 9 show the hysteresis model and errors when the input frequency is 5 Hz, 20 Hz, 40 Hz, and 100 Hz.
From the above experimental results, we observe that the error of the improved model is very small when the frequency is around 5 Hz–100 Hz. When the frequency changes, the model can still well approximate the hysteresis curve at different frequencies, which proves that the model is rate-dependent. When the sine signal is 5 Hz, the modeling max-error is 0.0028 μm and RMSE is 0.0610. When the sine signal is 20 Hz, the modeling max-error is 0.0020 μm and RMSE is 0.0270. When the input frequency is 40 Hz, the modeling maximum error is 0.0015 μm and RMSE is 0.0162. When the sine signal is 100 Hz, the modeling max-error l is 0.0020 μm and RMSE is 0.0136.
In order to preliminarily verify the feasibility of this model, this paper compares the latest achievements of this model with other models in related fields. The hysteresis nonlinear model of PEA established in Ref. [
28] has a maximum error distribution of 0.1577 μm–0.7826 μm within 100 Hz. However, according to the above experiments, the maximum error distribution of the model in this paper is 0.0015 μm–0.0028 μm. It can be seen that the accuracy of hysteresis model established by this method is significantly higher than that of the current mainstream model, which is suitable for practical engineering applications.
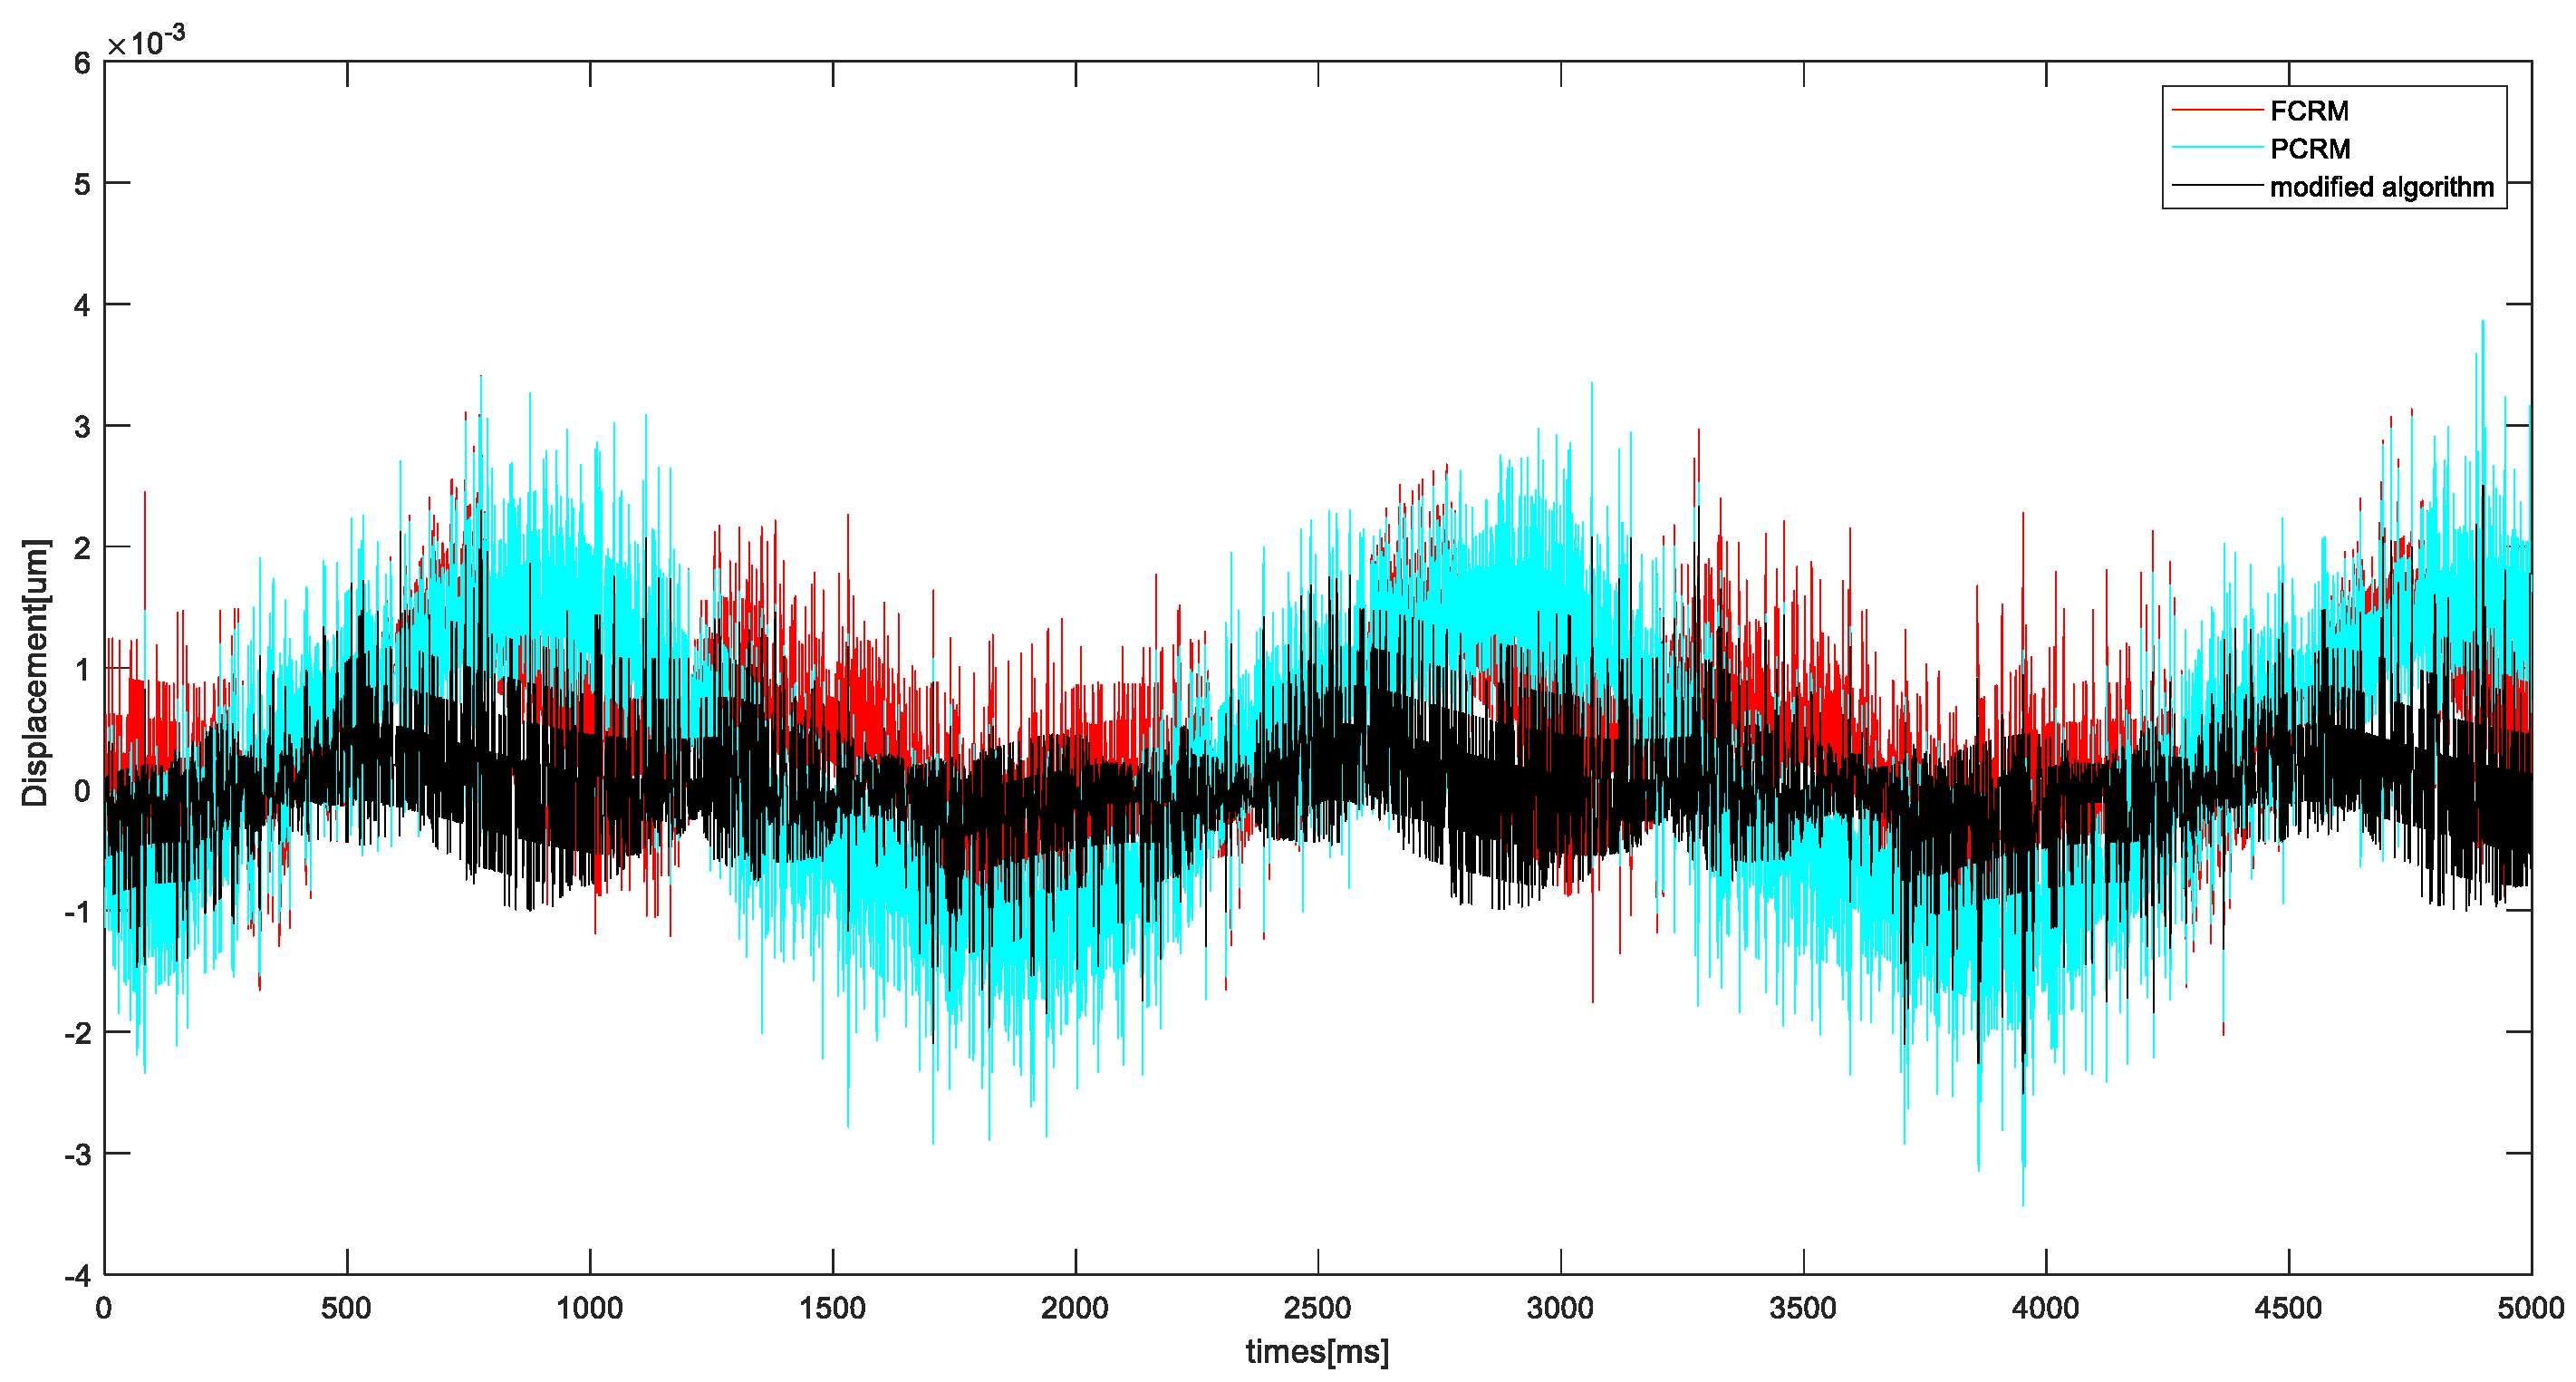
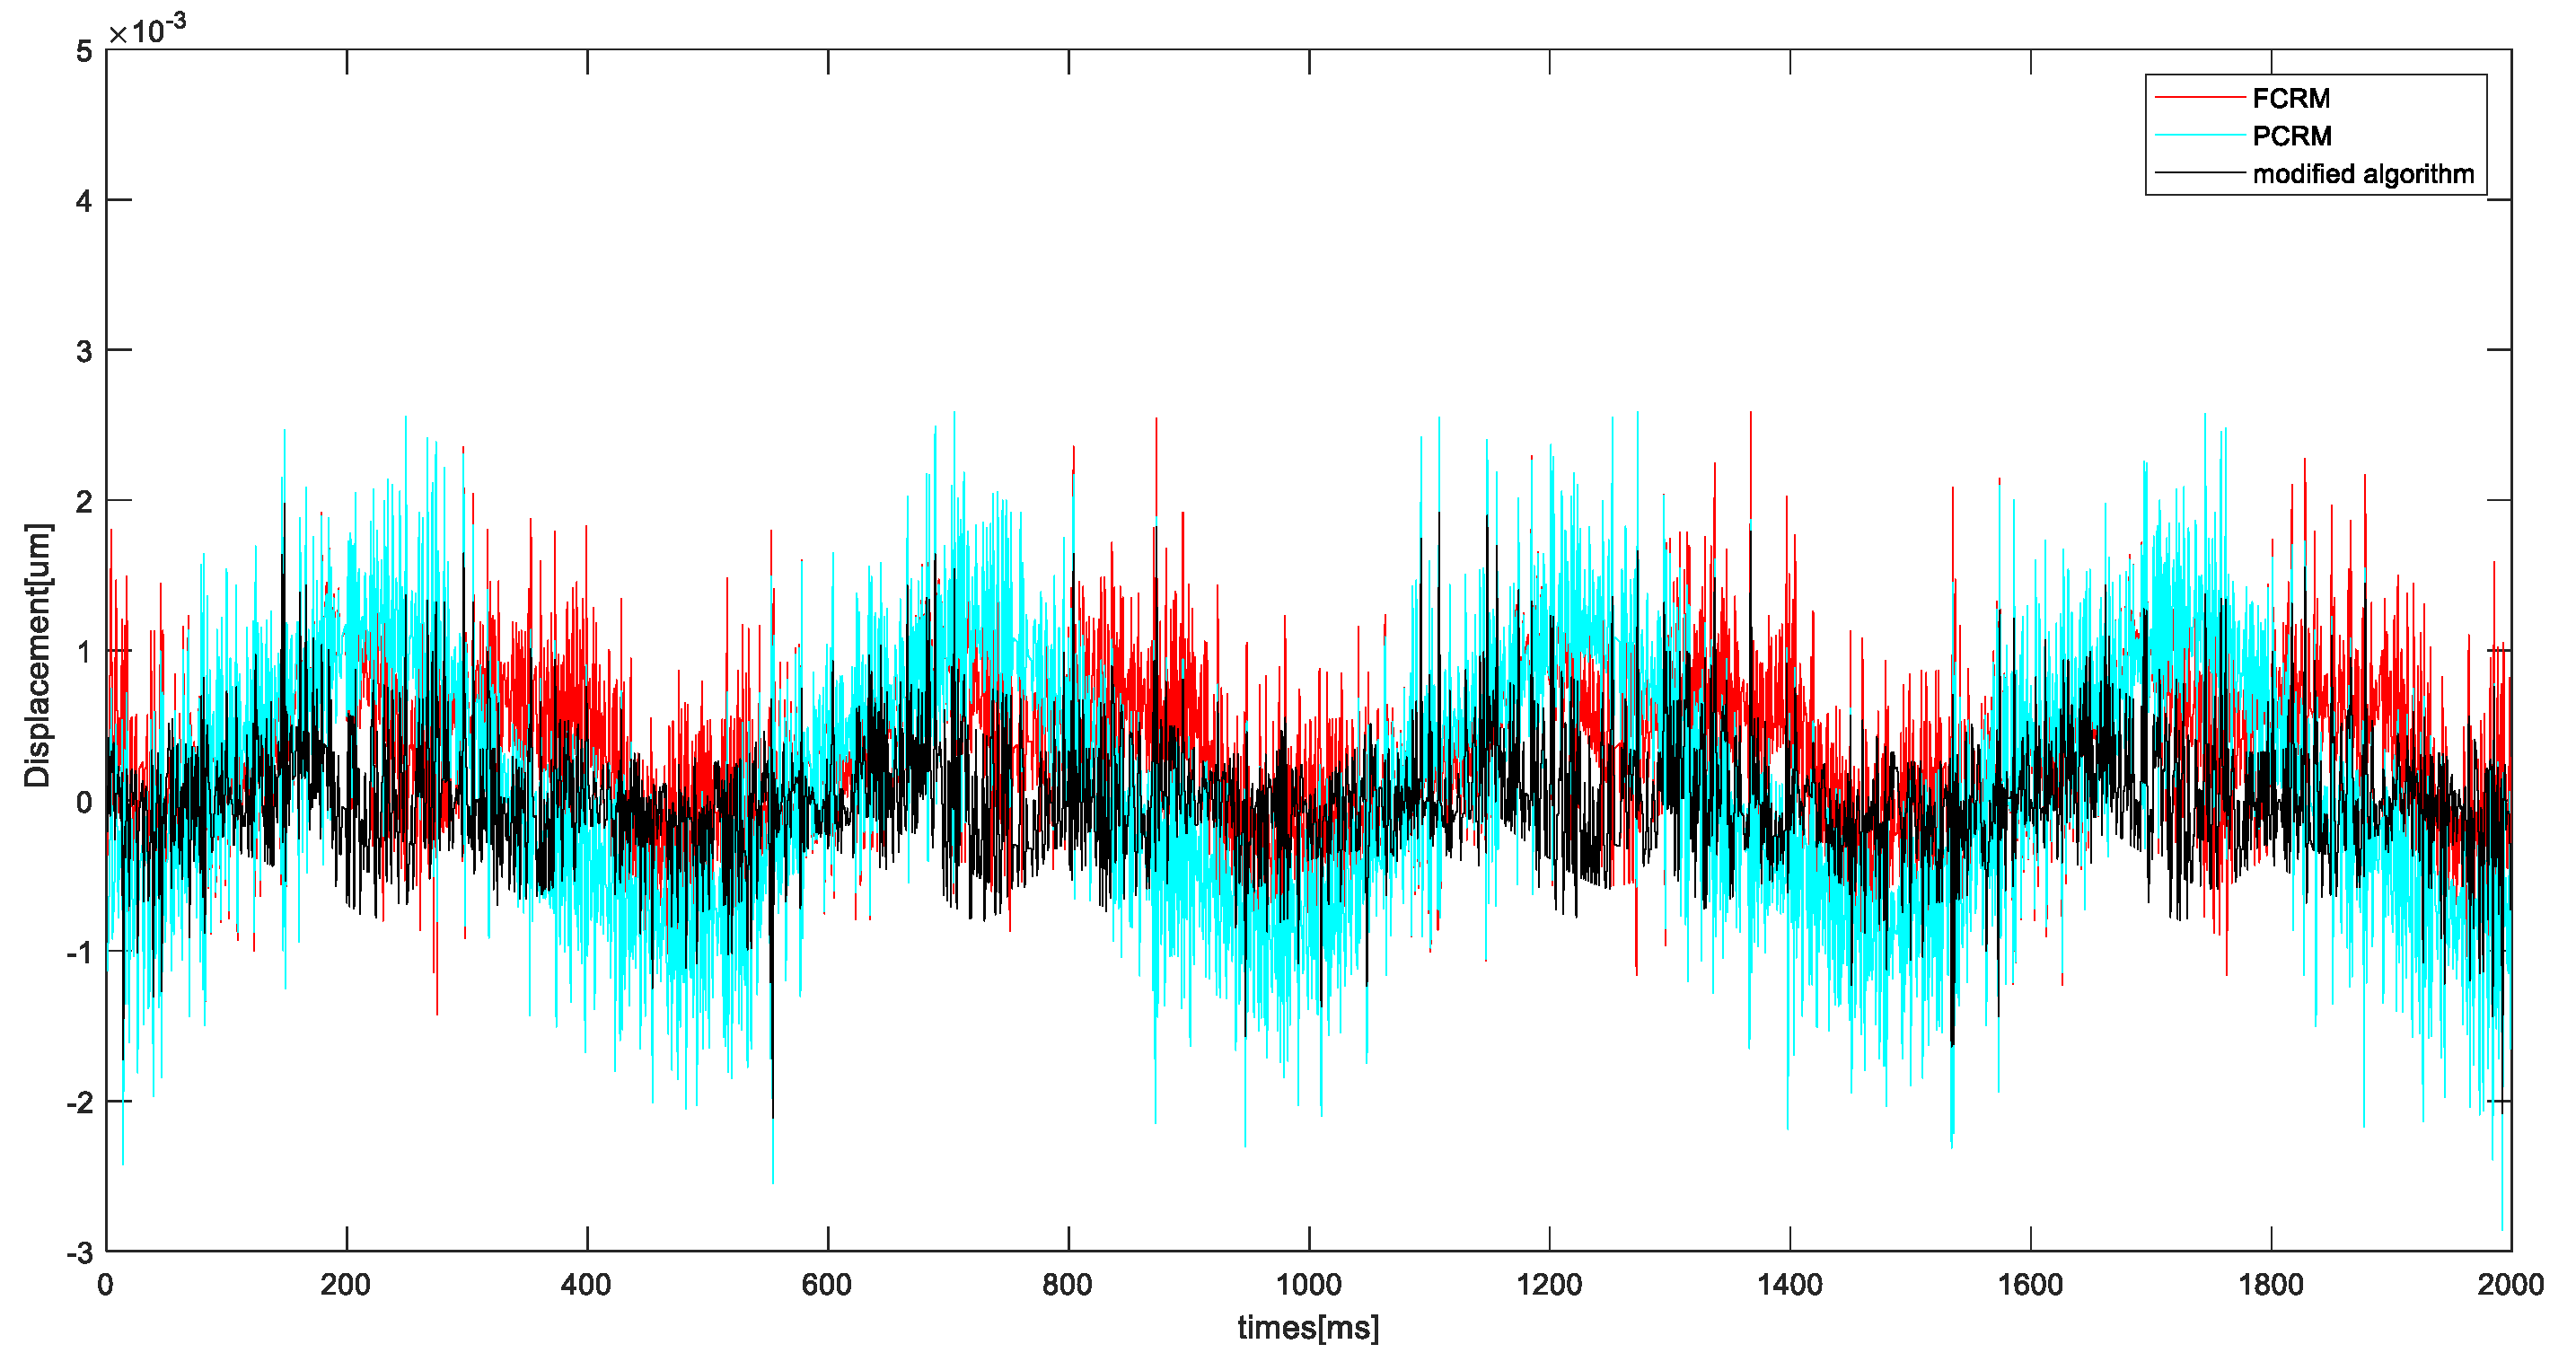
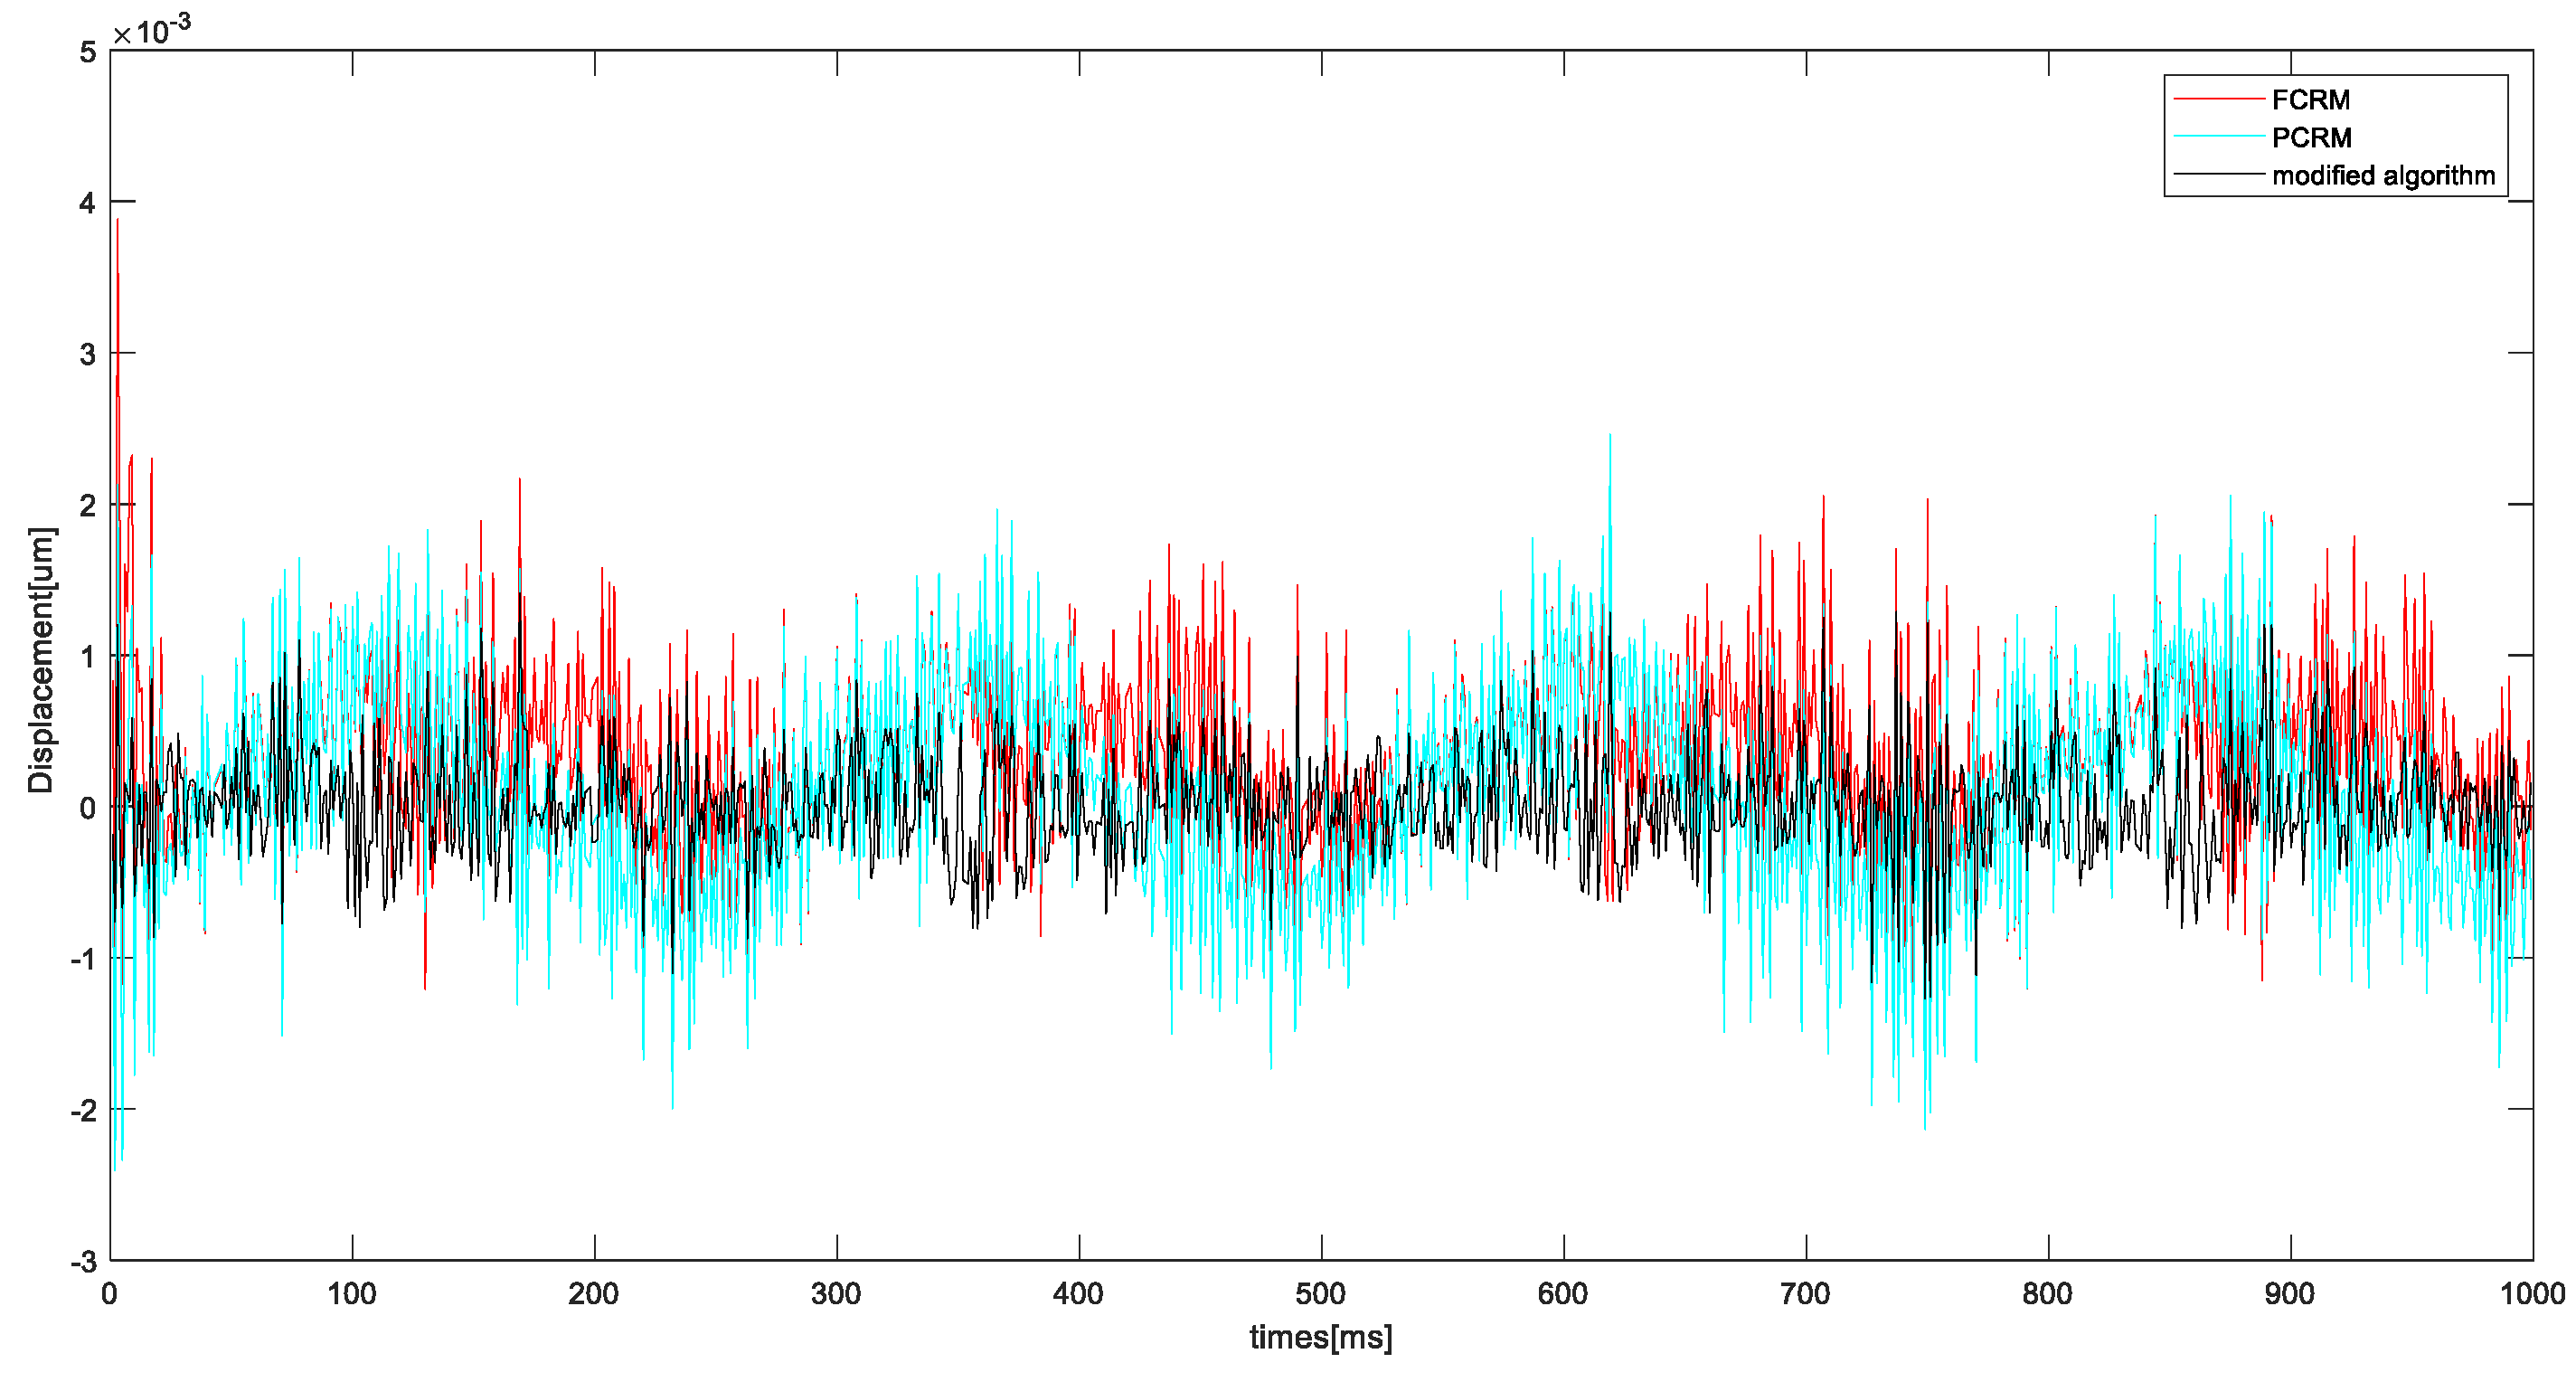
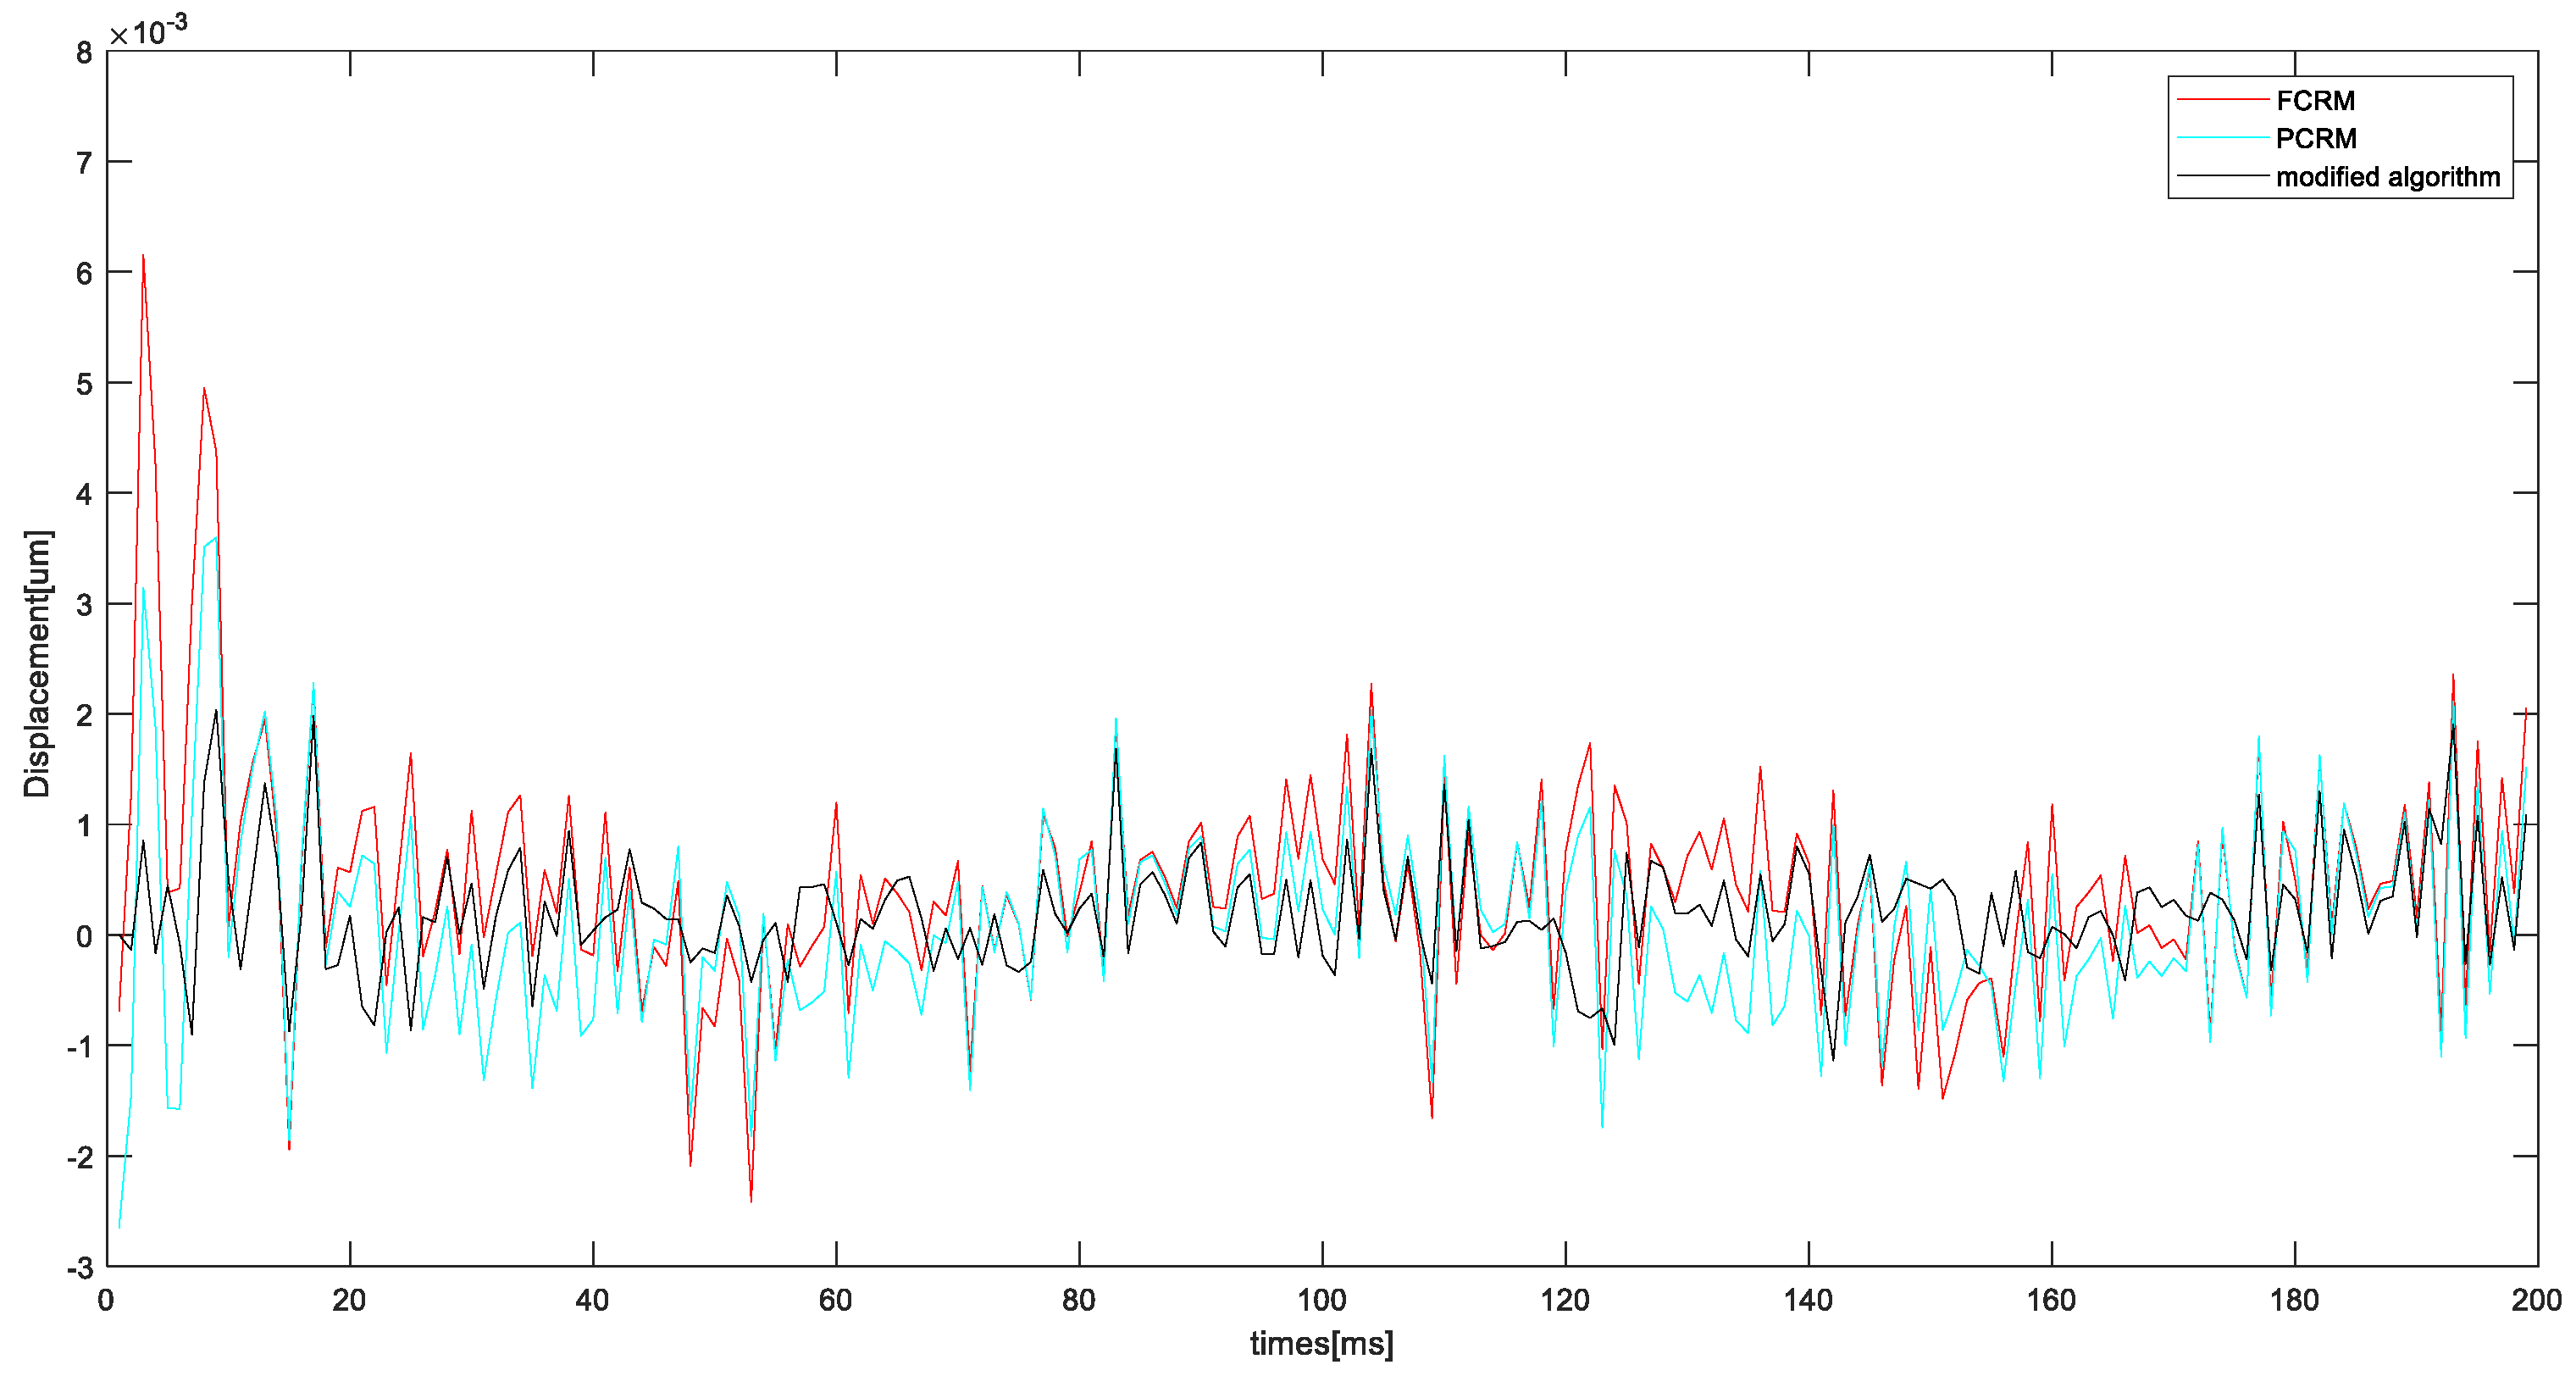
4.3. Contrast Experiment
In order to further prove the validity of the above methods, we contrast the FCRM and PCRM with the model established in this paper. The experimental conditions in
Section 4.2 are still adopted to ensure the effectiveness of the experiment. Three different types of T-S fuzzy models were identified by frequency sweep signals, and the input signal frequencies of 5 Hz, 20 Hz, 40 Hz, and 100 Hz were used as test data. Maximum error and RMSE were used as the model’s evaluation criteria.
Figure 10,
Figure 11,
Figure 12 and
Figure 13 show the error curves of each model, and
Table 2 shows the comparison of error parameters.
According to the error comparison in the figure, it is observed that the T-S fuzzy model established by the above method is significantly superior to the model obtained by the traditional FCRM algorithm and PCRM algorithm at each frequency. The error of the hysteresis model of PEA established by the proposed method is obviously less than that of the other two methods. Moreover, the error distribution is more concentrated, which can overcome the influence of noise points and approximate the hysteresis nonlinear model more accurately.
According to the data in the table, when the frequency is 5 Hz–100 Hz, the max-error distribution of the hysteresis model established by FCRM is between 0.0027 μm and 0.0060 μm, and the RMSE is distributed between 0.0247 and 0.1123. As the TS fuzzy model established by traditional FCRM is sensitive to noisy data and uses traditional membership function, the hysteresis model established by traditional FCRM has large errors and is relatively scattered. The max-error distribution of the hysteresis model established by PCRM algorithm is between 0.0025 μm and 0.0039 μm, and the RMSE is between 0.0253 and 0.1329. Because the objective function of PCRM algorithm is improved on the basis of FCRM algorithm, the maximum error of the hysteresis model established by the PCRM algorithm was obviously improved. Moreover, the traditional membership function still makes the error distribution more scattered. The max-error distribution of the model built by the improved algorithm in this paper is between 0.0015 μm and 0.0028 μm, and the RMSE distribution is between 0.0136 and 0.0610. Compared with the previous two algorithms, this method proposes a new objective function based on FCRM, which largely overcomes the influence of noise points. Moreover, it introduces a new hyperplane membership function. Therefore, the model has the smallest error; the error distribution is more concentrated; the modeling precision is obviously improved.


