Communication

Performance of a Pd-Zn Cathode Electrode in a H2 Fueled Single PEM Fuel Cell

Department of Chemical Engineering, University of Patras, Caratheodory 1, University Campus, GR-26504 Patras, Greece
*
Author to whom correspondence should be addressed.
Electronics 2022, 11(17), 2776; https://doi.org/10.3390/electronics11172776
Submission received: 4 July 2022 / Revised: 22 August 2022 / Accepted: 26 August 2022 / Published: 3 September 2022

Abstract

:
A 21.7 wt.% Pd—7.3 wt.% Zn/C electrocatalyst prepared via the wet impregnation (w.i.) method was deposited onto commercial carbon cloth (E-TEK) and tested towards its electrocatalytic performance as a cathode electrode material for oxygen reduction reaction (ORR) in a H2 fueled single proton-exchange membrane fuel cell (PEMFC). A commercial PtRu electrode (E-TEK) was used as PEM anode for hydrogen oxidation reaction (HOR). The performance of the aforementioned PEMFC was compared with that of the same PEMFC with two different Pt-based cathodes, which were prepared by deposition onto commercial carbon cloth (E-TEK) of 29 wt.% Pt/C synthesized via w.i. and of commercial 29 wt.% Pt/C (TKK). The metal loading of the tested cathode electrodes was 0.5 mgmet cm−2. Comparison was based both on polarization curves and on electrochemical impedance spectroscopy (EIS) measurements at varying cell potential. In terms of power density, the lowest and highest performance was exhibited by the PEMFC with the 21.7 wt.% Pd—7.3 wt.% Zn/C cathode and the PEMFC with the commercial 29 wt.% Pt/C (TKK) cathode electrode, respectively. This behavior was in accordance with the results of EIS measurements, which showed that the PEMFC with the 21.7 wt.% Pd—7.3 wt.% Zn/C cathode exhibited the highest polarization resistance.

1. Introduction

Increasing energy demands dictated by population growth and modern lifestyle as well as environmental pollution attributed to fossil fuel usage have made the shift towards renewable energy sources necessary. Hydrogen (H2) is a secondary renewable energy source derived from various resources (natural gas, nuclear power, biomass and renewable power) via catalytic reforming or via electrolytic, solar driven or biological processes [1]. H2 is a fuel with high energy content that could be fed to proton exchange membrane fuel cells (PEMFCs) in order to produce electric power. Since operation of H2-fuelled PEMFCs is characterized by zero-emission of pollutants as well as high mass power density (ca. 300 Wh kg−1) and high hydrogen-to-electricity conversion efficiency (ca. 60%) [2], PEMFCs could be an alternative solution to conventional power sources. PEMFCs can be used in both stationary and mobile applications [3,4,5,6,7,8,9] since, besides the aforementioned advantages, they operate at low temperatures with a rapid start-up (less than 30 s from −20 °C) [4,7]. The tremendous perspectives of PEMFCs drive various organizations globally to set high targets for the future. Japan’s New Energy and Industrial Technology Development Organization (Japan NEDO) has set as a target for the produced PEMFC stack power density for automotive applications 6 kW L−1 and 9 kW L−1 until 2030 and 2040, respectively [2], whereas the European Union Fuel Cells and Hydrogen 2 Joint Undertaking (EU-FCH2JU) has set a PEMFC stack power density target value of 9.3 kW L−1 by 2024 [2,10]. According to the United States Department of Energy (U.S. DOE), the ultimate targets concerning the produced power density, the specific power, the peak energy efficiency and the durability in automotive drive cycle for an 80 kWe integrated transportation PEMFC system operating on direct H2 are set to 850 W L−1, 900 W kg−1, 70% and 8000 h, respectively, compared to the current values 640 W L−1, 860 W kg−1, 64% and 4130 h [4,11].
However, the mass production of these devices is still hampered by various factors such as the use of high-cost noble metal based electrocatalysts for both the anodic H2 oxidation reaction (HOR) and the cathodic O2 reduction reaction (ORR), the limited operation lifetime and the low volumetric power density [2,12]. The improvement of bipolar plates (BPs), which according to DOE correspond to 20–30% of the total fuel cell cost as well as to 60–80% of the total weight and volume of the fuel cell stack [12,13], and the avoidance of the mechanical and chemical degradation phenomena arising during cell operation [4], are some of the obstacles that the scientific community must overcome in order to facilitate PEMFC market penetration. As well being mentioned by Hua et al. [4], most of the abovementioned issues reduce the durability of the PEMFC system, and thus, prohibit the large-scale commercialization of PEMFCs.
Moreover, the use of expensive Pt-based electrocatalysts for ORR and HOR is a lasting problem as it increases the fuel cell cost to unaffordable levels. ORR kinetics in an acidic environment are sluggish, whereas the HOR kinetics are rapid, which renders the first reaction the determining process for the PEMFC performance [3]. Numerous efforts have been made towards the direction of developing electrocatalysts with low or zero Pt content and with high ORR performance [2,3,8]. Platinum group metal (PGM) free electrocatalysts have been studied by several researchers as a less expensive potential alternative to the PGM electrocatalysts for ORR, including novel metal-N-C nanostructures involving various transition metals such as Fe, Co, Ni, Mn, Cu or Sn [14,15,16,17,18,19,20,21,22,23,24,25,26]. However, the high loadings of these electrocatalysts required to achieve the desired ORR performance result in a relatively thick cathode catalytic layer, which negatively affects the charge and mass transfer inside the membrane electron assembly (MEA) and the utilization of the active sites of the electrocatalyst, thus reducing the PEMFC performance [3].
Considering the above, research efforts have also focused on the development of electrocatalytic materials with low PGM loading [3]. Combining Pt, the state-of-the art electrocatalyst for PEMFCs, with transition metals [27,28,29], lanthanides [30] and other rare earth metals [31] is a common strategy for improving ORR activity, which is achieved by altering the adsorption energy of oxygen species via changing the Pt surface electronic structure and lowering the Pt d-band center [28,32] as a result of strain (lattice contraction) effect [30,33,34] and/or ligand (electron transfer) effect [35,36,37]. Among the precious metals, Pd has attracted research interest over the past decades since it has similar properties with Pt, whereas its price used to be lower (ca. three times lower in 2010) [38]. As in the case of Pt, combining Pd with another metal such as Co or Fe has been found to increase the ORR activity [39,40,41,42]. However, since ca. 2017 the cost of Pd exceeds that of Pt and thus loses a significant advantage that the former had over the latter.
In previous work by our group, Pd was combined with different transition metals (Ag, Co, Cu, Fe, Ni, Zn) to synthesize via the wet impregnation method a series of Pd-based bimetallic electrocatalysts (10 wt.% total metal loading) deposited on carbon black support (Vulcan XC72R), which were investigated as it concerns their ORR activity in 0.1 M HClO4 electrolyte solution, employing the thin-film rotating disk electrode (RDE) technique [43]. The 7.5 wt.% Pd—2.5 wt.% Zn/C electrocatalyst exhibited the highest ORR activity among the other Pd-based electrocatalysts and the 10 wt.% Pt/C reference electrocatalyst. Its enhanced ORR performance was partly attributed to PdZn alloy formation. This affects the Pd crystal structure increasing the Pd d-vacancy and lowering the d-band center, which results in an optimum oxygen chemisorption bond energy and to concomitant acceleration of the ORR. In continuation of this work, the ORR performance in 0.1 M HClO4 was studied via the thin-film RDE technique for a series of Pd-Zn/C electrocatalysts prepared by varying the reduction temperature (200, 300, 450, 600 °C) and the Pd:Zn mass ratio [44]. Considering the reduction temperature (300 °C) and Pd:Zn mass ratio (3:1) for which the Pd-Zn/C bimetallic system exhibited the maximum ORR activity, a Pd-Zn/C electrocatalyst with a higher metal loading (21.7 wt.% Pd—7.3 wt.% Zn/C), in the range typically used in PEMFCs, was synthesized via the wet impregnation method and compared concerning the ORR activity in 0.1 M HClO4 with a 29 wt.% Pt/C electrocatalyst synthesized via the same method and a commercial 29 wt.% Pt/C (TKK) electrocatalyst, using the thin-film RDE technique [44]. The highest ORR activity was exhibited by the commercial 29 wt.% Pt/C (TKK) electrocatalyst and the lowest by 21.7 wt.% Pd—7.3 wt.% Zn/C.
Nevertheless, the comparative activity of electrocatalysts as determined using the RDE technique can be different than the comparative performance of the same electrocatalysts during PEMFC operation due to differences in testing conditions, mainly with regard to temperature, transport of electroactive species and MEA preparation [3]. To compare the performance of the aforementioned 21.7 wt.% Pd—7.3 wt.% Zn/C, 29 wt.% Pt/C and 29 wt.% Pt/C (TKK) electrocatalysts under realistic PEMFC conditions, in the present work they were used to prepare cathode electrodes, which were tested in a PEMFC with a commercial PtRu electrode (E-TEK) as anode. PEMFC performance was assessed using polarization measurements and determining the power density as a function of the cell current density. Moreover, since electrochemical impedance spectroscopy (EIS) is a useful technique for understanding differences in fuel cell performance [45], EIS measurements were carried out at selected cell potentials in order to investigate the reasons behind the observed differences in the PEMFC performance when using the aforementioned cathodes.

2. Experimental Details

2.1. Synthesis of the Electrocatalytic Powders

The 21.7 wt.% Pd—7.3 wt.% Zn/C and the 29 wt.% Pt/C electrocatalysts were synthesized via the wet impregnation method [43,44]. In brief, suitable amounts of the corresponding metal precursors, namely palladium(II) chloride (PdCl2, Alfa Aesar, Karlsruhe, Germany), zinc nitrate hexahydrate (Zn(NO3)2·6H2O, Alfa Aesar) and tetraammineplatinum(II) hydroxide ((NH3)4Pt(OH)2, Alfa Aesar), were diluted in triple distilled water under continuous stirring followed by the addition of the appropriate amount of carbon black support (Vulcan XC72R, Cabot, Billerica, MA, USA) at room temperature. The temperature was gradually increased to 70 °C and the suspension remained at this temperature until complete evaporation of H2O. The resulting slurry was dried overnight at 110 °C and the corresponding powder was reduced at 300 °C under H2 flow for 2 h. The 29 wt.% Pt/C (TKK) electrocatalyst was provided by TANAKA Kikinzoku Kogyo K.K. (Lot: 1012-0731).

2.2. Physicochemical Characterization

The synthesized catalytic powders (21.7 wt.% Pd—7.3 wt.% Zn/C, 29 wt.% Pt/C) and the commercial 29 wt.% Pt/C (TKK) catalyst were characterized as it concerns their specific surface area (SSA), using N2 physical adsorption at liquid N2 temperature (BET method), and their structure, using the X-ray diffraction technique (XRD). Relevant details can be found elsewhere [43,44].

2.3. MEA Preparation

The preparation of the anode/electrolyte/cathode assembly (membrane electrode assembly, MEA) was performed in three steps, namely electrodes preparation, electrolyte membrane purification and activation, and, finally, assembling the electrodes with the membrane.

2.3.1. Electrodes Preparation

The three electrocatalysts mentioned above were deposited on commercial carbon cloth material (carbon cloth, E-TEK) to prepare the cathode electrodes. As it concerns the deposition method, the electrocatalytic powder was added in a 1:1 v/v mixture of triple distilled water and 2-propanol (ACS Reag., Merck, Darmstadt, Germany) to form a suspension via ultrasonic mixing for 15 min. This suspension was deposited on the carbon cloth surface using a small paintbrush. The final metal loading of the electrode, which was obtained after successive depositions each followed by drying at 80 °C for ca. 20 min, was 0.5 mgmet cm−2, as determined by weighting the electrode before and immediately after the electrocatalyst deposition. A small amount of Nafion® ionomer solution (5 wt.% Nafion perfluorinated resin solution, Sigma Aldrich, St. Louis, MO, USA) was applied onto the electrocatalytic surface in order to form a thin Nafion film facilitating binding of the cathode electrode to the Nafion membrane. The deposition was performed via paint brushing followed by drying at 80 °C for ca. 20 min and was repeated for three times in order to ensure uniform distribution of the Nafion film over the electrocatalytic surface. The deposited amount of Nafion was equal to ca. 19 mg cm−2, as determined by weighing the electrode before and after Nafion deposition. Nafion solution was also applied onto the commercial PtRu anode electrodes (E-TEK), which consisted of unsupported PtRu electrocatalyst deposited on carbon cloth (0.5 mg cm−2 metal loading). The geometric surface area of both the anode and cathode electrodes was equal to 5.29 cm2 (2.3 cm × 2.3 cm).

2.3.2. Electrolyte Membrane Purification and Activation

The electrolyte was a Nafion® 117 (Dupont) membrane of 185 μm thickness, which was purified/activated as follows: Firstly, the membrane was immersed in a 0.1M H2O2 solution for 1 h at 80 °C. This process was performed twice. Then, it was immersed sequentially in 0.1 M H2SO4 solution for 2 h at 80 °C and in a 0.1 M H2O2 solution, also for 2 h at 80 °C. Finally, the membrane was immersed in triple distilled water for 1 h at 80 °C. After each step, it was washed with triple distilled water.

2.3.3. Assembling the Electrodes with the Membrane

The two electrodes were placed on the opposite sides of the Nafion membrane, with the electrocatalysts facing the membrane. This array was placed between two thermally conducting plates in a heated hydraulic press (Carver, Inc., Wabash, IN, USA). The MEA was heated from room temperature (ca. 25 °C) to 80 °C at a rate equal to 2 °C min−1 and then the temperature was increased to 120 °C at a rate equal to 1 °C min−1. At 120 °C, 1 metric ton-force was applied for 3 min.

2.4. PEMFC Operation

2.4.1. Experimental Apparatus

The measurements were conducted in a commercial single cell fuel cell of ca. 5 cm2 active MEA (NuVant Systems Inc., Phoenixville, PA, USA). The experimental apparatus consisted of the gas feed system, the single cell fuel cell and the analysis unit, as depicted in Scheme 1. High purity gases (100% H2, synthetic air—Air zero, Air Liquide) were fed to the anode (100% H2) and cathode (synthetic air) of the fuel cell at a flow rate of 100 cm3 min−1, after adjusting the flow via mass flow controllers (Aera® FC-7700 with a ROD-4 operating unit, Advanced Energy Industries, Inc., Fort Collins, CO, USA). The gases passed through triple distilled water saturators (humidifiers) at room temperature before entering the fuel cell in order to humidify the membrane and ensure its effective operation. All experiments were performed at room temperature (ca. 25 °C) and not at a higher temperature more pertinent from a technological point of view (e.g., 80 °C) [4,7] mainly as the assessment of the intrinsic ORR activity in acidic medium of the tested cathode electrocatalysts has been performed at room temperature [44]. The analysis system consisted of a potentiostat/galvanostat (Metrohm Autolab PGSTAT128N) connected to a booster module (Metrohm Autolab BSTR10A), allowing measurements of currents up to 10 A. Control of the electrochemical equipment, as well as collection and processing of the experimental data, were carried out using NOVA 1.10 electrochemistry software (Metrohm Autolab, Utrecht, The Netherlands).

2.4.2. Experimental Procedure

After the fuel cell was assembled using the selected MEA it was connected to the gas lines and the flowrate of the feed gases was adjusted to Fanode (100% H2) = Fcathode (synthetic air) = 100 cm3 min−1. Then, to activate the surface of the electrodes, a cell potential of 0.4 V was applied for 4 h, followed by cyclic scans (ca. 100) of the potential between 0 V and 1 V at a rate of 50 mV s−1.
After this pretreatment step, polarization measurements were carried out by applying cell potential values from 1 V to 0 V (short-circuiting), in 50 mV steps, and recording the current. By applying the recorded current values, starting from the highest current to zero current, the same cell potential values were measured, which corroborates the reliability of the polarization measurements.
Following the current–cell potential measurements, the impedance characteristics of the tested PEMFCs were determined using electrochemical impedance spectroscopy (EIS). EIS measurements were carried out over the entire cell potential range, from 1 V to 0 V, in 50 mV steps. Data were obtained in the frequency range 100 kHz to 10 mHz applying a stimulus of 10 mV amplitude; however, data corresponding to inductive branches (mainly at high frequencies) are not shown in the impedance plots presented below as they do not add much to the discussion. It is noted that the appearance of inductive behavior at high frequencies in the impedance spectra of PEMFCs is attributed to the inductance of the electrical cables in the testing system [46,47], whereas the often observed appearance of an inductive loop at very low frequencies has been associated with side reactions and intermediate species in the ORR, formation of platinum oxide with subsequent platinum dissolution, water transport characteristics and related changes in electrolyte membrane hydration, as well as CO poisoning [47,48].
EIS characterization was followed by chronoamperometry measurements to assess the stability of operation of the PEMFC with the 21.7 wt.% Pd—7.3 wt.% Zn/C cathode compared to that of the PEMFC with the commercial 29 wt.% Pt/C (TKK) cathode, as reference. The measurements were carried out by applying a cell potential of 0.4 V for 24 h and recording the current versus time. As the same anode electrode was used, the relative stability of the performance of the compared PEMFCs reflects the relative stability of the corresponding cathode electrodes.

3. Results and Discussion

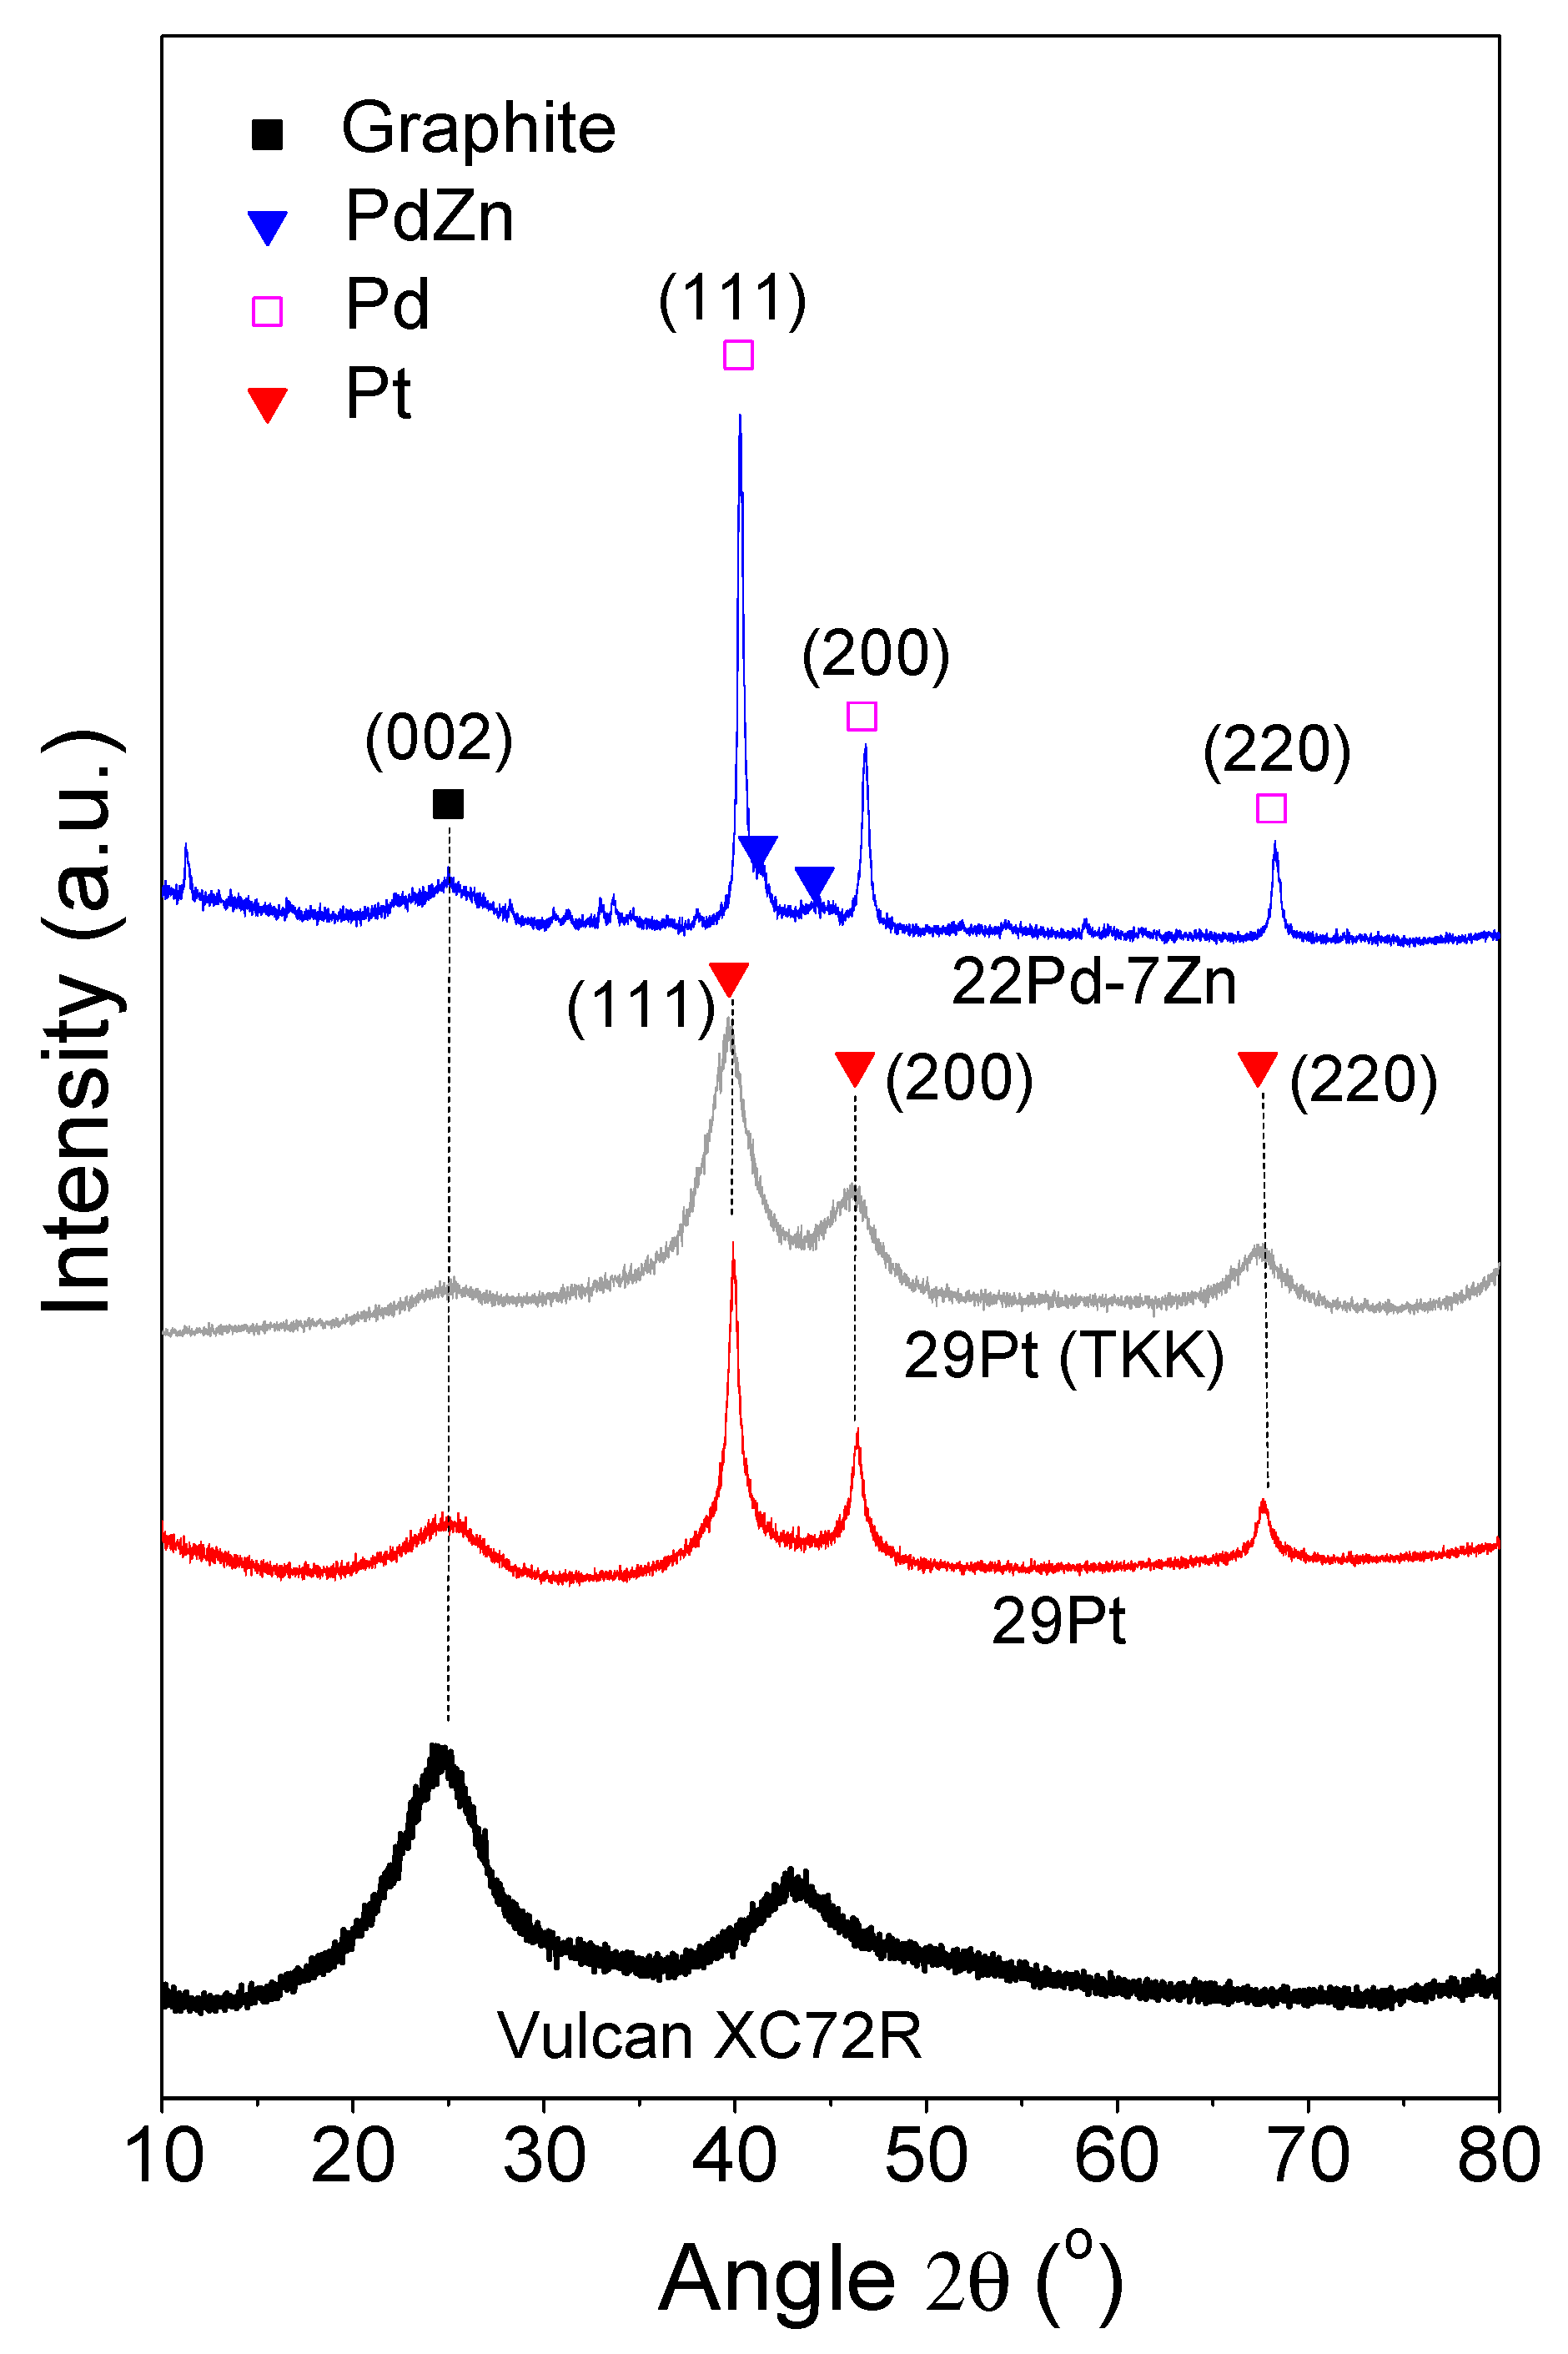
3.1. Physicochemical Characteristics

In a previous work of our group [44] the 21.7 wt.% Pd—7.3 wt.% Zn/C electrocatalyst was characterized concerning its physicochemical properties with a series of methods, including SEM/EDS, TEM/SAED, XRD and BET techniques. Moreover, the 29 wt.% Pt/C and the 29 wt.% Pt/C (TKK) electrocatalysts were also characterized as it concerns their specific surface area (SSA) and structure, applying the BET and XRD technique, respectively. The SSA and metal particle size (as determined by the XRD spectra via the Scherrer equation, thus corresponding to the average primary crystallite size) of the synthesized electrocatalyst powders, as well as their notation used hereafter, are presented in Table 1. The 22Pd—7Zn electrocatalyst exhibited lower SSA than the Pt-based electrocatalysts (by ca. 20% compared to 29Pt), which had similar SSA values. The significant difference in the particle size of the latter electrocatalysts (Table 1) has been found to agree closely with the difference in their electrochemically active surface area (ECSA) observed in a previous study of their ORR activity in 0.1 M HClO4 [44]. In the case of the non-commercial electrocatalytic powders (22Pd—7Zn, 29Pt) the deposition of the metallic phase on the carbon black support resulted in a significant decrease in the SSA value compared to that exhibited by the carbon black (Vulcan XC72R, Cabot) support (216 m2 g−1), which can be attributed to pore blockage of the support by the deposited metal particles [43]. This decrease in SSA was also observed in previous works of our group for corresponding Pd- and Pt-based catalytic systems with smaller metal loading (10 wt.%), which exhibited higher SSA values [43,44,49].
Figure 1 shows the XRD patterns of the synthesized electrocatalytic powders as well as the XRD pattern of the carbon black support. In the case of 22Pd—7Zn, crystallographic peaks attributed to the (111), (200) and (220) planes of Pd fcc crystal structure (JCPDS Card No. 46-1043) were detected at 2θ values equal to 40.0°, 46.6° and 68.0°, respectively. These Pd peaks were slightly shifted (by 0.4°) towards higher 2θ values. Furthermore, two small peaks located at 41.2° and 44.2° corresponding to PdZn alloy phase (JCPDS Card No. 6-620) were identified. The co-presence of alloy PdZn and Pd crystallites in the metal phase has been also evidenced in the case of 7.5 wt.% Pd—2.5 wt.% Zn/C, i.e., for a Pd-Zn/C catalyst with a lower metal loading but practically the same Pd to Zn mass ratio, which was prepared in the same manner (wet impregnation, thermal pretreatment at 300 °C for 2 h in H2 flow) and studied by our group towards its ORR activity in both acidic [43,44] and alkaline [49] medium, applying the thin-film rotating disk electrode (RDE) technique. Concerning the average particle size, an increase was observed for 22Pd—7Zn (8.4 nm) compared to 7.5 wt.% Pd—2.5 wt.% Zn/C (5.1 nm) [43].
For both the 29Pt and 29Pt (TKK) electrocatalysts, XRD peaks located at 39.7°, 46.1° and 67.4° were detected and were attributed to the (111), (200) and (220) crystallographic planes of Pt fcc crystal structure (JCPDS Card No. 1-1190). The same peaks were also detected in the XRD spectrum of a 10 wt.% Pt/C electrocatalyst prepared in the same manner [43], which exhibited a significantly smaller Pt average crystallite size (2.1 nm, [43]) than the higher loading 29 wt.% Pt/C electrocatalyst (10 nm, Table 1) tested in the present work.
In all cases, an XRD peak located at ca. 25° and attributed to the (002) plane of hexagonal graphite (JCPDS Card No. 2-456) was identified, due to the presence of the carbon support.

3.2. PEMFC Electrochemical Measurements

The ORR activity in 0.1 M HClO4 of the 22Pd—7Zn, 29Pt and 29Pt (TKK) electrocatalysts has been assessed using the thin-film RDE technique in a previous work of our group [44]. In the present work, the performances of three H2-fuelled PEMFCs with the same Pt-Ru commercial anode and cathodes prepared using these electrocatalysts, as described above, were compared.

3.2.1. Cathode 29Pt—Anode Pt-Ru (Commercial)

Figure 2 shows the cell potential, Ufc, vs. current density, ifcIfc/Aelec curve, where Ifc is the obtained current and Aelec the geometric electrode surface area (5.29 cm2), and the power density P = ifc Ufc vs. ifc curve for the PEMFC with cathode electrode based on 29Pt. The Ufc vs. ifc curve presents an activation overpotential region, from open circuit up to ca. 0.7 V, and a practically linear region for lower Ufc values (higher currents) where ohmic overpotential becomes significant. The short-circuiting current density (Ufc = 0) is equal to ca. 277 mA cm−2, whereas the maximum power density is ca. 55 mW cm−2, corresponding approximately to ifc = 138 mA cm−2 and Ufc = 0.4 V.
The EIS characteristics of the PEMFC with the 29Pt cathode electrode are presented in Figure 3 in the form of Nyquist plots (Figure 3a–c) and negative phase angle vs. log(frequency f) Bode plots (Figure 3d,e), at different cell potentials. An apparently single process, affected by Ufc, seems to determine the observed EIS characteristics; however, more than one overlapping individual processes are expected to give rise to the observed EIS behavior. The area specific polarization resistance, Rp, corresponding to PEMFC operation can be determined from the Nyquist plots as the difference between the intercepts of the Zre axis with each plot at low and high frequencies. The latter intercept corresponds to the ohmic resistance, RΩ, of the cell, mostly determined by the Nafion electrolytic membrane ionic resistance. As shown in the figure, decreasing cell potential from 1V to 0.5 V results in a significant decrease in Rp whereas the opposite behavior, less pronounced, is observed by further decreasing Ufc from 0.5 to 0 V. As expected, the ohmic resistance, RΩ, of the cell does not depend practically on cell potential, being equal to ca. 1 Ω cm2.
As it concerns the Bode plots, decreasing Ufc from 1 V to 0.5 V (Figure 3d) results in a decrease in the absolute value of the phase angle (by ca. 47°), indicating a less pronounced capacitive behavior of the system, with a parallel shift of the position of the main peak to higher frequencies (Figure 3d). A further decrease in the applied potential from 0.5 to 0 V results in the opposite effect, i.e., an increase in the absolute value of phase angle by ca. 14° with a parallel shift of the peak location to lower frequencies (equal to ca. 3.2 Hz for short-circuiting of the cell) (Figure 3e). This inversion behavior parallels that of the polarization resistance observed in the Nyquist plots (Figure 3a–c).

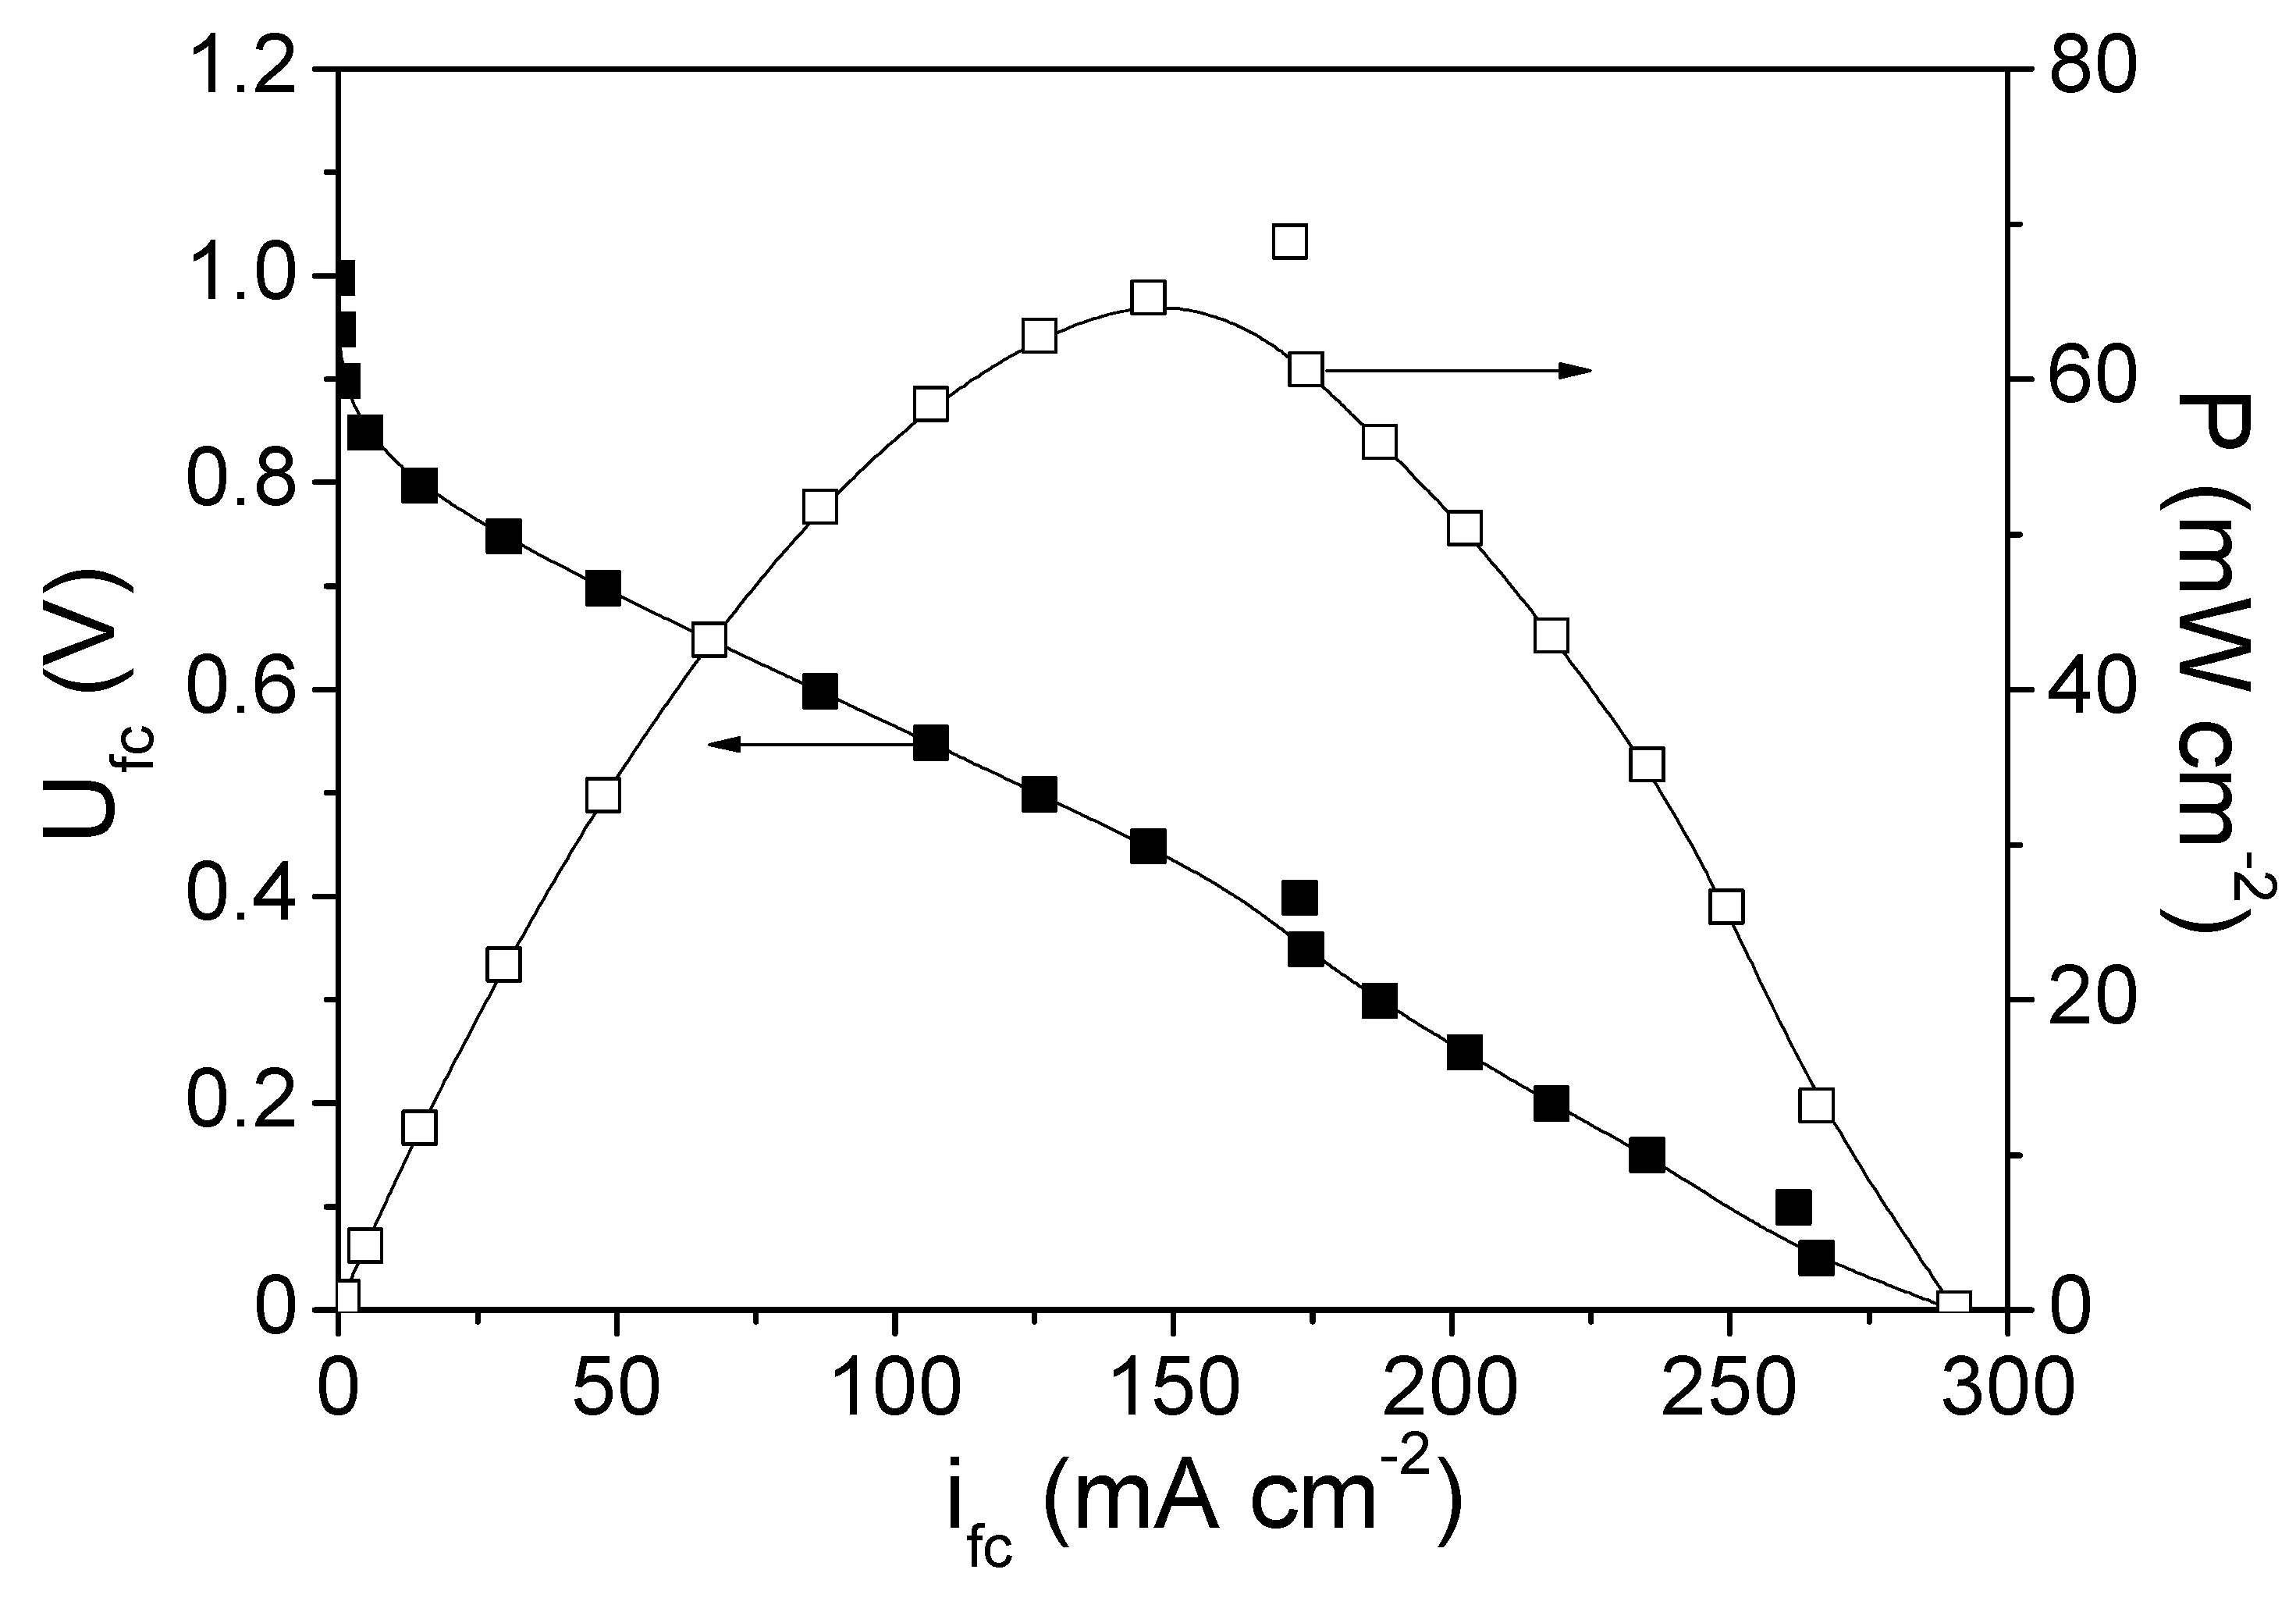
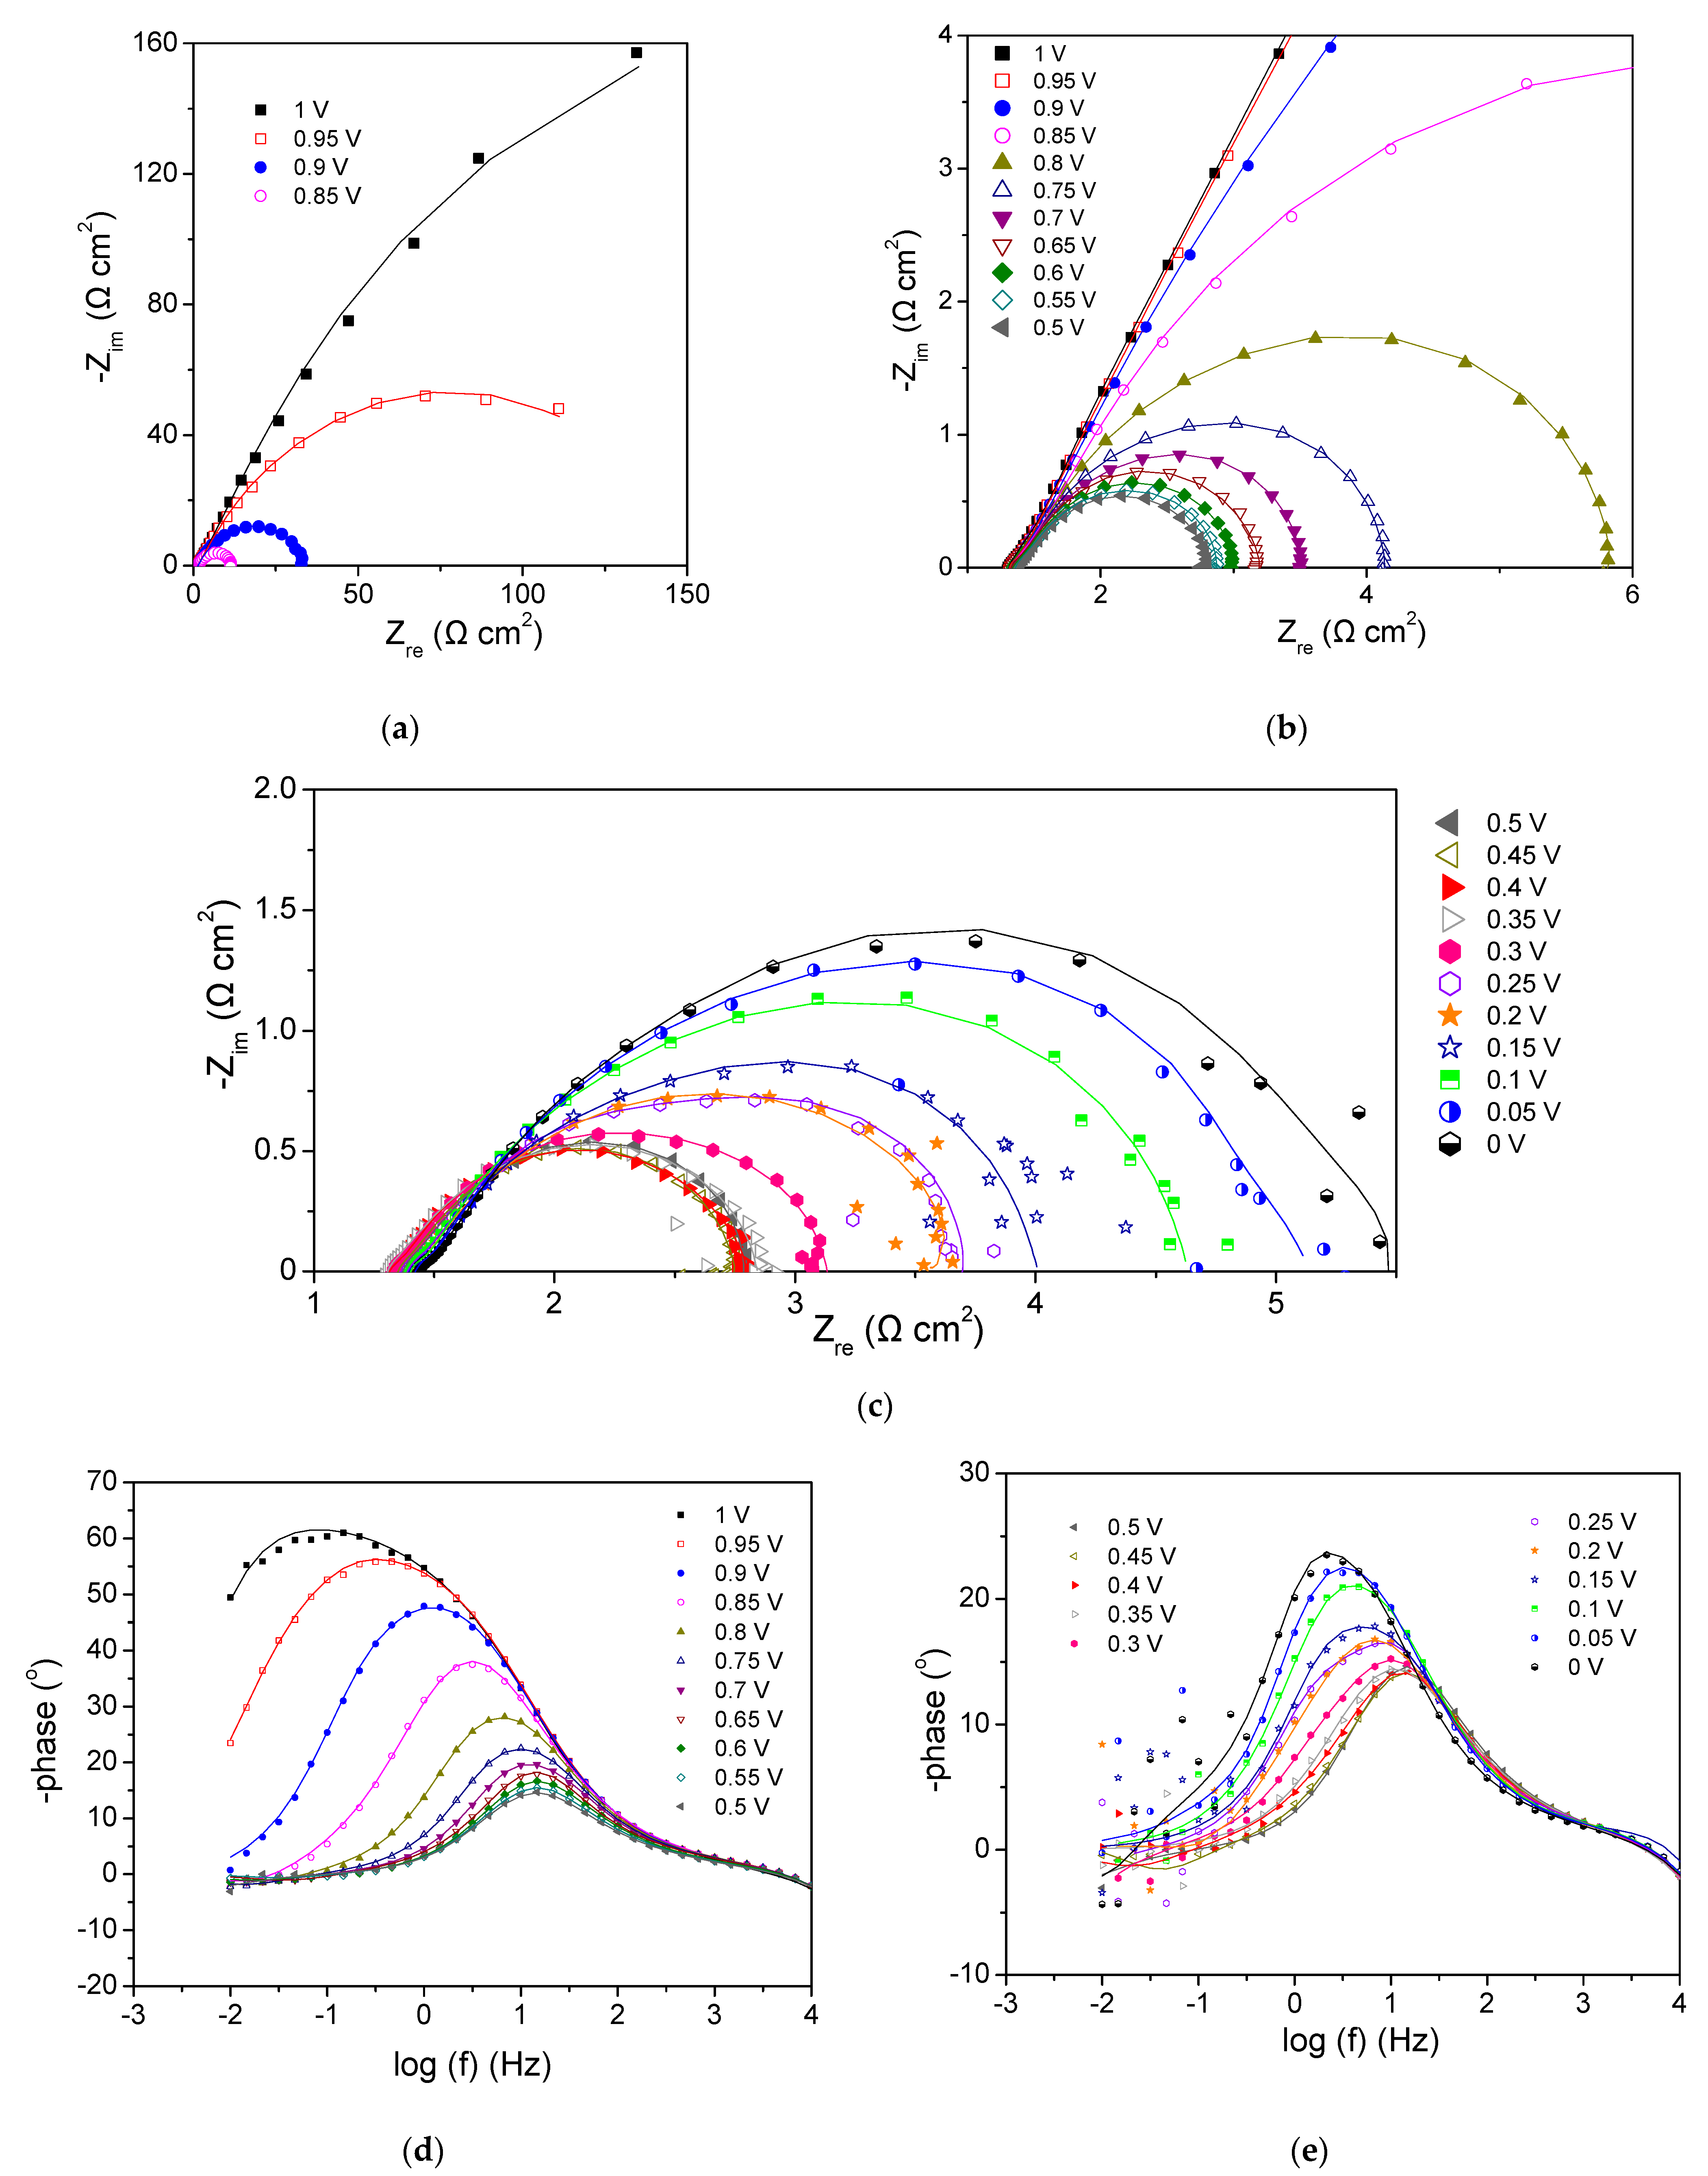
3.2.2. Cathode 22Pd-7Zn—Anode Pt-Ru (Commercial)

Figure 4 shows the cell potential, Ufc, vs. current density, ifc, and the power density P vs. ifc curves for the PEMFC with cathode electrode based on 22Pd—7Zn. The Ufc vs. ifc curve presents an activation overpotential region, from open circuit up to ca. 0.4 V, and a practically linear region for lower Ufc values (higher currents) where ohmic overpotential is significant. The short-circuiting current density (Ufc = 0) is equal to ca. 141 mA cm−2, whereas the maximum power density is ca. 16 mW cm−2, corresponding approximately to ifc = 80 mA cm−2 and Ufc = 0.2 V.
The EIS characteristics of the PEMFC with the 22Pd—7Zn cathode electrode are presented in Figure 5 in the form of Nyquist plots (Figure 5a–c) and negative phase angle vs. log (frequency f) Bode plots (Figure 5d,e), at different cell potentials. As in the case of the PEMFC with the 29Pt cathode electrode, an apparently single process, affected by Ufc, seems to determine the observed EIS characteristics. As shown in the Nyquist plots (Figure 5a–c), decreasing cell potential from 0.95 V to 0.15 V results in a significant decrease in Rp whereas by further decreasing Ufc from 0.15 to 0 V a comparatively small increase in Rp is observed. As expected, the ohmic resistance, RΩ, of the cell is practically not affected by the cell potential, being equal to ca. 0.05 Ω cm2.
As shown in the Bode plots in Figure 5d,e, which are qualitatively similar to those for the PEMFC with the 29 Pt cathode electrode, decreasing Ufc from 1 V to 0.15 V results in a decrease in the absolute value of the phase angle (from ca. 77° to 25°), which indicates that the capacitive behavior of the system becomes less pronounced, whereas there is a parallel shift of the location of the main peak to higher frequencies, from ca. 0.03 Hz to 10 Hz. A further decrease in the applied potential from 0.15 to 0 V results in a slight increase in the absolute value of phase angle by a few degrees with a parallel small shift of the peak location to lower frequencies (Figure 5e). This behavior parallels the observed inversion behavior of the polarization resistance (Figure 5a–c).

3.2.3. Cathode 29Pt (TKK)—Anode Pt-Ru (Commercial)

Figure 6 shows the cell potential, Ufc, vs. current density, ifc, and the power density P vs. ifc curves for the PEMFC with cathode electrode based on 29Pt (TKK). The Ufc vs. ifc curve presents an activation overpotential region, from open circuit up to ca. 0.8 V, and a practically linear region for lower Ufc values were ohmic overpotential is significant. The short-circuiting current density (Ufc = 0) is equal to ca. 290 mA cm−2, whereas the maximum power density is ca. 66 mW cm−2, corresponding approximately to ifc = 146 mA cm−2 and Ufc = 0.45 V.
The EIS characteristics of the PEMFC with the 29Pt(TKK) cathode electrode are presented in Figure 7 in the form of Nyquist plots (Figure 7a–c) and negative phase angle vs. log (frequency f) Bode plots (Figure 7d,e), at different cell potentials. As in the case of the other two tested PEMFCs, an apparently single process, affected by Ufc, seems to determine the observed EIS characteristics. As shown in the Nyquist plots (Figure 7a–c), decreasing cell potential from 1 V to 0.4 V results in a significant decrease in Rp whereas by further decreasing Ufc from 0.4 to 0 V an increase in Rp is observed. Expectedly, the ohmic resistance, RΩ, of the cell is practically not affected by the cell potential, ranging between ca. 1.3 and 1.4 Ω cm2 (Figure 7b,c).
As shown in the Bode plots in Figure 7d,e, which are qualitatively similar to those for the other two tested PEMFCs, decreasing Ufc from 1 V to 0.4 V results in a decrease in the absolute value of the phase angle (from ca. 61° to 14°), indicating that the capacitive behavior of the system becomes less pronounced, whereas there is a parallel shift of the location of the main peak to higher frequencies, from ca. 0.1 Hz to 16 Hz. A further decrease in the applied potential from 0.4 to 0 V results in a slight increase in the absolute value of phase angle by ca. 10° with a parallel small shift of the peak location to lower frequencies (ca. 2.2 Hz for Ufc = 0 V). This behavior parallels the observed inversion behavior of Rp (Figure 7a–c).

3.2.4. Comparison of the Tested PEMFCs with the Different Cathode Electrodes

In Figure 8a,b the cell potential (Ufc) vs. current density (ifc) curves and the power density (P) vs. current density (ifc) curves for the tested PEMFCs are compared, respectively. As shown in Figure 8a, the lowest overpotential over the entire range of operation potentials was exhibited by the PEMFC with the 29Pt (TKK) cathode electrode, which exhibited also the highest value of short-circuiting current density, equal to ca. 290 mA cm−2, compared to 277 mA cm−2 and 141 mA cm−2 for the PEMFCs with the 29Pt and 22Pd—7Zn cathode electrodes, respectively. The maximum power density for the PEMFCs with the 29Pt (TKK) and 29Pt cathode electrodes was equal to ca. 66 mW cm−2 and 55 mW cm−2, respectively, approximately four times higher than that for the PEMFC with the 22Pd—7Zn cathode electrode, which was equal to ca. 16 mW cm−2 (Figure 8b). The increase in maximum power was accompanied with a shift of the peak in the power vs. current curve to higher current and higher cell potential (lower overpotential) values. For the same current, the power density for the PEMFC with the 29Pt (TKK) cathode electrode was the highest (Figure 8b), followed by that for the PEMFC with the 29Pt cathode electrode (maximum difference up to ca. 12 mW cm−2). It is noted that the measured power densities in the present work are low compared to those for state-of-the-art PEMFCs [13], which can be explained by the fact that the tested PEMFCs were not optimized in terms of components, construction and operating conditions.
As shown in Figure 8a, as well as in Figure 2, Figure 4 and Figure 6, no limiting current was observed in the polarization curves of the tested PEMFCs, which implies that mass transport did not become the rate limiting step of the process in the high current region, even near zero cell potential. This can be explained considering that the ohmic and activation losses also contribute to the overall cell losses in this region [50]. The almost linear shape of the polarization curve in the high current region is indicative of the significance of ohmic losses, which are probably mainly associated with the Nafion® 117 membrane without excluding ohmic losses in other components of the cell [50,51]. The activation losses are expected to be practically equal to the cathode activation losses due to the much slower kinetics of ORR compared to HOR in acidic environment [50,51]. As corroborated by the EIS results, these losses also continue to be significant in the high current region, which can be attributed to low activity of the tested cathodes [50,51].
The aforementioned difference in the performance of the three tested PEMFCs is in agreement with the results of the EIS measurements. As discussed above and also shown in Figure 8c where are compared Nyquist plots obtained for the three PEMFCs at 0.5 V, the EIS characteristics of the PEMFCs with the different cathode electrodes were qualitatively similar, whereas a similar behavior was observed concerning the effect of cell potential on apparent polarization resistance Rp and on capacitive characteristics of the PEMFC (Figure 3, Figure 5 and Figure 7). The observed minimum in Rp with decreasing Ufc (Figure 8d) has been also observed in earlier studies of EIS characterization of PEMFCs (single cells and stacks) [52,53,54,55] and can be explained considering the relative contribution of activation and mass transfer limitations on the apparent polarization resistance. The decrease in Rp with increasing overpotential, starting from open circuit, is mainly associated with the acceleration of the kinetics of the ORR, as also reflected in the decreasing absolute value of the slope of the cell voltage vs. current curves (Figure 2, Figure 4, Figure 6 and Figure 8a). At higher overpotentials, beyond a certain value that depends on cathode electrocatalyst, the cathodic reaction becomes progressively controlled by mass transport, which results in a gradual, comparatively less pronounced, increase in polarization resistance. This rather complicated mass transport limitation effect has been related to gas phase diffusion of oxygen, for operation with air, as well as to increased production of water and flow from the interior of the cathode [52]. The fact that the inversion in the dependence of Rp on Ufc is observed at a higher overpotential for the intrinsically less active 22Pd—7Zn electrocatalyst [44] (Figure 8d) supports the aforementioned explanation.
Despite the qualitative similar impedance behavior of the tested PEMFCs, the differences in polarization resistance Rp, for the same cell potential, were significant. As shown in Figure 8d, the PEMFC with the 22Pd—7Zn cathode electrode exhibited much larger polarization resistance than the other two tested PEMFCs for cell potentials larger than ca. 0.2 V, whereas for lower cell potential values similar Rp values were determined. The latter can be explained by an increasing contribution of the ohmic and mass transfer effects in this high overpotential region, which can mask differences in polarization resistance associated with the different cathode electrocatalysts. The PEMFCs with the 29Pt and 29Pt (TKK) cathode electrodes had similar polarization resistances (Figure 8d), which can explain why the corresponding maximum power values did not differ significantly.
It is noted that the ohmic resistance RΩ of the three PEMFCs, which ranged between ca. 0.85 and 1.4 Ω cm2, was lower than the polarization resistance Rp (Figure 3a–c, Figure 5a–c and Figure 7a–c) over the entire Ufc range. As RΩ was practically constant, the highest RΩ/Rp ratio corresponded to the minimum Rp value for each of the tested cells, being equal to ca. 0.9, 0.75 and 0.25 for the cells with the 29Pt (TKK), 29Pt and 22Pd—7Zn cathode electrodes, respectively. The highest ohmic resistance was exhibited by the PEMFC with the 29Pt (TKK) cathode, which was ca. 45% and 65% higher than that for the PEMFCs with the 29Pt and 22Pd—7Zn cathode electrodes, respectively.
Figure 8e shows for the three tested PEMFCs and at different cell potentials the summit frequencies, fsummit, i.e., the frequencies corresponding to the maximum values of –Zim in the Nyquist plots. Interestingly, flat maxima are observed in the fsummit vs. Ufc plots, in cell potential regions that include the potential where inversion in the dependence of Rp on Ufc was observed for each of the tested PEMFC (Figure 8d). It is also noted that the higher maximum fsummit values for the PEMFCs with the Pt-based cathodes compared to the PEMFC with the 22Pd—7Zn cathode, which are in general associated with lower characteristic times of the underlying processes, are in agreement with the inferior performance exhibited by the latter PEMFC.
In view of the fact that the two PEMFCs with the Pt-based cathode electrodes did not show large difference in performance (Figure 8a,b), the stability of the PEMFC with the 22Pd—7Zn cathode is compared in Figure 8f with that of the PEMFC with the commercial 29Pt (TKK) cathode, as reference. As shown in the figure, during 24 h of continuous operation at 0.4 V a less than 6% decrease in cell current density was observed for the latter PEMFC whereas, interestingly, for the PEMFC with the 22Pd—7Zn cathode an increase in the current density (by ca. 1.5 times) was observed. This could imply an improvement of the polarization characteristics of the 22Pd—7Zn cathode electrode, which would be interesting to investigate in the future.
As the three compared PEMFCs were constructed in the same manner and differed only in the cathode electrocatalyst, it is possible that the inferior intrinsic ORR activity of 22Pd—7Zn/C compared to 29Pt (TKK)/C and 29Pt/C [44] is the main reason for the observed inferior performance of the PEMFC with the 22Pd—7Zn cathode electrode compared to the performances of the PEMFCs with the Pt-based electrodes. However, the electrocatalyst layer morphology resulting from the deposition of the catalyst ink on the carbon cloth surface may also play a role, mainly associated with different ECSA values of the compared cathodes, and thus, a different degree of utilization of the active metal sites for the same metal loading of the electrodes (possibly lower for the 22Pd—7Zn/C electrode), but also with different mass transport characteristics inside the catalysts layer [50,56,57].

4. Conclusions

The performance of a PEMFC cathode electrode that was prepared by depositing on carbon cloth (E-TEK) a 21.7 wt.% Pd—7.3 wt.% Zn/C electrocatalyst synthesized via wet impregnation was compared with the performance of two Pt-cathode electrodes prepared in the same manner using a 29 wt.% Pt/C electrocatalyst, synthesized similarly via wet impregnation, and a commercial 29 wt.% Pt/C (TKK) electrocatalyst. Comparison was based on the performance of single cell H2-fuelled PEMFCs of 5.29 cm2 active MEA, with Nafion® 117 (Dupont) electrolyte, constructed using the aforementioned cathode electrodes and the same commercial PtRu anode electrode (0.5 mgmet cm−2, E-TEK). The maximum electric power density obtained for the PEMFC with the 22Pd—7Zn cathode electrode was equal to 16 mW cm−2, ca. four times lower than that for the PEMFCs with 29Pt (TKK) and 29Pt cathode electrodes, which was ca. 66 mW cm−2 and 57 mW cm−2, respectively. Over the entire range of PEMFCs operation potentials, the overpotential developed in the PEMFC with the 22Pd—7Zn cathode electrode was the highest, whereas for the same current the power density was the lowest. This behavior is in agreement with the results of EIS measurements, which revealed similar qualitative EIS characteristics for the three tested PEMFCs but a significantly higher apparent polarization resistance for the PEMFC with the 22Pd—7Zn cathode, for cell potentials higher than 0.2 V. Chronoamperometry measurements conducted at 0.4 V for 24 h showed an increase in the current density (by ca. 1.5 times) for the PEMFC with the 22Pd—7Zn cathode, whereas the PEMFC with the 29Pt (TKK) cathode, which was used as reference, showed a more stable behavior corresponding to a less than 6% decrease in current density. The observed inferior performance of the PEMFC with 21.7 wt.% Pd—7.3 wt.% Zn/C cathode compared to that of the PEMFCs with Pt-based cathodes is in agreement with the order of ORR activity in 0.1 M HClO4 of the corresponding electrocatalysts determined via the thin-film RDE technique in a previous work of our group [44].

Author Contributions

Conceptualization, G.B. and S.B.; methodology, G.B. and S.B.; investigation, G.B.; writing—original draft preparation, G.B. and S.B.; writing—review and editing, G.B. and S.B.; supervision, S.B. All authors have read and agreed to the published version of the manuscript.

Funding

This research received no external funding.

Data Availability Statement

Any data not presented in the manuscript are available upon reasonable written request from the corresponding author.

Conflicts of Interest

The authors declare no conflict of interest.

References

  1. Acar, C.; Dincer, I. Review and evaluation of hydrogen production options for better environment. J. Clean. Prod. 2019, 218, 835–849. [Google Scholar] [CrossRef]
  2. Jiao, K.; Xuan, J.; Du, Q.; Bao, Z.; Xie, B.; Wang, B.; Zhao, Y.; Fan, L.; Wang, H.; Hou, Z.; et al. Designing the next generation of proton-exchange membrane fuel cells. Nature 2021, 595, 361–369. [Google Scholar] [CrossRef] [PubMed]
  3. Sun, Y.; Polani, S.; Luo, F.; Ott, S.; Strasser, P.; Dionigi, F. Advancements in cathode catalyst and cathode layer design for proton exchange membrane fuel cells. Nat. Commun. 2021, 12, 5984. [Google Scholar] [CrossRef] [PubMed]
  4. Hua, Z.; Zheng, Z.; Pahon, E.; Péra, M.-C.; Gao, F. A review on lifetime prediction of proton exchange membrane fuel cells system. J. Power Sources 2022, 529, 231256. [Google Scholar] [CrossRef]
  5. Miller, E.L.; Thompson, S.T.; Randolph, K.; Hulvey, Z.; Rustagi, N.; Satyapal, S. US Department of Energy hydrogen and fuel cell technologies perspectives. MRS Bull. 2020, 45, 57–64. [Google Scholar] [CrossRef]
  6. Cigolotti, V.; Genovese, M.; Fragiacomo, P. Comprehensive Review on Fuel Cell Technology for Stationary Applications as Sustainable and Efficient Poly-Generation Energy Systems. Energies 2021, 14, 4963. [Google Scholar] [CrossRef]
  7. Nguyen, H.Q.; Shabani, B. Proton exchange membrane fuel cells heat recovery opportunities for combined heating/cooling and power applications. Energy Convers. Manag. 2020, 204, 112328. [Google Scholar] [CrossRef]
  8. Wang, Y.; Ruiz Diaz, D.F.; Chen, K.S.; Wang, Z.; Adroher, X.C. Materials, technological status, and fundamentals of PEM fuel cells—A review. Mater. Today 2020, 32, 178–203. [Google Scholar] [CrossRef]
  9. Barbir, F. Fuel Cell Applications. In PEM Fuel Cells: Theory and Practice, 2nd ed.; Elsevier/Academic Press: Waltham, MA, USA, 2013; pp. 373–434. [Google Scholar]
  10. Fuel Cells and Hydrogen 2 Joint Undertaking (FCH 2 JU). 2019 Annual Work Plan and Budget (FCH 2 JU, 2018). Available online: https://ec.europa.eu/research/participants/data/ref/h2020/other/wp/jtis/h2020-wp19-fch_en.pdf (accessed on 3 July 2022).
  11. U.S. Department of Energy. Automotive Fuel Cell Targets and Status. DOE Hydrogen and Fuel Cells Program Record #20005. 31 August 2020. Available online: https://www.hydrogen.energy.gov/pdfs/20005-automotive-fuel-cell-targets-status.pdf (accessed on 3 July 2022).
  12. Xu, Z.; Qiu, D.; Yi, P.; Peng, L.; Lai, X. Towards mass applications: A review on the challenges and developments in metallic bipolar plates for PEMFC. Prog. Nat. Sci. Mater. Int. 2020, 30, 815–824. [Google Scholar] [CrossRef]
  13. DOE Technical Targets for Polymer Electrolyte Membrane Fuel Cell Components. 2019. Available online: https://www.energy.gov/eere/fuelcells/doe-technical-targets-polymer-electrolyte-membrane-fuel-cell-components (accessed on 3 July 2022).
  14. Al-Zoubi, T.; Zhou, Y.; Yin, X.; Janicek, B.; Sun, C.; Schulz, C.E.; Zhang, X.; Gewirth, A.A.; Huang, P.; Zelenay, P.; et al. Preparation of Nonprecious Metal Electrocatalysts for the Reduction of Oxygen Using a Low-Temperature Sacrificial Metal. J. Am. Chem. Soc. 2020, 142, 5477–5481. [Google Scholar] [CrossRef]
  15. Wan, X.; Liu, X.; Li, Y.; Yu, R.; Zheng, L.; Yan, W.; Wang, H.; Xu, M.; Shui, J. Fe–N–C electrocatalyst with dense active sites and efficient mass transport for high-performance proton exchange membrane fuel cells. Nat. Catal. 2019, 2, 259–268. [Google Scholar] [CrossRef]
  16. Chen, M.-X.; Zhu, M.; Zuo, M.; Chu, S.-Q.; Zhang, J.; Wu, Y.; Liang, H.-W.; Feng, X. Identification of Catalytic Sites for Oxygen Reduction in Metal/Nitrogen-Doped Carbons with Encapsulated Metal Nanoparticles. Angew. Chem. Int. Ed. 2020, 59, 1627–1633. [Google Scholar] [CrossRef]
  17. Zhang, Z.; Sun, J.; Wang, F.; Dai, L. Efficient Oxygen Reduction Reaction (ORR) Catalysts Based on Single Iron Atoms Dispersed on a Hierarchically Structured Porous Carbon Framework. Angew. Chem. Int. Ed. 2018, 57, 9038–9043. [Google Scholar] [CrossRef]
  18. Yang, L.; Cheng, D.; Xu, H.; Zeng, X.; Wan, X.; Shui, J.; Xiang, Z.; Cao, D. Unveiling the high-activity origin of single-atom iron catalysts for oxygen reduction reaction. Proc. Natl. Acad. Sci. USA 2018, 115, 6626–6631. [Google Scholar] [CrossRef] [PubMed]
  19. Wang, X.X.; Cullen, D.A.; Pan, Y.-T.; Hwang, S.; Wang, M.; Feng, Z.; Wang, J.; Engelhard, M.H.; Zhang, H.; He, Y.; et al. Nitrogen-Coordinated Single Cobalt Atom Catalysts for Oxygen Reduction in Proton Exchange Membrane Fuel Cells. Adv. Mater. 2018, 30, 1706758. [Google Scholar] [CrossRef]
  20. Hu, B.-C.; Wu, Z.-Y.; Chu, S.-Q.; Zhu, H.-W.; Liang, H.-W.; Zhang, J.; Yu, S.-H. SiO2-protected shell mediated templating synthesis of Fe–N-doped carbon nanofibers and their enhanced oxygen reduction reaction performance. Energy Environ. Sci. 2018, 11, 2208–2215. [Google Scholar] [CrossRef]
  21. Zhang, H.; Hwang, S.; Wang, M.; Feng, Z.; Karakalos, S.; Luo, L.; Qiao, Z.; Xie, X.; Wang, C.; Su, D.; et al. Single Atomic Iron Catalysts for Oxygen Reduction in Acidic Media: Particle Size Control and Thermal Activation. J. Am. Chem. Soc. 2017, 139, 14143–14149. [Google Scholar] [CrossRef]
  22. Liu, Q.; Liu, X.; Zheng, L.; Shui, J. The Solid-Phase Synthesis of an Fe-N-C Electrocatalyst for High-Power Proton-Exchange Membrane Fuel Cells. Angew. Chem. Int. Ed. 2018, 57, 1204–1208. [Google Scholar] [CrossRef]
  23. Chung, H.T.; Cullen, D.A.; Higgins, D.; Sneed, B.T.; Holby, E.F.; More, K.L.; Zelenay, P. Direct atomic-level insight into the active sites of a high-performance PGM-free ORR catalyst. Science 2017, 357, 479–484. [Google Scholar] [CrossRef]
  24. Han, Y.; Wang, Y.-G.; Chen, W.; Xu, R.; Zheng, L.; Zhang, J.; Luo, J.; Shen, R.-A.; Zhu, Y.; Cheong, W.-C.; et al. Hollow N-Doped Carbon Spheres with Isolated Cobalt Single Atomic Sites: Superior Electrocatalysts for Oxygen Reduction. J. Am. Chem. Soc. 2017, 139, 17269–17272. [Google Scholar] [CrossRef]
  25. Shen, H.; Gracia-Espino, E.; Ma, J.; Zang, K.; Luo, J.; Wang, L.; Gao, S.; Mamat, X.; Hu, G.; Wagberg, T.; et al. Synergistic Effects between Atomically Dispersed Fe−N−C and C−S−C for the Oxygen Reduction Reaction in Acidic Media. Angew. Chem. Int. Ed. 2017, 56, 13800–13804. [Google Scholar] [CrossRef] [PubMed]
  26. Fu, X.; Zamani, P.; Choi, J.-Y.; Hassan, F.M.; Jiang, G.; Higgins, D.C.; Zhang, Y.; Hoque, M.A.; Chen, Z. In Situ Polymer Graphenization Ingrained with Nanoporosity in a Nitrogenous Electrocatalyst Boosting the Performance of Polymer-Electrolyte-Membrane Fuel Cells. Adv. Mater. 2017, 29, 1604456. [Google Scholar] [CrossRef] [PubMed]
  27. Gan, L.; Heggen, M.; Rudi, S.; Strasser, P. Core–Shell Compositional Fine Structures of Dealloyed PtxNi1–x Nanoparticles and Their Impact on Oxygen Reduction Catalysis. Nano Lett. 2012, 12, 5423–5430. [Google Scholar] [CrossRef] [PubMed]
  28. Stamenkovic, V.R.; Mun, B.S.; Arenz, M.; Mayrhofer, K.J.J.; Lucas, C.A.; Wang, G.; Ross, P.N.; Markovic, N.M. Trends in electrocatalysis on extended and nanoscale Pt-bimetallic alloy surfaces. Nat. Mater. 2007, 6, 241–247. [Google Scholar] [CrossRef]
  29. Han, B.; Carlton, C.E.; Kongkanand, A.; Kukreja, R.S.; Theobald, B.R.; Gan, L.; O’Malley, R.; Strasser, P.; Wagner, F.T.; Shao-Horn, Y. Record activity and stability of dealloyed bimetallic catalysts for proton exchange membrane fuel cells. Energy Environ. Sci. 2015, 8, 258–266. [Google Scholar] [CrossRef]
  30. Escudero-Escribano, M.; Malacrida, P.; Hansen, M.H.; Vej-Hansen, U.G.; Velázquez-Palenzuela, A.; Tripkovic, V.; Schiøtz, J.; Rossmeisl, J.; Stephens, I.E.L.; Chorkendorff, I. Tuning the activity of Pt alloy electrocatalysts by means of the lanthanide contraction. Science 2016, 352, 73–76. [Google Scholar] [CrossRef]
  31. Schwämmlein, J.N.; Harzer, G.S.; Pfändner, P.; Blankenship, A.; El-Sayed, H.A.; Gasteiger, H.A. Activity and Stability of Carbon Supported PtxY Alloys for the ORR Determined by RDE and Single-Cell PEMFC Measurements. J. Electrochem. Soc. 2018, 165, J3173–J3185. [Google Scholar] [CrossRef]
  32. Greeley, J.; Stephens, I.E.L.; Bondarenko, A.S.; Johansson, T.P.; Hansen, H.A.; Jaramillo, T.F.; Rossmeisl, J.; Chorkendorff, I.; Nørskov, J.K. Alloys of platinum and early transition metals as oxygen reduction electrocatalysts. Nat. Chem. 2009, 1, 552–556. [Google Scholar] [CrossRef]
  33. Mavrikakis, M.; Hammer, B.; Nørskov, J.K. Effect of strain on the reactivity of metal surfaces. Phys. Rev. Lett. 1998, 81, 2819–2822. [Google Scholar] [CrossRef]
  34. Strasser, P.; Koh, S.; Anniyev, T.; Greeley, J.; More, K.; Yu, C.; Liu, Z.; Kaya, S.; Nordlund, D.; Ogasawara, H.; et al. Lattice-strain control of the activity in dealloyed core–shell fuel cell catalysts. Nat. Chem. 2010, 2, 454–460. [Google Scholar] [CrossRef]
  35. Hoster, H.E.; Alves, O.B.; Koper, M.T.M. Tuning Adsorption via Strain and Vertical Ligand Effects. ChemPhysChem 2010, 11, 1518–1524. [Google Scholar] [CrossRef]
  36. Kitchin, J.R.; Nørskov, J.K.; Barteau, M.A.; Chen, J.G. Modification of the surface electronic and chemical properties of Pt(111) by subsurface 3d transition metals. J. Chem. Phys. 2004, 120, 10240–10246. [Google Scholar] [CrossRef]
  37. Liu, P.; Nørskov, J.K. Ligand and ensemble effects in adsorption on alloy surfaces. Phys. Chem. Chem. Phys. 2001, 3, 3814–3818. [Google Scholar] [CrossRef]
  38. Antolini, E.; Zignani, S.C.; Santos, S.F.; Gonzalez, E.R. Palladium-based electrodes: A way to reduce platinum content in polymer electrolyte membrane fuel cells. Electrochim. Acta 2011, 56, 2299–2305. [Google Scholar] [CrossRef]
  39. Fernández, J.L.; Walsh, D.A.; Bard, A.J. Thermodynamic Guidelines for the Design of Bimetallic Catalysts for Oxygen Electroreduction and Rapid Screening by Scanning Electrochemical Microscopy. M−Co (M:  Pd, Ag, Au). J. Am. Chem. Soc. 2005, 127, 357–365. [Google Scholar] [CrossRef]
  40. Shao, M.H.; Huang, T.; Liu, P.; Zhang, J.; Sasaki, K.; Vukmirovic, M.B.; Adzic, R.R. Palladium Monolayer and Palladium Alloy Electrocatalysts for Oxygen Reduction. Langmuir 2006, 22, 10409–10415. [Google Scholar] [CrossRef]
  41. Shao, M.-H.; Sasaki, K.; Adzic, R.R. Pd−Fe Nanoparticles as Electrocatalysts for Oxygen Reduction. J. Am. Chem. Soc. 2006, 128, 3526–3527. [Google Scholar] [CrossRef]
  42. Zhang, L.; Chang, Q.; Chen, H.; Shao, M. Recent advances in palladium-based electrocatalysts for fuel cell reactions and hydrogen evolution reaction. Nano Energy 2016, 29, 198–219. [Google Scholar] [CrossRef]
  43. Bampos, G.; Bebelis, S.; Kondarides, D.I.; Verykios, X. Comparison of the Activity of Pd–M (M: Ag, Co, Cu, Fe, Ni, Zn) Bimetallic Electrocatalysts for Oxygen Reduction Reaction. Top. Catal. 2017, 60, 1260–1273. [Google Scholar] [CrossRef]
  44. Bampos, G.; Kondarides, D.I.; Bebelis, S. Pd–Zn/C bimetallic electrocatalysts for oxygen reduction reaction. J. Appl. Electrochem. 2018, 48, 675–689. [Google Scholar] [CrossRef]
  45. Tang, Z.; Huang, Q.-A.; Wang, Y.-J.; Zhang, F.; Li, W.; Li, A.; Zhang, L.; Zhang, J. Recent progress in the use of electrochemical impedance spectroscopy for the measurement, monitoring, diagnosis and optimization of proton exchange membrane fuel cell performance. J. Power Sources 2020, 468, 228361. [Google Scholar] [CrossRef]
  46. Cruz-Manzo, S.; Chen, R.; Rama, P. Inductive Effect on the Fuel Cell Cathode Impedance Spectrum at High Frequencies. J. Fuel Cell Sci. Technol. 2012, 9, 051002. [Google Scholar] [CrossRef]
  47. Pivac, I.; Barbir, F. Inductive phenomena at low frequencies in impedance spectra of proton exchange membrane fuel cells—A review. J. Power Sources 2016, 326, 112–119. [Google Scholar] [CrossRef]
  48. Schiefer, A.; Heinzmann, M.; Weber, A. Inductive Low-Frequency Processes in PEMFC-Impedance Spectra. Fuel Cells 2020, 20, 499–506. [Google Scholar] [CrossRef]
  49. Bampos, G.; Sygellou, L.; Bebelis, S. Oxygen reduction reaction activity of Pd-based bimetallic electrocatalysts in alkaline medium. Catal. Today 2020, 355, 685–697. [Google Scholar] [CrossRef]
  50. Mench, M.M. Performance Characterization of Fuel Cell Systems. In Fuel Cell Engines; John Wiley & Sons, Inc.: Hoboken, NJ, USA, 2008; pp. 121–190. [Google Scholar]
  51. Arif, M.; Cheung, S.C.P.; Andrews, J. A systematic approach for matching simulated and experimental polarization curves for a PEM fuel cell. Int. J. Hydrogen Energy 2020, 45, 2206–2223. [Google Scholar] [CrossRef]
  52. Fischer, A.; Jindra, J.; Wendt, H. Porosity and catalyst utilization of thin layer cathodes in air operated PEM-fuel cells. J. Appl. Electrochem. 1998, 28, 277–282. [Google Scholar] [CrossRef]
  53. Asghari, S.; Mokmeli, A.; Samavati, M. Study of PEM fuel cell performance by electrochemical impedance spectroscopy. Int. J. Hydrogen Energy 2010, 35, 9283–9290. [Google Scholar] [CrossRef]
  54. Yuan, X.; Sun, J.C.; Blanco, M.; Wang, H.; Zhang, J.; Wilkinson, D.P. AC impedance diagnosis of a 500 W PEM fuel cell stack: Part I: Stack impedance. J. Power Sources 2006, 161, 900–928. [Google Scholar] [CrossRef]
  55. Yuan, X.; Sun, J.C.; Wang, H.; Zhang, J. AC impedance diagnosis of a 500W PEM fuel cell stack: Part II: Individual cell impedance. J. Power Sources 2006, 161, 929–937. [Google Scholar] [CrossRef]
  56. Martens, S.; Asen, L.; Ercolano, G.; Dionigi, F.; Zalitis, C.; Hawkins, A.; Bonastre, A.M.; Seidl, L.; Knoll, A.C.; Sharman, J.; et al. A comparison of rotating disc electrode, floating electrode technique and membrane electrode assembly measurements for catalyst testing. J. Power Sources 2018, 392, 274–284. [Google Scholar] [CrossRef]
  57. Mohideen, M.M.; Radhamani, A.V.; Ramakrishna, S.; Wei, Y.; Liu, Y. Recent insights on iron based nanostructured electrocatalyst and current status of proton exchange membrane fuel cell for sustainable transport. J. Energy Chem. 2022, 69, 466–489. [Google Scholar] [CrossRef]
Scheme 1. Experimental apparatus.
Electronics 11 02776 sch001
Figure 1. X-ray diffraction patterns of the tested electrocatalyst powders and of the carbon black support (Vulcan XC72R).
Electronics 11 02776 g001
Figure 2. Cell potential (Ufc) vs. current density (ifc) and power density (P) vs. current density (ifc) curves obtained for the PEMFC with the 29Pt cathode electrode; Flow rates: Fanode (100% H2) = Fcathode (synthetic air) = 100 cm3 min1; geometric electrode surface area, Aelec = 5.29 cm2.
Electronics 11 02776 g002
Figure 3. Effect of cell potential Ufc on the EIS characteristics of the PEMFC with the 29Pt cathode electrode, presented in the form of Nyquist plots (ac) and negative phase angle vs. log(frequency f) Bode plots (d,e); Flow rates: Fanode (100% H2) = Fcathode (synthetic air) = 100 cm3 min−1; geometric electrode surface area, Aelec = 5.29 cm2.
Electronics 11 02776 g003
Figure 4. Cell potential (Ufc) vs. current density (ifc) and power density (P) vs. current density (ifc) curves obtained for the PEMFC with the 22Pd—7Zn cathode electrode; Flow rates: Fanode (100% H2) = Fcathode (synthetic air) = 100 cm3 min−1; geometric electrode surface area, Aelec = 5.29 cm2.
Electronics 11 02776 g004
Figure 5. Effect of cell potential Ufc on the EIS characteristics of the PEMFC with the 22Pd—7Zn cathode electrode, presented in the form of Nyquist plots (ac) and negative phase angle vs. log(frequency f) Bode plots (d,e); Flow rates: Fanode (100% H2) = Fcathode (synthetic air) = 100 cm3 min−1; geometric electrode surface area, Aelec = 5.29 cm2.
Electronics 11 02776 g005
Figure 6. Cell potential (Ufc) vs. current density (ifc) and power density (P) vs. current density (ifc) curves obtained for the PEMFC with the 29Pt (TKK) cathode electrode; Flow rates: Fanode (100% H2) = Fcathode (synthetic air) = 100 cm3 min−1; geometric electrode surface area, Aelec = 5.29 cm2.
Electronics 11 02776 g006
Figure 7. Effect of cell potential Ufc on the EIS characteristics of the PEMFC with the 29Pt (TKK) cathode electrode, presented in the form of Nyquist plots (ac) and negative phase angle vs. log(frequency f) Bode plots (d,e); Flow rates: Fanode (100% H2) = Fcathode (synthetic air) = 100 cm3 min−1; geometric electrode surface area, Aelec = 5.29 cm2.
Electronics 11 02776 g007
Figure 8. Comparison of the performance of the tested PEMFCs: (a) Cell potential (Ufc) vs. current density (ifc) curves. (b) Power density (P) vs. current density (ifc) curves. (c) EIS characteristics (Nyquist plots) at 0.5 V. (d) Apparent polarization resistance (Rp) vs. cell potential (Ufc) plots. (e) Summit frequency (fsummit) vs. cell potential (Ufc) plots. (f) Current density (ifc) vs. time for 24 h operation under 0.4 V. Flow rates: Fanode (100% H2) = Fcathode (synthetic air) = 100 cm3 min−1; geometric electrode surface area, Aelec = 5.29 cm2.
Electronics 11 02776 g008
Table 1. Specific surface area (SSA) and particle size of the tested electrocatalysts.
NotationElectrocatalyst Composition Specific Surface Area (m2 g−1)Particle Size (nm)
22Pd—7Zn21.7 wt.% Pd—7.3 wt.% Zn/C68 18.4 ± 2.0 1
29Pt29 wt.% Pt/C88 110.0 ± 0.5 1
29Pt (TKK)29 wt.% Pt/C84 12.0 ± 0.1 1
1 [44].
Publisher’s Note: MDPI stays neutral with regard to jurisdictional claims in published maps and institutional affiliations.

