
A Comprehensive Bibliometric Assessment on Software Testing (2016–2021)

 , , , ,
  ,
, 
Abstract
1. Introduction
2. Related Work
3. Methodology
3.1. Creation of Two Distinguished Datasets for Two Different Time Spans
3.2. Research Questions for the Analysis of Datasets
4. Research Findings
4.1. Year-Wise Scientific Production
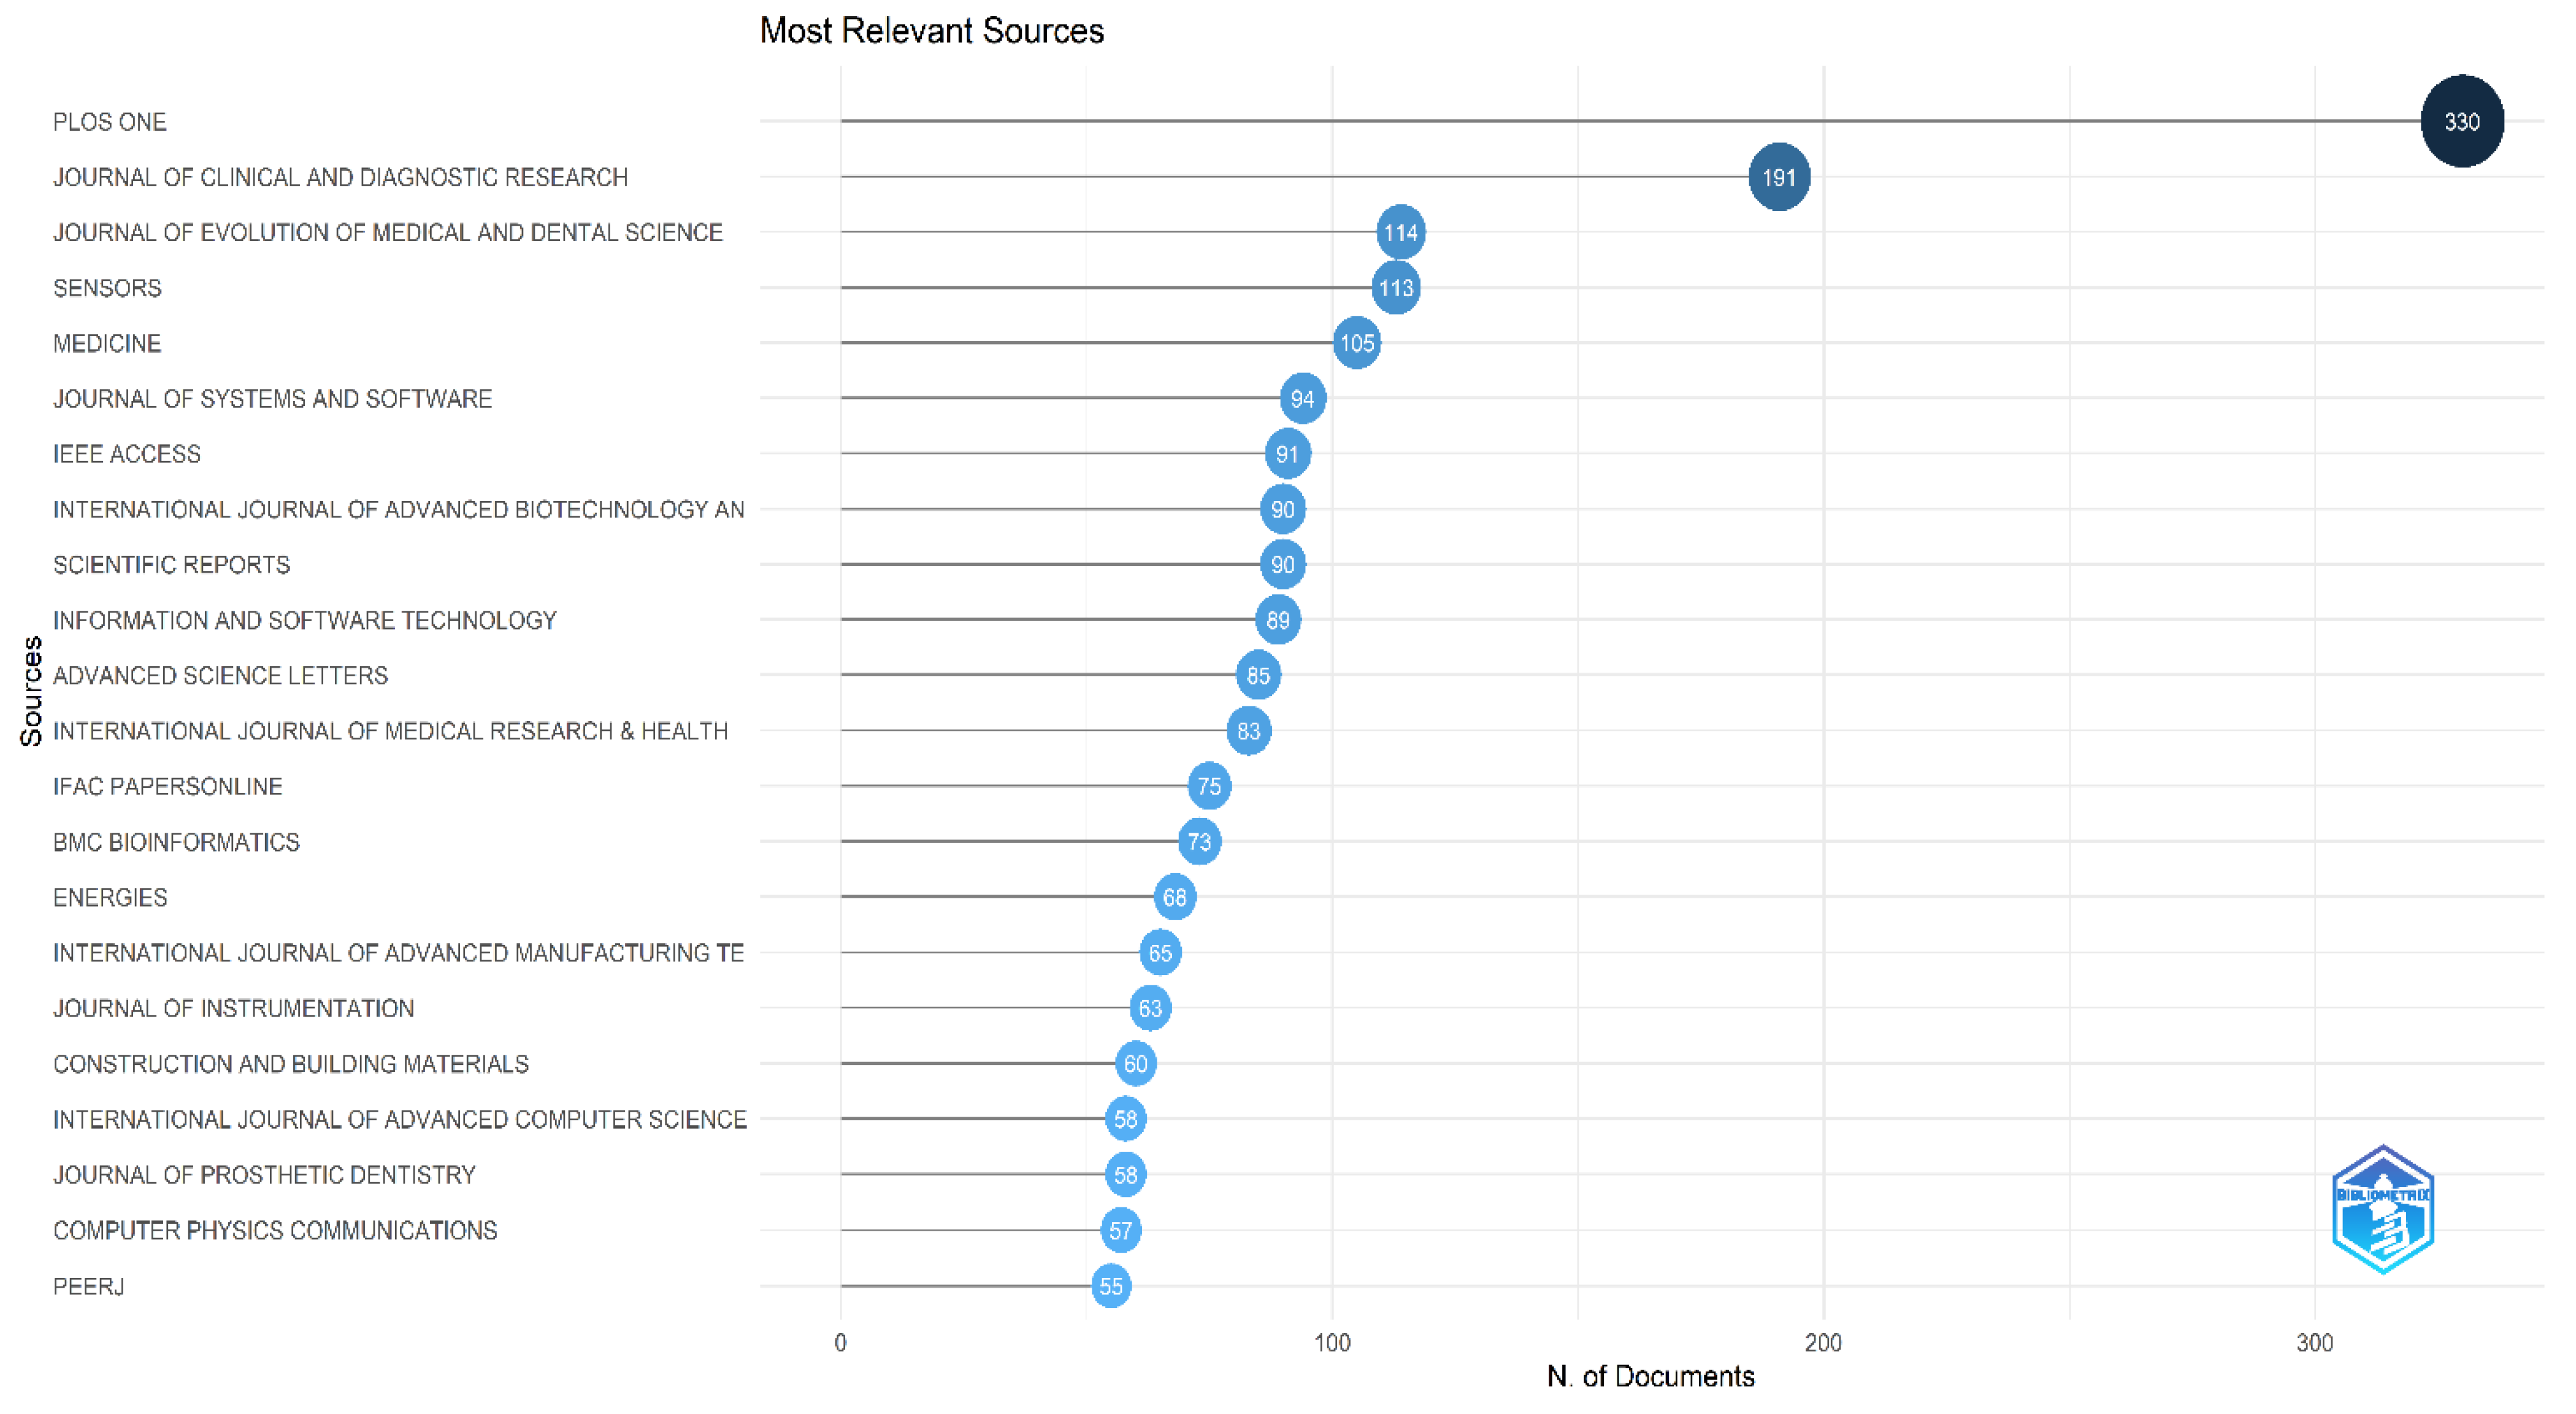
4.2. Top 20 Publication Venues
4.3. Types of Documents
4.4. Top 20 Web of Science Categories Based on the Publications Count
4.5. Top 20 Research Areas in Accordance with the Record Count of Publications
4.6. Leading 20 Institutions/Organizations Based on the Frequency of Publications
4.7. The Top 20 Most Actively Contributing Countries Based on the Frequency of Publications
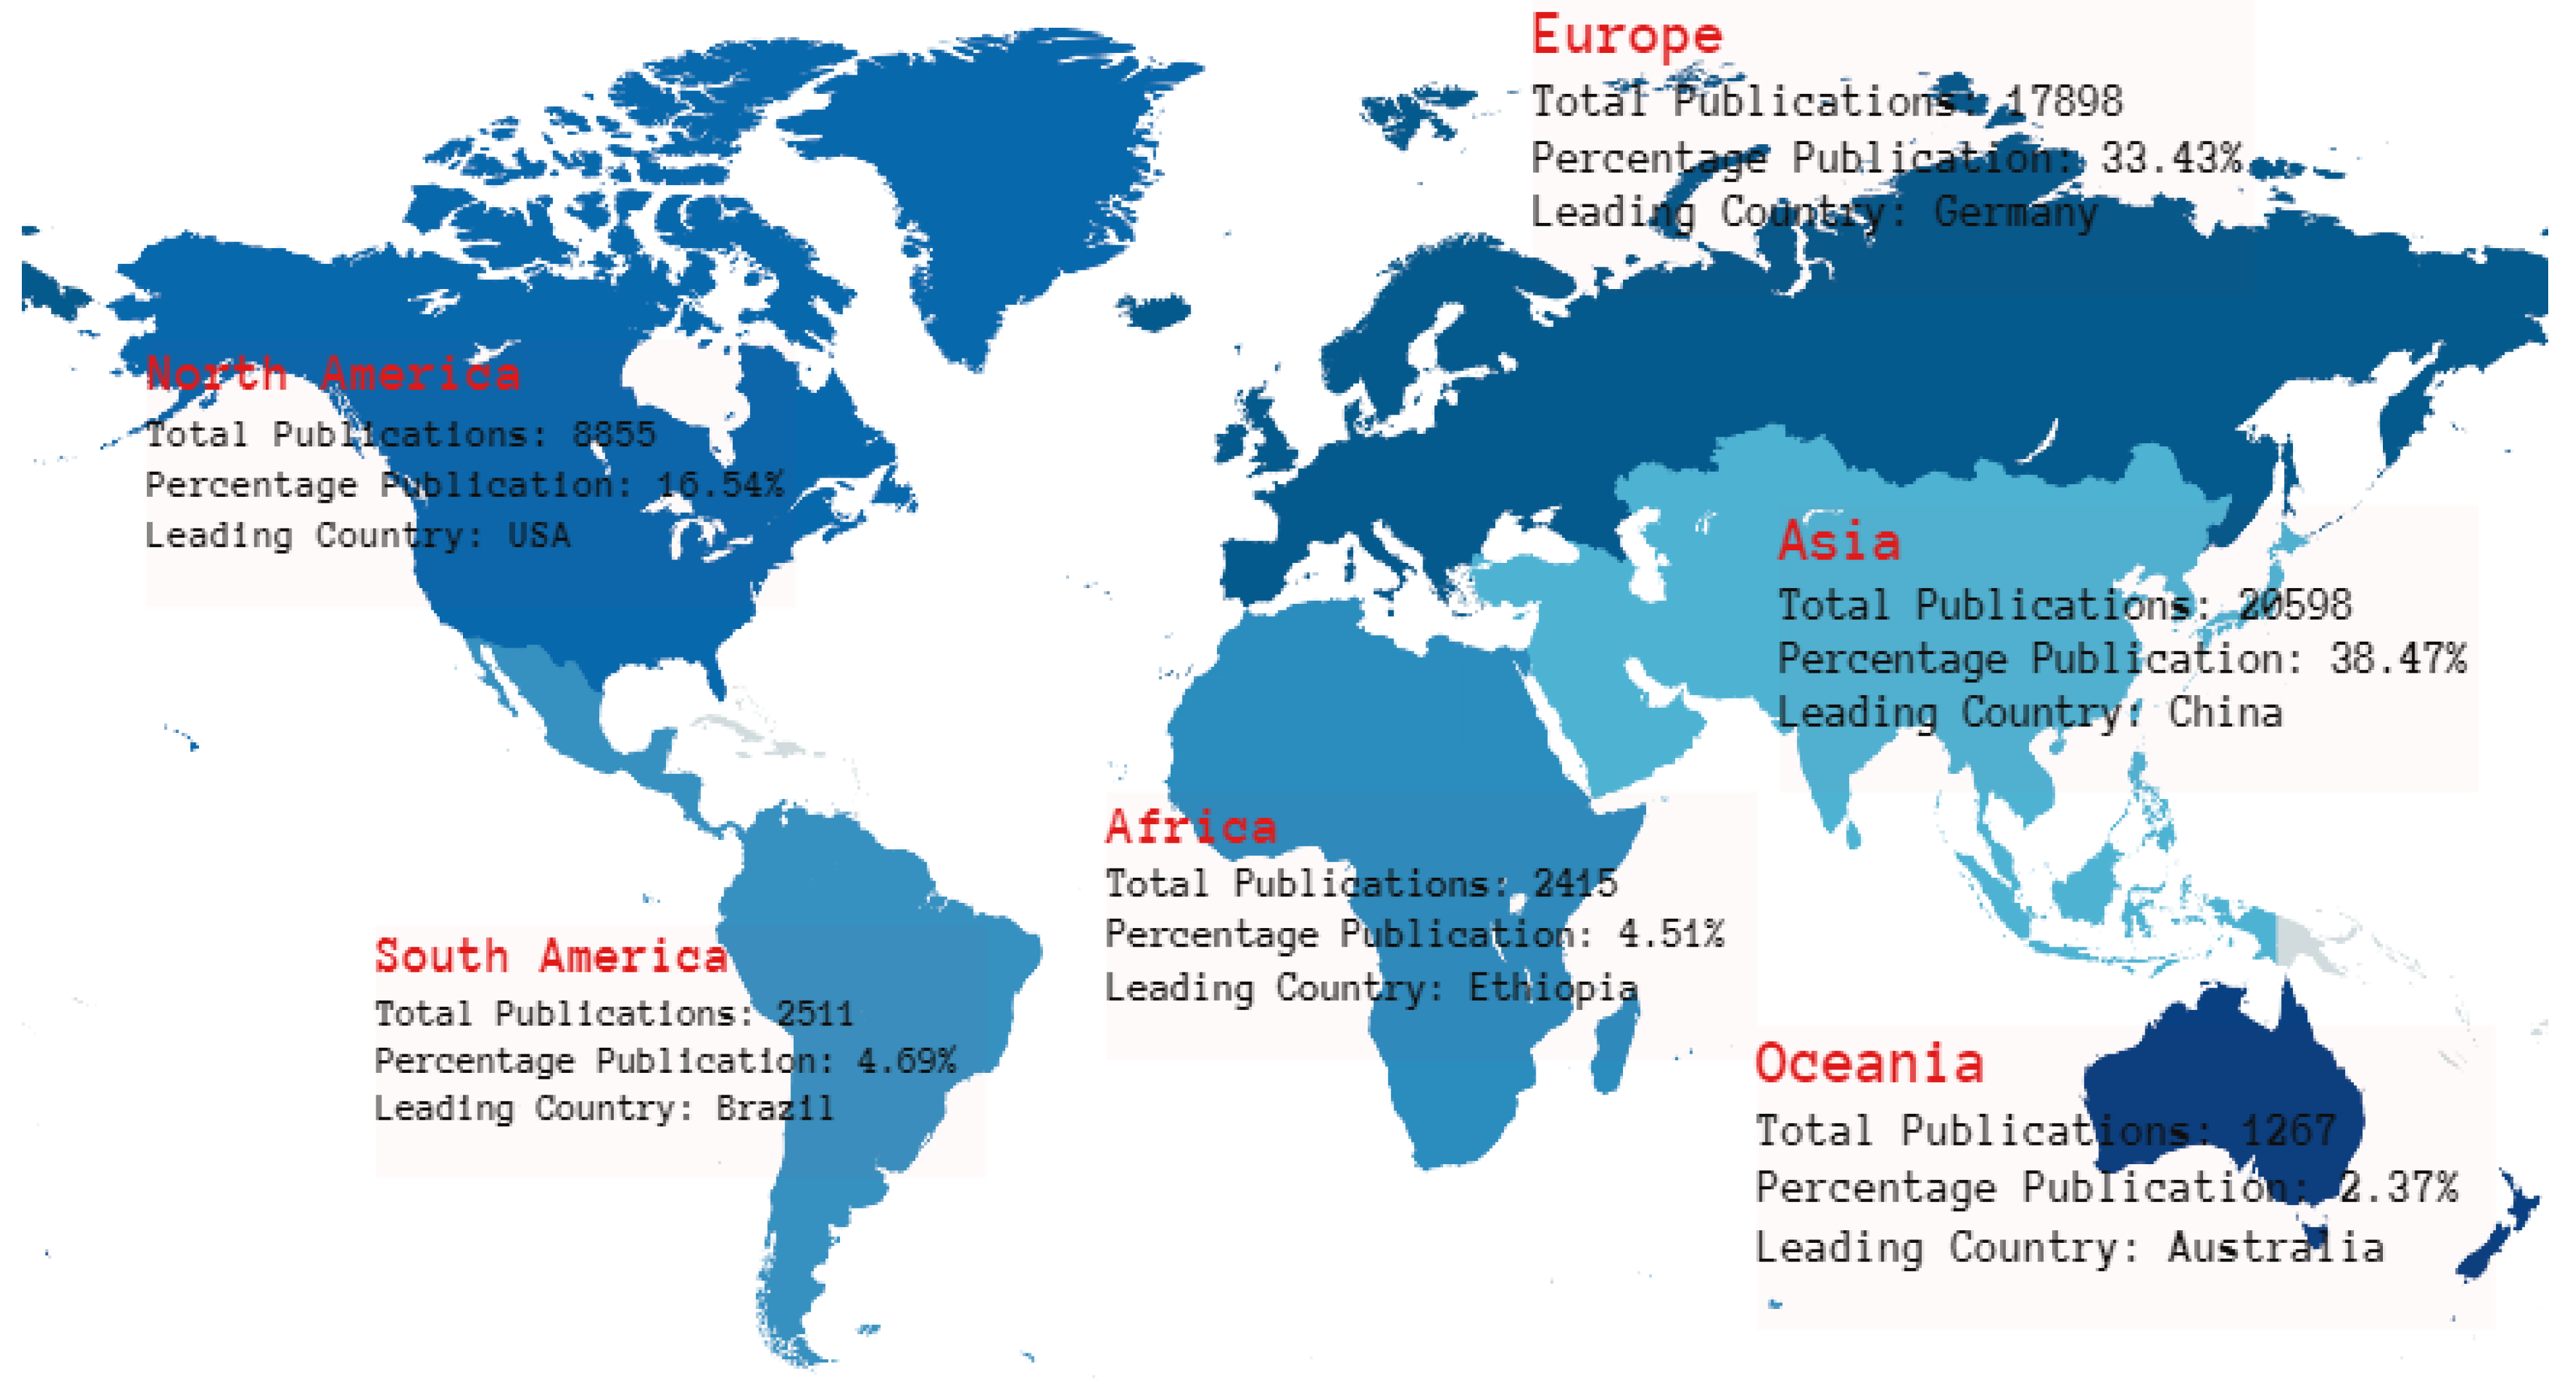
4.8. Continent-Wise Research Contribution
4.9. Language of the Publications
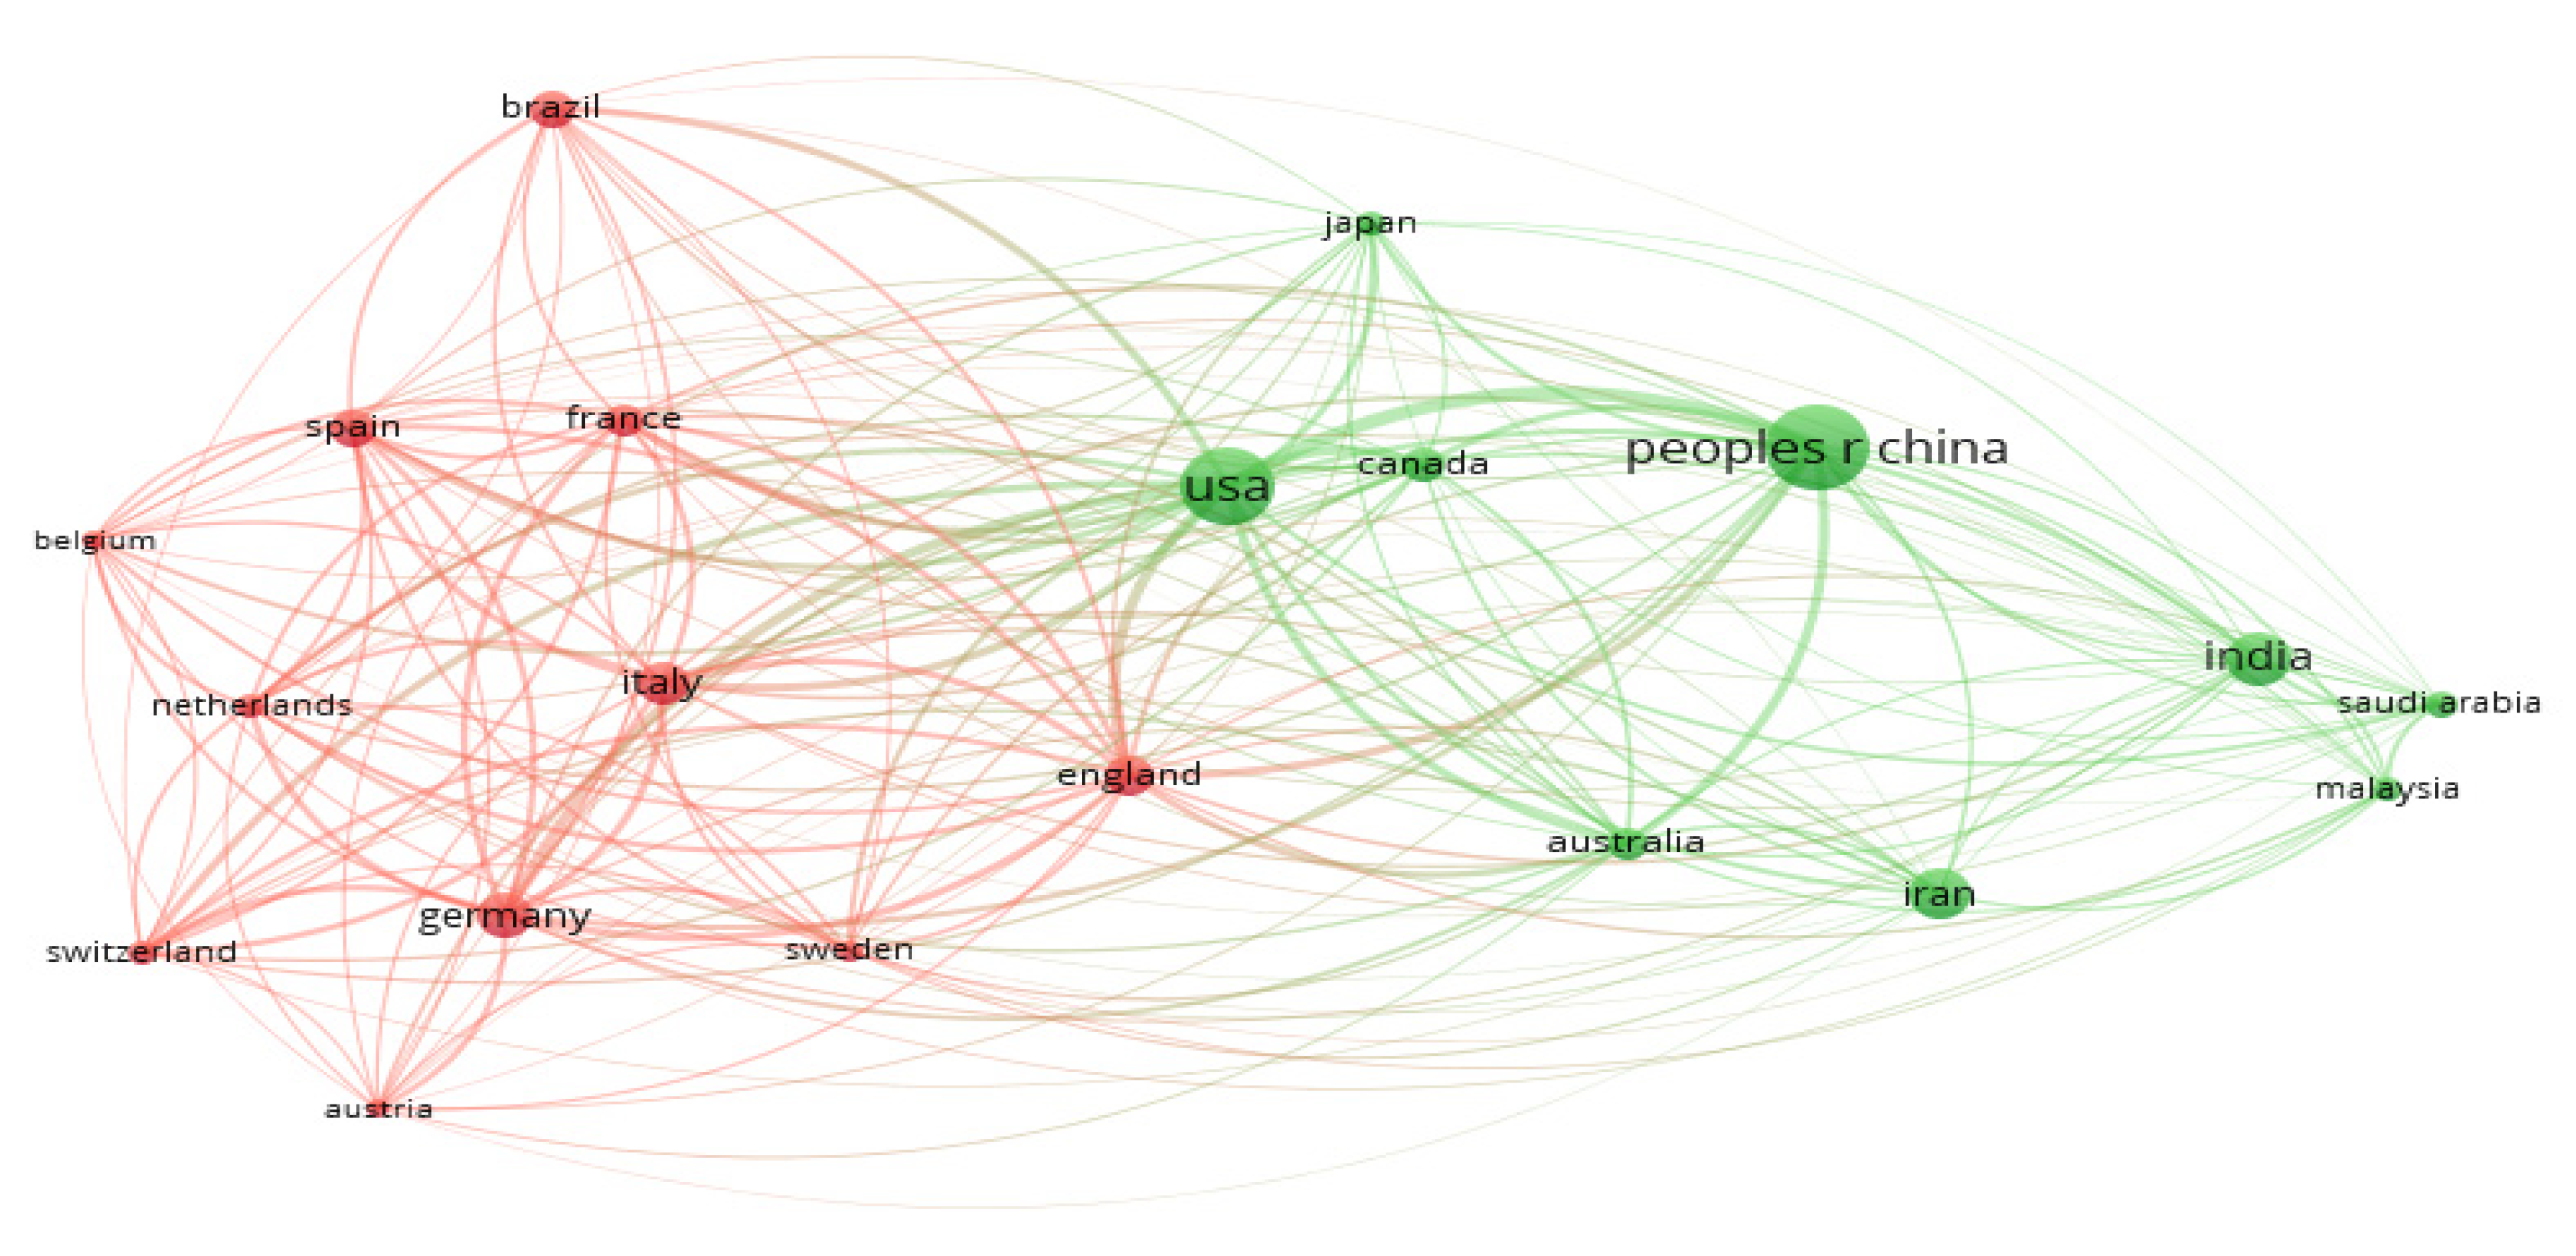
4.10. Collaboration Network amongst Countries
4.11. Correlation of Documents on the Basis of Co-Words
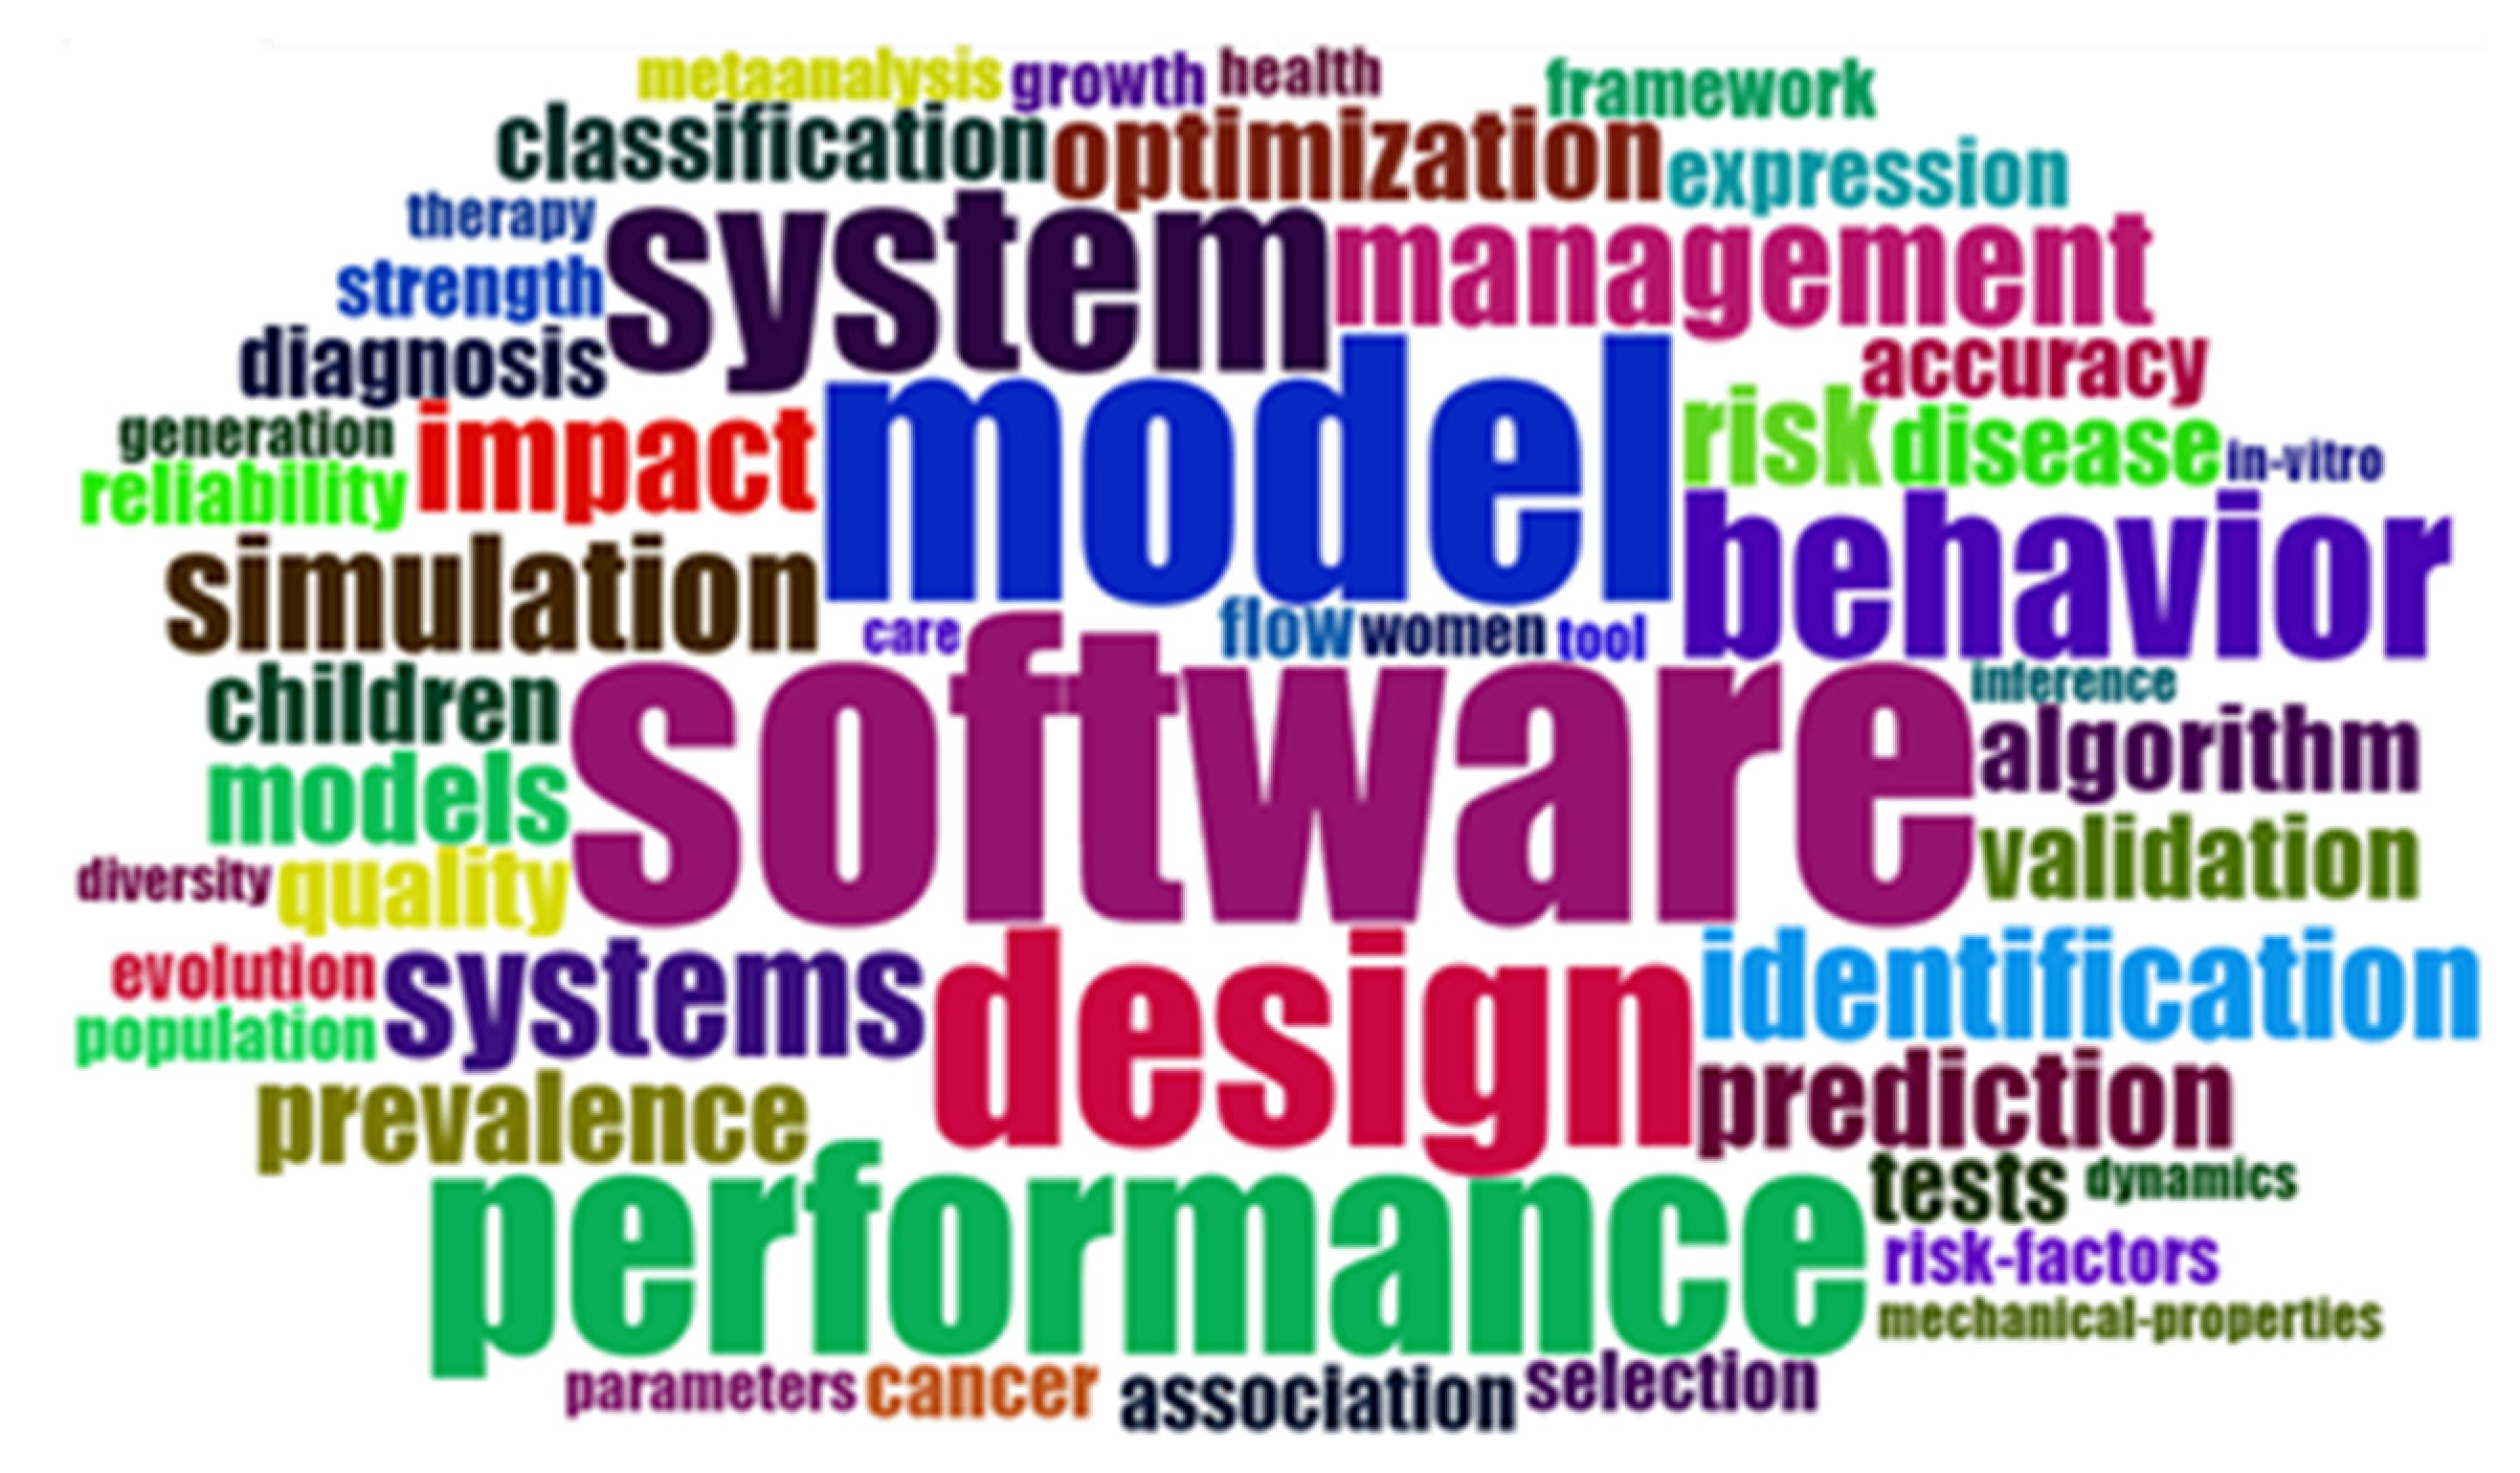
4.12. Research Themes/Topics
5. Future Work and Limitations of the Research Study
5.1. Future Work
5.2. Limitations of the Study
- Limited Time Frame: We have included the research publications for the six-year timeframes of the WoS database 2016–2021. Therefore, the paper does not include the research studies for the time duration before 2016.
- Limitations of sub-domain of SE: We have a limited or bibliometric assessment on Software Testing only. However, there are many other sub-domains of Software Engineering that need to be analyzed in future works.
- Use of ISI Web of Science (WoS): We have used one of the most commonly used and highly privileged databases, which is ISI Web of Science. Other databases can also be used.
- Twelve research questions: Analysis on the basis of 12 research questions can be enhanced to include other bibliometric assessment parameters.
6. Conclusions
Author Contributions
Funding
Conflicts of Interest
References
- Garousi, V. A bibliometric analysis of the Turkish software engineering research community. Scientometrics 2015, 105, 23–49. [Google Scholar] [CrossRef]
- Galler, B.A. ACM president’s letter: NATO and software engineering? Commun. ACM 1969, 12, 301. [Google Scholar] [CrossRef]
- Johnson, P.; Ekstedt MJacobson, I. Where’s the theory for software engineering? IEEE Softw. 2012, 29, 96. [Google Scholar] [CrossRef]
- Alam, S.; Zardari, S.; Bano, M. Software engineering and 12 prominent sub-areas: Comprehensive bibliometric assessment on 13 years (2007–2019). IET Softw. 2021, 16, 125–145. [Google Scholar] [CrossRef]
- Roger, S.P.; Bruce, R.M. Software Engineering: A Practitioner’s Approach; McGraw-Hill Education: New York, NY, USA, 2005. [Google Scholar]
- Wasserman, A.I. Software engineering issues for mobile application development. In Proceedings of the FSE/SDP Workshop on Future of Software Engineering Research, Santa Fe, NM, USA, 7–8 November 2010; Association for Computing Machinery: New York, NY, USA, 2010; pp. 397–400. [Google Scholar]
- Gregg, D.G.; Kulkarni, U.R.; Vinzé, A.S. Understanding the Philosophical Underpinnings of Software Engineering Research in Information Systems. Inf. Syst. Front. 2001, 3, 169–183. [Google Scholar] [CrossRef]
- Singh, S.K.; Singh, A. Software Testing; Vandana Publications: Lucknow, India, 2012. [Google Scholar]
- Garousi, V.; Zhi, J. A survey of software testing practices in Canada. J. Syst. Softw. 2013, 86, 1354–1376. [Google Scholar] [CrossRef]
- Jindal, T. Importance of Testing in SDLC. Int. J. Eng. Appl. Comput. Sci. 2016, 1, 54–56. [Google Scholar] [CrossRef]
- Tan, T.B.; Cheng, W.K. December. Software testing levels in internet of things (IoT) architecture. In International Computer Symposium; Springer: Singapore, 2018; pp. 385–390. [Google Scholar]
- Hamza, Z.; Hammad, M. Testing Approaches for Web and Mobile Applications: An Overview. Int. J. Comput. Digit. Syst. 2020, 9, 657–664. [Google Scholar] [CrossRef]
- Chauhan, R.K.; Singh, I. Latest research and development on software testing techniques and tools. Int. J. Curr. Eng. Technol. 2014, 4, 2368–2372. [Google Scholar]
- Jayakumar, A.V.; Gautham, S.; Kuhn, R.; Simons, B.; Collins, A.; Dirsch, T.; Kacker, R.; Elks, C. Systematic software testing of critical embedded digital devices in nuclear power applications. In Proceedings of the 2020 IEEE International Symposium on Software Reliability Engineering Workshops (ISSREW), Coimbra, Portugal, 12–15 October 2020; IEEE: Piscataway Township, NJ, USA, 2020; pp. 85–90. [Google Scholar]
- Nurul, M.; Quadri, S.M.K. Software Testing Approach for Cloud Applications (STACA)–Methodology, Techniques & Tools. In Proceedings of the 2019 9th International Conference on Cloud Computing, Data Science & Engineering (Confluence), Noida, India, 10–11 January 2019; IEEE: Piscataway Township, NJ, USA, 2019; pp. 19–25. [Google Scholar]
- Sanchez-Gomez, N.; Torres-Valderrama, J.; Garcia-Garcia, J.A.; Gutierrez, J.J.; Escalona, M.J. Model-Based Software Design and Testing in Blockchain Smart Contracts: A Systematic Literature Review. IEEE Access 2020, 8, 164556–164569. [Google Scholar] [CrossRef]
- Murad, G.; Badarneh, A.; Qusef, A.; Almasalha, F. Software testing techniques in iot. In Proceedings of the 2018 8th International Conference on Computer Science and Information Technology (CSIT), Amman, Jordan, 11–12 July 2018; IEEE: Piscataway Township, NJ, USA, 2018; pp. 17–21. [Google Scholar]
- Górski, T. The 1+5 Architectural Views Model in Designing Blockchain and IT System Integration Solutions. Symmetry 2021, 13, 2000. [Google Scholar] [CrossRef]
- Shahin, M.; Babar, M.A.; Zhu, L. Continuous Integration, Delivery and Deployment: A Systematic Review on Approaches, Tools, Challenges and Practices. IEEE Access 2017, 5, 3909–3943. [Google Scholar] [CrossRef]
- Górski, T. Continuous Delivery of Blockchain Distributed Applications. Sensors 2021, 22, 128. [Google Scholar] [CrossRef] [PubMed]
- Schermann, G.; Schöni, D.; Leitner, P.; Gall, H.C. Bifrost: Supporting continuous deployment with automated enactment of multi-phase live testing strategies. In Proceedings of the 17th International Middleware Conference, Trento, Italy, 12–16 December 2016; pp. 1–14. [Google Scholar]
- Merigó, J.M.; Yang, J.-B. A bibliometric analysis of operations research and management science. Omega 2017, 73, 37–48. [Google Scholar] [CrossRef]
- Alam, S.; Zardari, S.; Shamsi, J. Comprehensive three-phase bibliometric assessment on the blockchain (2012–2020). Libr. Hi Tech 2022. [Google Scholar] [CrossRef]
- Tse, T.; Chen, T.; Glass, R.L. An assessment of systems and software engineering scholars and institutions (2000–2004). J. Syst. Softw. 2006, 79, 816–819. [Google Scholar] [CrossRef][Green Version]
- Wohlin, C. An analysis of the most cited articles in software engineering journals—1999. Inf. Softw. Technol. 2005, 47, 957–964. [Google Scholar] [CrossRef]
- Wong, W.E.; Tse, T.; Glass, R.L.; Basili, V.R.; Chen, T. An assessment of systems and software engineering scholars and institutions (2002–2006). J. Syst. Softw. 2009, 82, 1370–1373. [Google Scholar] [CrossRef][Green Version]
- Hamadicharef, B. Scientometric study of the IEEE transactions on software engineering 1980–2010. In Proceedings of the 2011 2nd International Congress on Computer Applications and Computational Science, Bali, Indonesia, 15–17 November 2011; Springer: Berlin, Heidelberg, 2012; pp. 101–106. [Google Scholar]
- Freitas, F.G.D.; Souza, J.T.D. Ten years of search based software engineering: A bibliometric analysis. In International Symposium on Search Based Software Engineering; Springer: Berlin/Heidelberg, Germany, 2011; pp. 18–32. [Google Scholar]
- Garousi, V.; Mäntylä, M.V. Citations, research topics and active countries in software engineering: A bibliometrics study. Comput. Sci. Rev. 2016, 19, 56–77. [Google Scholar] [CrossRef]
- Karanatsiou, D.; Li, Y.; Arvanitou, E.-M.; Misirlis, N.; Wong, W.E. A bibliometric assessment of software engineering scholars and institutions (2010–2017). J. Syst. Softw. 2018, 147, 246–261. [Google Scholar] [CrossRef]
- Almaliki, M. Software Engineering in Saudi Arabia: A Bibliometric Assessment. IEEE Access 2021, 9, 17245–17255. [Google Scholar] [CrossRef]
- Wong, W.E.; Mittas, N.; Arvanitou, E.M.; Li, Y. A bibliometric assessment of software engineering themes, scholars and institutions (2013–2020). J. Syst. Softw. 2021, 180, 111029. [Google Scholar] [CrossRef]
- Mikki, S. Comparing Google Scholar and ISI Web of Science for Earth Sciences. Scientometrics 2009, 82, 321–331. [Google Scholar] [CrossRef]
- Van Eck, N.J.; Waltman, L. VOSviewer Manual; Univeristeit Leiden: Leiden, The Netherlands, 2013; Volume 1, pp. 1–53. [Google Scholar]
- Ravikumar, S.; Agrahari, A.; Singh, S.N. Mapping the intellectual structure of scientometrics: A co-word analysis of the journal Scientometrics (2005–2010). Scientometrics 2014, 102, 929–955. [Google Scholar] [CrossRef]
- Cobo, M.J.; López-Herrera, A.G.; Herrera-Viedma, E.; Herrera, F. Science mapping software tools: Review, analysis, and cooperative study among tools. J. Am. Soc. Inf. Sci. Technol. 2011, 62, 1382–1402. [Google Scholar] [CrossRef]
- Wang, J.; Li, X.; Wang, P.; Liu, Q. Bibliometric analysis of digital twin literature: A review of influencing factors and conceptual structure. Technol. Anal. Strat. Manag. 2022, 1–15. [Google Scholar] [CrossRef]


| Ref. | Time Durations | Data Sources | Parameters Analyzed |
|---|---|---|---|
| [24] | 2000–2004 | WoS | Top scholars, Top institutions, Systems and Software Engineering, and Research Publications. |
| [25] | 1986–2005 | WoS | Author’s analysis for scholarly publications and presentation of 20 most cited articles. |
| [26] | 2002–2006 | WoS | Survey of publications in the field of SE, Top Institutional Analysis, Annual Publication Trend, and Research Topics |
| [27] | 1980–2010 | WoS | Scientometric study on IEEE Transactions (analysis of authors, citations and keywords, collaboration networks of authors and countries) |
| [28] | 2001–2010 | SBSE (Search-Based Software Engineering) | Authorship pattern, Publication sources, Analysis covering 740 publications of the SBSE. |
| [29] | 1972–2013 | Scopus | Publication rate of SE papers, Citation analysis, Thematic and Topic analysis, Country-wise research publication trend |
| [30] | 2010–2017 | Google Scholar and selected publication venues | Analysis of Research Topics, Institutions, and Scholars |
| [4] | 2007–2019 | WoS | Types of documents, Annual Scientific Publications, Current Research Areas, Co-word Analysis, Countries Collaboration. |
| [31] | 1984–2019 | Scopus | Analysis of Publication rate, Analysis of Subject Areas, Actively Participating Institutions, Researchers’ Participation Analysis, Collaboration Network Analysis between International SE Community and Saudi Arabian SE Community, Assessment of Citation Trend |
| [32] | 2013–2020 | Selected publication venues | Analysis of Research Topics, Institutions, and Scholars |
| The Significant Contribution of Our Research Study |
|---|
| Two distinct time frames: In our research study, we have evaluated a dataset collected from the Web of Science (WoS) in the two distinguished time frames to represent the variation in various bibliometric aspects of research in Software Testing (ST) field. The two symmetric but different review timelines are 2016–2018 and 2019–2021. Top 20 countries with respect to record count of publications: Our research study presents the top 20 countries in accordance with the number of publications. This shows which countries are progressing effectively and making the most contributions as far as the number of publications is concerned. Analysis based on research collaboration of countries: We have represented in detail the relations among the countries in terms of research collaboration amongst the top 20 countries. This parameter helps in analyzing the importance of collaboration for research enhancement. Research contribution based on the continent: Map-based representation depicting continent-wise research contribution in terms of publications is another aspect of our research study. Analysis based on co-word: Analysis on the basis of co-words that appear in different articles is presented in the study. The keywords play an important role in providing the basis for the evaluation of research topics/themes. Top 20 institutions/organizations in accordance with the record count of publications: Our research work presents the top 20 most active institutions/organizations with respect to the number of publications. This feature acts as a measure of research output with regard to the record count of publications to exhibit the progress of various institutions/organizations. Emerging research topics/themes: Our research work presents emerging research topics/themes with respect to Software Testing. This also includes the representation of the topic dendrogram. Web of Science Categories (WoS): Our paper includes findings on the basis of the top 20 WoS categories. This represents diversity in ST as WoS categories are journal-based and each WoS category is mapped to research areas. Representation of diversity in terms of publication medium: We also present the top 20 languages used as the medium for publications in the field. This further affirms the fact that, although English is by far the most commonly used language for writing articles, other languages also contribute. This encourages non-English writers to make effective and valuable research contributions by writing in their language of fluency. Cross-disciplinary research areas: Our work includes findings based on cross-disciplinary research areas. Hence, this affirms the fact that the impact of ST goes beyond Computer Science and Software Engineering. Top 20 relevant resources: This criterion represents the top 20 most relevant resources (publication venues) in the field of ST. |
| Inclusion/Exclusion Criteria | Details of Criteria |
|---|---|
| Inclusion Criteria |
|
| Exclusion Criteria |
|
| Insights | Research Questions |
|---|---|
| Annual research publication | Q1. What is the frequency of year-wise research publications? |
| Publication venues | Q2. What are the top 20 publication venues (publication resources) in terms of the publication count? |
| Types of publications | Q3. What are the various types of documents present in the datasets? |
| Types of WoS categories | Q4. What are the 20 leading WoS categories? |
| Types of research areas | Q5. Which research areas constitute the top 20 research areas for Software Testing? |
| Research contribution of institutions/organizations | Q6. What are the leading 20 institutions/organizations based on the frequency of publications? |
| The research contribution of the countries | Q7. What are the top 20 countries in terms of the frequency of publications? |
| Continent-wise research contribution | Q8. What are the continent research participations in terms of publications? |
| Types of languages | Q9. What is the research contribution of different languages as per published scholarly works from the Software Testing aspect? |
| Research collaboration amongst countries | Q10. Which of the top 20 countries have the biggest research collaboration network? |
| Relation amongst documents | Q11. What is the correlation of documents on the basis of co-word? |
| Research topics/themes | Q12. What are the associated research topics/themes? |
| Web of Science Categories | Record Count | % of 35,161 |
|---|---|---|
| Electrical Engineering | 6382 | 18.151 |
| Computer Science Theory and Methods | 3493 | 9.934 |
| Computer Science Software Engineering | 2995 | 8.518 |
| Computer Science Information Systems | 2201 | 6.260 |
| Computer Science Interdisciplinary Applications | 1687 | 4.798 |
| Computer Science Artificial Intelligence | 1638 | 4.659 |
| Telecommunications | 1624 | 4.619 |
| Mechanical Engineering | 1504 | 4.277 |
| Multidisciplinary Engineering | 1322 | 3.760 |
| Multidisciplinary Materials Science | 1310 | 3.726 |
| Energy Fuels | 1235 | 3.512 |
| Automation Control Systems | 1152 | 3.276 |
| Civil Engineering | 1108 | 3.151 |
| Multidisciplinary Sciences | 938 | 2.688 |
| General Internal Medicine | 916 | 2.605 |
| Applied Physics | 875 | 2.489 |
| Educational Research | 827 | 2.352 |
| Computer Science Hardware Architecture | 784 | 2.230 |
| Instrumentation | 772 | 2.196 |
| Radiology Nuclear Medical Imaging | 740 | 2.105 |
| Web of Science Categories | Record Count | % of 39,937 |
|---|---|---|
| Electrical Engineering | 5147 | 12.888 |
| Computer Science Information Systems | 2859 | 7.159 |
| Computer Science Software Engineering | 2829 | 7.084 |
| Computer Science Theory and Methods | 2779 | 6.958 |
| Materials Science: Multidisciplinary | 2023 | 5.065 |
| Telecommunications | 1909 | 4.78 |
| Multidisciplinary Engineering | 1656 | 4.147 |
| Computer Science Interdisciplinary Applications | 1621 | 4.059 |
| Computer Science Artificial Intelligence | 1575 | 3.944 |
| Civil Engineering | 1539 | 3.854 |
| Mechanical Engineering | 1404 | 3.516 |
| General Internal Medicine | 1375 | 3.443 |
| Applied Physics | 1238 | 3.1 |
| Energy Fuels | 1234 | 3.09 |
| Multidisciplinary Sciences | 1200 | 3.005 |
| Environmental Sciences | 1081 | 2.707 |
| Instrumentation | 980 | 2.454 |
| Dentistry and Oral Surgery Medicine | 939 | 2.351 |
| Radiology Nuclear Medical Imaging | 934 | 2.339 |
| Automation Control Systems | 894 | 2.239 |
| Research Areas | Record Count | % of 35,161 |
|---|---|---|
| Engineering | 12,065 | 34.314 |
| Computer Science | 8921 | 25.372 |
| Materials Science | 1839 | 5.230 |
| Telecommunications | 1624 | 4.619 |
| Science and Technology: Other Topics | 1531 | 4.354 |
| Physics | 1383 | 3.933 |
| Energy Fuels | 1235 | 3.512 |
| Automation Control Systems | 1152 | 3.276 |
| Educational Research | 1129 | 3.211 |
| General Internal Medicine | 950 | 2.702 |
| Environmental Sciences and Ecology | 880 | 2.503 |
| Chemistry | 839 | 2.386 |
| Instrumentation | 772 | 2.196 |
| Biochemistry and Molecular Biology | 742 | 2.110 |
| Radiology Nuclear Medical Imaging | 740 | 2.105 |
| Optics | 739 | 2.102 |
| Dentistry and Oral Surgery Medicine | 687 | 1.954 |
| Mathematics | 670 | 1.906 |
| Business Economics | 607 | 1.726 |
| Construction Technology | 596 | 1.695 |
| Research Areas | Record Count | % of 39,937 |
|---|---|---|
| Engineering | 11,717 | 29.339 |
| Computer Science | 8622 | 21.589 |
| Materials Science | 2617 | 6.553 |
| Science and Technology: Other Topics | 1972 | 4.938 |
| Telecommunications | 1909 | 4.78 |
| Physics | 1797 | 4.5 |
| Chemistry | 1743 | 4.364 |
| General Internal Medicine | 1505 | 3.768 |
| Environmental Sciences and Ecology | 1358 | 3.4 |
| Energy Fuels | 1234 | 3.09 |
| Educational Research | 1064 | 2.664 |
| Instrumentation | 980 | 2.454 |
| Dentistry and Oral Surgery Medicine | 939 | 2.351 |
| Radiology Nuclear Medical Imaging | 934 | 2.339 |
| Automation Control Systems | 894 | 2.239 |
| Public Environmental Occupational Health | 810 | 2.028 |
| Pharmacology | 807 | 2.021 |
| Business and Economics | 805 | 2.016 |
| Biochemistry and Molecular Biology | 804 | 2.013 |
| Mathematics | 801 | 2.006 |
| Affiliations | Countries | Record Count | % of 35,161 |
|---|---|---|---|
| Islamic Azad University | Iran | 500 | 1.422 |
| University of California System | USA | 447 | 1.271 |
| Chinese Academy of Sciences CAS | China | 417 | 1.186 |
| Udice French Research Universities | France | 408 | 1.160 |
| Centre National De La Recherche Scientifique CNRS | France | 391 | 1.112 |
| University of Texas System | USA | 265 | 0.754 |
| University of London | UK | 260 | 0.739 |
| United States Department of Energy Doe | USA | 250 | 0.711 |
| Indian Institute of Technology System IIT System | India | 247 | 0.702 |
| Universidade De Sao Paulo | Brazil | 240 | 0.683 |
| Russian Academy of Sciences | Russia | 214 | 0.609 |
| Helmholtz Association | Germany | 209 | 0.594 |
| Harvard University | USA | 198 | 0.563 |
| National Institute of Technology NIT System | India | 195 | 0.555 |
| State University System of Florida | USA | 188 | 0.535 |
| University College London | UK | 175 | 0.498 |
| Tehran University of Medical Sciences | Iran | 174 | 0.495 |
| Beihang University | China | 170 | 0.483 |
| University of North Carolina | USA | 159 | 0.452 |
| Pennsylvania Commonwealth System of Higher Education PCSHE | USA | 154 | 0.438 |
| Affiliations | Countries | Record Count | % of 39,937 |
|---|---|---|---|
| Islamic Azad University | Iran | 506 | 1.267 |
| University of California System | USA | 501 | 1.254 |
| Chinese Academy of Sciences | China | 482 | 1.207 |
| Centre National De La Recherche Scientifique CNRS | France | 449 | 1.124 |
| Udice French Research Universities | France | 431 | 1.079 |
| University of London | UK | 293 | 0.734 |
| University of Texas system | USA | 287 | 0.719 |
| Indian Institute of Technology System IIT System | India | 270 | 0.676 |
| United States Department of Energy Doe | USA | 258 | 0.646 |
| National Institute of Technology NIT System | India | 254 | 0.636 |
| Universidade De Sao Paulo | Brazil | 251 | 0.628 |
| Russian Academy of Sciences | Russia | 240 | 0.601 |
| State University System of Florida | USA | 234 | 0.586 |
| Tehran University of Medical Sciences | Iran | 225 | 0.563 |
| Harvard University | USA | 219 | 0.548 |
| Helmholtz Association | Germany | 218 | 0.546 |
| Ministry of Education Science of Ukraine | Ukraine | 212 | 0.531 |
| Pennsylvania Commonwealth System of Higher Education PCSHE | USA | 194 | 0.486 |
| University of Chinese Academy of Sciences CAS | China | 193 | 0.483 |
| Shahid Beheshti University Medical Sciences | Iran | 173 | 0.433 |
| Countries/Regions | Record Count | % of 35,161 |
|---|---|---|
| USA | 6063 | 17.244 |
| People’s Republic of China | 5885 | 16.737 |
| India | 2380 | 6.769 |
| Iran | 2135 | 6.072 |
| Germany | 1993 | 5.668 |
| Italy | 1782 | 5.068 |
| United Kingdom | 1529 | 4.349 |
| Brazil | 1365 | 3.882 |
| Spain | 1234 | 3.510 |
| France | 1160 | 3.299 |
| Canada | 1062 | 3.020 |
| Russia | 974 | 2.770 |
| Poland | 885 | 2.517 |
| Turkey | 882 | 2.508 |
| Australia | 820 | 2.332 |
| Malaysia | 708 | 2.014 |
| South Korea | 644 | 1.832 |
| Netherlands | 634 | 1.803 |
| Japan | 616 | 1.752 |
| Indonesia | 542 | 1.541 |
| Countries/Regions | Record Count | % of 39,937 |
|---|---|---|
| People’s Republic of China | 7581 | 18.982 |
| USA | 6355 | 15.913 |
| India | 2943 | 7.369 |
| Iran | 2690 | 6.736 |
| Germany | 2089 | 5.231 |
| Italy | 1940 | 4.858 |
| United Kingdom | 1731 | 4.334 |
| Brazil | 1568 | 3.926 |
| Spain | 1434 | 3.591 |
| Canada | 1216 | 3.045 |
| Russia | 1127 | 2.822 |
| France | 1122 | 2.809 |
| Australia | 1093 | 2.737 |
| Turkey | 1090 | 2.729 |
| Poland | 945 | 2.366 |
| South Korea | 833 | 2.086 |
| Saudi Arabia | 715 | 1.790 |
| Japan | 709 | 1.775 |
| Malaysia | 689 | 1.725 |
| Netherlands | 663 | 1.660 |
| Languages | Record Count | % of 35,161 |
|---|---|---|
| English | 34,172 | 97.187 |
| Spanish | 222 | 0.631 |
| Portuguese | 165 | 0.469 |
| Chinese | 150 | 0.427 |
| Russian | 120 | 0.341 |
| Turkish | 86 | 0.245 |
| German | 55 | 0.156 |
| French | 38 | 0.108 |
| Korean | 29 | 0.082 |
| Arabic | 23 | 0.065 |
| Polish | 20 | 0.057 |
| Persian | 18 | 0.051 |
| Italian | 11 | 0.031 |
| Ukrainian | 11 | 0.031 |
| Slovenian | 8 | 0.023 |
| Czech | 7 | 0.02 |
| Hungarian | 6 | 0.017 |
| Slovak | 6 | 0.017 |
| Croatian | 5 | 0.014 |
| Malay | 4 | 0.011 |
| Bulgarian | 2 | 0.006 |
| Japanese | 2 | 0.006 |
| Languages | Record Count | % of 39,937 |
|---|---|---|
| English | 38,975 | 97.591 |
| Spanish | 211 | 0.528 |
| Chinese | 201 | 0.503 |
| Russian | 156 | 0.391 |
| Portuguese | 133 | 0.333 |
| Turkish | 60 | 0.15 |
| German | 44 | 0.11 |
| French | 37 | 0.093 |
| Korean | 26 | 0.065 |
| Ukrainian | 21 | 0.053 |
| Polish | 17 | 0.043 |
| Italian | 9 | 0.023 |
| Hungarian | 7 | 0.018 |
| Persian | 6 | 0.015 |
| Czech | 5 | 0.013 |
| Japanese | 5 | 0.013 |
| Arabic | 4 | 0.01 |
| Croatian | 2 | 0.005 |
| Malay | 2 | 0.005 |
| Slovenian | 2 | 0.005 |
| Welsh | 2 | 0.005 |
| Keywords | Occurrences |
|---|---|
| Cluster 1 | |
| Behavior | 647 |
| Design | 864 |
| Model | 1022 |
| Optimization | 497 |
| Performance | 897 |
| Simulation | 816 |
| System | 734 |
| Systems | 462 |
| Cluster 2 | |
| Classification | 368 |
| Identification | 438 |
| Models | 362 |
| Prediction | 411 |
| Software | 1438 |
| Validation | 411 |
| Cluster 3 | |
| Children | 393 |
| Diagnosis | 339 |
| Impact | 428 |
| Management | 464 |
| Prevalence | 410 |
| Risk | 388 |
| Keywords | Occurrences |
|---|---|
| Cluster 1 | |
| Behavior | 1083 |
| Design | 1181 |
| Model | 1345 |
| Optimization | 846 |
| Performance | 1403 |
| Simulation | 991 |
| System | 861 |
| Cluster 2 | |
| Classification | 554 |
| Identification | 532 |
| Machine learning | 757 |
| Prediction | 631 |
| Reliability | 493 |
| Software | 1852 |
| Validation | 533 |
| Cluster 3 | |
| Diagnosis | 500 |
| Impact | 813 |
| Management | 682 |
| Meta-analysis | 536 |
| Prevalence | 702 |
| Risk | 596 |
Publisher’s Note: MDPI stays neutral with regard to jurisdictional claims in published maps and institutional affiliations. |
© 2022 by the authors. Licensee MDPI, Basel, Switzerland. This article is an open access article distributed under the terms and conditions of the Creative Commons Attribution (CC BY) license (https://creativecommons.org/licenses/by/4.0/).
Share and Cite
Zardari, S.; Alam, S.; Al Salem, H.A.; Al Reshan, M.S.; Shaikh, A.; Malik, A.F.K.; Masood ur Rehman, M.; Mouratidis, H. A Comprehensive Bibliometric Assessment on Software Testing (2016–2021). Electronics 2022, 11, 1984. https://doi.org/10.3390/electronics11131984
Zardari S, Alam S, Al Salem HA, Al Reshan MS, Shaikh A, Malik AFK, Masood ur Rehman M, Mouratidis H. A Comprehensive Bibliometric Assessment on Software Testing (2016–2021). Electronics. 2022; 11(13):1984. https://doi.org/10.3390/electronics11131984
Chicago/Turabian StyleZardari, Shehnila, Sana Alam, Hamad Abosaq Al Salem, Mana Saleh Al Reshan, Asadullah Shaikh, Aneeq Fayyaz Karim Malik, Muhammad Masood ur Rehman, and Haralambos Mouratidis. 2022. "A Comprehensive Bibliometric Assessment on Software Testing (2016–2021)" Electronics 11, no. 13: 1984. https://doi.org/10.3390/electronics11131984
APA StyleZardari, S., Alam, S., Al Salem, H. A., Al Reshan, M. S., Shaikh, A., Malik, A. F. K., Masood ur Rehman, M., & Mouratidis, H. (2022). A Comprehensive Bibliometric Assessment on Software Testing (2016–2021). Electronics, 11(13), 1984. https://doi.org/10.3390/electronics11131984