
A Wearable Prefrontal Cortex Oxygen Saturation Measurement System Based on Near Infrared Spectroscopy


Abstract
:1. Introduction
2. Measurement System Description
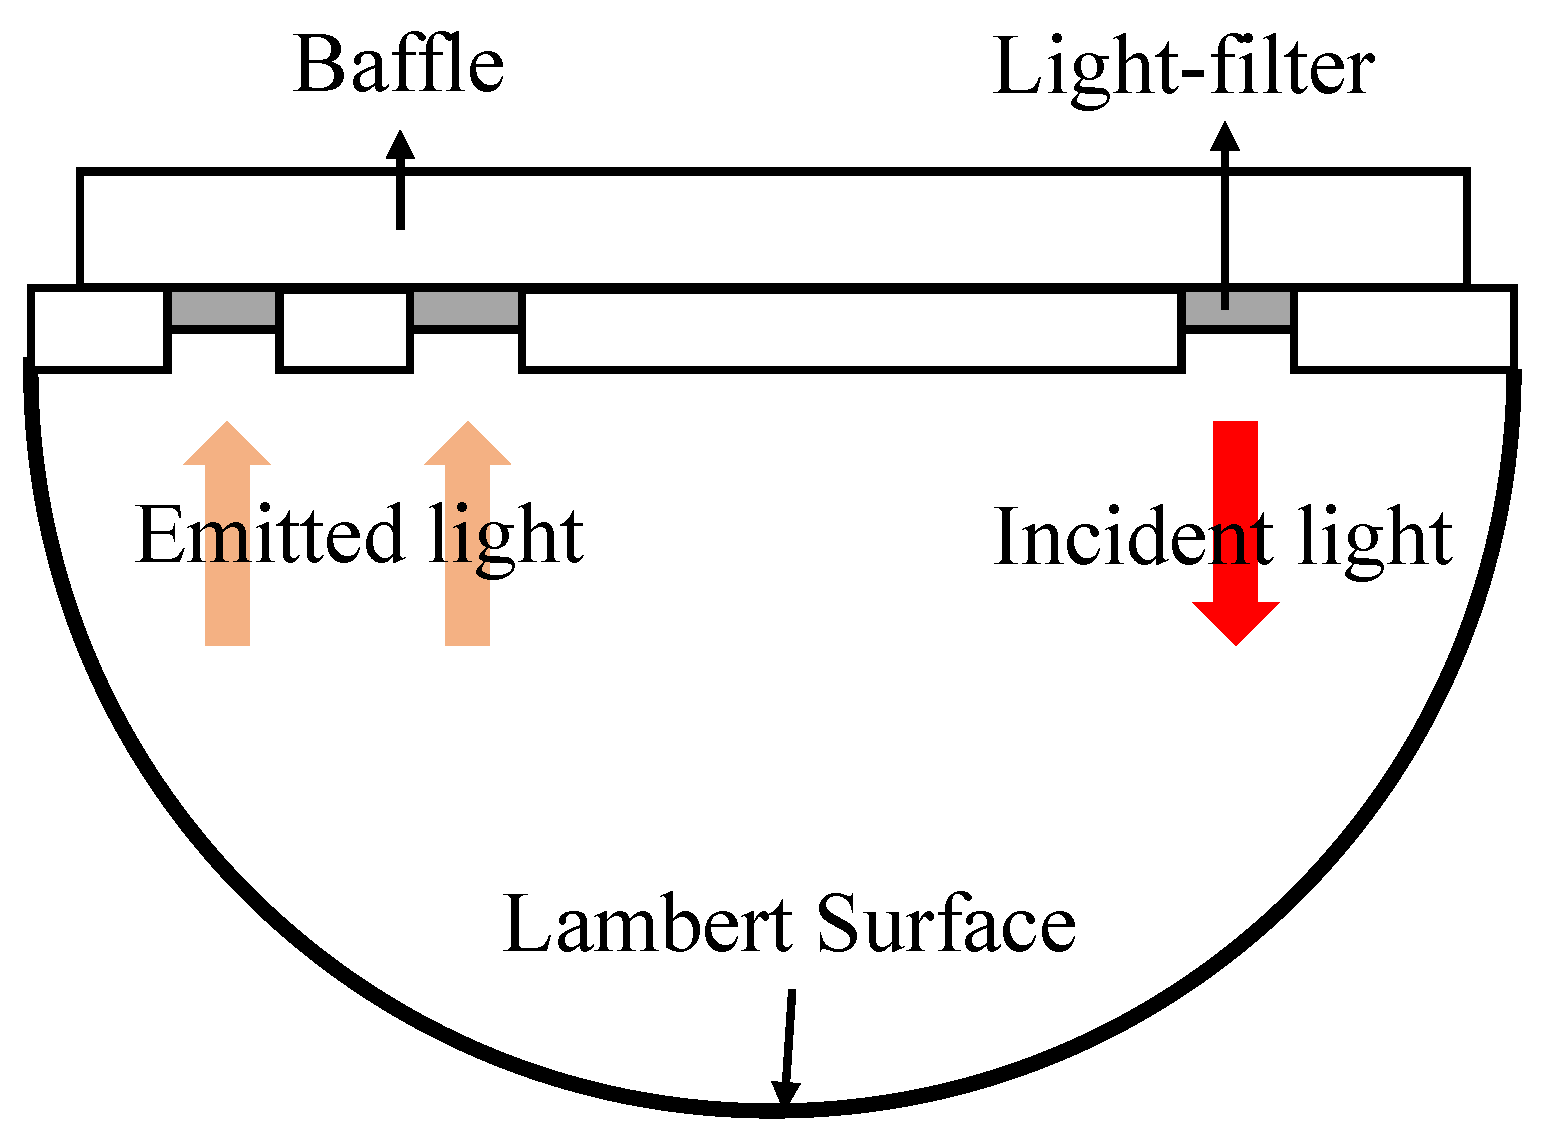
2.1. Analytical Model
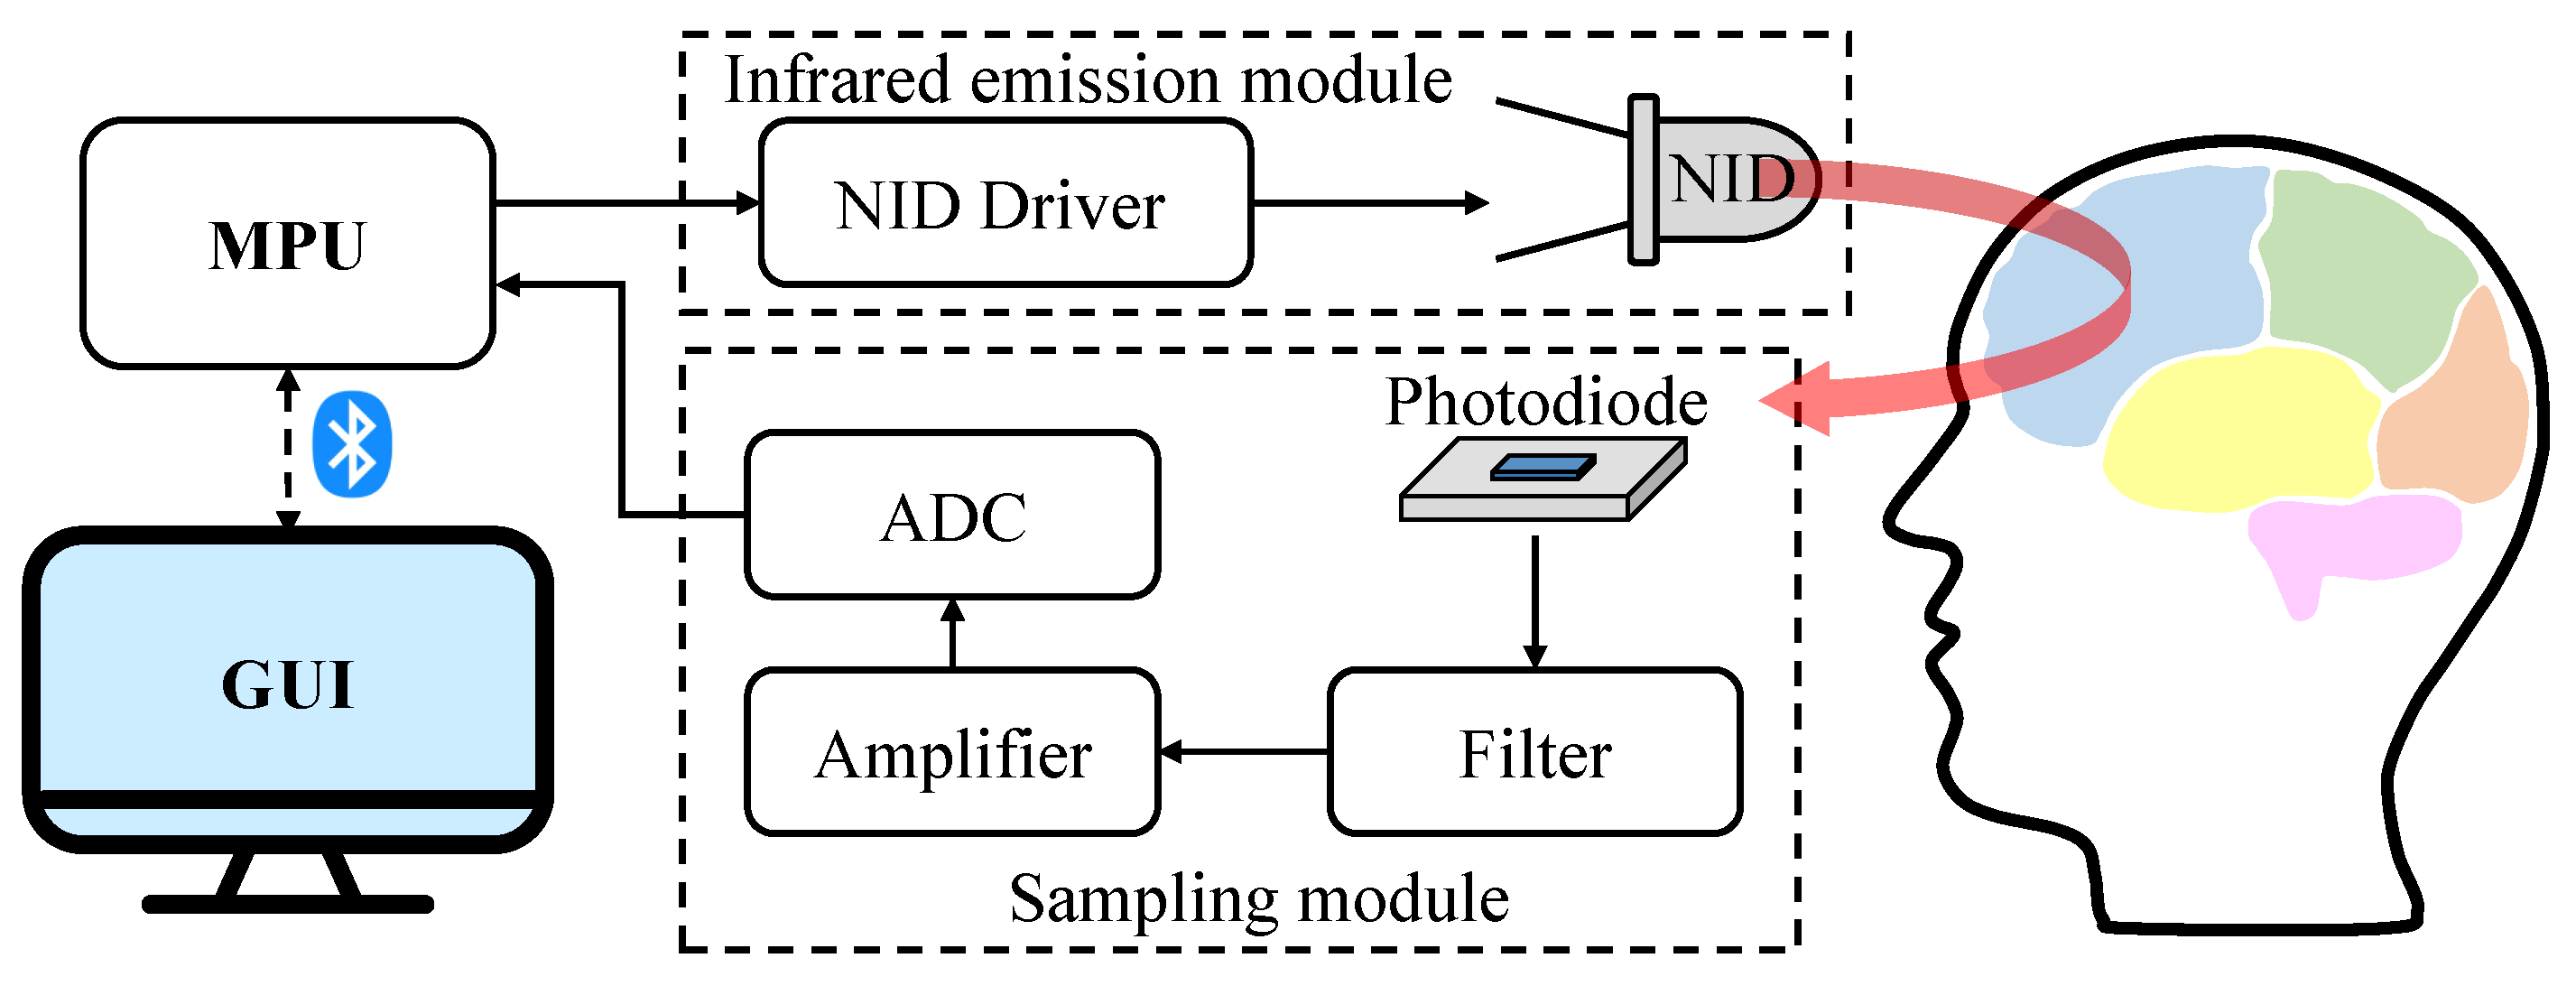
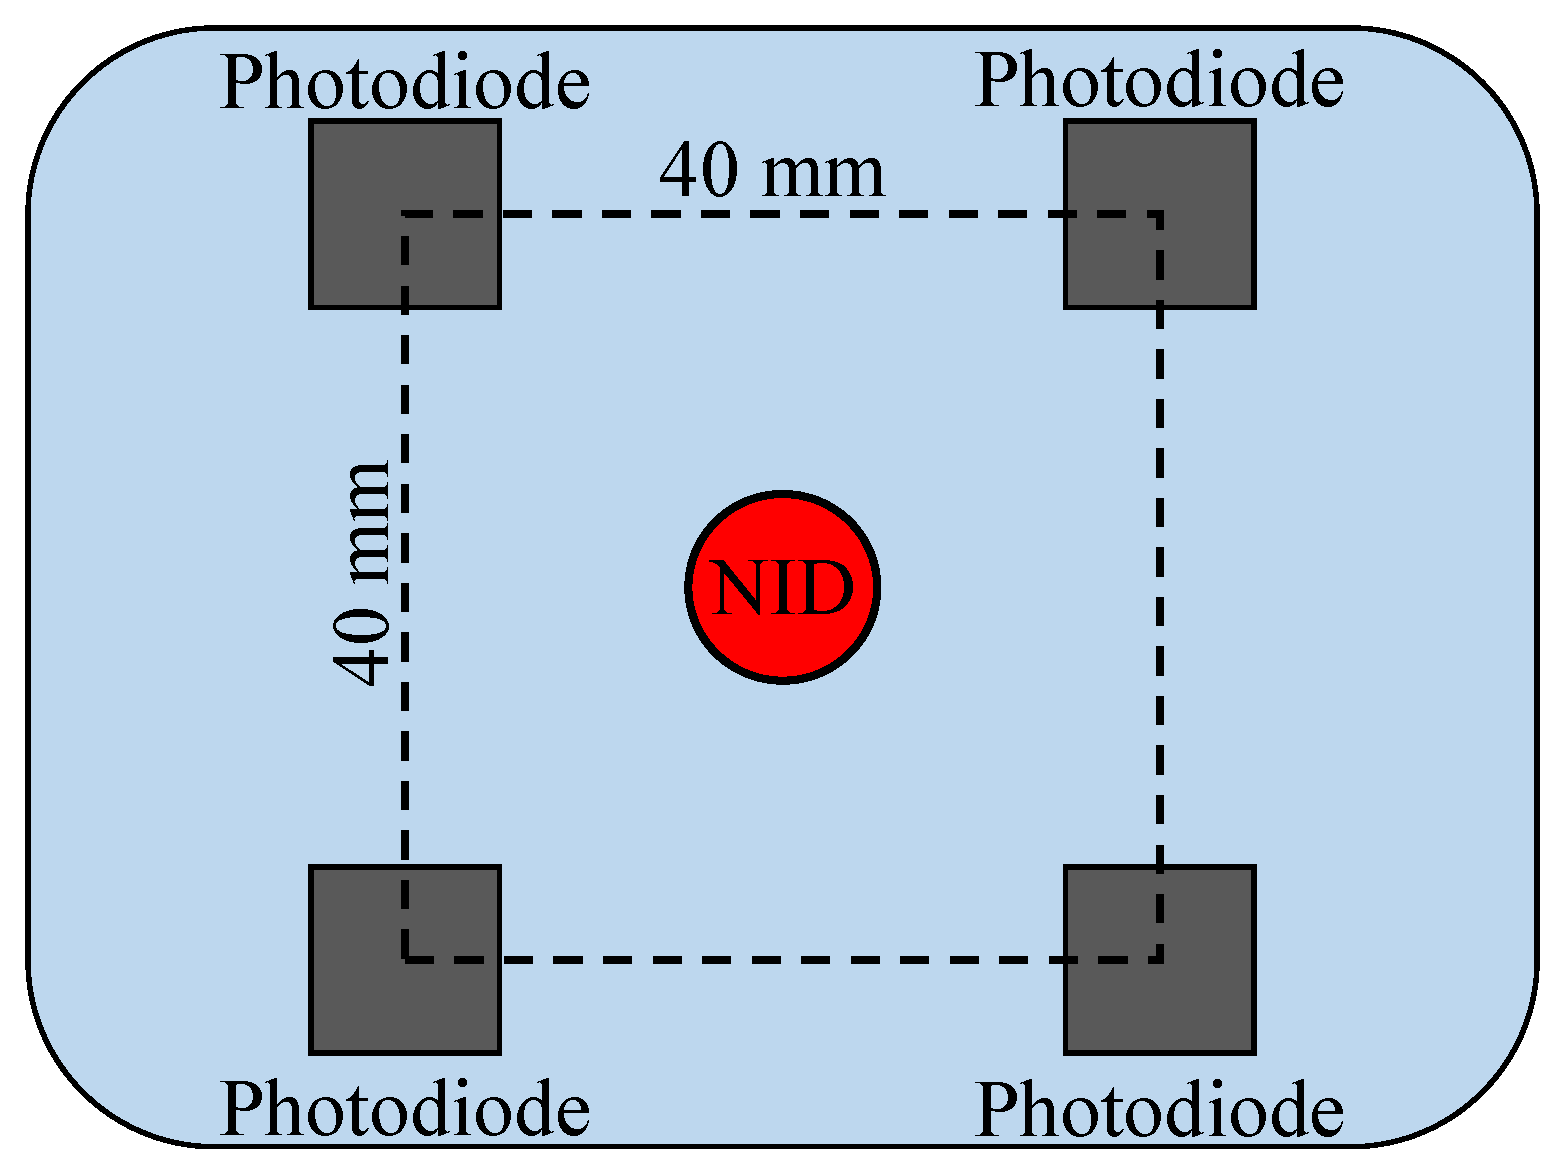
2.2. System Structure
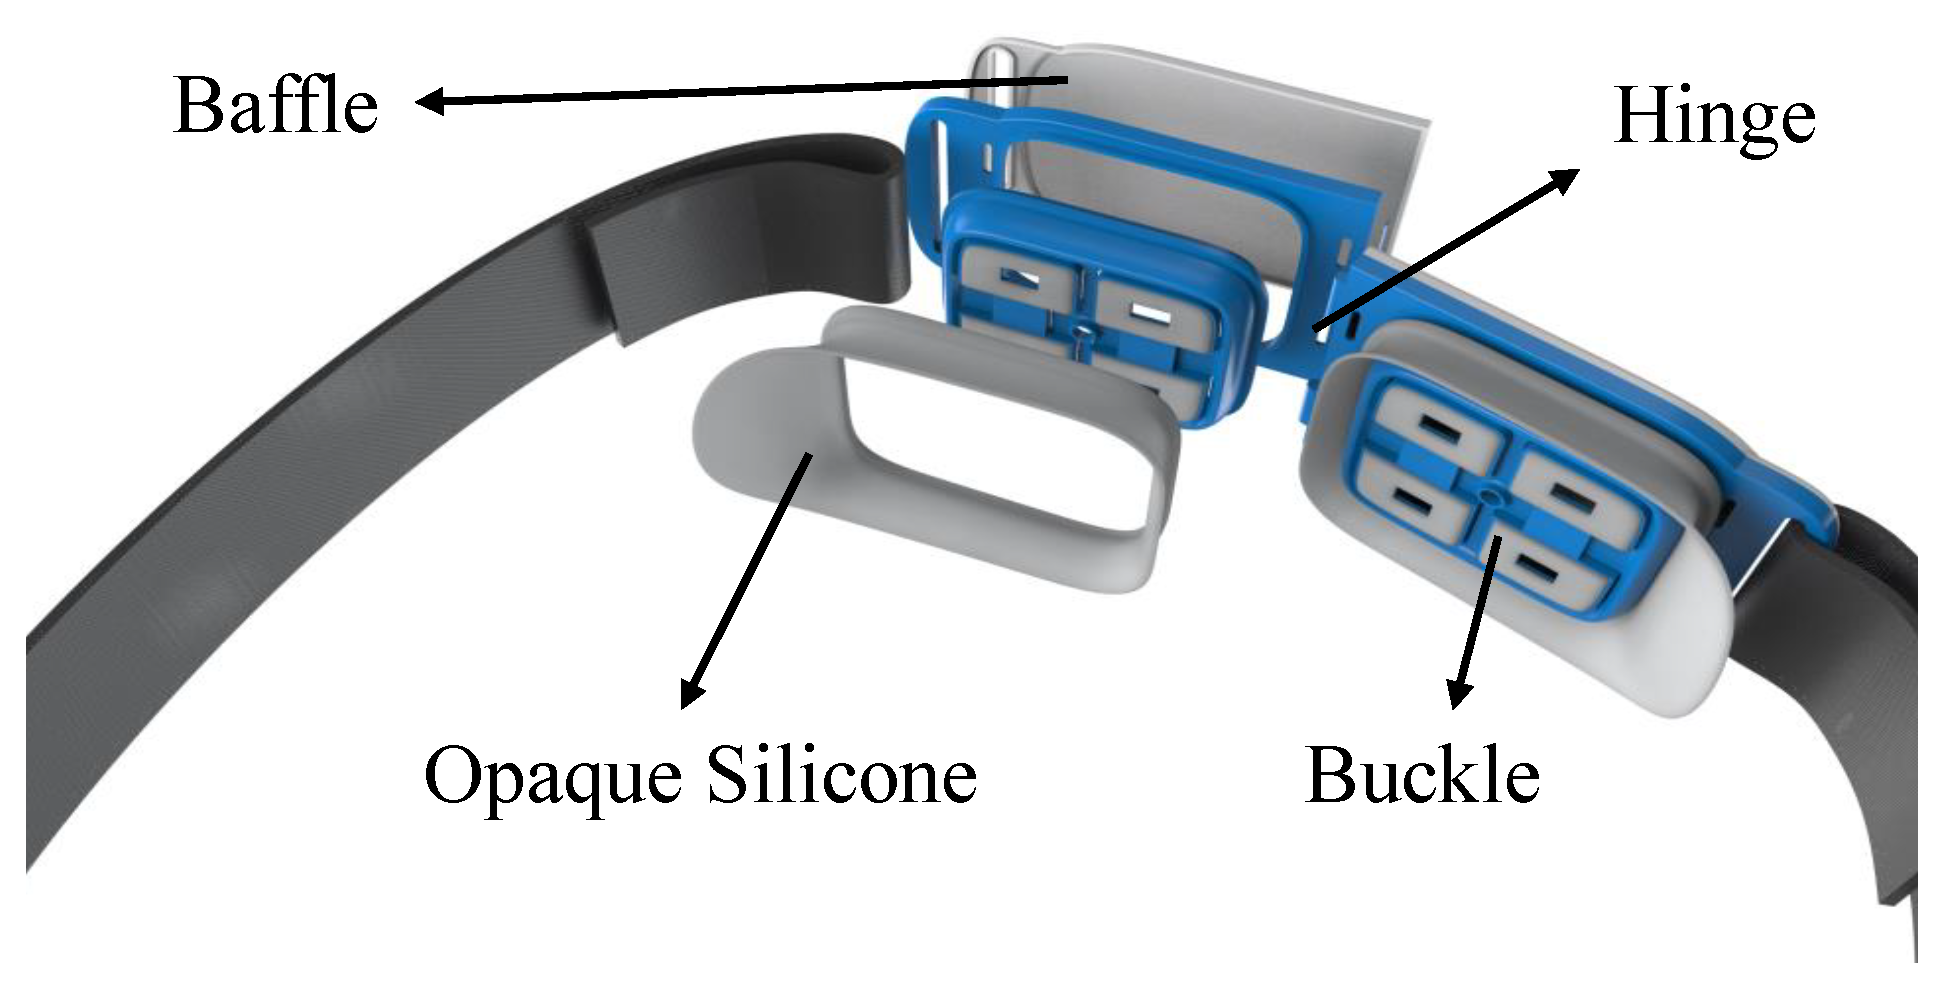
2.3. Wearable Design
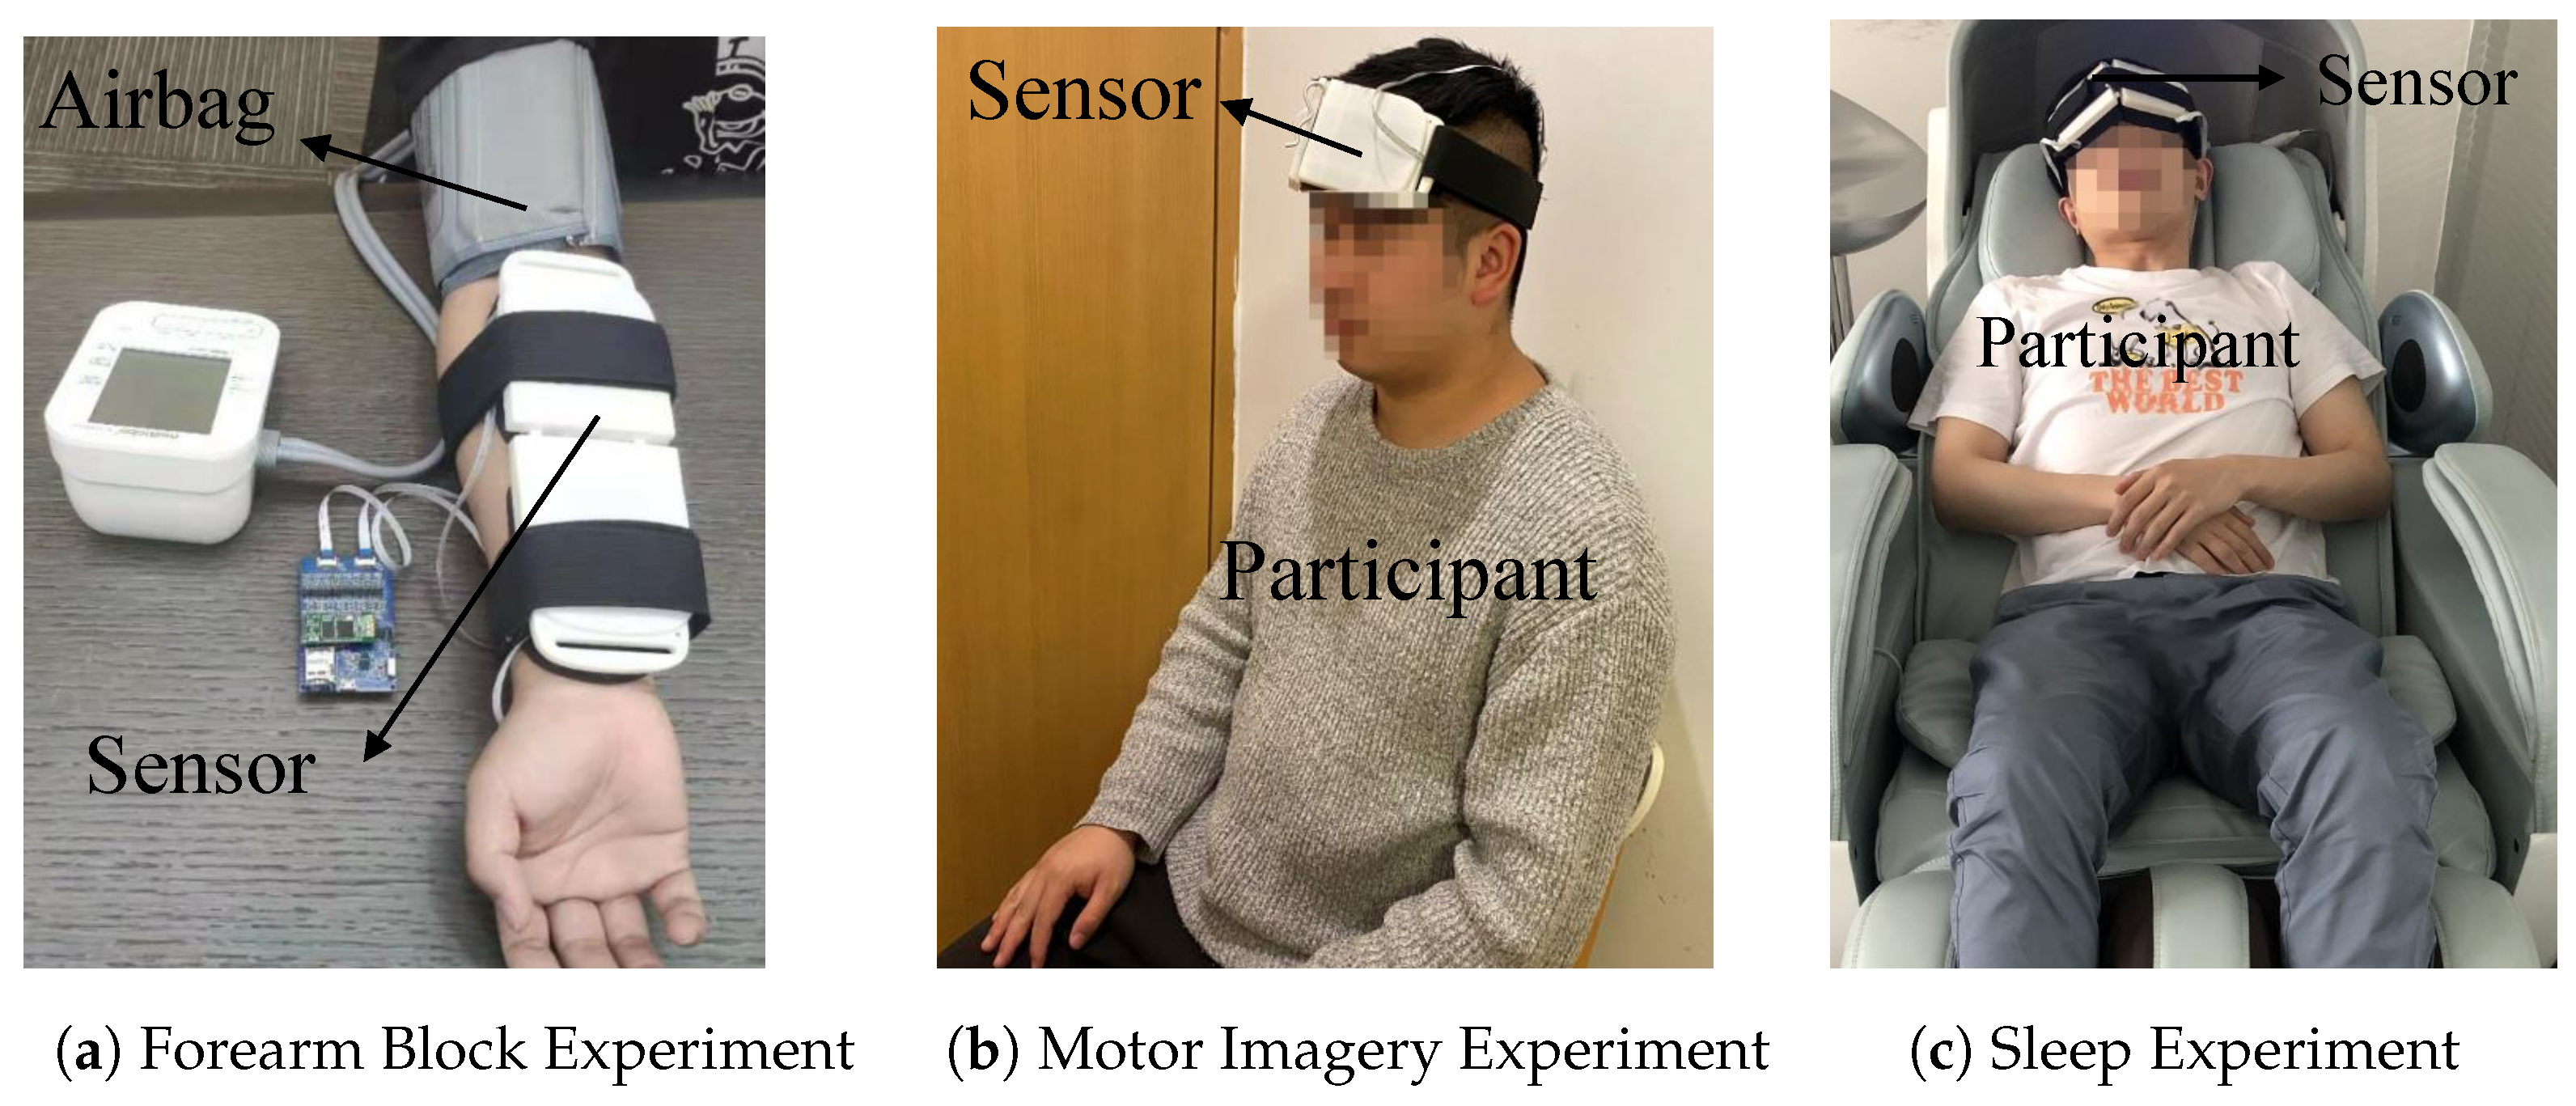
3. Experiments
- Let the participant sit upright in the chair and place his right arm parallel on the table;
- Fix the measurement system to the front side of the arm and fix the airbag to the upper arm of the participant;
- Turn on the measurement system when the participant relaxes;
- Fifteen seconds later, inflate the airbag to press the upper arm;
- Fifteen seconds later, release the airbag;
- Turn off the measurement system.
- Let the participant sit in the chair and fix the measurement system onto their forehead;
- Turn on the system and let the participant close their eyes throughout the experiment;
- Ten seconds later, ask the participant to imagine walking upstairs;
- Forty seconds later, let the subject stop imagining and relax;
- Turn off the measurement system.
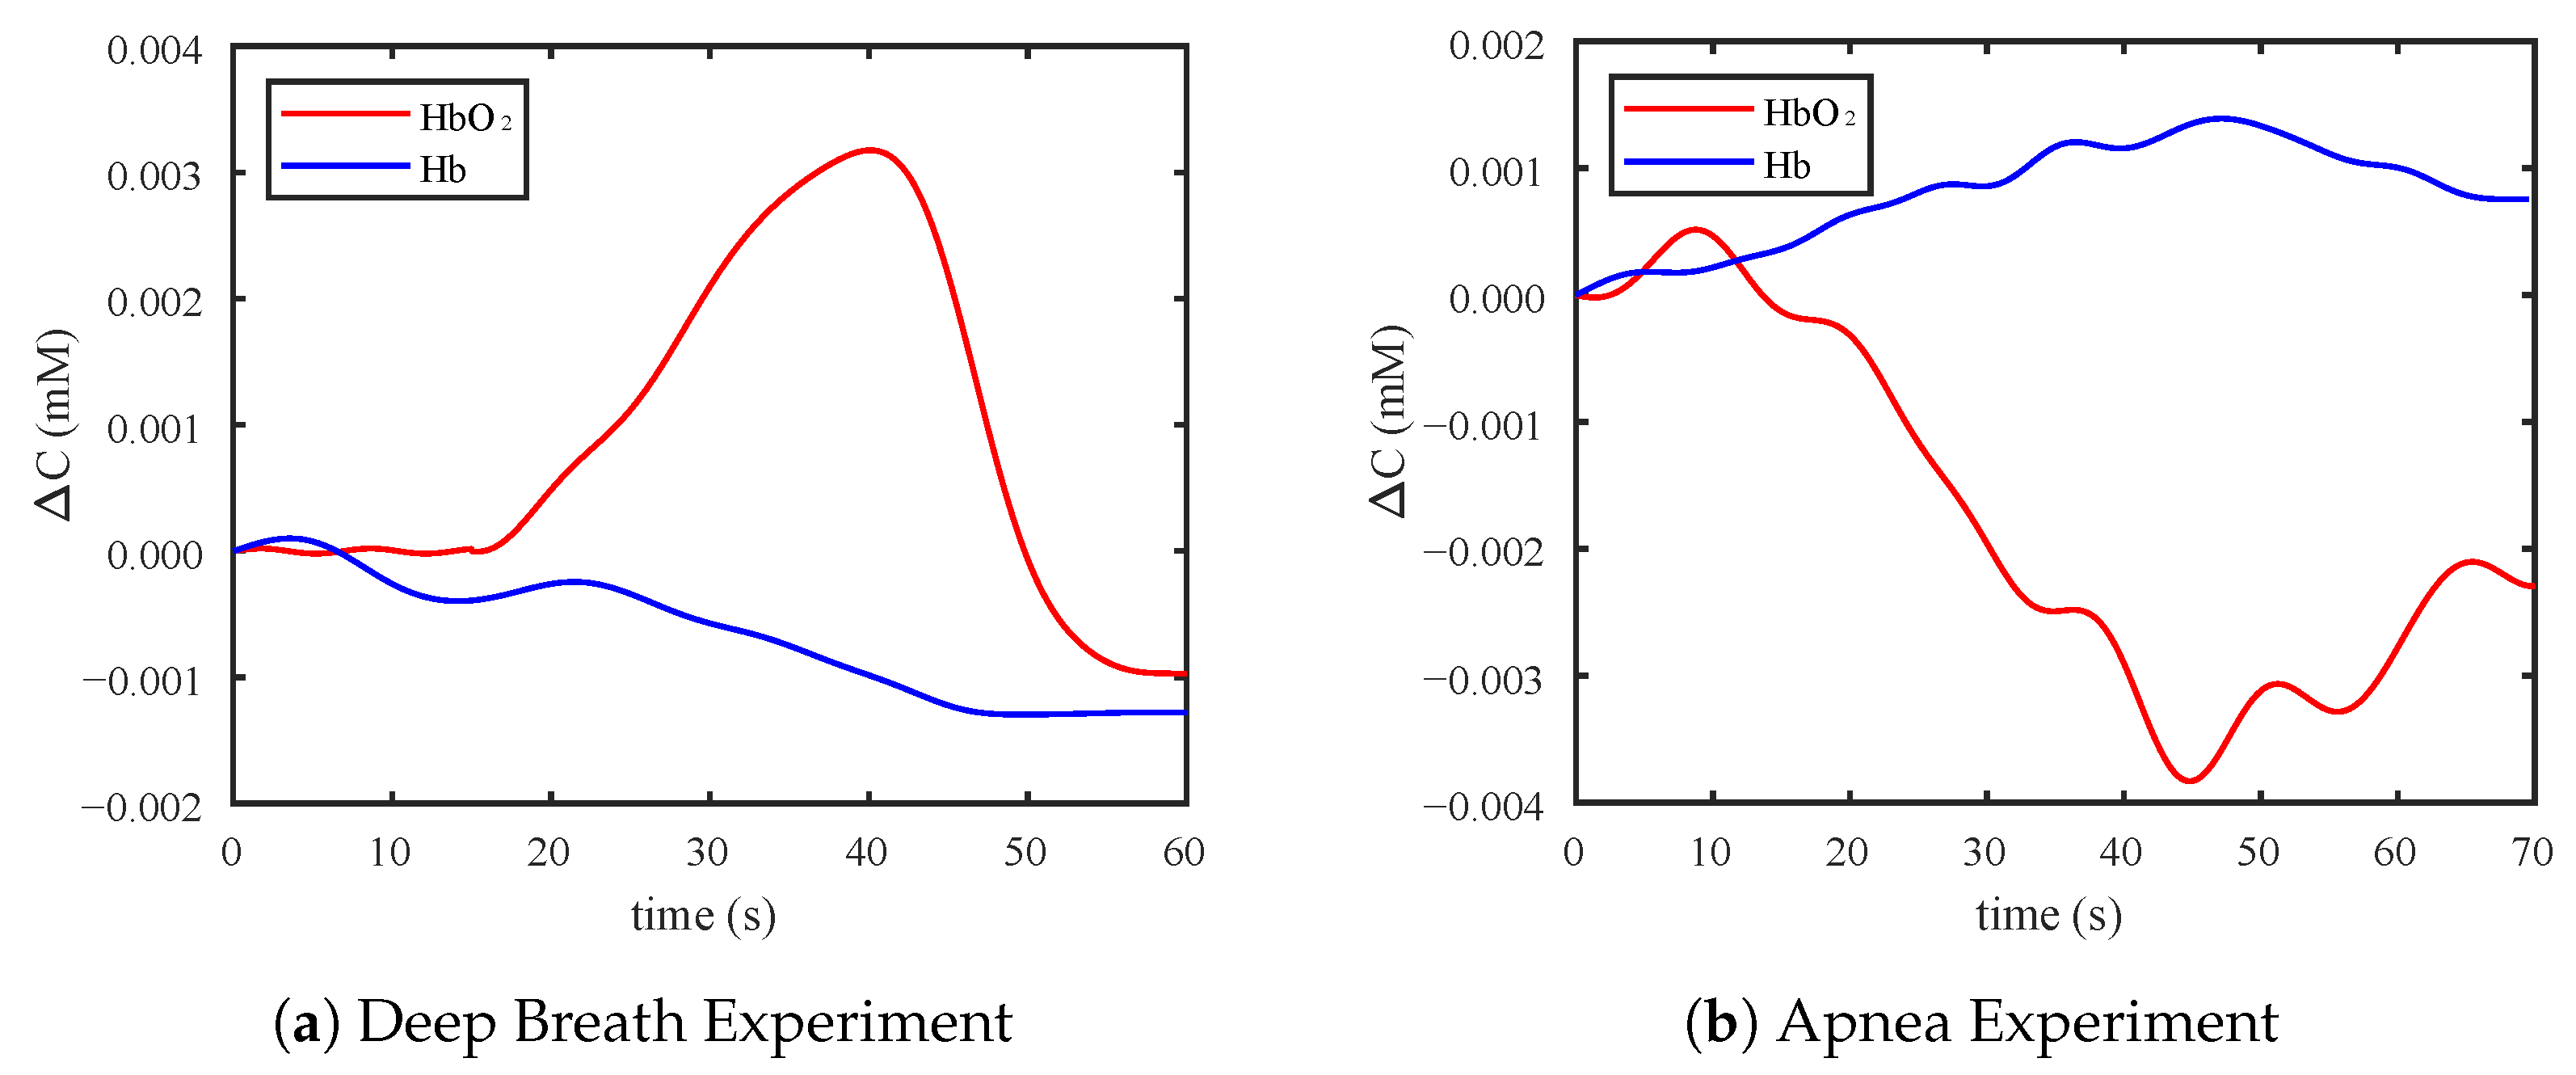
- Let the participant lie in the nap pod and fix the measurement system onto their forehead;
- Turn on the system and let the participant close their eyes throughout the experiment;
- Fifteen seconds later, ask the participant to breathe deeply or hold their breath;
- Thirteen seconds later, let the subject breathe normally;
- Turn off the measurement system.
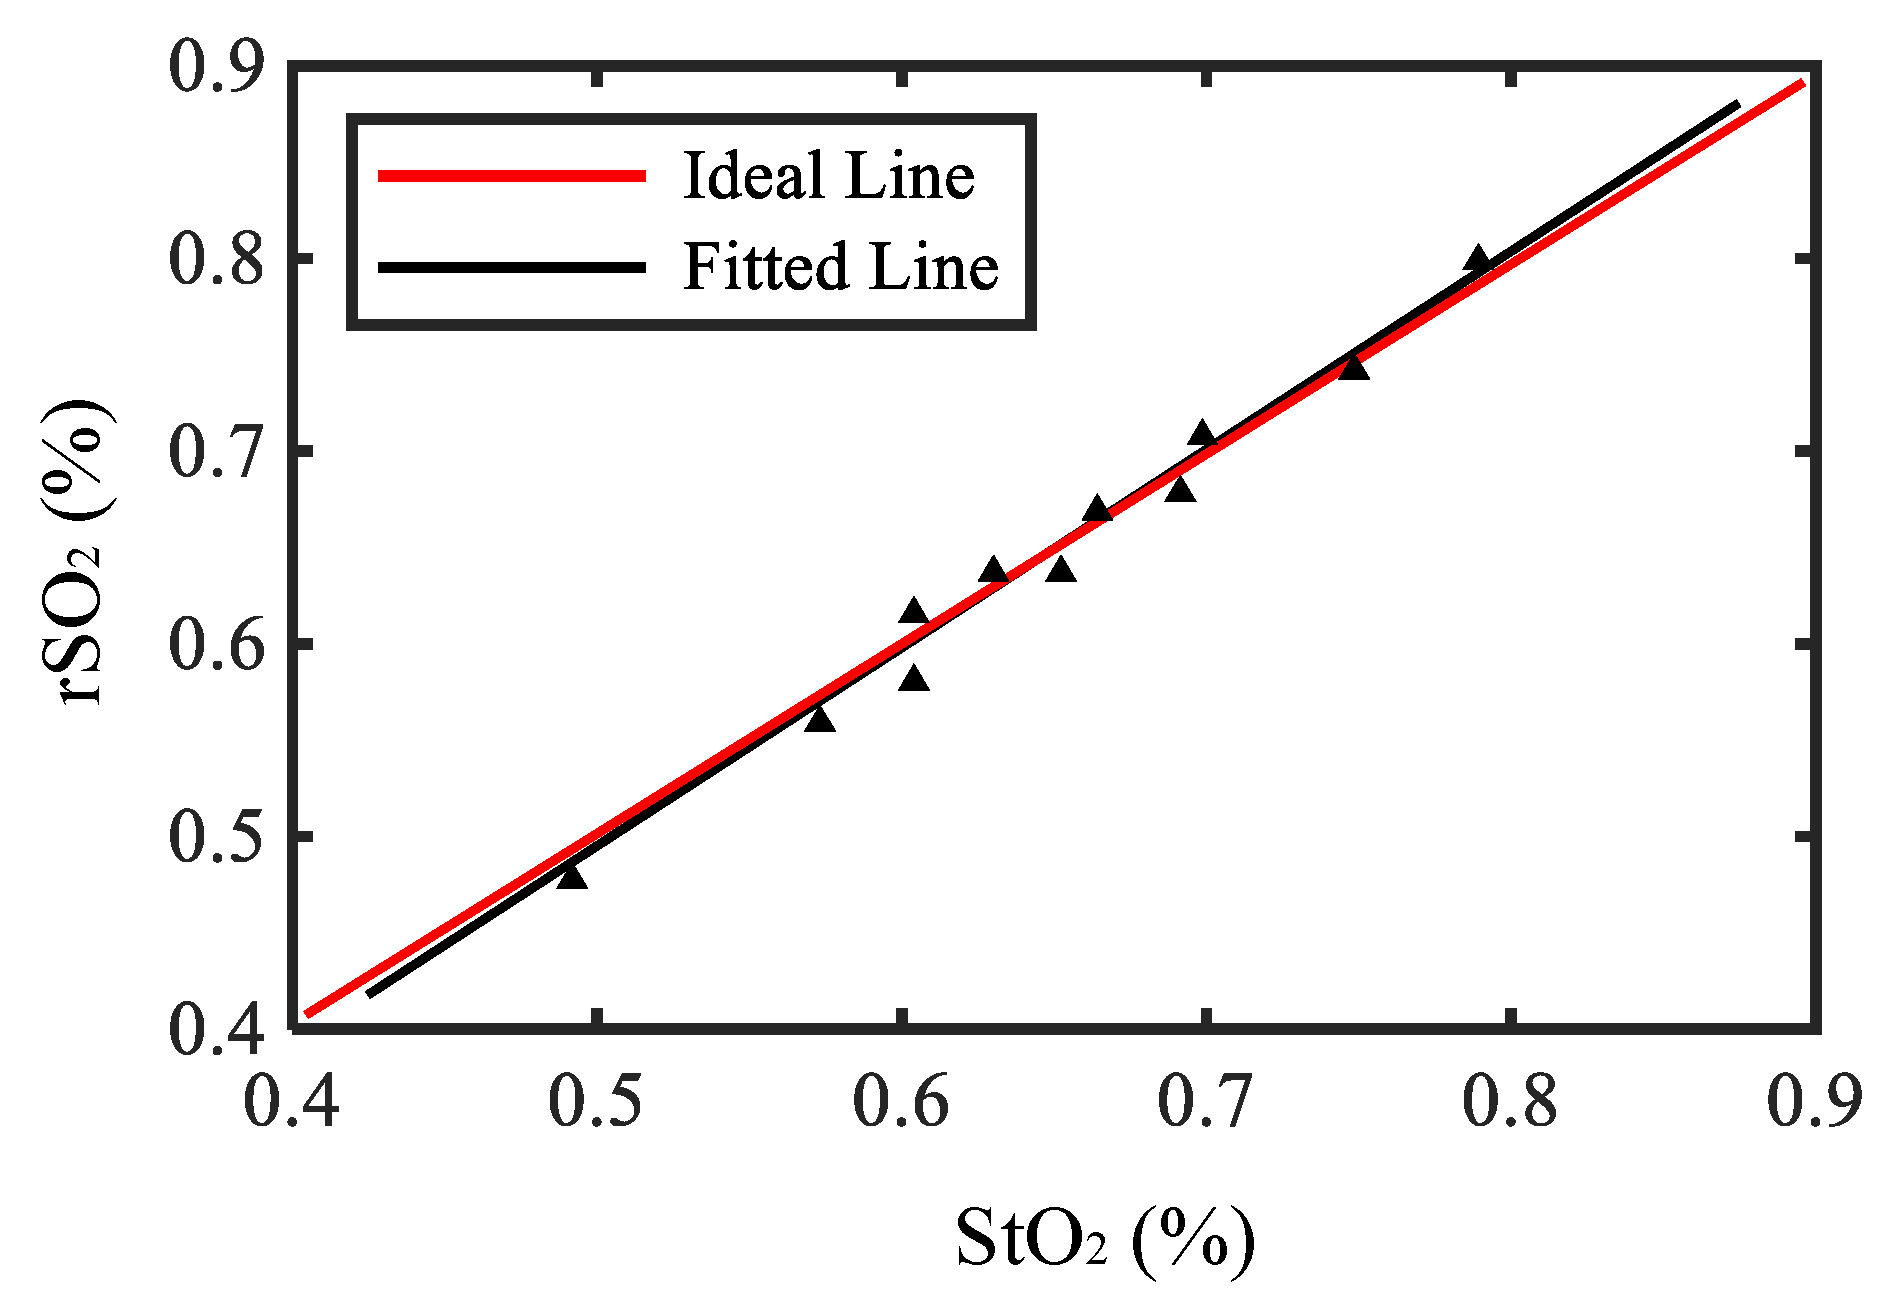
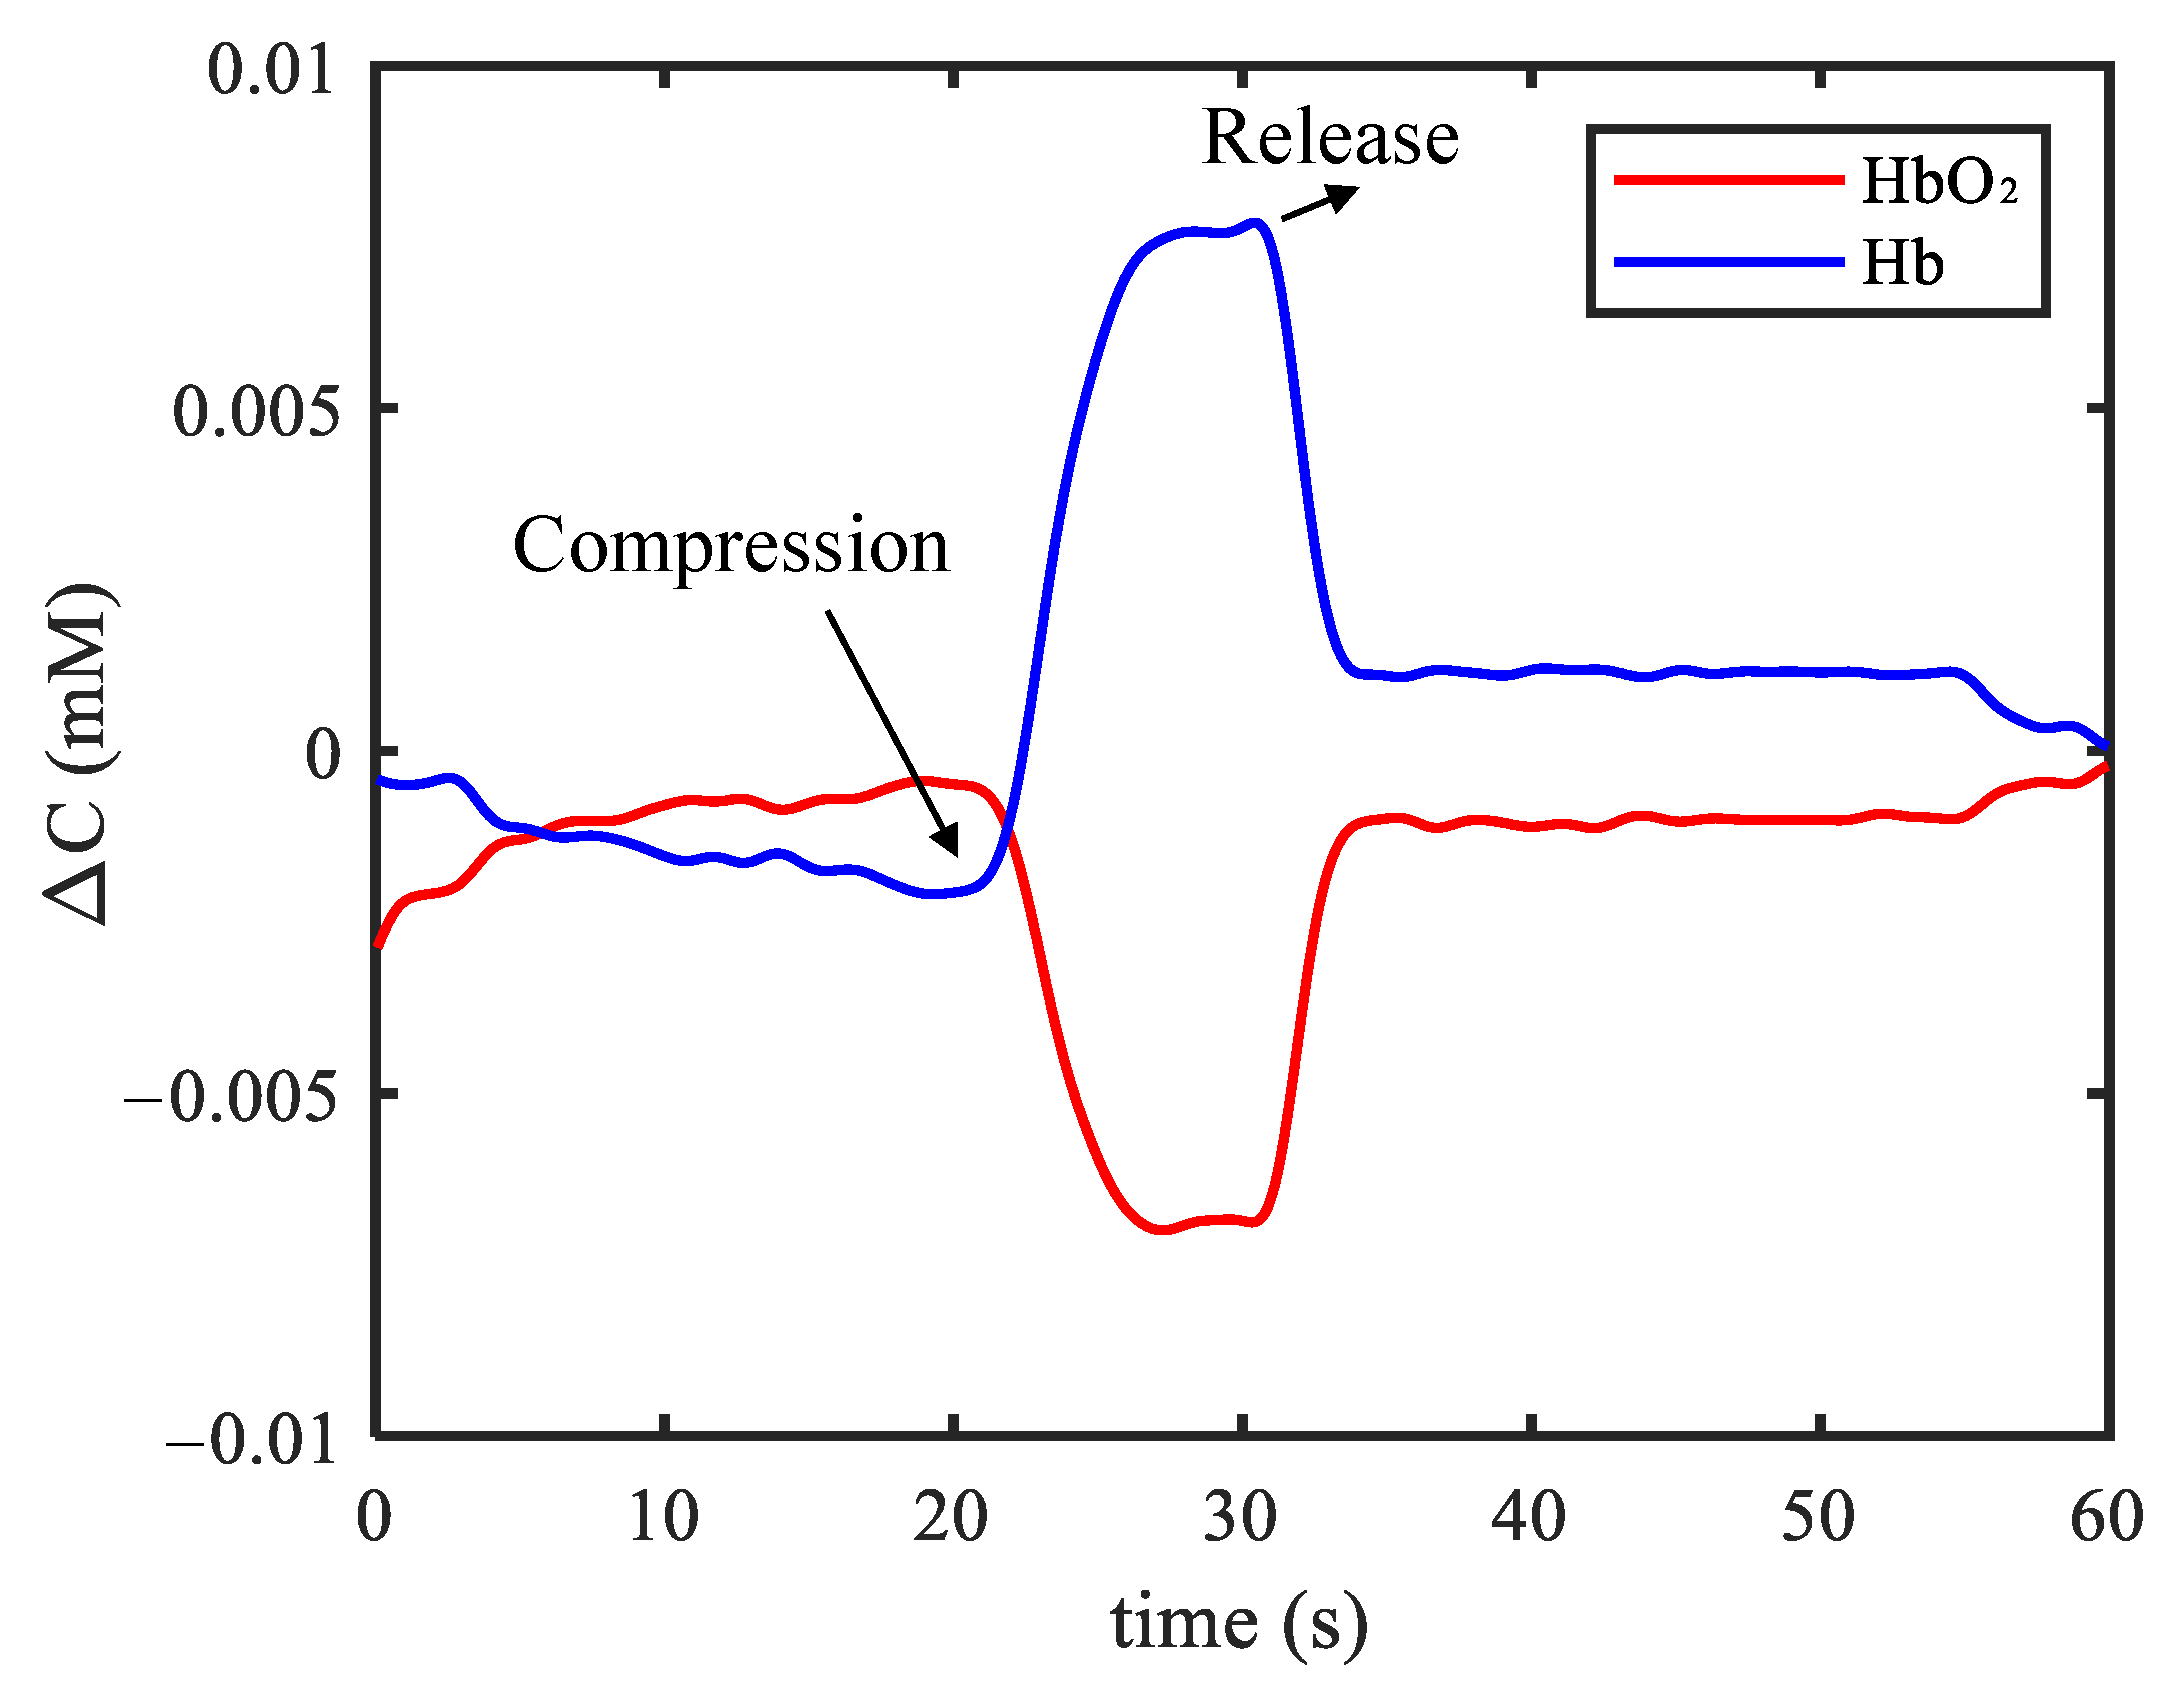
4. Results
5. Discussion
6. Conclusions
Author Contributions
Funding
Institutional Review Board Statement
Conflicts of Interest
References
- Leopold, D.; Phillips, T. Chapter 7—The importance of a good night’s sleep. In A Prescription for Healthy Living; Academic Press: Cambridge, MA, USA, 2021; pp. 93–102. [Google Scholar]
- Chisholm, K.; Ida, K.; Davies, A.; Papkovsky, D.; Singer, M.; Dyson, A.; Tachtsidis, I.; Duchen, M.; Smith, K. In Vivo Imaging of Flavoprotein Fluorescence During Hypoxia Reveals the Importance of Direct Arterial Oxygen Supply to Cerebral Cortex Tissue. Adv. Exp. Med. Biol. 2016, 876, 233. [Google Scholar] [PubMed] [Green Version]
- Sircan-Kucuksayan, A.; Uyuklu, M.; Canpolat, M. Measuring tissue oxygen saturation using NIR spectroscopy. In Proceedings of the Biophotonics: Photonic Solutions for Better Health Care IV. International Society for Optics and Photonics; SPIE: Bellingham, WA, USA, 2014; Volume 9129, pp. 369–376. [Google Scholar]
- Benjafield, A.; Ayas, N.; Eastwood, P.; Heinzer, R.; Ip, M.; Morrell, M.; Nunez, C.; Patel, S.; Penzel, T.; Pépin, J.L.; et al. Estimation of the global prevalence and burden of obstructive sleep apnoea: A literature-based analysis. Lancet Respir. Med. 2019, 7, 687–698. [Google Scholar] [CrossRef] [Green Version]
- Ben Simon, E.; Rossi, A.; Harvey, A.; Walker, M. Overanxious and underslept. Nat. Hum. Behav. 2020, 4, 100–110. [Google Scholar] [CrossRef] [PubMed]
- Kurth, C.; Levy, W.; Mccann, J. Near-Infrared Spectroscopy Cerebral Oxygen Saturation Thresholds for Hypoxia Ischemia in Piglets. J. Cereb. Blood Flow Metab. 2002, 22, 335–341. [Google Scholar] [CrossRef] [PubMed] [Green Version]
- Jöbsis, F. Noninvasive, infrared monitoring of cerebral and myocardial oxygen sufficiency and circulatory parameters. Science 1977, 198, 1264–1267. [Google Scholar] [CrossRef] [PubMed]
- Zhu, J.; Mou, J.; Liu, J. Absolute measurement of tissue oxygen saturation with NIRS. In Proceedings of the BIBE 2018 International Conference on Biological Information and Biomedical Engineering, Shanghai, China, 6–8 July 2018; pp. 1–5. [Google Scholar]
- Sorensen, L.C.; Leung, T.S.; Greisen, G. Comparison of cerebral oxygen saturation in premature infants by near-infrared spatially resolved spectroscopy: Observations on probe-dependent bias. J. Biomed. Opt. 2008, 13, 064013. [Google Scholar] [CrossRef] [PubMed]
- Oniz, A.; Inanc, G.; Taşlıca, S.; Guducu, C.; Ozgoren, M. Sleep Is a Refreshing Process: An fNIRS Study. Front. Hum. Neurosci. 2019, 13, 160. [Google Scholar] [CrossRef] [PubMed]
- Nguyen, T.; Babawale, O.; Kim, T.; Jo, H.; Liu, H.; Kim, J. Exploring brain functional connectivity in rest and sleep states: A fNIRS study. Sci. Rep. 2018, 8, 16144. [Google Scholar] [CrossRef] [PubMed]
- Ahn, S.; Nguyen, T.; Jang, H.; Kim, J.; Jun, S. Exploring Neuro-Physiological Correlates of Drivers’ Mental Fatigue Caused by Sleep Deprivation Using Simultaneous EEG, ECG, and fNIRS Data. Front. Hum. Neurosci. 2016, 10, 219. [Google Scholar] [CrossRef]
- Marik; Paul, E. Regional carbon dioxide monitoring to assess the adequacy of tissue perfusion. Curr. Opin. Crit. Care 2005, 11, 245. [Google Scholar] [CrossRef]
- Nagdyman, N.; Ewert, P.; Peters, B.; Miera, O.; Fleck, T.; Schmitt, B. Comparison of different near-infrared spectroscopic cerebral oxygenation indices with central venous and jugular venous oxygenation saturation in children. Paediatr. Anaesth. 2008, 18, 160–166. [Google Scholar] [CrossRef] [PubMed]
- Gagnon, R.; Macnab, A.; Gagnon, F.; Blackstock, D.; LeBlanc, J. Comparison of Two Spatially Resolved NIRS Oxygenation Indices. J. Clin. Monit. Comput. 2002, 17, 385–391. [Google Scholar] [CrossRef] [PubMed]
- Maswadi, K.; Ghani, N.B.A.; Hamid, S.B. Systematic Literature Review of Smart Home Monitoring Technologies Based on IoT for the Elderly. IEEE Access 2020, 8, 92244–92261. [Google Scholar] [CrossRef]
- Chance, B.; Zhuang, Z.; UnAh, C.; Alter, C.; Lipton, L. Cognition-activated low-frequency modulation of light absorption in human brain. Proc. Natl. Acad. Sci. USA 1993, 90, 3770–3774. [Google Scholar] [CrossRef] [PubMed] [Green Version]
- Duncan, A.; Meek, J.H.; Clemence, M.; Elwell, C.E.; Tyszczuk, L.; Cope, M.; Delpy, D. Optical pathlength measurements on adult head, calf and forearm and the head of the newborn infant using phase resolved optical spectroscopy. Phys. Med. Biol. 1995, 40, 295–304. [Google Scholar] [CrossRef] [PubMed] [Green Version]
- Bashkatov, A.; Genina, E.; Tuchin, V. Optical properties of skin, subcutaneous, and muscle tissues: A review. J. Innov. Opt. Health Sci. 2011, 04, 9–38. [Google Scholar] [CrossRef]
- Sitaram, R.; Zhang, H.; Guan, C.; Thulasidas, M.; Hoshi, Y.; Ishikawa, A.; Shimizu, K.; Birbaumer, N. Temporal classification of multichannel near-infrared spectroscopy signals of motor imagery for developing a brain–computer interface. NeuroImage 2007, 34, 1416–1427. [Google Scholar] [CrossRef] [PubMed]
- Everdell, N.; Airantzis, D.; Kolvya, C.; Suzuki, T.; Elwell, C. A portable wireless near-infrared spatially resolved spectroscopy system for use on brain and muscle. Med. Eng. Phys. 2013, 35, 1692–1697. [Google Scholar] [CrossRef] [PubMed]


Publisher’s Note: MDPI stays neutral with regard to jurisdictional claims in published maps and institutional affiliations. |
© 2022 by the authors. Licensee MDPI, Basel, Switzerland. This article is an open access article distributed under the terms and conditions of the Creative Commons Attribution (CC BY) license (https://creativecommons.org/licenses/by/4.0/).
Share and Cite
Han, Y.; Zhai, Q.; Yu, Y.; Wang, S.; Liu, T. A Wearable Prefrontal Cortex Oxygen Saturation Measurement System Based on Near Infrared Spectroscopy. Electronics 2022, 11, 1971. https://doi.org/10.3390/electronics11131971
Han Y, Zhai Q, Yu Y, Wang S, Liu T. A Wearable Prefrontal Cortex Oxygen Saturation Measurement System Based on Near Infrared Spectroscopy. Electronics. 2022; 11(13):1971. https://doi.org/10.3390/electronics11131971
Chicago/Turabian StyleHan, Yi, Qian Zhai, Yinkai Yu, Shuoyu Wang, and Tao Liu. 2022. "A Wearable Prefrontal Cortex Oxygen Saturation Measurement System Based on Near Infrared Spectroscopy" Electronics 11, no. 13: 1971. https://doi.org/10.3390/electronics11131971
APA StyleHan, Y., Zhai, Q., Yu, Y., Wang, S., & Liu, T. (2022). A Wearable Prefrontal Cortex Oxygen Saturation Measurement System Based on Near Infrared Spectroscopy. Electronics, 11(13), 1971. https://doi.org/10.3390/electronics11131971