1. Introduction
HAR has become a research hotspot for many years. Thanks to recent technological advances, it has been widely used in various fields, including health management, medical monitoring, human-computer interaction, sports science, and remote control [
1,
2]. HAR can be very helpful in real life. For example, a patient posture monitoring system can track daily activities and detect t falls, which is significant for senior people. A typical HAR system attempts to fulfill two tasks: collecting body-moving information and analyzing it. The raw data, like physiological parameters and body postures, is acquired through a variety of devices [
3], and then analyzed and modeled. Thus, the system can identify the activities and reveal the rules of human movements. The aim of this paper is to construct a lightweight model, while the model can be adapted to the data without I.I.D.
Sensors are the most common devices used by the HAR system to obtain individual activity data. They can capture human activities and transfer them into data representation that could be automatically processed later. Currently, the sensors can be divided into two categories: (1) fixed sensors that are installed at fixed locations, and (2) mobile sensors that are not limited by geographical positions.
Fixed sensors include acoustic sensors [
4], vibration sensors [
5], other environment-based sensors [
6], and static cameras [
7,
8]. Many researchers have attempted to develop HAR approaches using fixed sensors. The method proposed in [
8] extracted features of human activities from the frame sequences captured by cameras and constructed a robust neural network model to classify these activities. Ajmal et al. [
9] proposed a multi-level context feature and context estimation method based on unlabeled datasets. This method could recognize complex human activities from videos. Ayhan et al. [
10] believed that different activities exhibit different rhythms, and developed a method to identify activities from long videos by differing changes in these rhythms. Oguntala et al. [
11] established a simple and novel multivariate Gaussian distribution framework. It enhanced the prior information from passive RFID tags to obtain more detailed activity description. These fixed-sensor-based methods can deploy mature computer vision technologies and output satisfying results [
12]. However, fixed sensors are limited by environments and personal privacy policies, and human activities in the real world do not occur in a fixed place.
Mobile sensors can solve the above problems. They are non-invasive, easy to deploy, and can keep monitoring continuously. A variety of mobile sensors are now available for HAR applications, including acceleration sensors, gyroscopes, magnetometers, barometers, light sensors, etc. [
13,
14,
15]. These sensors are increasingly miniaturized and easily integrated into different devices, like smartphones, smartwatches worn on human wrists [
16,
17], and glasses equipped with ubiquitous computing capabilities [
18].
HAR is regarded as a typical pattern recognition problem, involving four steps: (1) data collection; (2) data pre-processing; (3) feature extraction; and (4) time sequence modeling.
The last step, time sequence modeling, is the most crucial one for HAR and has been solved by traditional machine learning methods, such as Support Vector Machine (SVM), Decision Tree (DT), Random Forest (RF), and K-Nearest Neighbor (KNN). Although they have achieved good performance, they all rely heavily on handcrafted feature extraction, which is usually driven by domain knowledge and can only capture shallow features from the input data.
Deep-learning networks had been used in HAR. Garcia et al. [
19] constructed a classic CNN-LSTM model to identify human activities. Zhou et al. [
20] introduced a cascaded parsing network using Graph Parsing Neural Network (GPNN) to recognize Human Object Interactions (HOI) in images.
Attention has been used in many fields. For example, by only using attention, machine translation tasks developed by Vaswani et al. [
21] could achieve a superior performance. Hu et al. [
22] used SE block to catch capture channel weights. This approach performed well in image recognition. Sun et al. [
23] introduced BERT to recommendations. Zhou et al. [
24] presented Motion-Attentive Transition (MAT) to capture leverage motion cues for video object segmentation.
Some researchers adopted the attention mechanism into deep learning networks for HAR tasks. Sun et al. [
25] deployed the temporal attention in LSTM to select the more important information from the original sensor data of all activities. Zhang et al. [
26] integrated the attention mechanism into a multi-headed CNN and conducted proof-of-concept experiments on public datasets established by Wireless Sensor Data Mining (WISDM) laboratory.
Most of the existing methods assume that the dataset has I.I.D. Under this assumption, both the traditional methods and the deep learning methods exhibit better classification performance. However, the traditional methods rely on manual feature extraction, and the deep learning models, while addressing the drawbacks of traditional methods, also suffer from multiple parameters and high resource consumption, which hinder their application on mobile devices and limit their real-time performance. Moreover, few researchers have studied the performance of models under datasets without I.I.D.
While achieving classification accuracy for data with I.I.D., we add the channel attention and the temporal attention to the traditional GRU network to address the decay of accuracy when the model classifies data without I.I.D., and reduce the number of parameters and the resources consumption of the model to facilitate its use in the embedded devices.
2. The Proposed Model
The workflow of the proposed model is shown in
Figure 1. First, the input data is processed through the feature-processing module for the raw collected sensor data, which consists of four parts: data preprocessing, time slicing, feature boosting, and channel attention. Second, each slice of the time-sliced data is fed into the GRU network to generate temporal features. Third, the temporal processing module uses the temporal attention and the fully connected layer for the recognition of specific human activities. The ⊙ in
Figure 1 represents the element-wise multiplication that determines how much past information needs to be forgotten and how much information from the previous moment and the current moment needs to be passed on.
Compared with traditional deep learning, the proposed model in this paper can run faster and the trained model can be adapted to multiple time-slice sizes of sensor data input. In this paper, we use fixed-size time slice data to adapt the training with batch-size >1.
The model can be divided into three logic components, the feature extraction with the channel attention, the GRU, and the temporal attention. The logic structure of the model is illustrated in
Figure 2, which illustrates the data flow process for input with a sliding window size of 128 and a hidden state of 16. The channel attention is implemented using squeeze-and-excitation, and squeeze compresses the number of input channels into a quarter. To guarantee that the channel attention acts, feature extraction is performed using a 1 × 1 conv, increasing the dimension from 6 to 16.
2.1. Data Pre-Processing
Sensor data collected from the real world usually contain noises. In order to reduce the influence of noises, a third-order low-pass Butterworth filter with a cut-off frequency of 40 Hz is used to remove high-frequency signals. For most human activities, denoising can highlight body movements and ignore the noise caused by irregular vibrations during sensor acquisition.
After denoising, we calculate the mean and the variance of the training set and use them to normalize both the training set and the test set. This process facilitates faster convergence of the neural network.
2.2. Channel Attention
The channel attention is a lightweight mechanism. It can focus on the information more relevant to the task by calculating the importance of each sensor axis and assigning weights to a different axis.
In the HAR system with multi-axis sensors, one channel represents one spatial direction, but in most cases, movements in some directions can be ignored, for example, the vertical direction of a waist sensor or the arm direction of a watch sensor. The channel attention can help to ignore those less useful data and focus on the data in the most important directions. Thus, the model can be further improved.
We use a convenient way to operate the channel attention mechanism. First, a 1 × 1 convolution layer is set to extract high-dimensional features. Second, a 1D average pool and two 1 × 1 convolutions are used for squeezing and excitation. The motive for using a 1-dimensional operation here is to decouple the correlation between the parameters and the sliding window size. This convolution operation performs a feature boosting, which facilitates the second squeeze step. The attention of the raw data is defined as:
where W
2 and W
1 are the weights of the convolution layers from the squeezing and the excitation modules, w
i,c is the feature after feature boosting, respectively; G is the average pooling of the features, and G(A) =
;
is the ReLu function, and
is the Sigmoid function.
2.3. Temporal Attention
In RNNs, information may be lost when a long sequence is transformed into fixed-length vectors, and the attention mechanism is introduced to address this. It is often applied in the fields of computer vision and natural language processing (NLP).
In the HAR task, traditional RNN networks have difficulty capturing important information about long-time activities because they use the last moment of hidden states for classification without paying attention to the previous hidden states. The temporal attention mechanism can solve this problem by aggregating all the hidden states and reinforcing the data of important moments among them. In our proposed model, a soft self-attention mechanism is used to determine the weight of each moment, and the soft self-attention mechanism does not impose additional parameters. The weight of the temporal attention is expressed as:
where
is the attention input and d is the size of
.
indicates the dimension to which the SoftMax function is applied. The SoftMax function can scale the weights into [0,1] and change them into the attention weights. The resulting feature is the average of the attention weights multiplied by the feature sequence.
Different from the classic attention mechanism, the self-attention can achieve good results using only the data itself. In our model, the soft self-attention mechanism is computed using a scaled dot product model, this model measures the correlation of features at different moments by dot product and generates more stable gradients by scaling.
3. Experiments and Results
We conducted a series of experiments to validate the proposed approach’s performance from five perspectives:
Ablation experiments to evaluate the effect of different combinations of dual attentions;
Comparison between the proposed model and the traditional HAR methods;
Visualization of the temporal attention to investigate its interpretability;
Parameter sensitivity analysis of the sliding window size and the hidden state of the model;
The evaluation of the proposed model on the single sensor data and the multi-sensor data.
In this section, CA represents the channel attention and TA represents the temporal attention.
3.1. Dataset
We conducted the experiments on the dataset that was established in a controlled laboratory environment at the University of Ulster. There are 1,817,583 samples from 10 different volunteers, equivalent to 4 h of collection. It contains 6 activity labels. The specific descriptions of the dataset are listed in
Table 1.
This dataset contains 10 subjects, sampling at 102.4 Hz and ±2.0 g (g = 9.8 m/s) amplitude range. All experimental data were collected by accelerometer and gyroscope, which have three-axis. By using UMAP [
27], we obtained the visualization description of the data, as displayed in
Figure 3.
Figure 3 depicts the two-dimensional representation of the six activities we selected. It presents the relationships between data points with different labels. Different colored dots represent different human activities. All points in
Figure 3 represent a 128*6 tensor. The distance from point to point partly represents the local distance between higher dimensional vectors. It clearly exhibits the essential characteristics of the dataset. For example, when a user is walking or running, the sensor data form rings in
Figure 3.
3.2. Experiment Setup
The platform we established for the experiments included a laptop with a CPU of i7-8565U and a 16G DDR3 memory for data pre-processing and operating the trained model, a server with a CPU of Intel(R) Xeon(R) Gold 6226 and TESLA V100S for model training, the software of SciPy, NumPy, Pandas, and PyTorch for pre-processing signals and UMAP for visualizing high-dimensional data.
During the model training, the sliding window size was 128, lasting about 1.25 s, and the overlap size was 1, lasting about 0.01 s. The sliding window size is determined based on a trade-off between the amount of information in the time slice and the resource consumption. Detailed parameter sensitivity analysis is presented in
Section 3.4. The model was trained with the Adam optimizer using cross-entropy. The learning rate, beta1, beta2, weight decay, and epochs were set to 0.0005, 0.9, 0.999, 0.001, and 50, respectively. The Batch size was set as 512 and the dropout was set as 0.8.
3.3. Evaluation Indexes
We used the following metrics to assess the models. First, Accuracy, F1-score, and confusion matrix were used to evaluate the model’s classification ability.
where TP stands for true positive, TN for true negative, FP for false positive, and FN for false negative. These parameters can be obtained through the confusion matrix.
Second, we used model parameters, multiply and accumulate operations (MACs) and the running time to investigate the resource consumption of the model. MACs is a commonly used indicator to evaluate the computational complexity of a model. It represents the total number of multiply-add operations performed by the model. Since the computational complexity cannot represent the running time, the average time of 10,000 predictions that a model spends is used to measure the computing power. In the prediction process, the Batch size was set to 1 and the model was running on a CPU to simulate the state of the algorithm running on wearable devices.
3.4. Parameter Sensibility Analysis
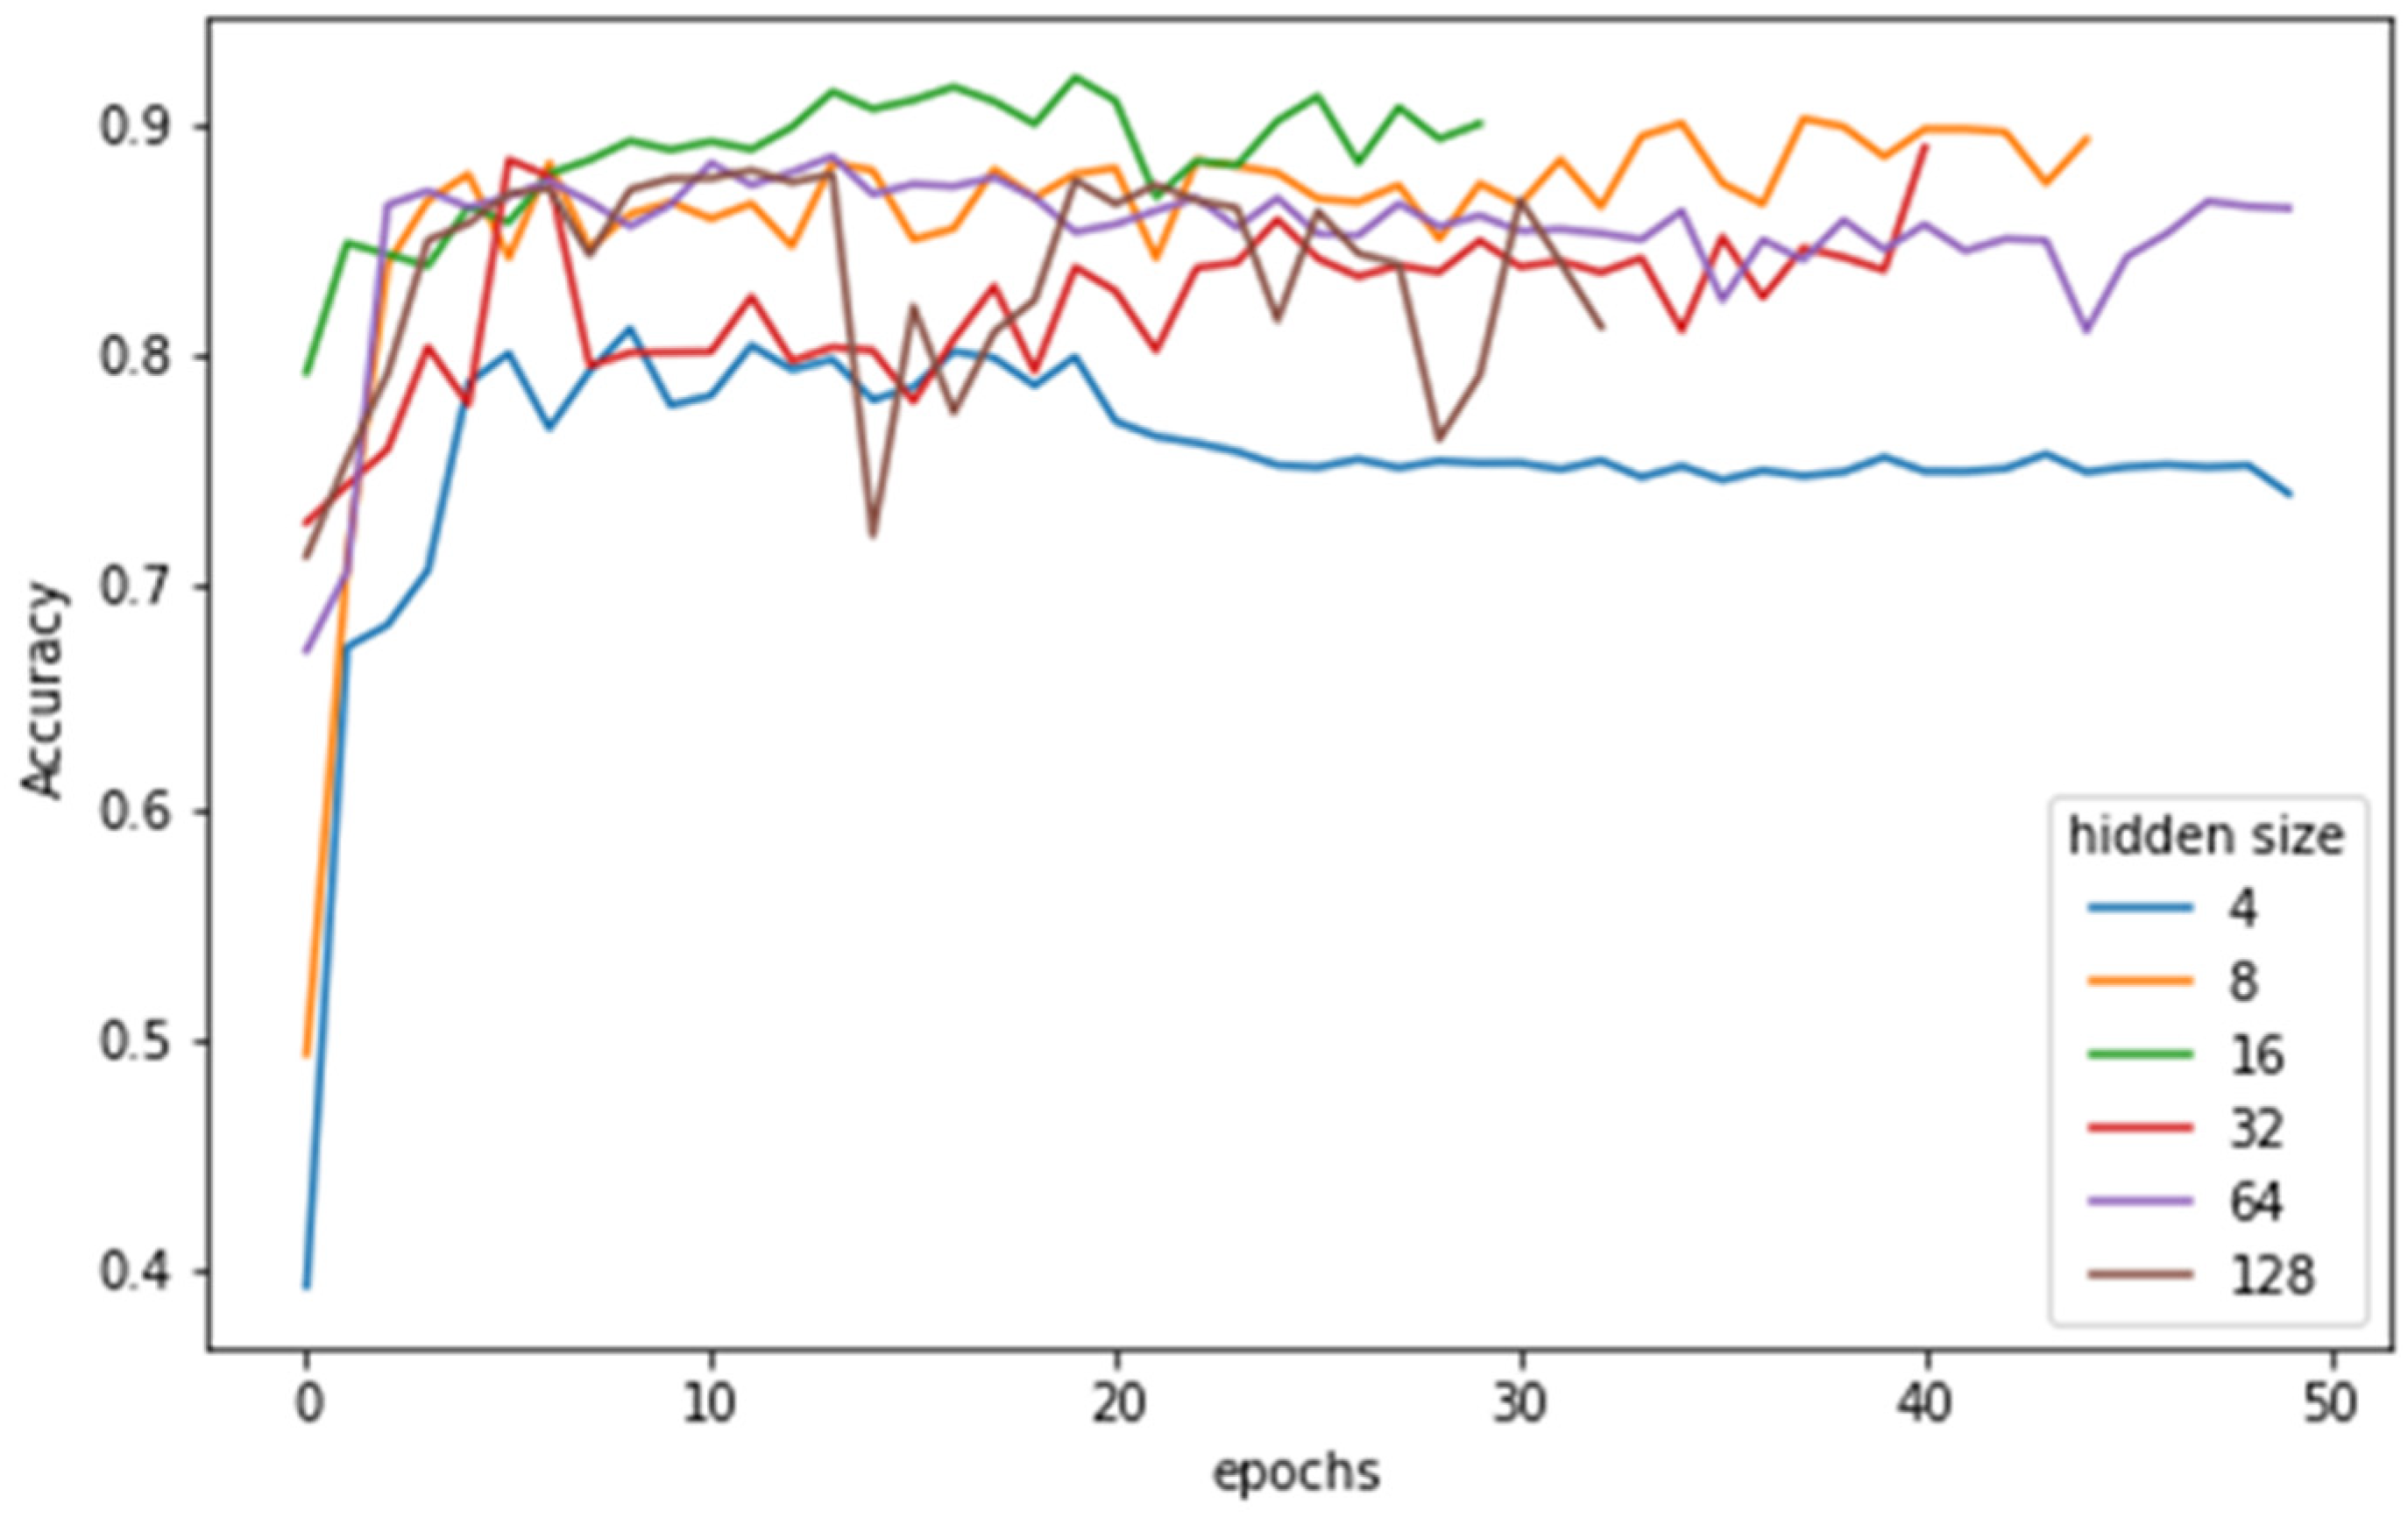
The sliding window with a fixed size of 128 and the hidden state of 16 was also subjected to sensitivity analysis. First, we used different hidden states of 8, 16, 32, 64, 128, and 512 to examine how hidden states affect classification by using 128 fixed state data. Second, sliding windows with 32, 128, and 256 were used for sensitivity analysis. The results are listed in
Figure 4 and
Table 2.
Figure 4 shows the test accuracy for each epoch in different hidden states. To prevent overfitting, we used early stopping with a patience of 3. We used the model from the last third epoch for evaluation.
With the hidden state of 4, the model exhibited underfitting; while the model with the hidden state of 8 and 16 performed well. When the hidden state was increased, the test accuracy fluctuated gradually. For this dataset, if accuracy is not the first consideration, the hidden state of 8 may be a better choice.
Table 2 shows model performance for different lengths of time series. The average time is the average number of milliseconds per run, calculated by averaging 10,000 runs, representing the resource consumption. Short-time series lack enough information to classify. Sliding windows with the size of 128 and 256 achieve the same accuracy. The f1-score indicates that using longer time series, “stand”, “walk” and “clean” perform better.
The results show that a sliding window size greater than or equal to 128 can provide sufficient information for classification. Longer sliding windows provide only a small accuracy gain with a significant increase in resource consumption. Therefore, a sliding window size of 128 is a better choice considering the classification effect and the resource consumption.
3.5. Ablation Experiments
We designed the ablation experiments to value the effect of the channel attention and the temporal attention. We constructed four models, the naive GRU, the GRU with the channel attention, the GRU with the temporal attention, and the GRU with dual attentions for this experiment. We divided the dataset for these four models in two ways: the first way was to obtain the dataset with independently identical distribution (I.I.D), while the second was without I.I.D. These two ways correspond to the distribution of data in an ideal situation and the distribution of data in real life.
When dividing datasets, we split the time series after Butterworth filtering to 512 size time slices. Randomly selecting time slices allows the dataset to satisfy with I.I.D. while selecting time slices according to different volunteers makes the dataset without I.I.D. For each time slice, we used a 128-size sliding window at step size 1.
3.5.1. Experiments on the Datasets with I.I.D.
Traditional machine learning methods require I.I.D. for the training set and the test set. In most fields, it is a basic assumption of the data. In this experiment, we ignored the differences between persons and obtained the training set and the test set with the same distribution. Here, we divided the training set and the test set at 7:3 and deployed the four attention models for the ablation experiments. The results are listed in
Table 3.
In
Table 3, compared with the accuracy and the F1-scores of the model of GRU + TA, they are higher than those of the GRU and the GRU + CA. This indicates TA worked better. However, the two indexes of the GRU + TA are lower than those of the GRU+ CA + TA. The latter obtained the best effect with an accuracy of 0.992. For almost all activities, the models of GRU with either CA or TA achieved satisfying results, but more accuracy improvement came from TA. Further discussion of why CA has not been significantly effective is presented in
Section 4.
Figure 5 shows the confusion matrix of the GRU + CA + TA model on the datasets with I.I.D. The most obvious misclassifications came from “walk” and “clean”: 1145 samples of “walk” were misclassified as “clean”, and 654 “clean” were mistaken as “walk”. The rest of the other misclassifications were less than 400.
3.5.2. Experiments on the Datasets without I.I.D.
In HAR, most of the data in the real environment do not have I.I.D because the measured individuals usually have differences: in age, body size, etc. These differences cause the collected data to have different variances and means.
Therefore, we divided the dataset according to different individual volunteers to analyze the effect of the attention mechanism in real situations. We randomly selected the data of volunteer #2 as the test set and the data of the other 9 volunteers as the training set. The ratio of the training set to the test set is about 9:1.
Table 4 lists the ablation experiments of the four attention models on the datasets without I.I.D.
The model of GRU with dual attention mechanism, output the highest accuracy, as the results in the fourth row in
Table 4 indicate. The second and the third rows in
Table 4 indicate that CA and TA also worked as we expected.
The F1 scores in
Table 4 imply that numerous errors occurred in the classification of both “walk” and “clean”. As the two close curves of “clean” and “walk” in
Figure 3 indicate, the two movements are so similar that the models can hardly distinguish them. Comparing the F1 scores in the second and the third rows in
Table 4, we could infer that CA worked better in the classification of “stand”, “sleep”, “watch” and “run”; while TA was good at identifying “walk” and “clean”. The F1 scores in the fourth row reveal that the model of GPU with dual attentions had a great effect on the movements of “stand”, “walk” and “run”.
Compared to the results in
Table 3 and
Table 4, we found that the accuracy of the experiments on the datasets without I.I.D was decreased by at least 10% from that on the datasets with I.I.D. The model with dual attentions performed the best, and either CA or TA can improve the model’s performance independently.
Figure 6 exhibits the confusion matrix of the GRU + CA + TA model on the datasets without I.I.D. The most errors came from the classification of “walk” and “clean”: 6241 “clean” were regarded as “walk”, and 3357 “walk” were identified as “clean”. In addition, some errors also occurred in the classification of “watch”, with a total of 5124 samples being misclassified into other types.
3.6. Comparison Experiments
We conducted a series of experiments on datasets without I.I.D by deploying the proposed model (GRU with dual attention mechanism) and the six classic machine learning methods, including the SVM (rbf), the SVM (linear), the SVM (poly), the KNN, the Light GBM, and the Random Forest. The results are listed in
Table 5.
In
Table 5, the proposed model achieved the best accuracy of 90.2%. Among the other six machine learning methods, the Light GBM acquired the best performance with an accuracy of over 88%. All the six models acquired a low accuracy on the activities of “walk” and “clean”, which echoes the results of the previous two experiments. This implies that all the models are hard to extract a representation of some similar activities. For the classification of “sleep” and “watch”, the Light GBM performed the best, even better than the proposed model. However, the proposed model worked the best on “walk” and “clean”, indicating that it is more apt to distinguish confusable activities.
3.7. Resources Consumption
HAR tasks usually require rapid response and cost fewer resources. We listed the number of model parameters, MACs, and the average running time for 10,000 operations of the four models: GRU, GRU + CA, GRU + TA, and GRU + CA + TA in
Table 6. These data were obtained under the following conditions: the Batch-size was set 1 since sensors do not contain GPUs and the model needs to predict results in real-time; the CPU was i7-8565U with a reference speed at 1.8 GHz and without Intel Turbo Boost.
The model of GRU used 1846 parameters while the model of GRU + CA used 2102, indicating CA cost 256 parameters. Similarly, the computational complexity of CA can be inferred as 2320 MACs. In our model, we used the soft self-attention as the temporal attention, which means TA costs no parameters for training and only involves multiplication during operation. Thus, the number of parameters and MACs cannot reflect TA’s computational complexity. However, the average running time could tell something. CA cost 15 s and TA 5 s, an extra 15% and 7% running time of the GRUs, respectively. To verify the performance of the model on a wearable device, we applied the proposed model to an Apple Watch with a CPU speed of 700 MHz. The results show that each prediction takes 0.02 s, which is sufficient in practical applications.
3.8. Visualization of TA
To understand how TA achieves the accuracy improvement, we visualized the attention weights through heat maps. A heat map was a 128*128 image. The visualization results are depicted in
Figure 7.
Figure 7 reveals that the three static activities, “stand”, “sleep” and “watch”, exhibit few changes, while the three dynamic activities, “walk”, “run”, and “clean”, are presented with apparently periodic changes, especially “walk” and “run”. Each image contains a blue stripe of low attention on the left side because the weights of the first few sliding windows were all smaller than those of the later ones.
Further, the visualization indicates that TA can improve the model’s interpretability. For example, the periods of walking and running implied that the step frequencies of the two movements were about 75 and 35 frames, respectively; considering the 128 frame/s frequency of the sensor, we could infer that the person walked at a speed of 0.58 s/half step and run at 0.27 s/half step. Plus, the visualization also indicates that the model focused on certain states of a cycle, and TA contributes to its interpretability.
3.9. Impact Analysis of Sensors
We conducted an experiment using the proposed model to deal with the data from different sensors. Usually, different types of sensors could influence the performance of a model. To investigate these influences, we deployed the proposed model (GRU + CA + TA) on the datasets without I.I.D, with the same experimental parameters as
Section 3.2. The results are listed in
Table 7.
Table 7 indicates that the accelerometer was more effective than the gyroscope, with a 17% improvement in recognition accuracy. It is consistent with existing research findings that accelerometers capture more linear changes in human activities, while gyroscopes mainly detect changes in the angular velocity as the object rotates and deflects. It can be seen that the model with the gyroscope performed slightly better than that with the accelerometer at “clean” because “clean” involves a change in the angle of the person’s posture. Plus, the model with the combined sensors had a significant effect on most of the accuracy enhancements. Therefore, combined sensors can better help the model’s performance than a single sensor.
4. Discussion
We investigated the role of two attentional mechanisms in the HAR task and found that they have different focuses and strengths. The performance of the temporal attention is consistent with the performance of the temporal attention in other domains such as NLP, with improved classification accuracy. In the proposed model, the soft self-attention implementation of the temporal attention focuses the weight on the most important part of the temporal data, and the temporal attention mechanism can better connect long-term temporal features compared to the long-range feature extraction of the GRU model.
In our experiments, the temporal attention steadily improved the ability to classify confusable activities on datasets with or without I.I.D. The temporal attention reinforced the difference between “walk” and “clean” by highlighting the most important time series. The visualization of the temporal attention (
Figure 7) displays no special key points in static activities while obvious key points in dynamic activities, indicating that the temporal attention performs better for activities with more movements.
The channel attention had a better performance when dealing with the datasets without I.I.D. In
Table 4, the F1 scores of the model with single CA on static activities achieved the best, even better than the model with dual attentions. This implies that the channel attention performs better on static activities, but this good performance would be crippled when the channel attention works with the temporal attention.
The channel attention, however, had little effect on the datasets with I.I.D. The reason may be that the channel attention assigns very similar weights for all activities, and cannot present effective distinguishing. The approach in [
22] has the same performance as the channel attention SENet used in the earlier layer. The importance of feature channels is likely to be shared by different classes in the early stages. For the same reason, CA used in our model in the early stages has shown little effect on classification. What we expect CA to do is mitigate the effects of biased data from new volunteers. By assigning weights to different channels, bias from different volunteers can be mitigated.
Our study implies that the two attentions have different performances in processing characteristics when they work separately, but we need to further investigate the model’s performance when they work together. The proposed model with dual attentions can deal with most human activities because it can put the attentions on certain features and time points simultaneously. For more complex human activities, however, whether the temporal attention can continue to work well requires further research.


