Article

Modeling and Analysis of Non-Linear Phenomena of Satellite Power System in Space Environment and Hazard-Risk Evaluations

1
College of Mechanical Engineering and Automation, Harbin Institute of Technology, Shenzhen 518055, China
2
Peng Cheng Laboratory, Shenzhen 518000, China
3
Beijing Institute of Spacecraft System Engineering, Beijing 100094, China
*
Author to whom correspondence should be addressed.
Electronics 2022, 11(11), 1756; https://doi.org/10.3390/electronics11111756
Submission received: 15 April 2022 / Revised: 20 May 2022 / Accepted: 25 May 2022 / Published: 31 May 2022

Abstract

:
With the aim to solve the problem of the non-linear phenomenon of the satellite power system under the influence of the space environment factors, which threatens the stability of the power system, in this paper, the abnormal charging and discharging of solar arrays and solar array drive assembly (SADA) induced by the space plasma environment and accidental events, such as debris impact, and the non-linear behaviors of the solar array and load during the Earth eclipse are modeled and analyzed. On this basis, the hazard risk evaluations of the above non-linear phenomena are carried out, and the weak links of the satellite power system in the space environment are identified. The results show that the unexpected energy of the solar array will increase the current stress and power loss of the power device, resulting in S3R over-regulation. An SADA arc fault will reduce the power supply capacity of the solar array, damage the shunt regulator, and affect the quality of the bus. The non-linear behavior of the solar array and load during the Earth eclipse may damage the battery charge and discharge regulator, seriously affecting the stability of the power system.

1. Introduction

The power conditioning unit (PCU) is the control core of the satellite power system, which is the only source of power for the entire satellite, and it is responsible for providing power for the electrical load of the satellite in each flight stage. The satellite operating environment in space is complex and harsh, which may lead to a series of unexpected non-linear changes in the PCU, resulting in a decrease in the stability of the power system and even satellite failure in severe cases.
The sequential switching shunt regulator (S3R) [1] architecture-based PCU is widely used for high-power satellite power systems, as shown in Figure 1, which is based on the fully regulated bus and uses three-domain control, which includes the S3R, battery discharge regulator (BDR) and battery charge regulator (BCR), and it is regulated by the main error amplifier (MEA) to form a unified feedback system to ensure that the bus voltage is always stable, regardless of the sunlight period, eclipse period or other extreme loads of the satellite. The solar array drive assembly (SADA) slip ring is an important link that enables electric power and electric signal transmission between solar arrays and satellite power systems [2]. The solar arrays (SAs) are divided into identical sections, which are then connected to corresponding shunt regulators (SRs) through the SADA slip rings to form a one-to-one solar array of the SADA slip ring to SR correspondences. The output terminals of all shunt regulators are connected in parallel to the bus to convert the current output by the solar array into a constant voltage bus.
The main power sources for satellites are the solar arrays and battery. The battery is designed to have a charge and discharge balance based on one day in order to respond to a load exceeding the power generated during the eclipse duration and mission performance [3]. The solar array is exposed to the space vacuum environment, and its output characteristics could be affected by the incident light intensity, ambient temperature, load power and other space environment factors [4]. Additionally, the SADA is installed at the junction of the satellite with outer space [5], as shown in Figure 2. Like the solar array, they both directly face the space environment, which increases the risk of damage from the charging and discharging effects. For the development of high-voltage bus systems for satellites, the risk of electrical breakdown for solar arrays and for the SADA slip ring is a crucial aspect of the feasibility assessment [6], which seriously threatens the stability of the satellite power system and the satellite’s security.
The space plasma environment and accidents such as debris impact are likely to cause the abnormal discharge of high-voltage solar array. Once the dense plasma covers the charge–discharge sensitive area of solar cells, the ensuing electric fields can form an instantaneous conductive channel to cause arc or electrostatic discharges (ESD) that may disrupt the power generation, transmission, and distribution [7,8]. Additionally, the high-velocity impact of space debris can trigger a plasma discharge effect on solar arrays [9,10]. The high-power density plasma generates the local outgassing of the insulator material in the solar array to induce a plasma breakdown event, which is easily observed as a bright glow due to gas excitation by energetic electrons. The transient electron currents also continuously increase in time [11]. Additionally, the space debris-induced arcing and accompanying flash effect [12] also cause the solar array to output unexpected “excess” energy. Unexpected energy of the solar array leads to non-linear changes in the input energy of an S3R [13]. However, the power supply is mostly designed according to the load demand. The increase in unexpected energy threatens the stability of S3R.
SADA is one of the main higher-risk components of a satellite [14], which has large numbers of exposed conductive slip rings that are closely spaced, and the currents are concentrated. The voltage differences between conducting rings, brushes, and their locations may lead to electrical breakdown and possible failure [6]. Additionally, as the slip ring is in sliding contact between the ring and the brush, it inevitably produces wear debris during the working process. The presence of the wear debris increases the risk of a vacuum arc discharge, which can cause the fatal failure of the slip ring and thus threaten the operating life of the spacecraft in orbit [15]. The SADA arc fault was first reported by NASA [16]. The Seasat satellite suffered an arc short-circuit fault after 105 days of operation in orbit. This fault then spread along the adjacent conductive ring, causing the power supply and distribution subsystem to be unable to output power. Among the electrical faults during the period 1980–2005, SADA suffered a greater number of failures [17]. In recent years, the research on the vacuum charging and discharging of SADA has been gradually emphasized, ground equivalent experiments and modeling analysis have been carried out on its failure mechanism [18,19], and its structure has been optimized to reduce the deep dielectric charging [20]. The non-linear changes in arc faults are highly destructive for power systems, spread rapidly, and occur in an instant, making it very difficult to rescue them.
The power supply system is a prerequisite for the success of any space mission. The design of the battery management system of a satellite depends on multiple parameters, including mission duration, satellite orbit, and eclipse times [21]. The eclipse is a common astronomical phenomenon for most types of satellites, including geostationary Earth orbit (GEO) satellites and Sun-synchronous orbit satellites. During the eclipse period, the sunlight is blocked by the Earth, resulting in the lack of the most important nature energy in space for the satellite power system. For various orbiting satellites, the energy management processes of their power system during the eclipse period have been modeled and analyzed [22,23], and some energy management methods to improve the life of the battery have been proposed. However, the failure rate of the satellite power system is still high [24], and the regulator and discharge regulator are the weak links. With the development of the space industry, the types of loads are becoming increasingly complex, and the demand for high-power low-frequency pulse loads increases. The non-linear behaviors of the solar array and load in the process of entering and exiting the eclipse area threaten the stability of satellite in-orbit energy management.
The above research status of the non-linear phenomenon of the PCU system in the space environment is only for specific components (solar arrays, SADA slip rings and battery). However, the influence of the non-linear phenomenon of a single component on the system is often ignored in the development process of the system design, failing to understand the mechanism and its hazards, and thus, there is no corresponding countermeasures, leaving a serious hidden danger for satellite power reliability. Therefore, this paper models and analyzes the unexpected non-linear phenomena that may occur in the PCU in the space environment, and further evaluates its hazard–risk to the stability of the satellite power system.
The contribution of this paper is summarized as follows:
  • We find the weak links of the satellite power system by modeling and analyzing non-linear phenomena influenced by the space environment factors;
  • Through the hazard risk evaluations of the above non-linear phenomena, we find the law of the negative impact of the space environment on the satellite power system.
This paper is organized as follows: Section 2 introduces the operation principle of the satellite power system. Then, three kinds of non-linear phenomenon influenced by the space environment and their hazard–risk evaluations are modeled and analyzed in Section 3, Section 4 and Section 5. In Section 6, the simulation and experimental results are provided to illustrate the negative effects of the non-linear phenomena. Finally, Section 7 draws a conclusion from the paper.

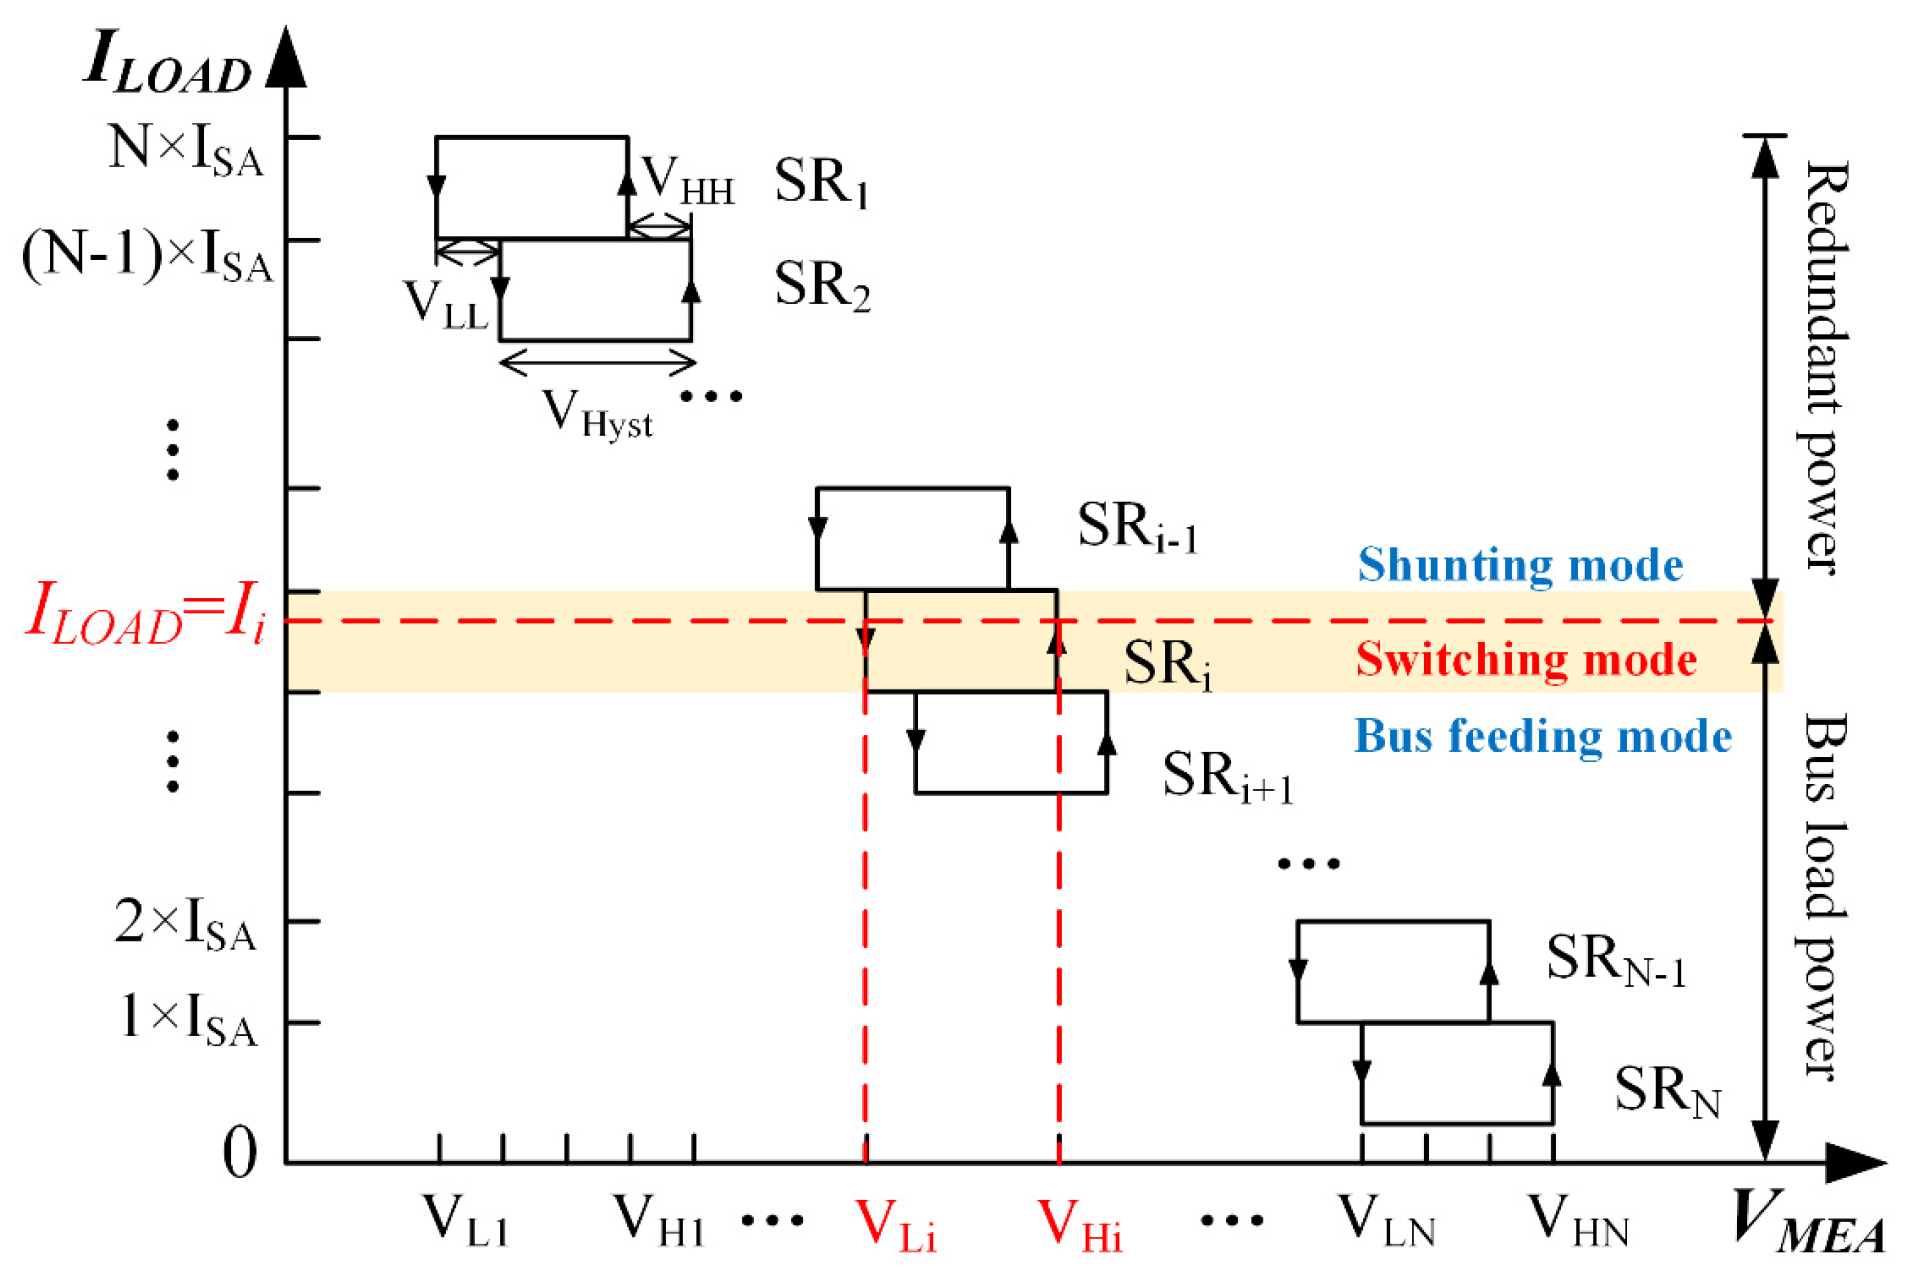
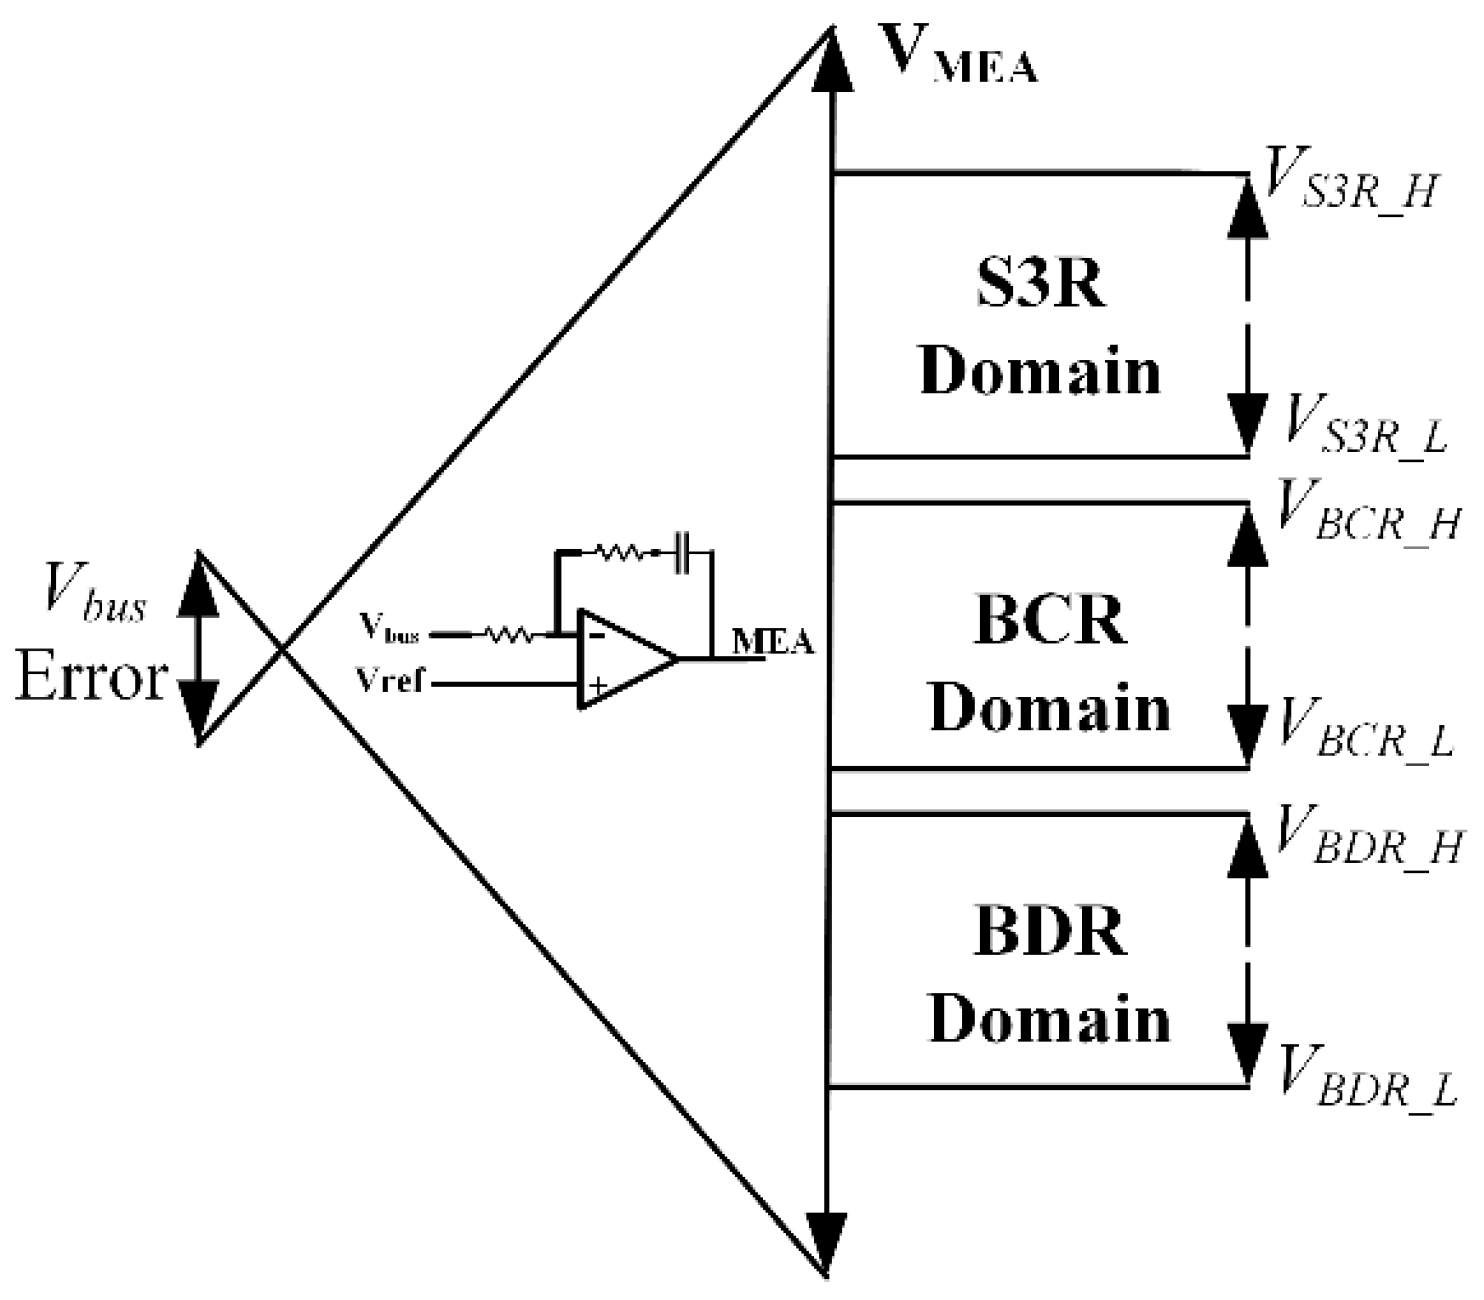
2. Operation Principle of PCU

In the PCU of the S3R architecture shown in Figure 1, the MEA detects the output voltage of Vbus and automatically controls the three domains (S3R, BCR and BDR) to stabilize the bus voltage. During the sunlight period with sufficient energy, the MEA controls the PCU to work in the S3R domain to supply the energy of the solar array to Vbus; during the transition period between the sunlight aera and the eclipse aera, the PCU works in the BCR domain to charge the battery with excess energy from the solar array; when the energy of the solar array is not enough to supply the load or in the eclipse aera, the PCU works in the BDR domain to control the battery to supply energy to Vbus.
In the S3R domain, the operation principle of S3R is the sequential shunt in the relationship between the MEA output voltage (VMEA) and load current, as shown in Figure 3. The S3R is divided into N sections (SR1–SRN), and the corresponding N sections of the solar array sequentially connected to the bus or shunted to the ground are controlled by VMEA. The high-voltage and high-power satellite analyzed in this paper uses the shunt regulator topology proposed in [25], as shown in Figure 4, where RR is the contact resistance of the SADA slip ring. The Imax control driver and L1 limit the maximum current of the shunt Mosfet Q1. Each SR has three operation modes: the bus feeding mode, shunt mode and switching mode. In the bus feeding mode, Q1 is turned OFF to deliver all the power from the solar array to the bus. In shunt mode, Q1 is turned ON to make all the current from the solar array flow to the ground. Additionally, in switching mode, the SR switches between the bus feeding mode and shunt mode to modulate the power delivered to the bus [26]. The operation mode of an SR is determined by the mean value of the payload power demand.
In steady-state conditions, it is generally ensured that only one shunt regulator operates in switching mode, while the others remain in bus feeding mode or shunt mode. As shown in Figure 3, if the load power is Vbus × Ii, the SR form i + 1 to N is in bus feeding mode to satisfy the load demand; the SR from 1 to i − 1 is in shunt mode to shunt the redundant power of the solar array, and the SR i is in switching mode to modulate the Vbus.
The control signal VGn in Figure 1 is generated after hysteresis comparison with the reference voltage signal Vrefn in each section to determine the operation mode of each SR. The hysteresis voltage is
V H y s t = K A Δ V b u s ,
where ΔVbus is the bus voltage ripple, K is the bus voltage sampling divider, and A is the proportional gain of the MEA.
The lower and upper thresholds between adjacent sections are
V L L = V H H = V H N V L 1 V H y s t N 1 .
The frequency is the highest when the load current is half of the solar array section current, as shown by Equation (3).
f m a x = I S A 4 C b u s Δ V b u s ,
where ISA is the current of the single solar array, Cbus is the bus output capacitance, and fmax is the maximum switching frequency of switching mode.

3. Unexpected Energy of Solar Array and Hazard–Risk Evaluations

3.1. Modeling of Non-Linear Phenomena of Solar Array

Figure 5 shows a solar cell equivalent circuit with a single diode [27,28], where IPh is the photogenerated current, and the diode reflects the inherent characteristics of the P-N junction in the cell. Rs and Rsh in the loop are the internal resistance and parallel resistance of the solar cell, respectively. The U-I characteristic of the solar cell can be obtained as follows:
I c e l l = I p h I 0 [ exp ( q ( V c e l l + I c e l l R s ) α k T ) 1 ] V c e l l + R s I c e l l R s h ,
where I0 is the reverse saturation current of the diode, q is the electric charge, k is the Boltzmann constant, T is the temperature, and α is the ideality factor. Iph is directly proportional to the amount of solar incident on the solar cell, as shown in Equation (5).
I p h = [ I S C + K t ( T 298 ) ] G 1000 ,
where G is the light intensity, ISC the short-circuit current of the solar cell, and Kt is the temperature coefficient of the short-circuit current.
Therefore, when the temperature is constant, the U-I characteristic curve of a solar cell varies with the light intensity, as shown in Figure 6. The short-circuit current increases with the light intensity, and there is a good linear relationship under strong light.
The abnormal discharge of the solar array can be caused by the space plasma environment and high-speed impact. The flash effect usually occurs simultaneously with the plasma effect, which is the generation of energy radiation by material in a high-speed impact. This process affects the incident light intensity [29], causing non-linear changes in the output of the solar array. As shown in Figure 7, the operating point of the solar array migrates when the light intensity increases, which is caused by the arc discharge and accompanying flash effect. In steady-state conditions (t0t1), the output of the solar array is equivalent to a constant current, Io. When the light intensity increases from 1000 to 2000 W/m3 at t1, the current operating point increases from Io to I1 in the U-I curve. Therefore, the output current ISA of the solar array varies non-linearly, which is an unexpected large current spike generated during the discharge process.

3.2. Hazard–Risk Evaluations

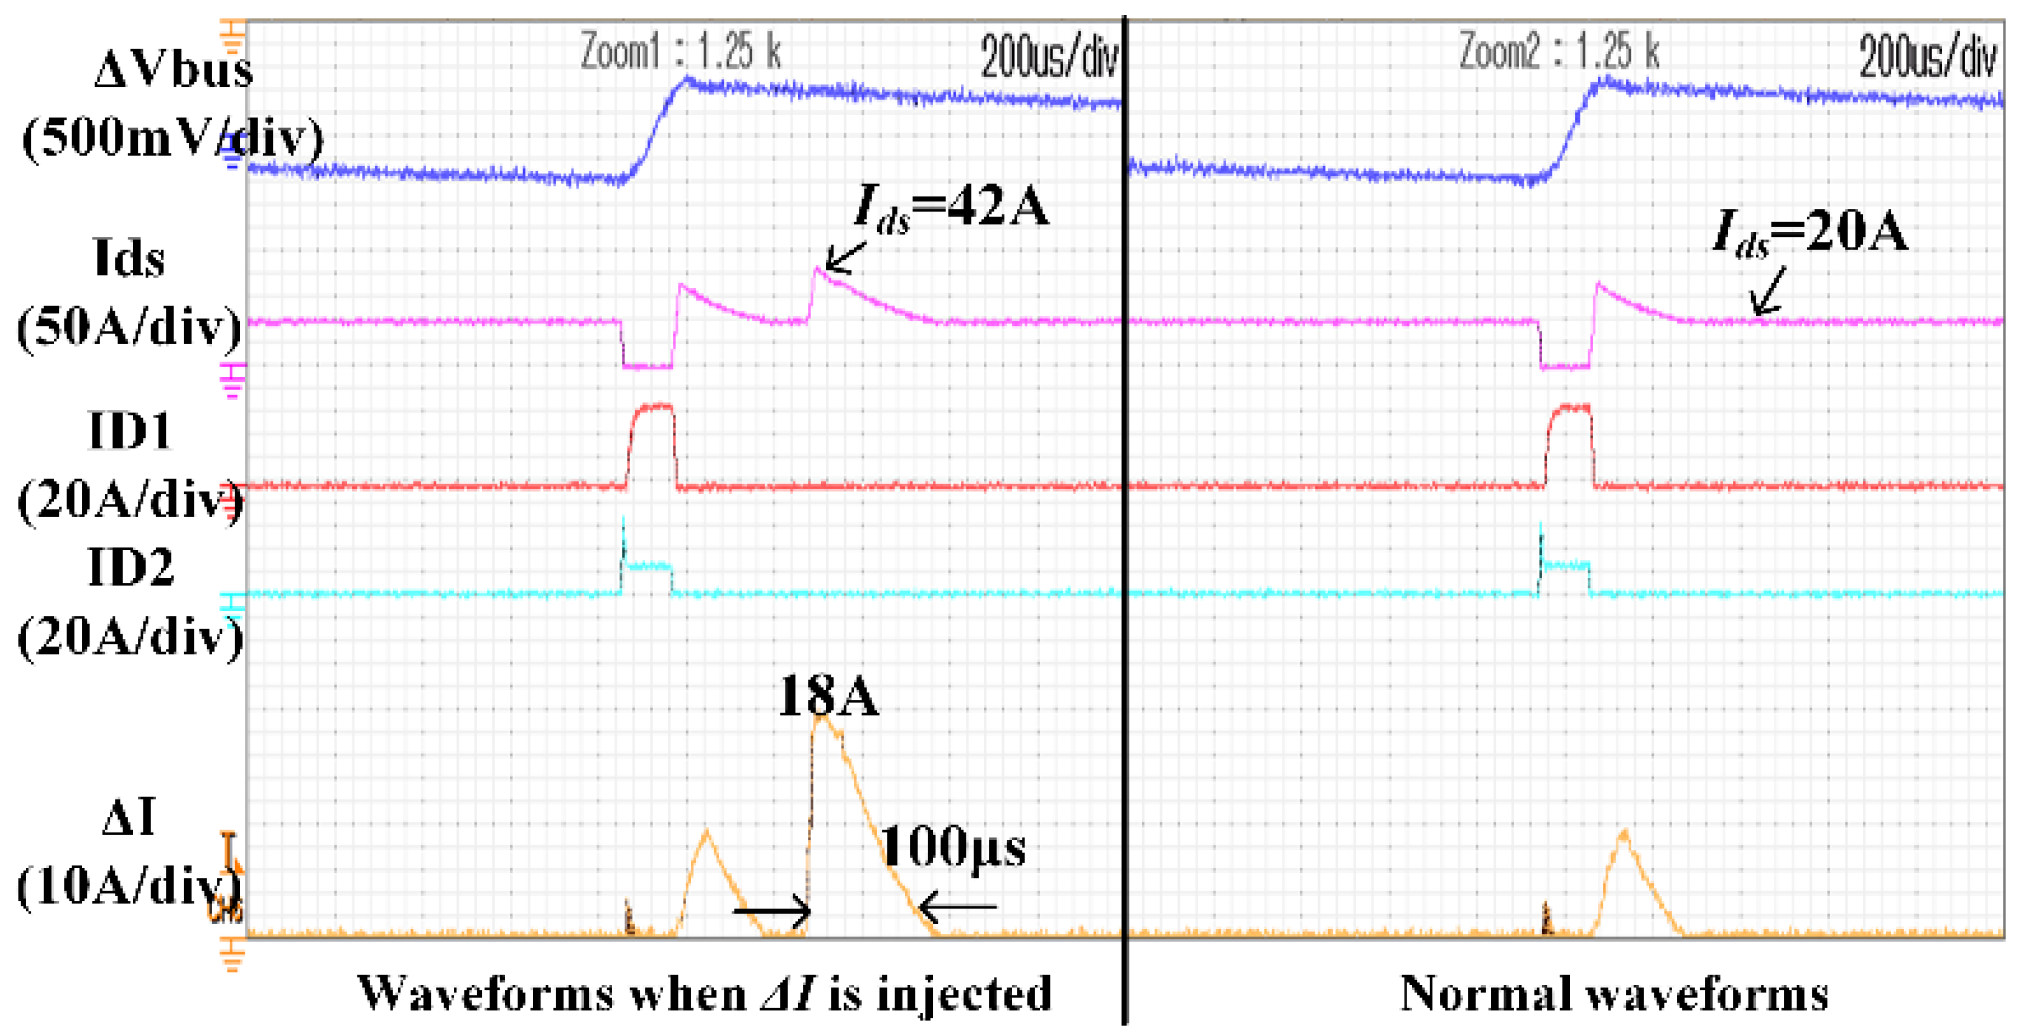
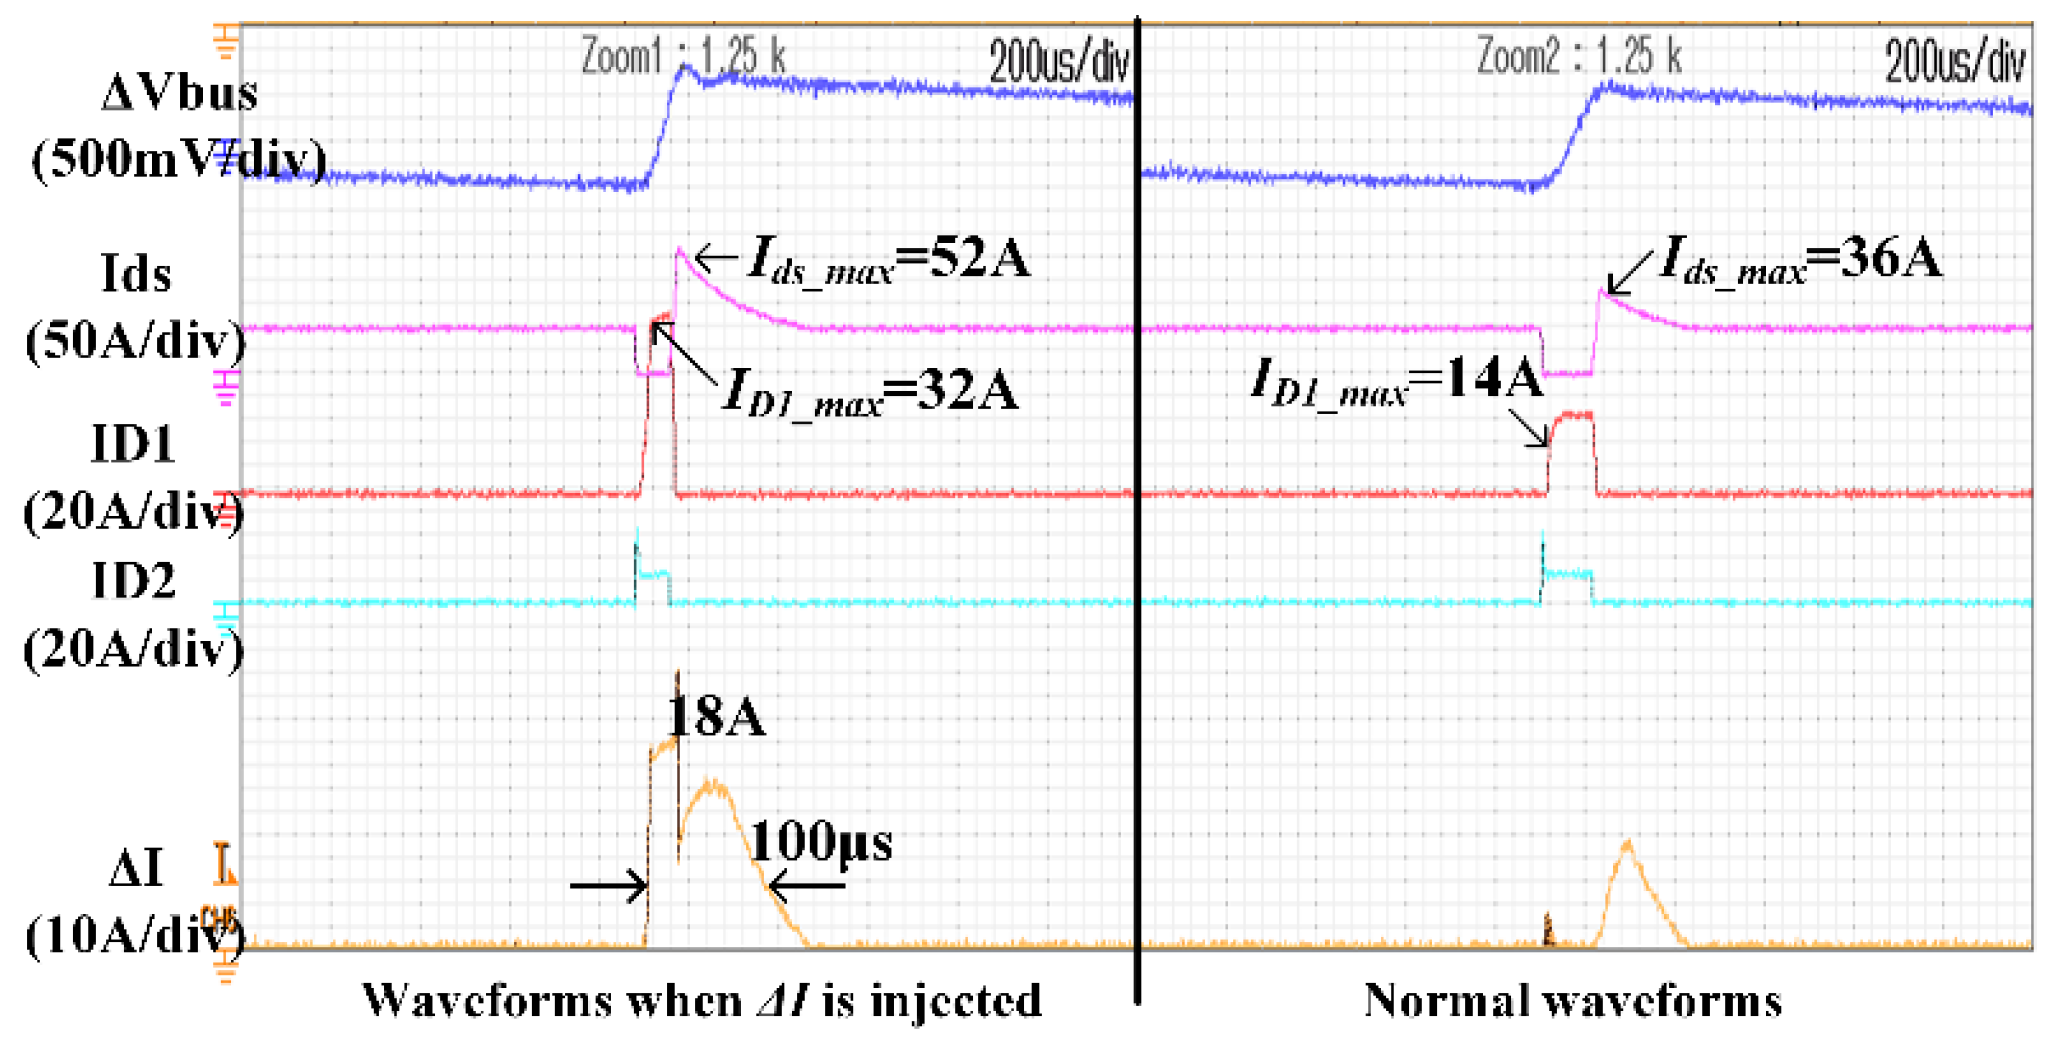
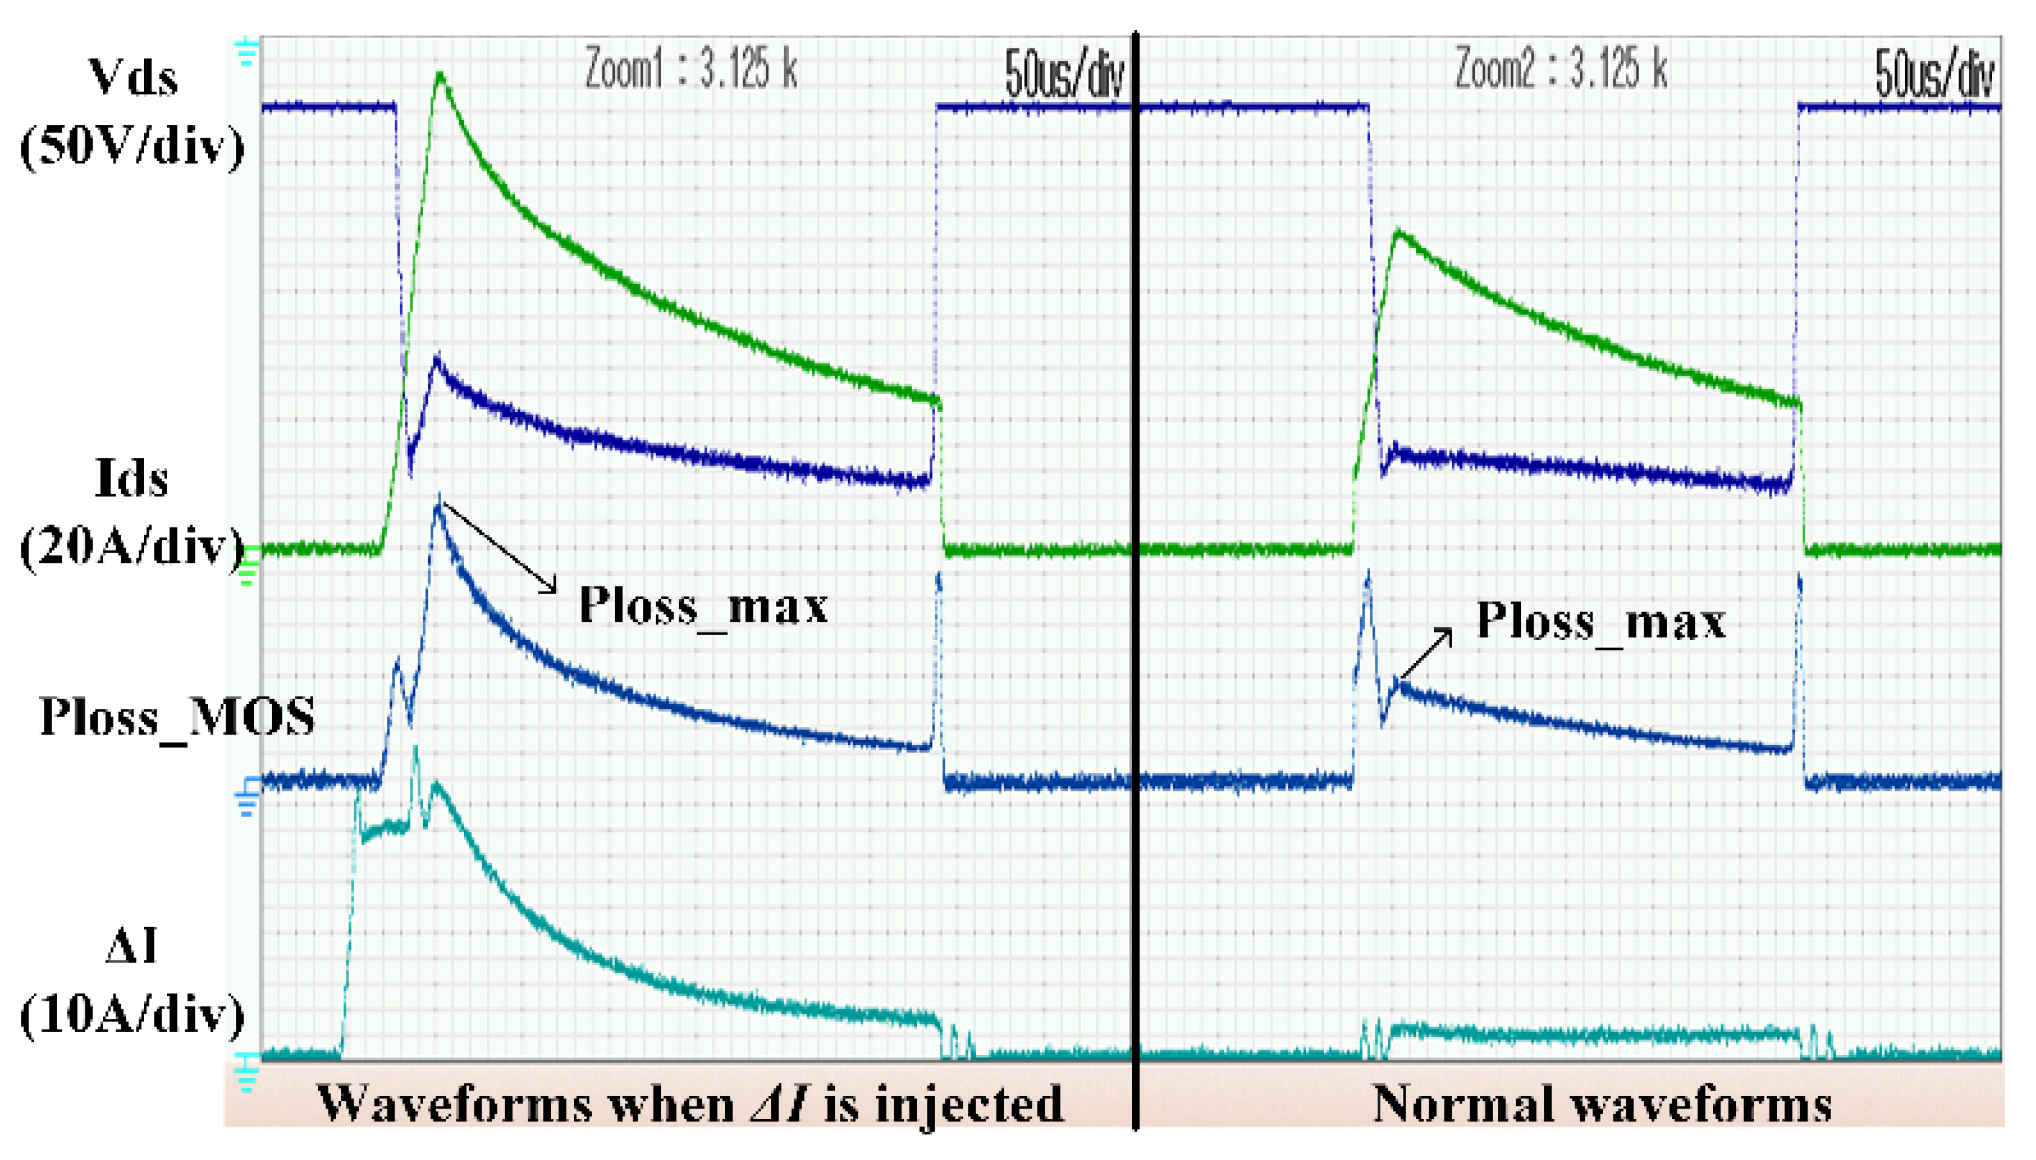
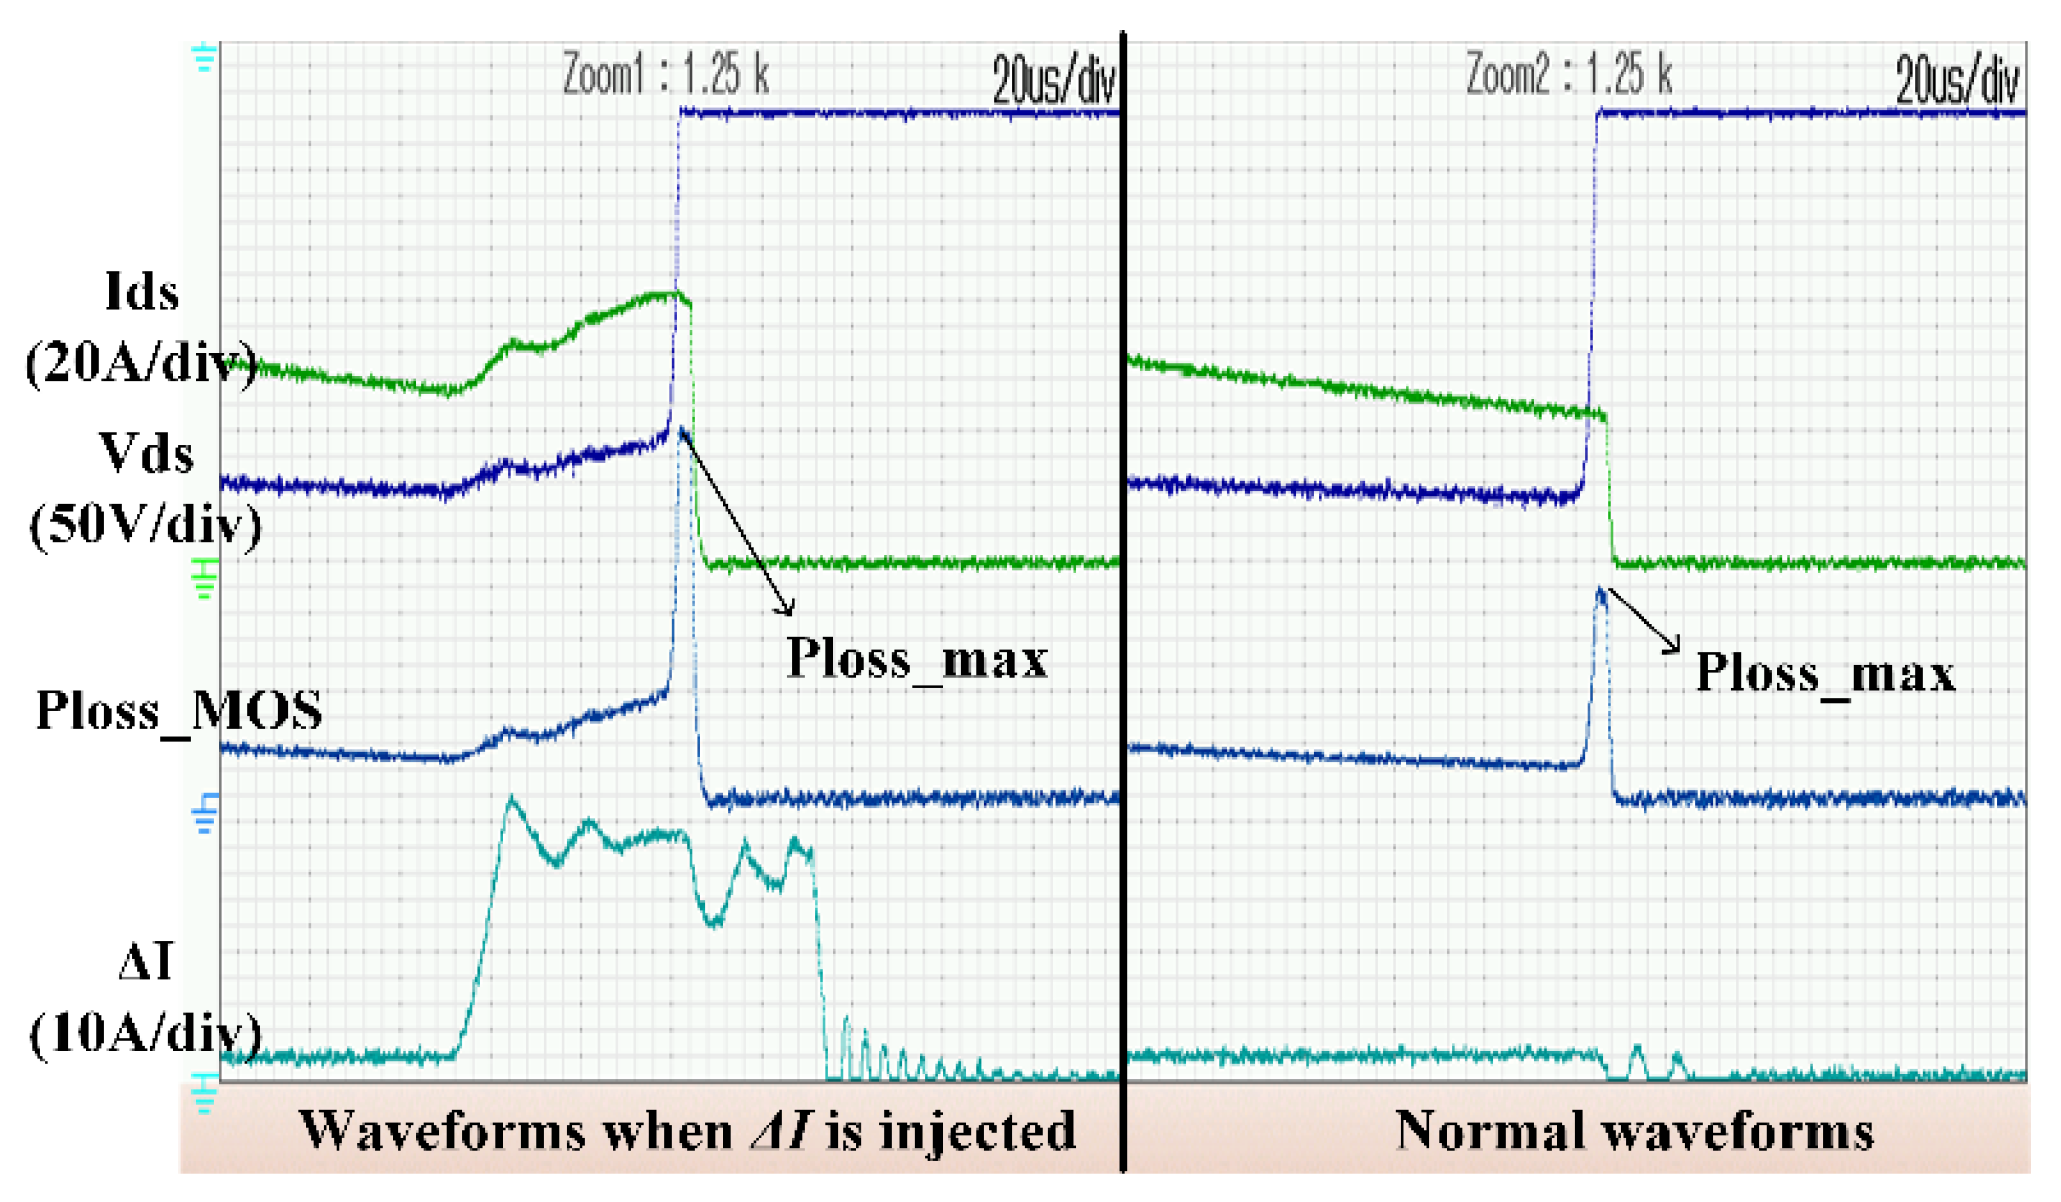
3.2.1. Current Stress and Power Loss of Power Devices

The S3R is the direct-energy-transfer (DET) architecture. In shunt mode, the solar array is connected to the ground through the MOSFET, while in bus feeding mode, there are only two diodes between the solar array and the bus. Therefore, the reliability of the MOSFET and power diode is particularly important, and any device failure causes the failure of the shunt regulator.
The loss of the MOSFET is proportional to the shunt branch current and the switching frequency. The switching process of the MOSFET of the SR without considering the wire inductance is shown in Figure 8. The power loss mainly comprises the switching loss and conduction loss.
The conduction loss is
E o n = I S A 2 R D S O N 2
where RDSON is the on-resistance.
The switching loss is determined by the discharge energy of the parasitic capacitance (CSA) to the MOSFET, which can be estimated as follows:
E t u r n _ o n = C S A V b u s 2 2 I M A X I M A X I S A ,
where IMAX is the maximum current limit of the shunt branch, ISA is the output current of the solar array, and Vbus is the bus voltage.
The total switch loss is
E t o t a l = E t u r n _ o n f m a x + E o n .
The switching frequency fmax is shown in Equation (3).
When the solar array outputs a pulse current, as shown in Figure 7, the shunt regulators need to withstand unexpected “excess” energy. In the shunt mode, the energy exceeds the adjustment range of the maximum current limit, resulting in excessive current applied to the MOSFET (Q1 in Figure 4). In the bus feeding mode, the current pulse of the SA is directly applied to the diode (D1 or D2 in Figure 4). In the switching mode, the switching frequency of Q1 increases and the shunt time extends to divert the “excess” energy. Additionally, the power loss of the Q1 increases appreciably. When MOSFETs and diodes are subjected to excessive current stress or excessive losses, they are prone to failure, which accelerates the failure process and leads to damage to the SR.

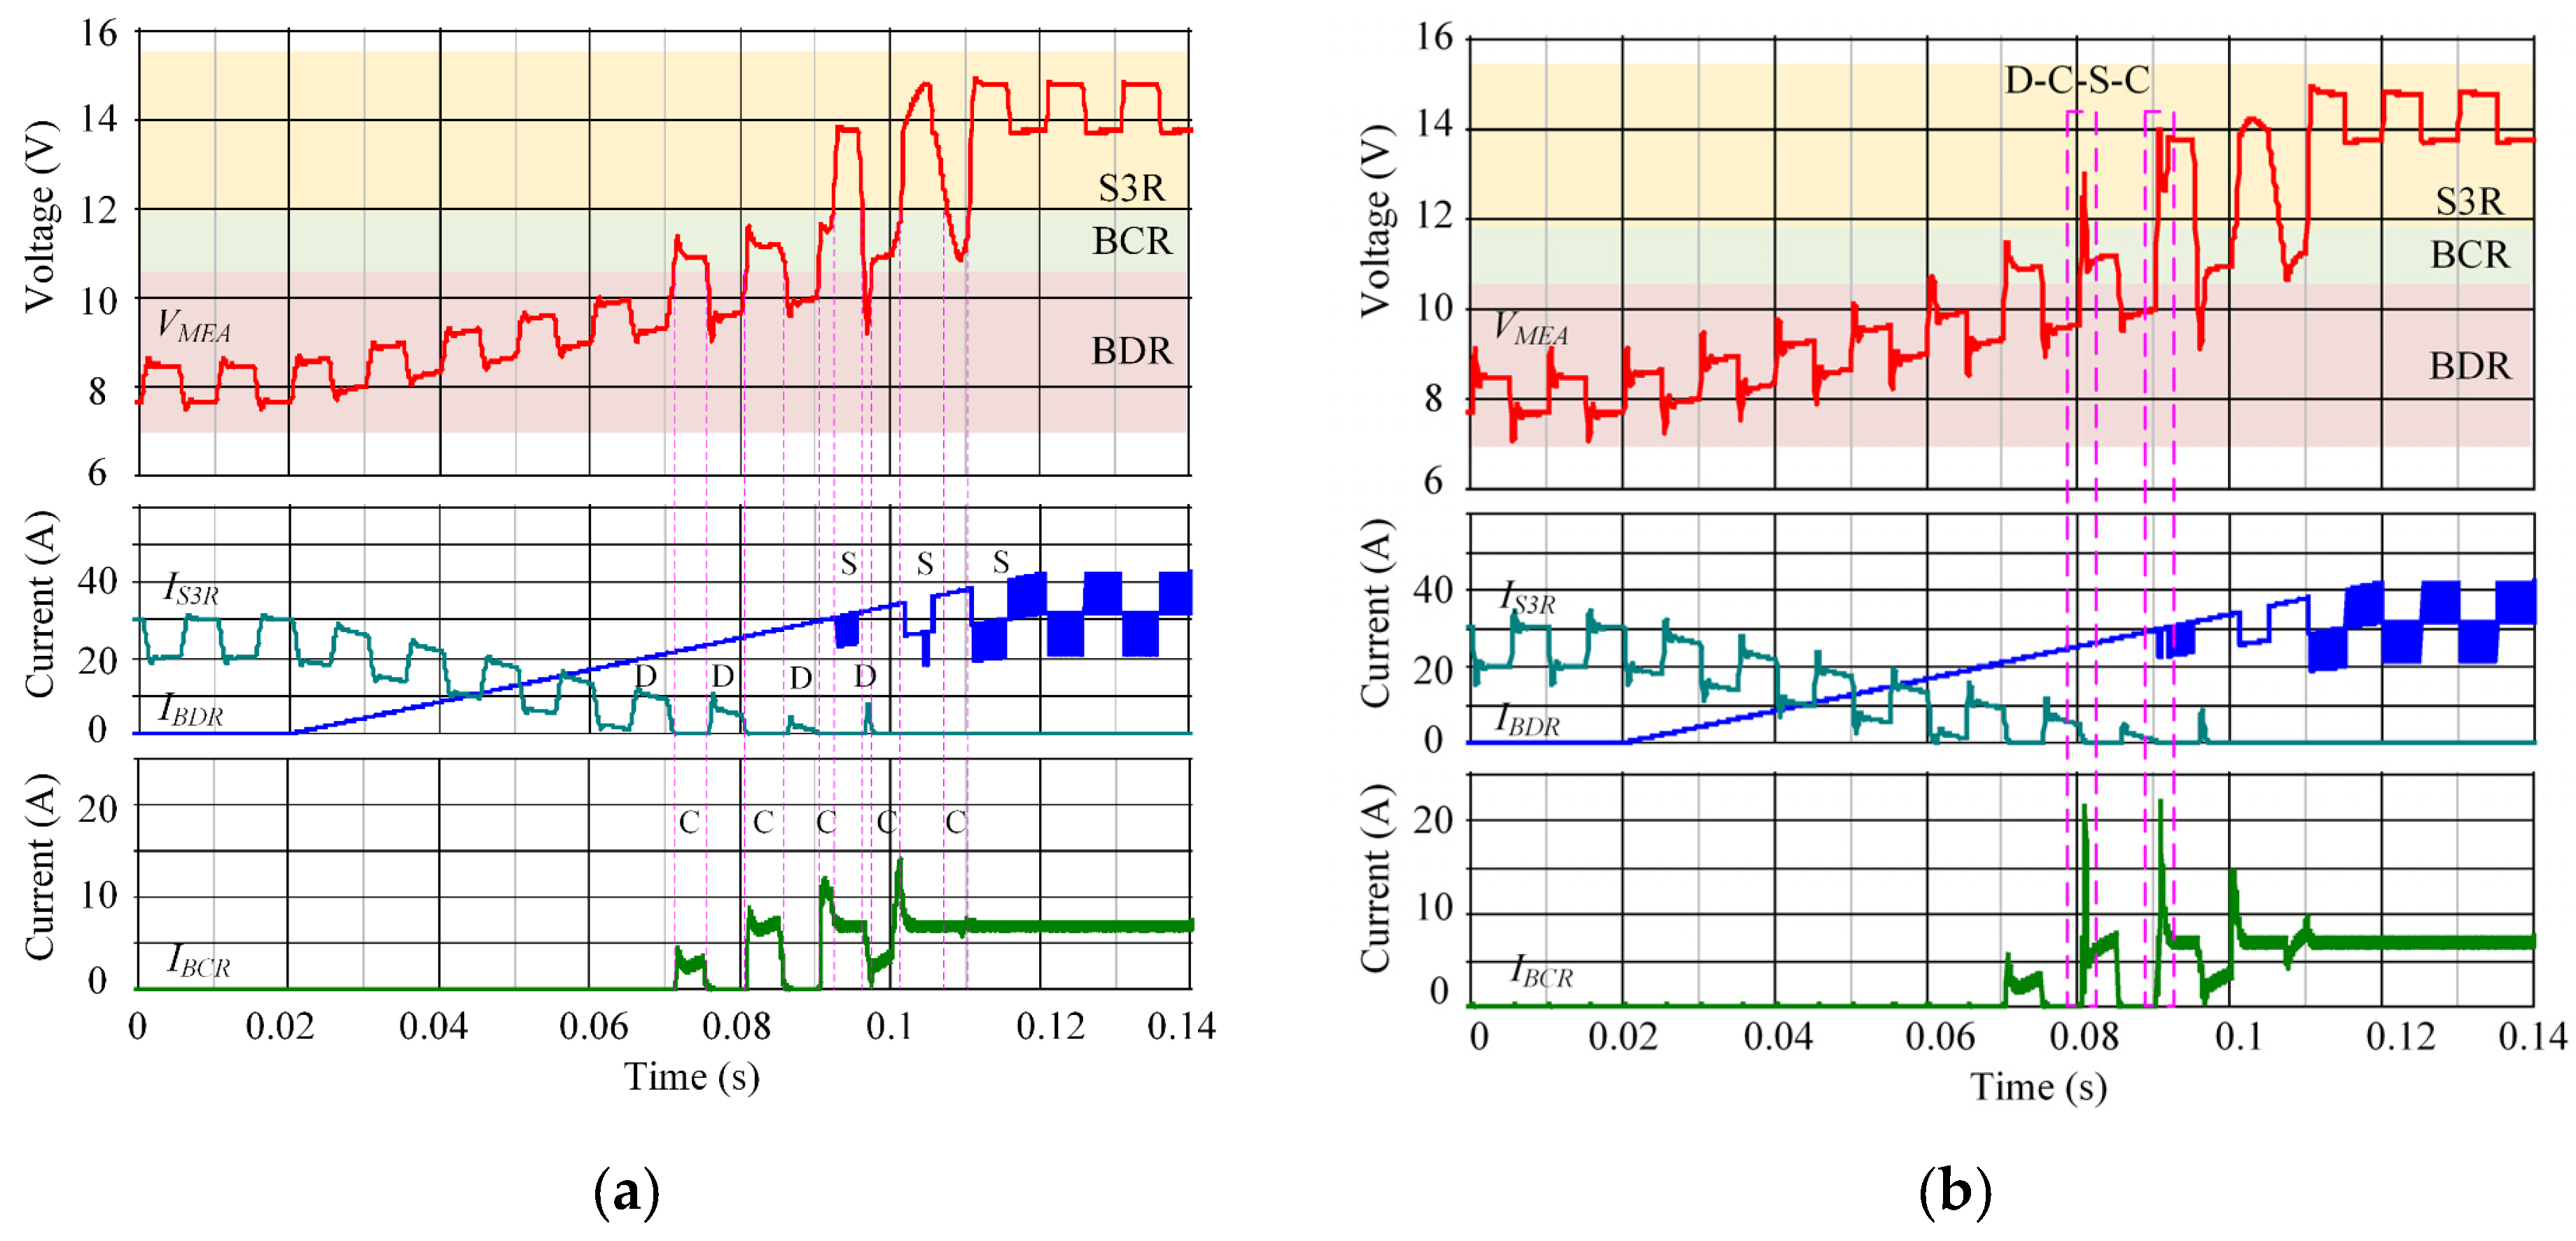
3.2.2. Over-Regulation of the S3R and Quality of the Bus Voltage

When the load current is close to an integer multiple of the current of one section of the solar array, VMEA triggers two adjacent sections of SR to work in switching mode at the same time. The over-regulation phenomenon is also called “double sectioning”. The boundary current, Ib, for triggering the “double sectioning” is derived from [30].
I b = b b 2 4 a c 2 a ,
where
{ a = ( K ( ( A P + 1 ) ) C b u s ) 2 b = 2 V L L K A P A I C b u s Δ V b u s K 2 ( A P + 1 ) A P A I C b u s c = ( Δ V b u s K A P A I 2 ) 2
The S3R operates in double-section functioning mode when
I S A i b i l o a d I S A + i b .
The minimum switching frequency in switching mode is
f m i n = I b ( I S A i b ) Δ V b u s C b u s I S A .
The very fast or very slow swing rates of the input signal of hysteresis loops are important factors for the over-regulation of the S3R [31]. The principle of “double sectioning” induced by current pulses ΔI of the solar array is analyzed in [13]. The non-linear changes in the output of the solar array disrupt the steady-state balance of S3R; if (11) is satisfied, the S3R works in “double sectioning” mode. Additionally, as the input current increases further, it may even trigger multiple sections into switching mode at the same time.
The bus voltage ripple is determined by the hysteresis voltage comparator, bus voltage sampling divider, and MEA proportional gain, as shown by (1). Additionally, the relationship between the maximum bus voltage ripple ΔVbus_DSF and load current iload during over-regulation is derived from [30], as shown in (13).
Δ V b u s _ D S F ( i l o a d ) = 2 Δ V b u s 2 ( V L L + V L L + V h y s t ) K A P A I C b u s I S A i l o a d .  
A smaller value of I S A i l o a d results in a larger value of ΔVbus_DSF. Therefore, the bus voltage ripple of the “double-sectioning” is higher than that of single-SR regulation but twice as low as the single-SR ripple. “Double sectioning” is an over-regulation phenomenon, which leads to an increase in the switching frequency, the power loss and the bus voltage ripple [25]. It may also damage the system due to local overheating. When the peak value of the pulse current is larger and the discharge time is longer, in extreme cases, if the adjustment range of the MEA is exceeded, there is an overvoltage protection of the bus voltage and a reduction in the output quality of the bus.

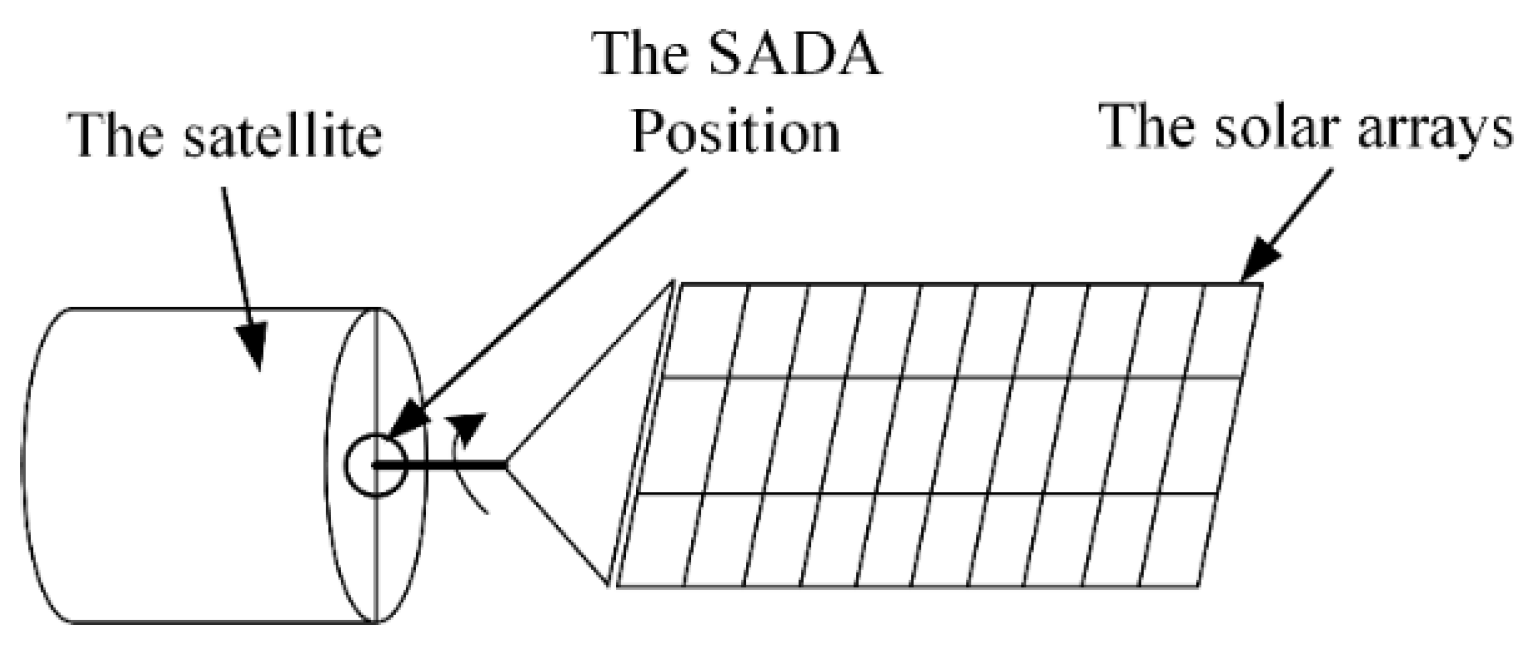
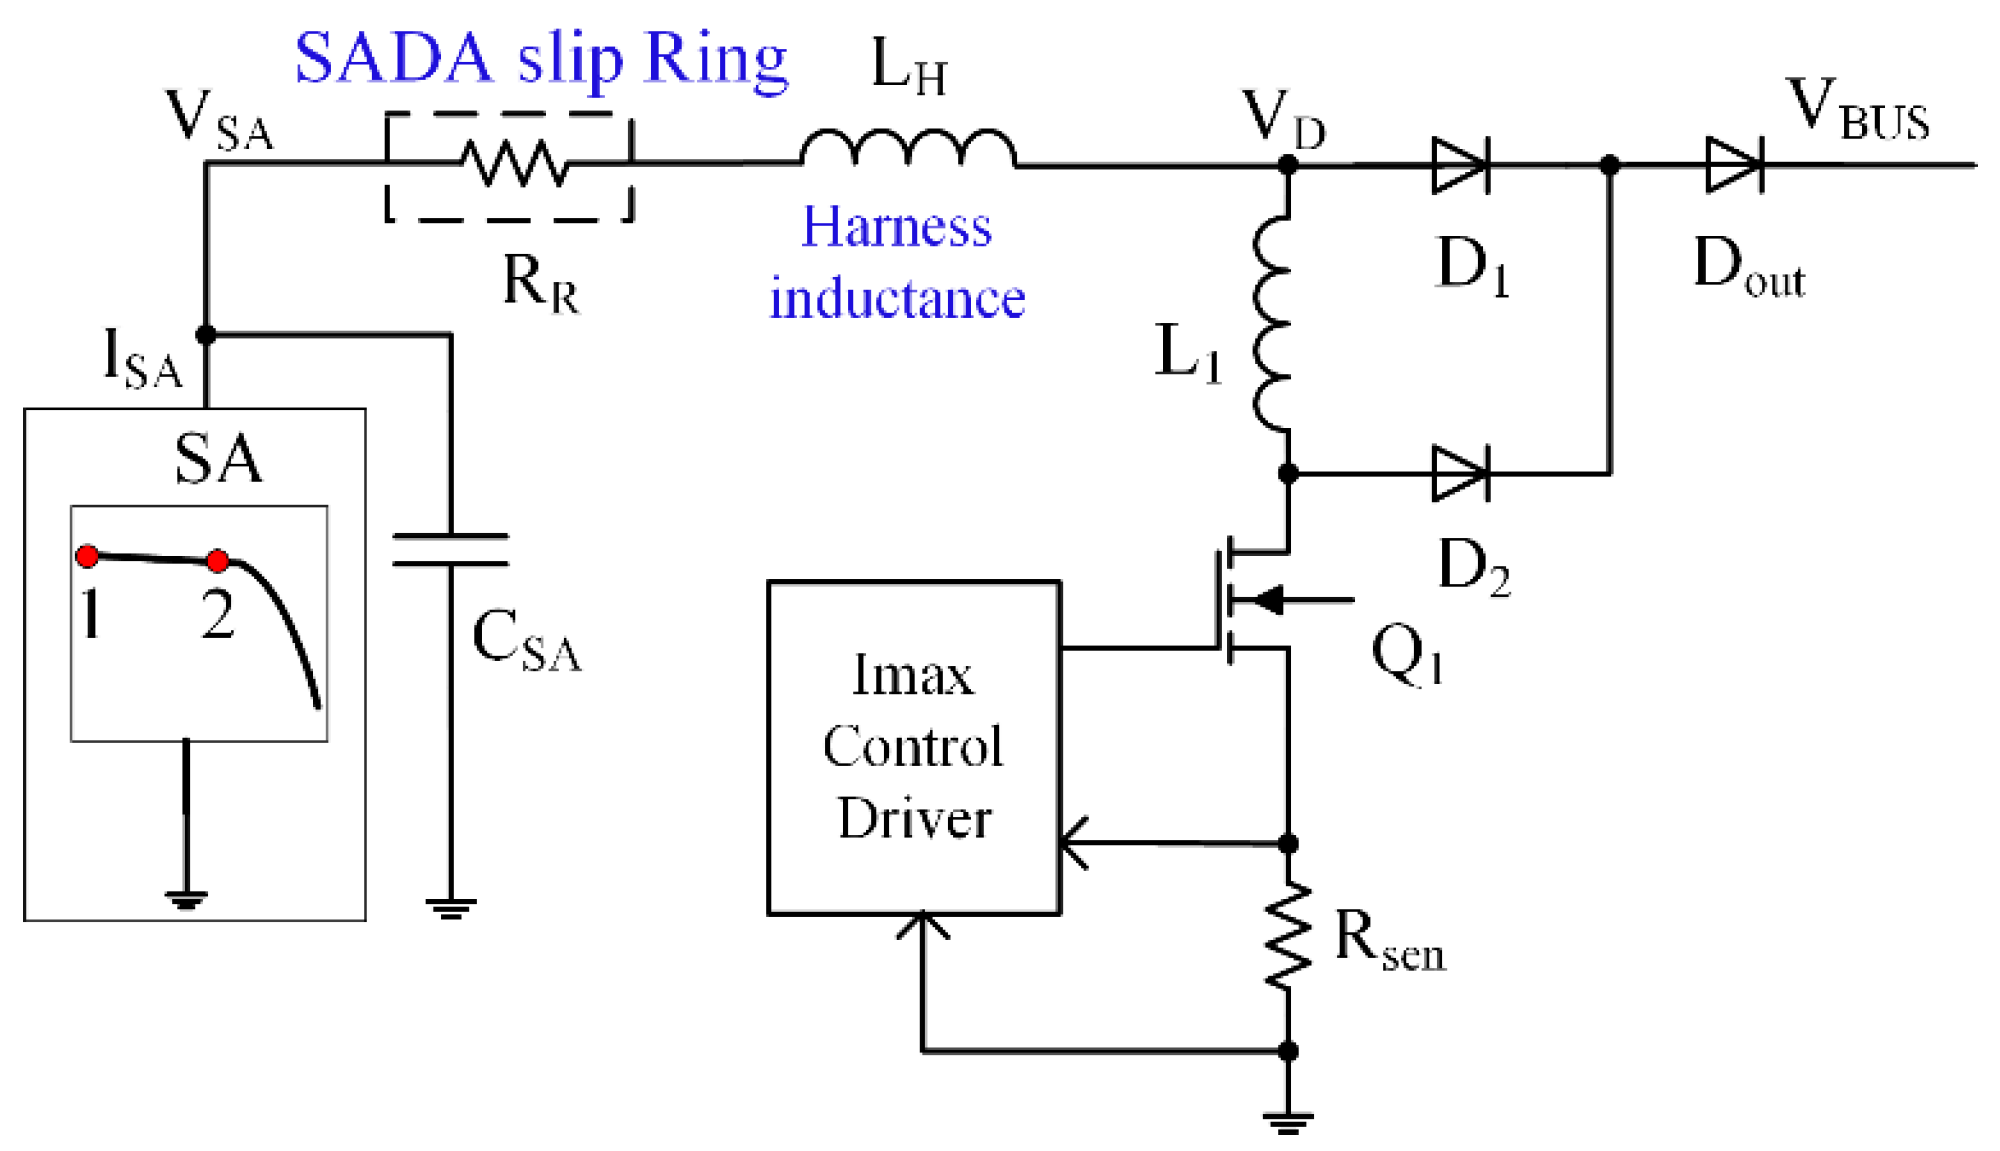
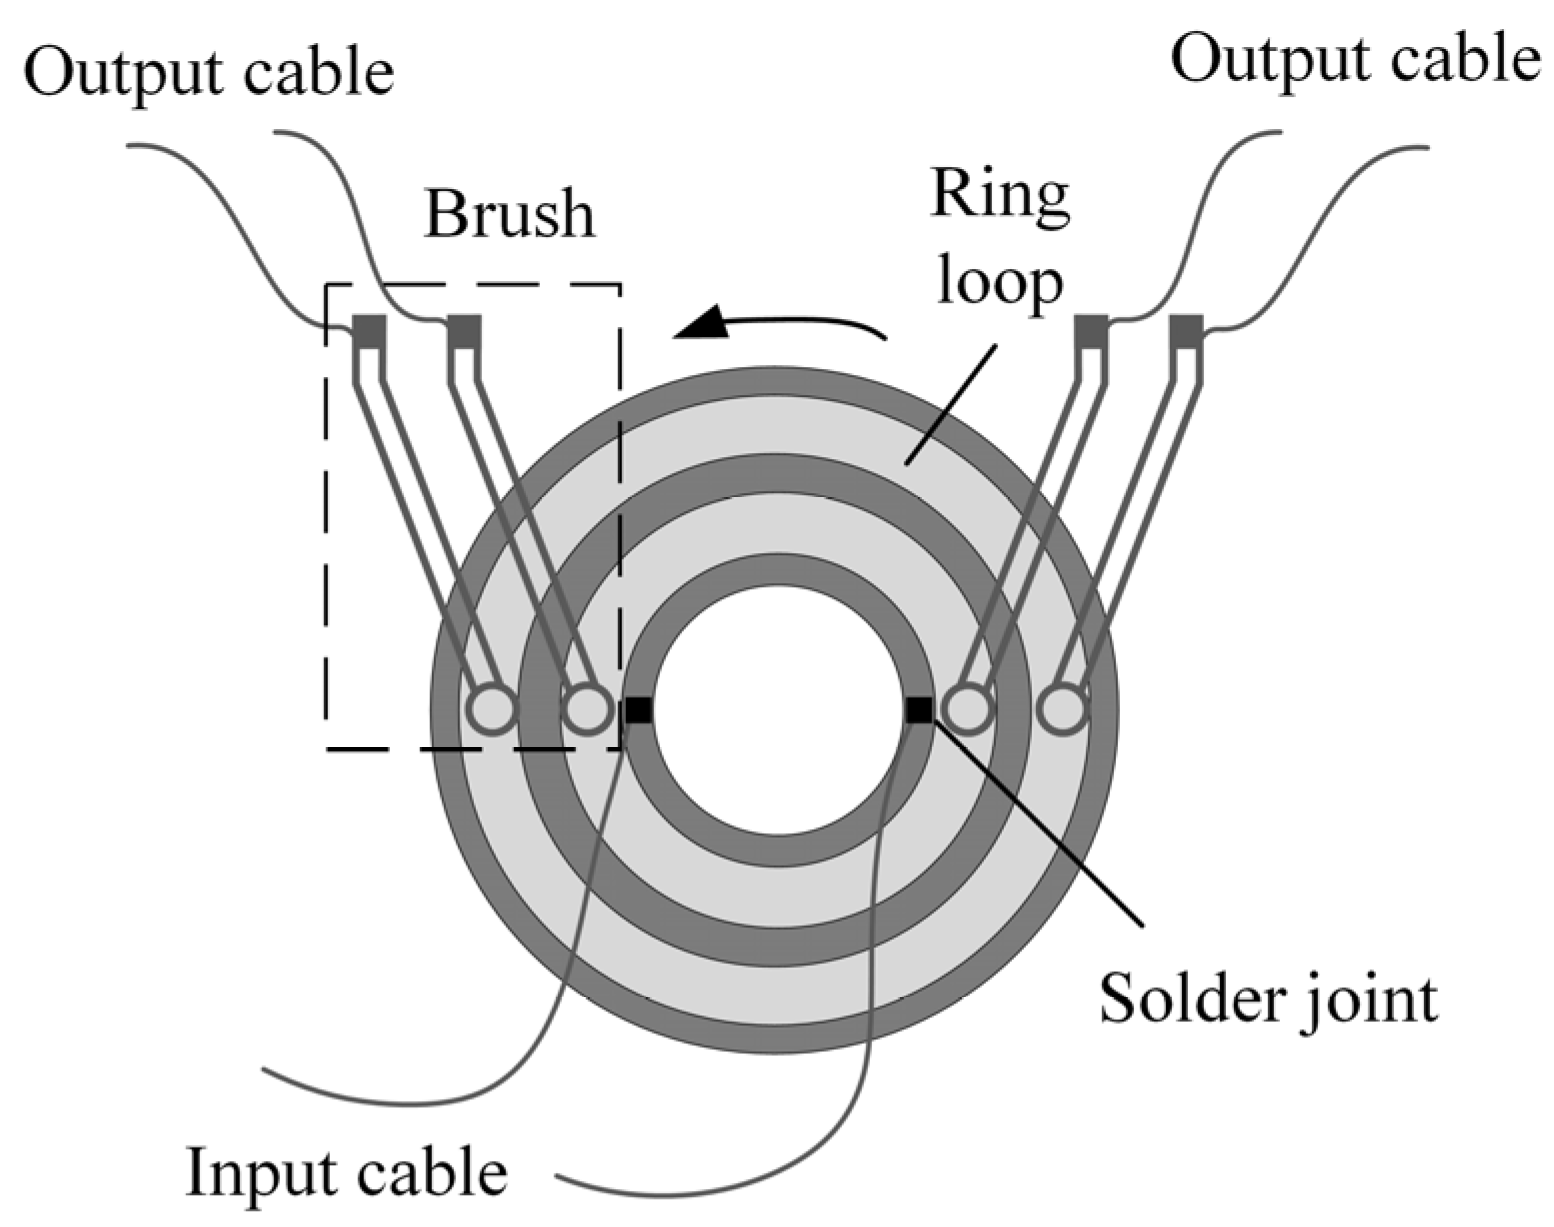
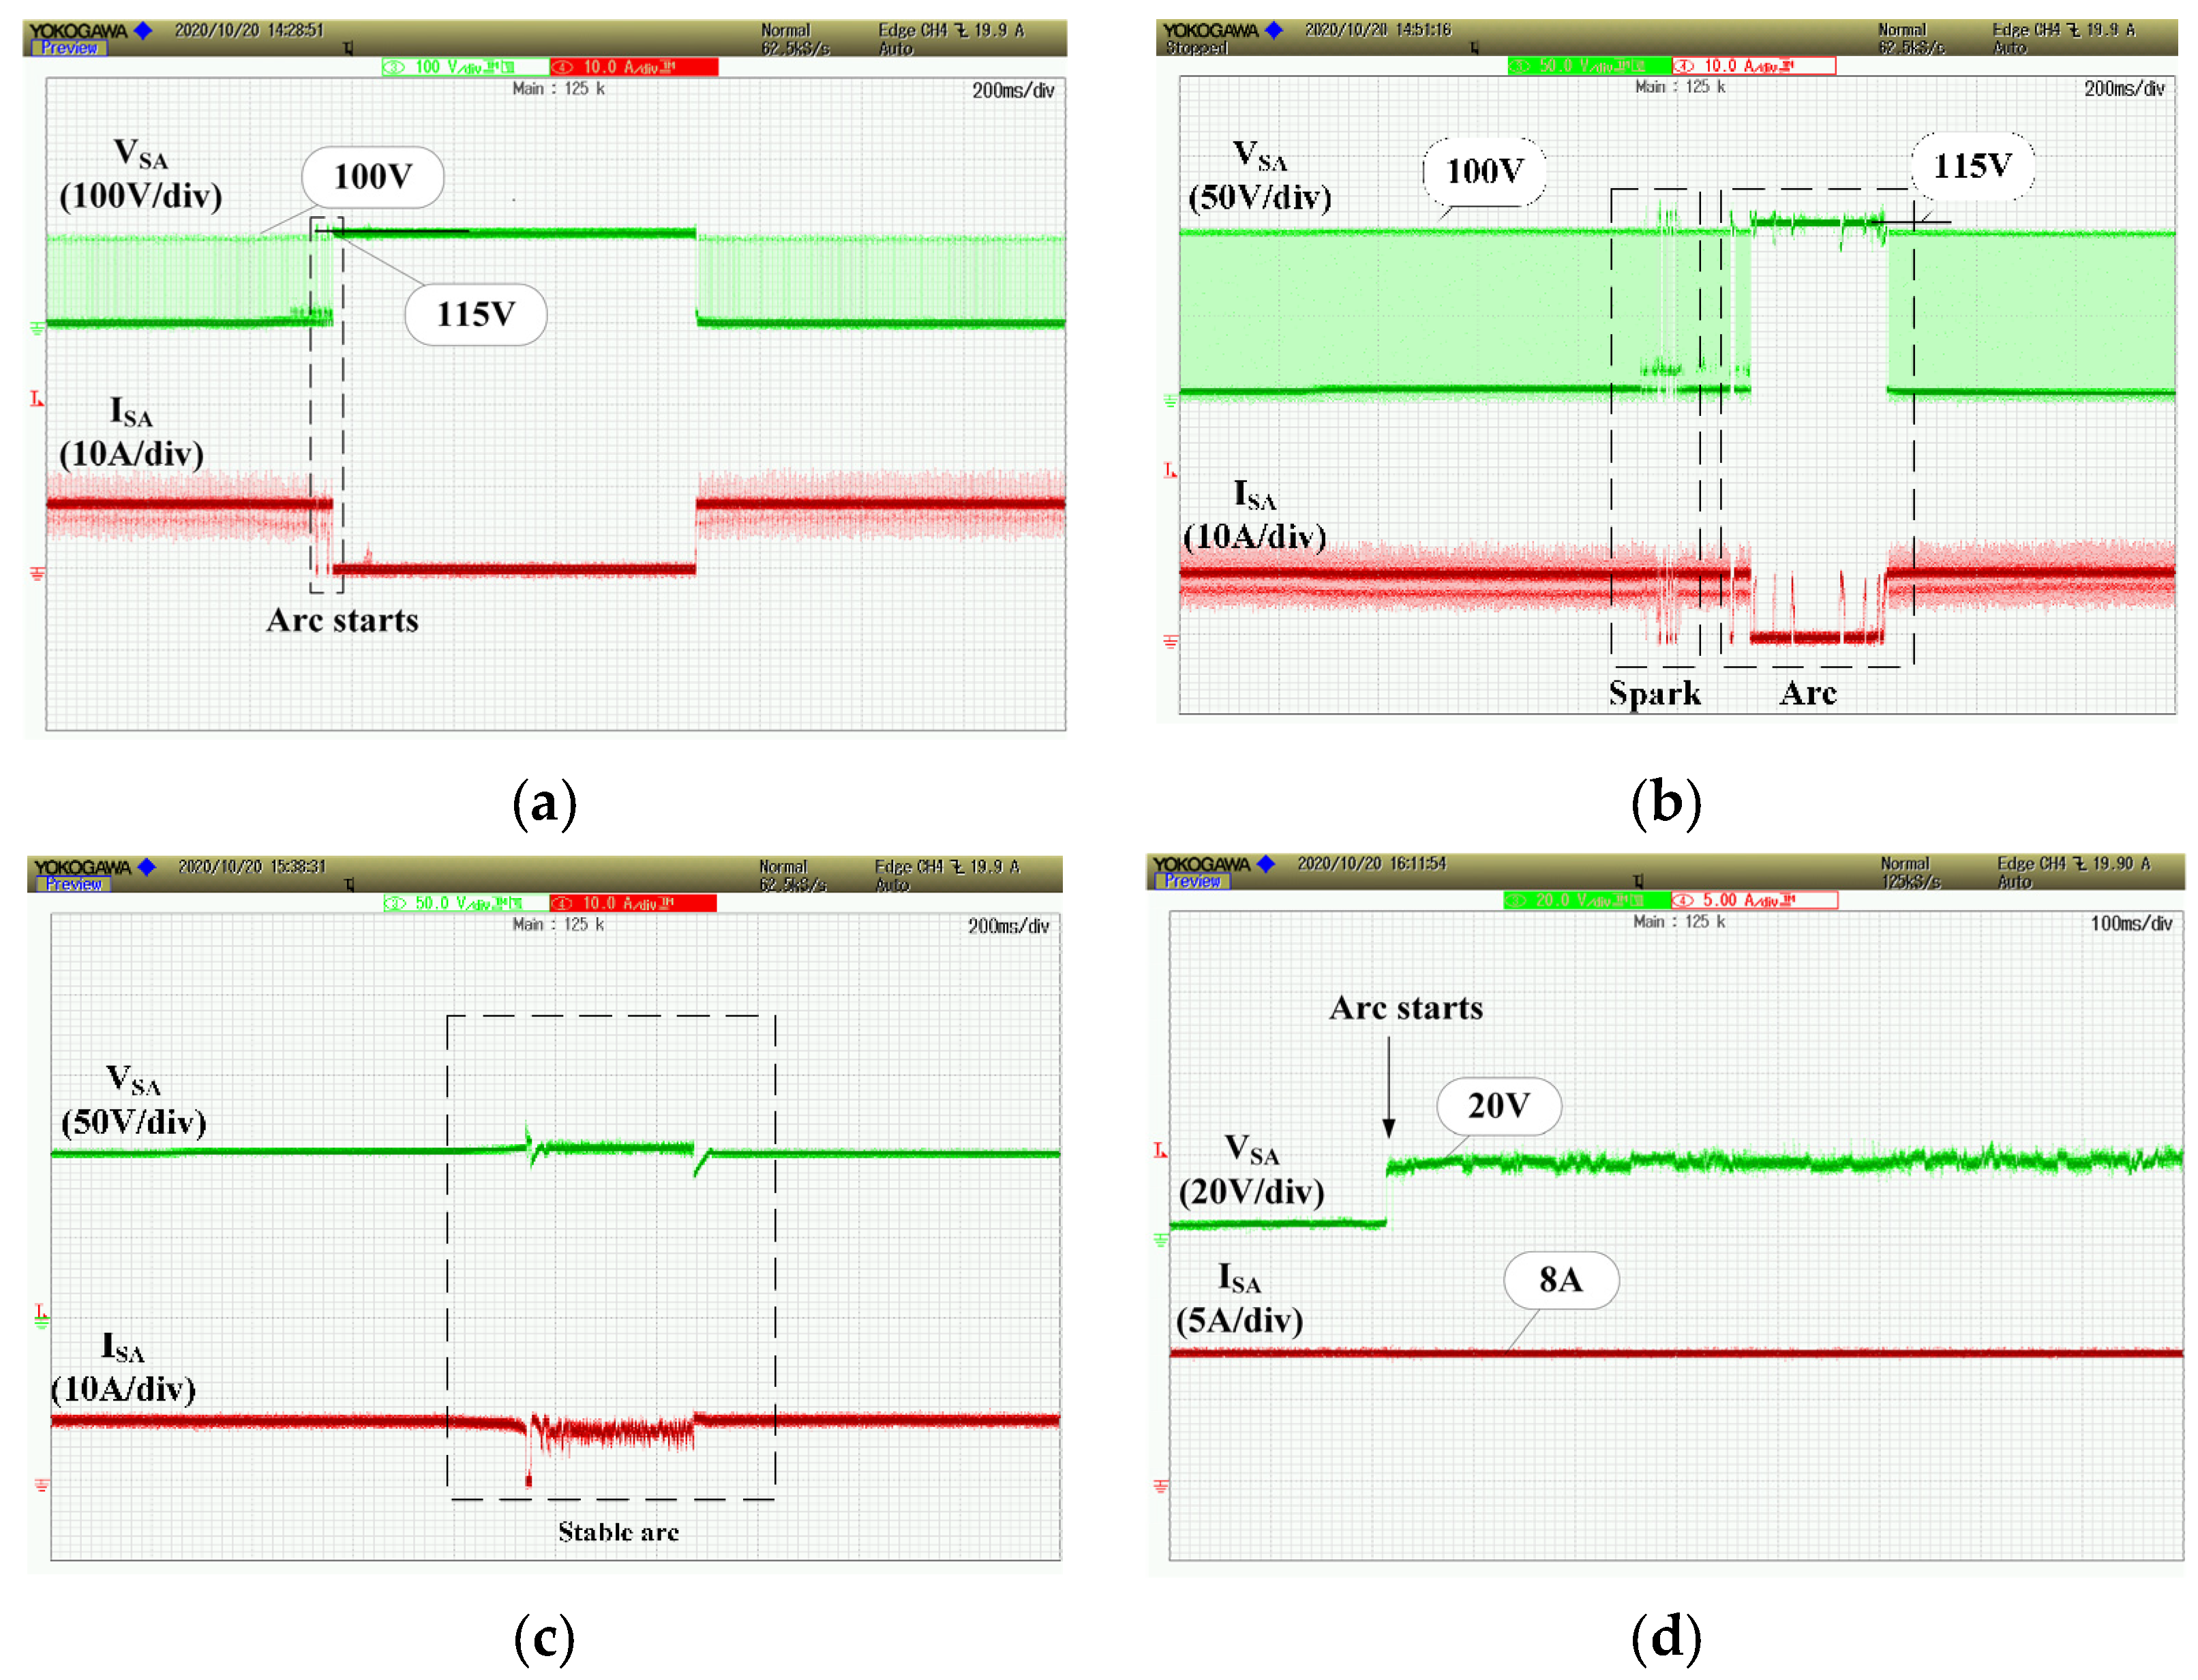
4. Arc Fault of SADA Slip Ring and Hazard–Risk Evaluations

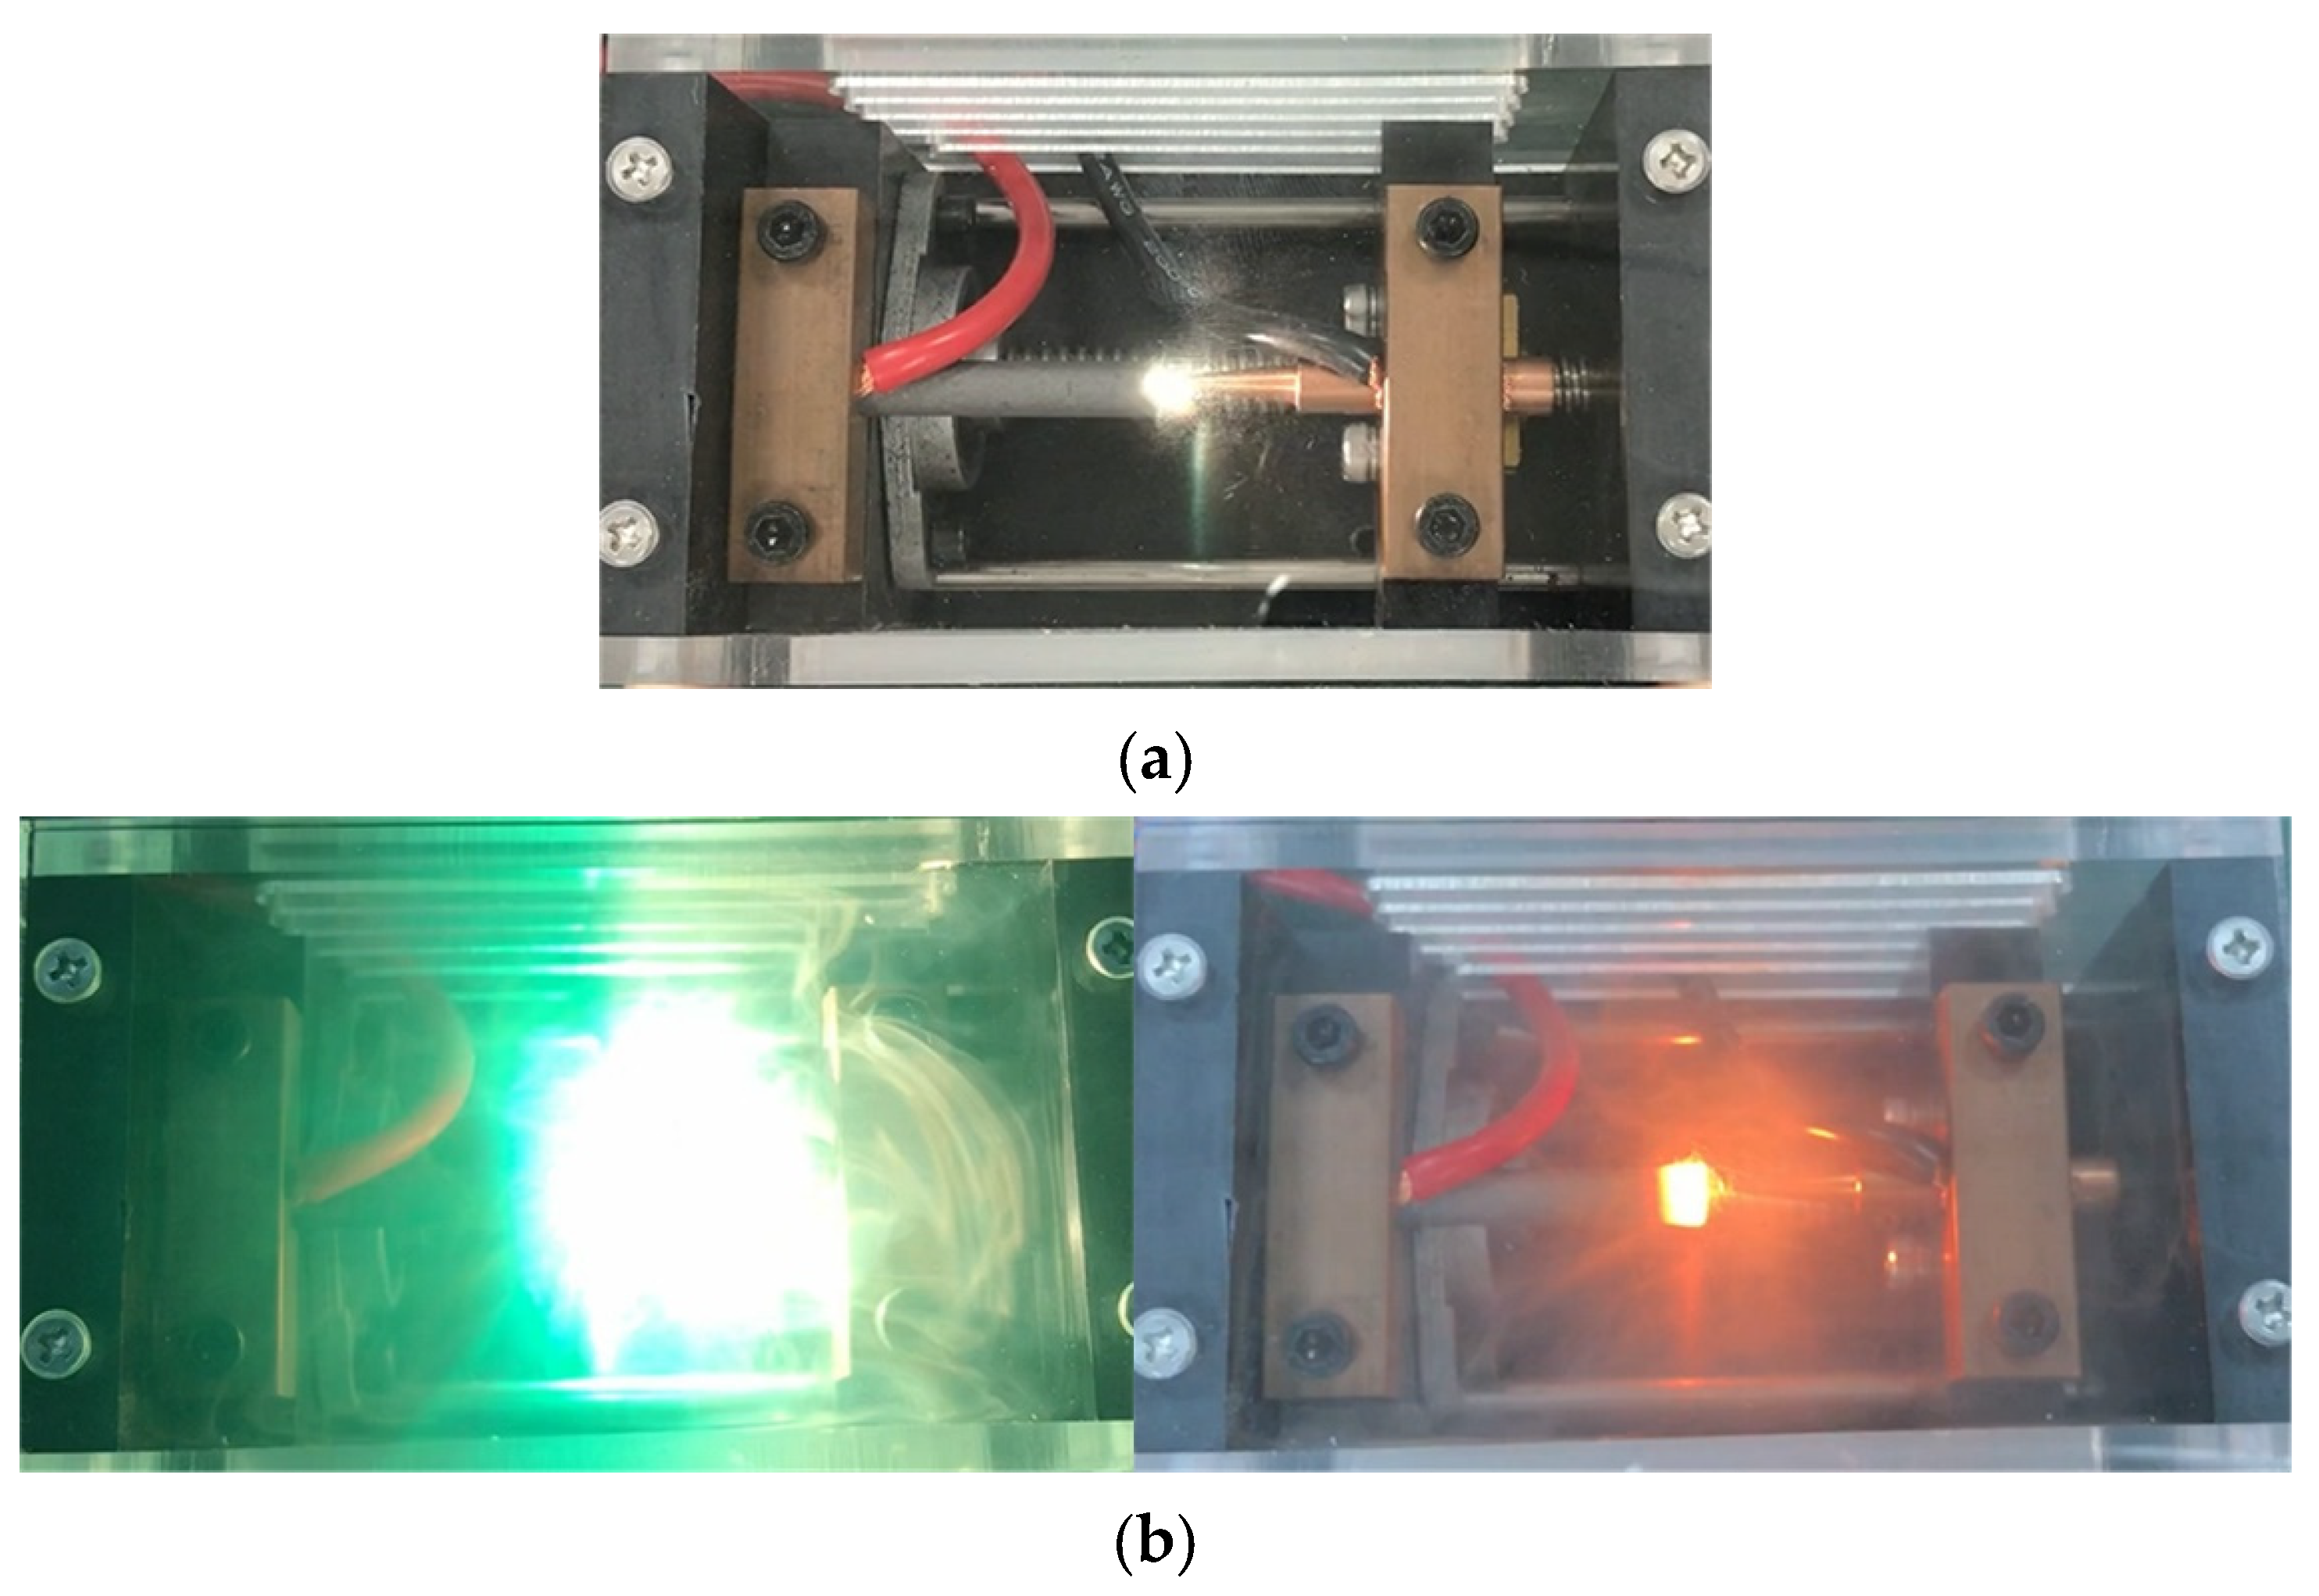
4.1. Modeling of Arc Fault of SADA Slip Ring

The SADA disc slip ring structure is shown in Figure 9. During operation, the brush contacts maintain sliding contact with the conductive ring on the busbar, which inevitably produces metal wear debris (mainly composed of gold and copper), and this debris may then accumulate between adjacent solder joints or between the solder joint and the ring. If this metal wear debris subsequently overlaps with the internal welding points of the slip ring and/or with the ring and the welding point, it then forms a short-circuit channel. The large quantity of energy that is released when the current passes through the wear debris causes the metal wear debris to vaporize, forming a metal vapor that is then ionized into plasma under application of an electric field. The resulting plasma distortion electric field eventually causes the cathode to produce field emission, which then develops into a self-sustained vacuum arc. In the weightless space environment, the wear debris between the electrodes is in a weightless suspension state and is more likely to form an arc as a result [15].
Typical arc time-domain characteristics are shown in Figure 10. Figure 10a shows the arc current waveform, and Figure 10b shows the arc voltage waveform. When an arc fault occurs in a DC steady-state line, the arc current and arc voltage both fluctuate violently, resulting in a significant non-linear change. Additionally, the arc contact resistance waveform is shown in Figure 11. Compared with the contact resistance in the steady state, the contact resistance of the arc increases significantly, and accompanied by the violent non-linear fluctuations, it seriously affects the stability of the system.

4.2. Hazard–Risk Evaluations

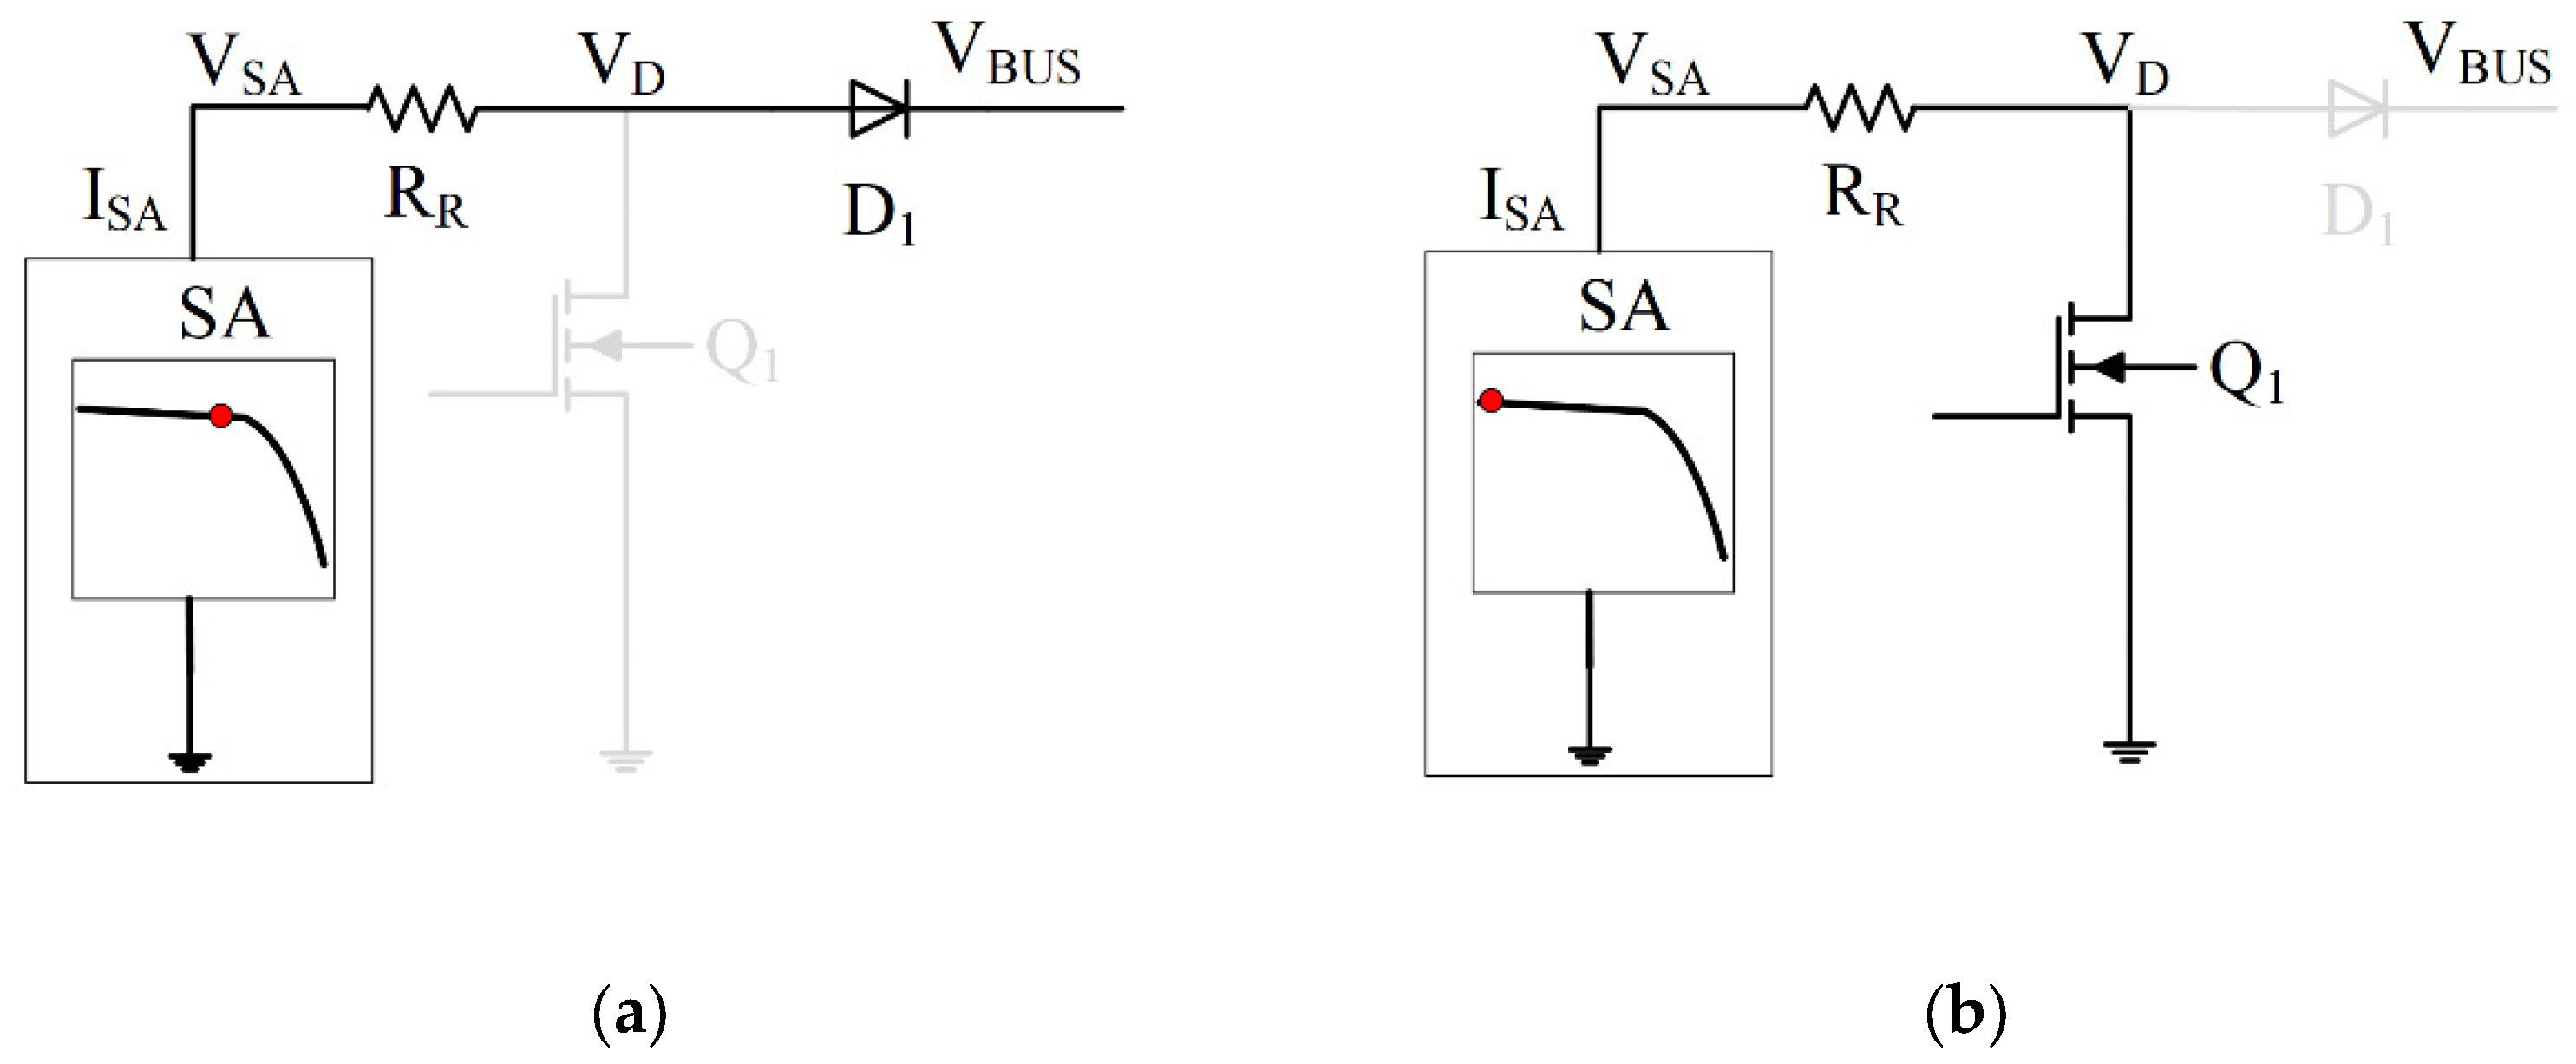
4.2.1. Influence on Working Point of Solar Array

The output characteristics of the solar array are shown in Figure 12. The working point of the S3R is the switch between the short circuit working point (point 1) and the rated working point (point 2), where the rated working point is located near the maximum power point.
As shown in Figure 13a, when the SR is in bus feeding mode, the SA operates at the rated working point, and the steady state is as shown in Equation (14). When an arc fault occurs, the contact resistance of the SADA slip ring RR increases with the trend shown in Figure 11, which immediately causes the SA output voltage (VSA) to increase. As VSA increases, the SA’s working point moves to the current drop region, which causes the SA’s power supply capacity to decrease.
V S A = I S A R R + V b u s + V D 1 .
As shown in Figure 13b, when the SR is in shunt mode, the SA operates at the short circuit working point, and the steady state is as shown in Equation (15). When an arc fault occurs, the SA working point shifts toward the right. However, limited by the contact resistance, during the arcing period, the SA always operates in the constant current region, which makes it difficult to cut the arc off in shunt mode.
V S A = I S A R R .
When the SR is in switching mode, the SA working point switches back and forth between the short circuit working point and the rated working point. When an arc fault occurs, the working point then also shifts toward the right, and the output energy decreases as a result.

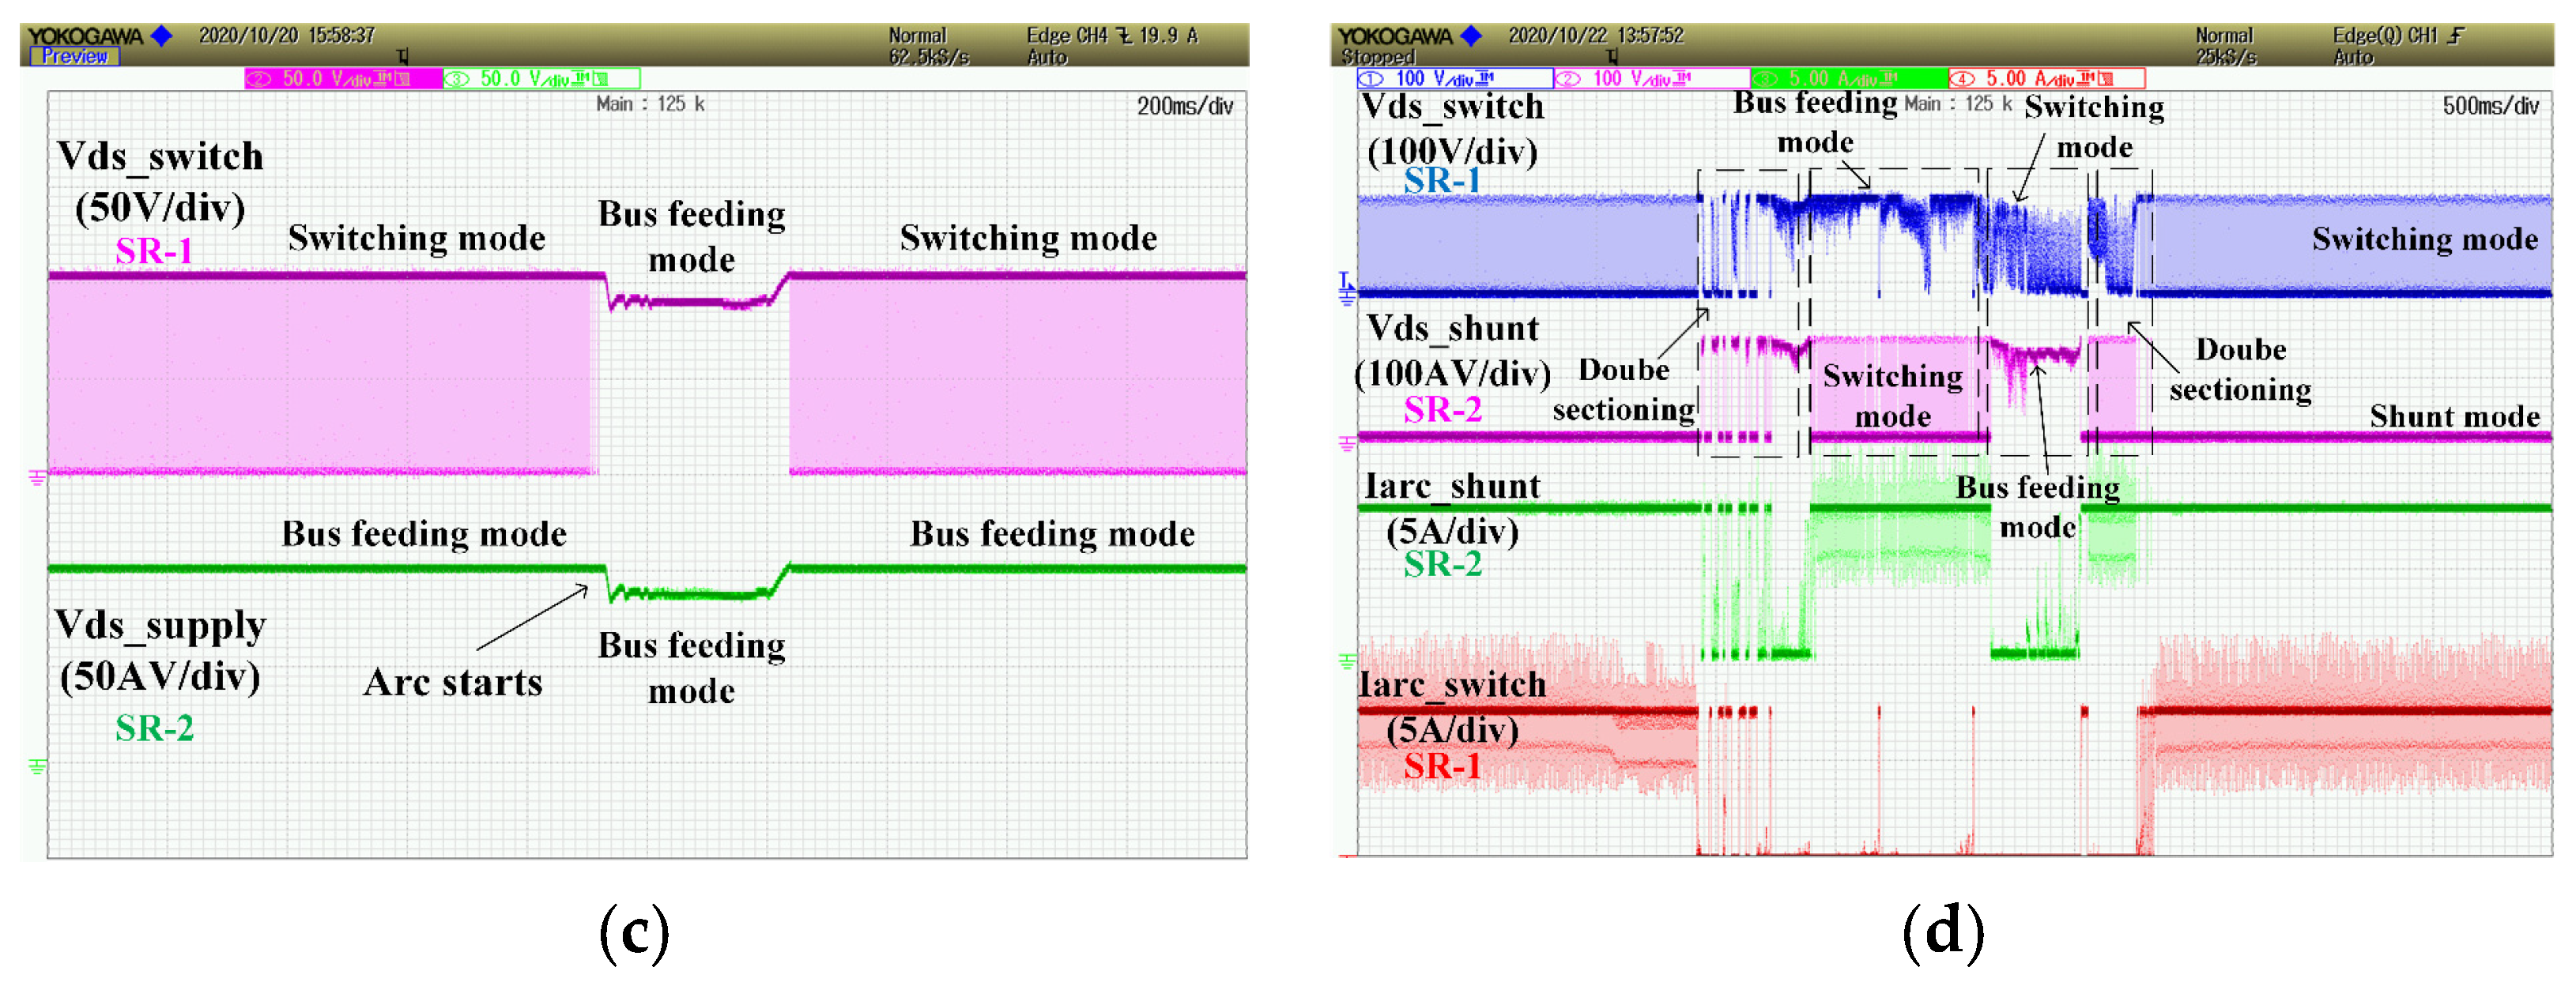
4.2.2. Influence on Stability of the SR and Security of the Power System

When an arc fault occurs in the SADA slip ring and causes the working point of the SA to move, the corresponding SR cannot meet the power supply demand, and this affects the change in the operation mode of the adjacent SR. Simultaneously, the input voltage and current of the SA both fluctuate violently, which may trigger the “Double sectioning”. If multiple sections of the SR produce intermittent arc faults at the same time, it may cause the SR to switch repeatedly between multiple operation modes, destroy the shunt sequence, and damage the SR.
The high local temperature generated by an arc discharge can cause ablation and, in severe cases, can damage the insulation of the slip ring, thus causing short circuits or low-impedance channels to occur between adjacent solder joints and between the solder joints and the slip ring. At the same time, the arc may also cause high-impedance open circuits to occur at the solder joints, thereby affecting the electrical transmission function of the slip ring and causing the corresponding SA to fail; this then affects the quality of the bus power supply and can seriously threaten the security of the power supply system. The damaging effect of the vacuum arc depends on its duration. Arcs of longer duration cause more serious damage. The arc duration is dependent on the magnitude of the arc current. A higher arc current causes the arc to last longer and thus causes more serious arc burns [32]. The analysis above shows that the non-linear phenomenon caused by the space arc fault of the SADA slip ring seriously threatens the stability and security of the satellite power system.

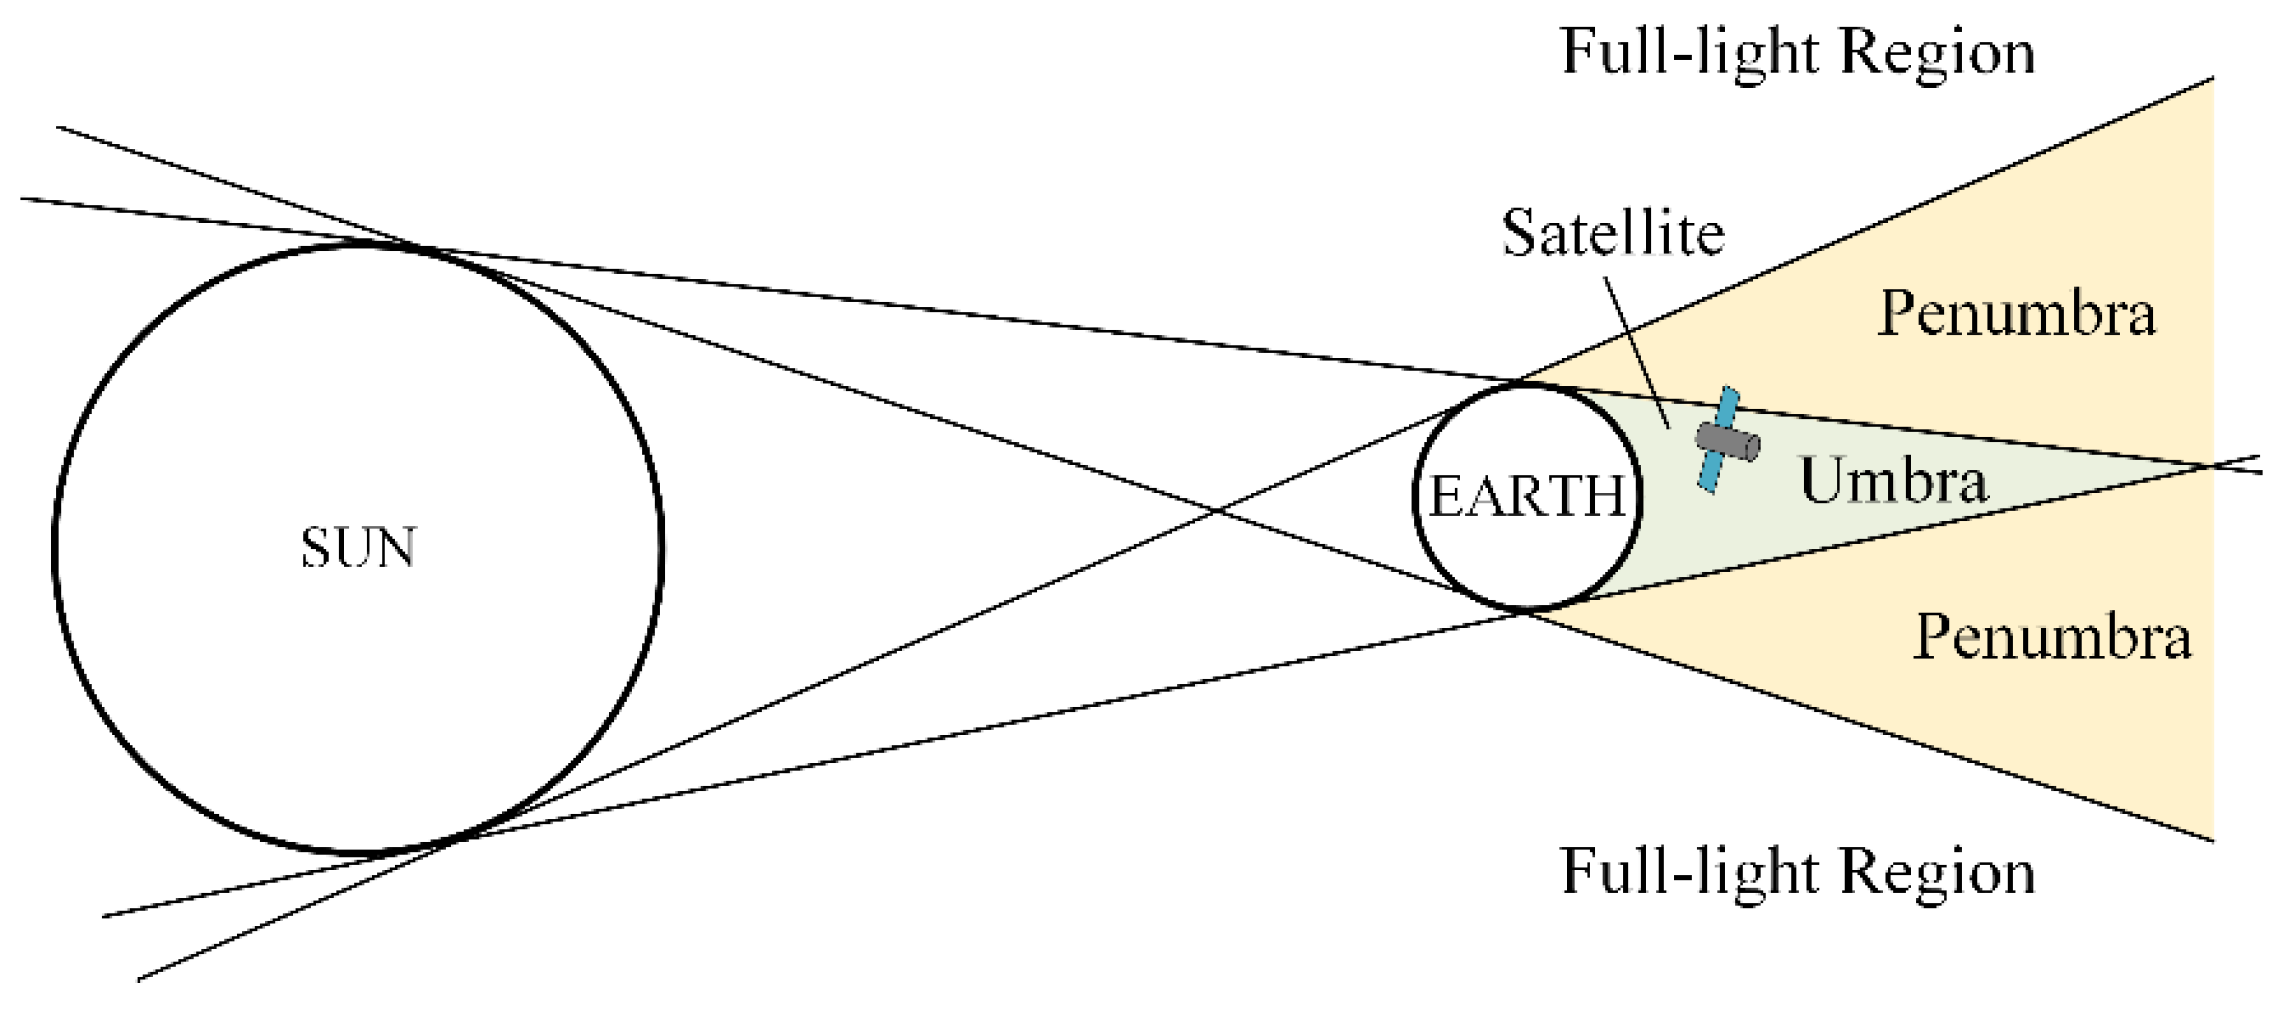
5. Analysis of Non-Linear Phenomena of Solar Array and Load during the Earth Eclipse

5.1. Modeling of Non-Linear Phenomena of Solar Array and Load during Satellite Exiting the Eclipse

For GEO satellites, the Earth eclipse is generated because the Earth blocks the sunshine, as shown in Figure 14. There are two eclipse periods every year, which appear 23 days before and after the spring equinox and autumn equinox, respectively, lasting approximately 46 days each time. The Earth eclipse consists of two regions, the umbra and the penumbra [33]. The umbra is the conical shadow in which the sunlight is completely blocked by the Earth. The penumbra is the partial shadow between the umbra and the full-light region. The longest Earth eclipse period occurs on spring and autumn equinox days, and the longest Earth eclipse lasts for 72 min, of which the penumbra is divided into two sections; each section is approximately 2 min [23].
The solar array is composed of many solar cells in parallel or in series. According to (4), ignoring the influence of Rs and Rsh, the simplified output characteristic equation of the solar array can be obtained as follows:
I S A = n p I p h n p I 0 [ exp ( q V c e l l n s α k T ) 1 ] ,
where ISA is the output current of the solar array, np is the number of parallel solar cells, and ns is the number of series solar cells.
In the umbra region, the solar radiation intensity is zero, so the output current of the solar array ISA is 0. In the penumbra, the light of the sun is only partially cut off by the Earth. The solar radiation intensity within the penumbra region varies from zero at the umbra border to the full value at the border of the full-light region. It can be seen from (5) that ISA is proportional to the light intensity. Therefore, the energy output of the solar array increases linearly from 0 in the process of the satellite leaving the Earth eclipse from the border of the umbra region to the border of the full-light region, as shown in Figure 15.
There are several basic types of loads for satellite power systems, including constant power loads, constant resistance loads, constant current loads, and constant voltage loads. The basic types of loads can be combined into more complex loads, which can form a combination in space, such as the parallel connection of several different types of loads, or can form a combination in time, such as switching different types of loads over time. For example, the two constant power loads shown in Figure 16a can be combined into a variable power load, as shown in Figure 16a, which is actually a non-linear pulse load that switches between the two power loads over time, as shown in Figure 16c.

5.2. Hazard–Risk Evaluations

The division of PCU three-domain control is shown in Figure 17. The energy of the solar array and the battery is allocated and managed by the VMEA. When the output energy of the solar array is constant, but the load varies non-linearly, as shown in Figure 16b, it is usually only regulated within the S3R domain (full-light region) or the BDR domain (umbra region), and there is no need to stabilize the Vbus by spanning multiple domains. However, when the load is constant, but the output energy of the solar array varies with the light intensity during the Earth eclipse period, the process of PCU three-domain control is shown in Figure 18. From entering the penumbra region, ISA gradually decreases as sunlight is blocked. When the energy of the solar array is insufficient to meet the load demand, the PCU begins to enter the BDR domain to control the battery to supply power to the load to stabilize the Vbus. When entering the umbra region, ISA is reduced to 0, and all the energy required by the load is provided by the battery. In the stage of leaving the Earth eclipse, ISA gradually increases due to the recovery of the sunlight, and the output of the battery IBDR decreases accordingly. Until IBDR drops to 0, the PCU begins to enter the BCR domain briefly, and the BCR controls the bus to charge the battery to stabilize the Vbus. When the output energy of the solar array is more than the power consumption of the satellite payload, the PCU enters the S3R domain. The energy of the solar array is controlled by S3R to stabilize the Vbus, and the excessive energy is used to replenish the battery.
In the process of the satellite passing through the Earth eclipse region to the full-light region, the output energy of the solar array varies with the light intensity, and when the load is a variable power pulse load, the PCU stabilizes the Vbus by switching the three domains multiple times. The adjacent domains are switched through the hysteresis comparator. If the load switching speed is too fast and exceeds the system’s response capability, multiple cross-domain regulation poses risks for the charge and discharge regulators, and in severe cases, the battery cannot be normal charge and discharge. There is no light during the Earth eclipse period, and the energy of the whole satellite is supplied by the battery. Therefore, when the electric energy supplied by the satellite battery cannot meet the demand, part of the payload needs to be turned off to meet the energy demand of the satellite platform, which affects the execution of normal space missions. If the charge and discharge regulators are abnormal or malfunctioning during the Earth eclipse period, it seriously endangers the safety of the power system and causes catastrophic consequences to the satellite.

6. Simulations, Experiments and Results

6.1. Unexpected Energy of Solar Array

We built an experimental platform to verify the hazard–risk. The S3R was fed by Agilent E4360A solar array simulators and loaded with an electronic load (ITECH IT8834S). The present study used two-section SRs in the equivalent experiment. The unexpected energy was equivalent to the current pulse ΔI. Waveforms were monitored using a digital storage oscilloscope. The shunt regulator of the satellite power system adopted the topology shown in Figure 4, and its various parameters are shown in Table 1.
The experimental condition of the system is as follows: SR-2 is in bus feeding mode and SR-1 is in switching mode when working in steady-state conditions. Assuming that unexpected energy is injected into SR-1, the peak value of the current spike ΔI is 18 A, and the duration of the current pulse is 100 μs. The experimental results are shown in Figure 19 and Figure 20. When ΔI is injected during the on-time of the shunt MOSFET (Figure 19), all the current pulse ΔI passes through Q1, and the current stress Ids of Q1 increases instantaneously. When ΔI is injected during the off-time of Q1 (Figure 20), the current of the solar array supplies power to the bus through the diode, and ΔI directly affects the diode D1, increasing the current of the main power diode ID1 linearly. Additionally, the current stress of Q1 and D1 increases linearly with the increase in unexpected energy.
The power loss of the shunt MOSFET due to unexpected energy compared to normal operation is shown in Figure 21 and Figure 22. Due to the unexpected energy for solar array, the peak power loss during both the turn-on and turn-off of the MOSFET increases significantly.
When ΔI occurs during the critical state of SR-2 in bus feeding mode and SR-1 in switching mode, as shown in Figure 23, Vds_s1 and Vds_s2 are the voltage of the MOSFET in SR-1 and SR-2, respectively. When there is an unexpected current of 18 A with a duration of 100 µs in SR-1, double sectioning is induced, increasing the bus voltage ripple ΔVbus up to 750 mV and thus reducing the output quality.

6.2. Arc Fault of SADA Slip Rings

The hazards of SADA arc faults are also verified with the above two-section SR equivalent experimental platform. The output current of each section of the solar array was 7 A. The arc faults of SADA slip ring were simulated using the arc generator.
The effects of arc faults on the SA working points in the different SR operation modes are shown in Figure 24. In Figure 24a, at the starting stage of the arc, VSA rises rapidly from the rated voltage of 100 to 115 V (open circuit voltage), thus causing the ISA to drop rapidly from the rated current to zero, which means that the arc cannot be maintained and is extinguished. In addition, this SA cannot supply power normally during the arcing period. Figure 24b shows the occurrence of electrical sparks and intermittent arcs between the electrodes. The ISA is also in an intermittent state with the variations in VSA, which means that it cannot meet the power supply demand. The occurrence of an arc fault in the bus feeding mode is shown in Figure 24c. Due to the increase in the arc impedance, VSA rises; ISA is lower than the rated current, and then, it fluctuates sharply above and below the rated value, which has a serious effect on the power supply quality. The occurrence of an arc fault in shunt mode is shown in Figure 24d. With an increase in the arc impedance, VSA rises, but the output is always within the constant current region of the SA, which means that the arc energy is sufficient and cannot be extinguished by itself.
With electrode separation, the arc can be broken by itself, as shown in Figure 25a, where the arc is extinguished rapidly after the flash and is thus less harmful. Figure 25b shows the arc fault when operating in shunt mode. The electrodes are always discharged to ground through the constant current output by the SA. The arc energy is too high, which results in excessive local temperatures and severe ablation of the contact material. If the arc cannot be eliminated sufficiently quickly, it easily burns the insulating layer and ablates the solar wing, which has serious consequences.
As shown in Figure 26, the occurrence of an arc fault causes the two SRs to switch between the switching mode, the shunt mode and the bus feeding mode, and the characteristic quantity is the voltage VDS of the shunt MOSFET. As Figure 26a shows, when an arc fault occurs in SR-2, the power supply of this SR is insufficient; this causes the SR-1 to switch to switching mode to maintain the stability of Vbus. Figure 26b,c show that the occurrence of an arc fault in SR-2 causes the SR to fail to meet the power supply demand. The SR-1 is then switched to bus feeding mode to supply power to the bus. The intermittent arc shown in Figure 26b has a greater impact on the bus output quality than the stable arc in Figure 26c, but the stable arc is not easy to break and is thus more harmful to the system. The situation in which the two SR arc faults occur at random is shown in Figure 26d. As the arc starting and extinguishing times for the two SRs arc faults are different, the operation modes of the two SRs are switched repeatedly, and four operation modes appear. The behavior in this situation affects the SR shunt timing severely and can damage the SR.

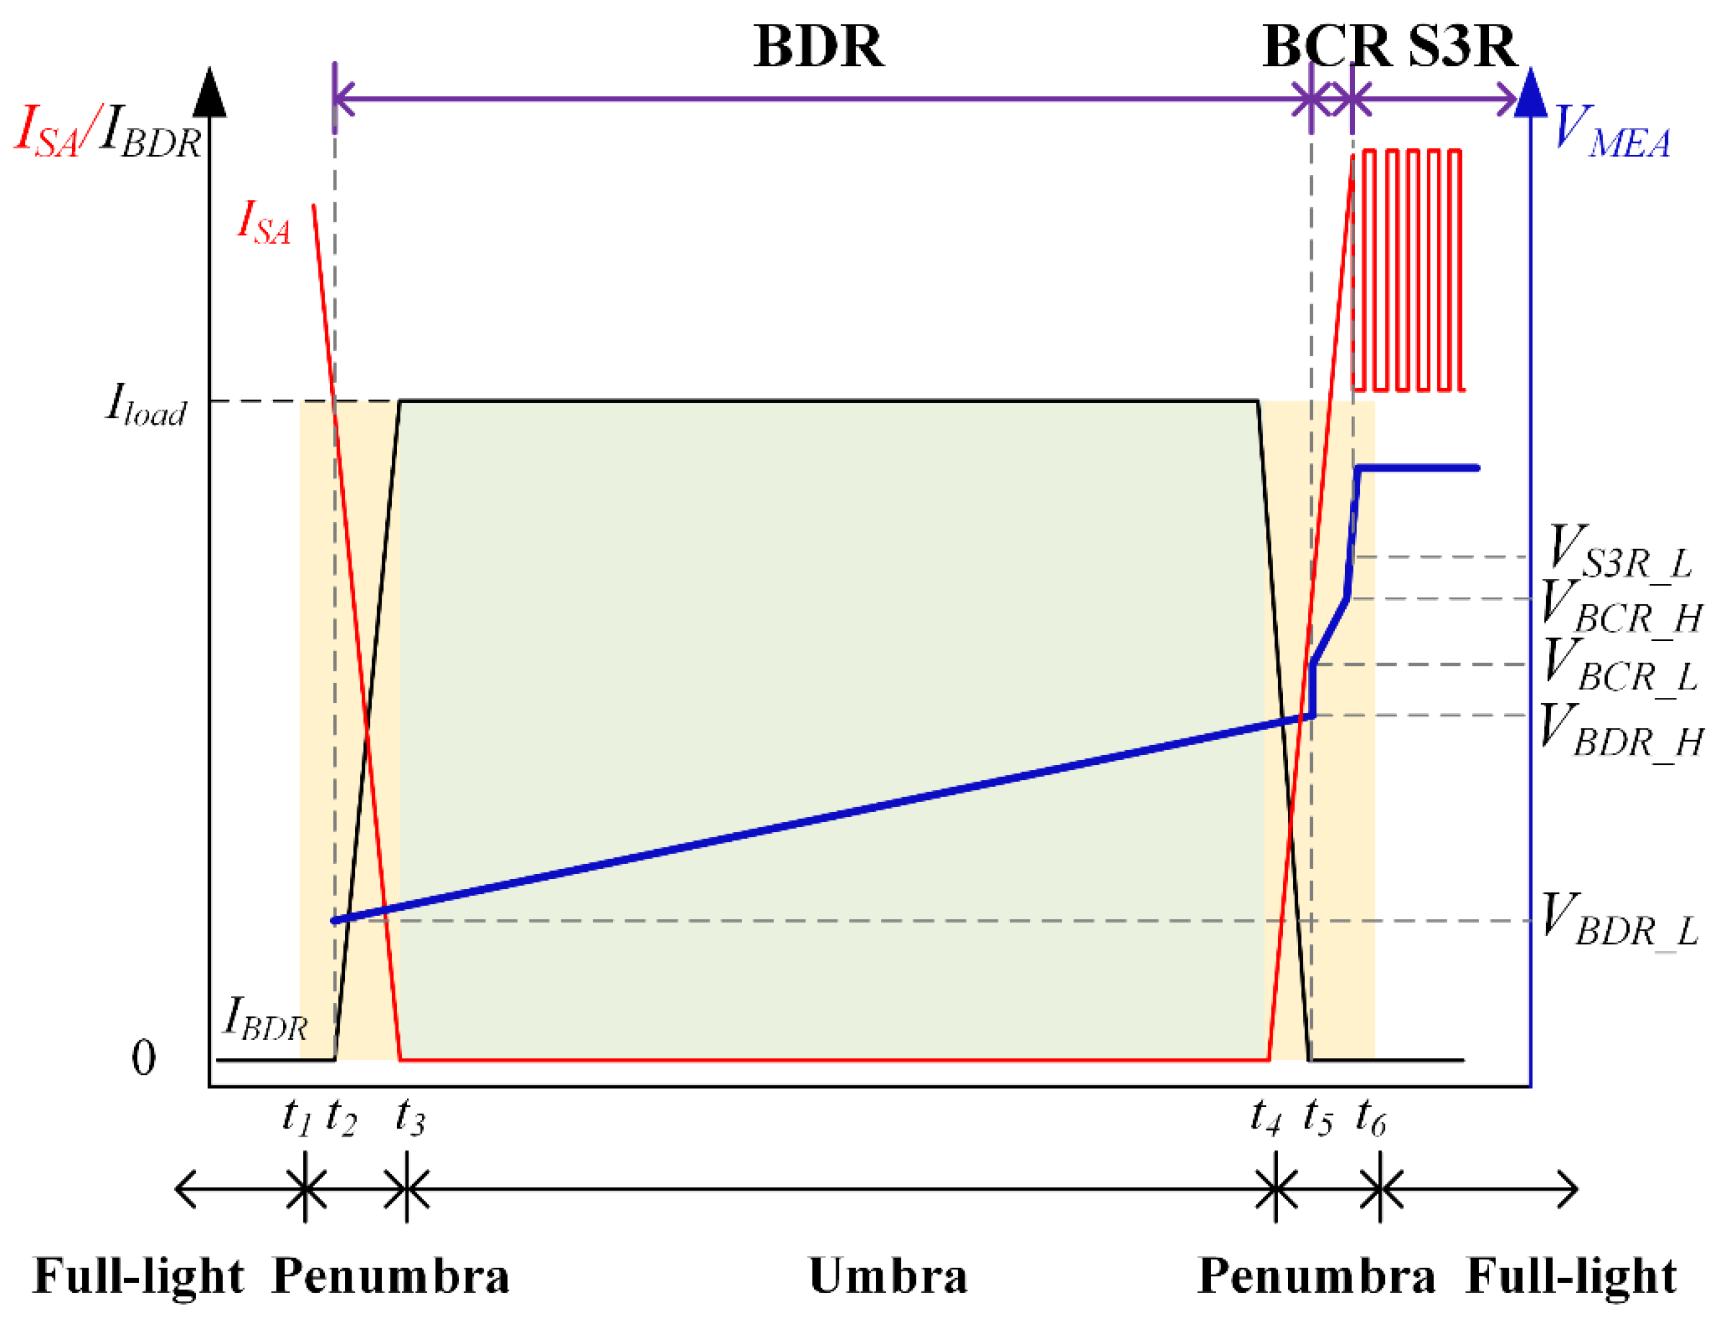
6.3. Simulation of Non-Linear Phenomena of Solar Array and Load during the Earth Eclipse

A PCU system model with a Vbus of 100 V was built to simulate the non-linear behavior of the payload during the Earth eclipse period. The present study used four-section SRs in the equivalent simulation, and the output current of each section of the solar array was 10.5 A. The process of the satellite leaving the penumbra period was simulated within 100 ms, and the recovery of the output current of the solar array during the process was equivalent to a linear increase.
The waveforms of the PCU with 20–30 kW pulsed load during the eclipse period is shown in Figure 27. In the umbra region (0–10 ms), the PCU works in the BDR domain (D) to stabilize Vbus, and the load demand is met by the output energy of the battery IBDR. After entering the penumbra region at 10 ms, with the recovery of the light, the output energy of the solar array IS3R gradually increases, while IBDR gradually decreases. At the end of the penumbra period, the PCU finally transitions to the S3R domain (S) for normal power supply after the regulation of the BCR domain (C).
The waveforms of the PCU with 30 kW constant power load during the eclipse period are shown in Figure 28. The normal state is shown in Figure 28a; Vbus is stabilized only by the BDR domain and S3R domain in the umbra region (0–20 ms) and full-light region after 130 ms, respectively. However, in the process of leaving the penumbra, in order to maintain the stability of Vbus, the PCU repeatedly switches between the BDR domain and the BCR domain, and between the BCR domain and S3R domain. If the speed of switching the load is too fast to reach 40 A/μs, as shown in Figure 28b, an abnormal working condition of fast BDR–BCR–S3R–BCR switching occurs, resulting in a peak of the charging current of the battery IBCR greater than 20 A, thus causing overcurrent protection.

7. Conclusions

In this study, the non-linear phenomena of the satellite power system influenced by the space environment were modeled and analyzed, including the unexpected energy of the solar array, the SADA vacuum arc fault, and the non-linear behavior of the solar array and load during the satellite Earth eclipse period. Additionally, the hazard risks of the above non-linear phenomenon were assessed. The analysis, simulation and experimental results show that:
  • With an increase in unexpected energy, the current stress of the power device increases, the MOSFET switching frequency increases, and the power loss increases. At the same time, there may be over-regulation of the S3R, leading to “double sectioning” and, in severe cases, reduced quality of the bus voltage.
  • The SADA vacuum arc fault has a serious effect on the power system reliability. Depending on the different working conditions and the locations at which the arc faults occur, the system has faults that include reduced solar array power supply capacity, frequent changes in the SR operation modes, and reduced bus voltage quality. At the same time, the high local temperatures generated by an arc discharge causes ablation and may even burn down the solar wings and the satellite power system, with potentially catastrophic consequences.
  • The non-linear behavior of the solar array and the load during the Earth eclipse has a negative impact on the cross-domain regulation of the PCU. The fast switching of the load during the Earth eclipse period causes the PCU to repeatedly cross the domains and damage the battery charge and discharge regulator.
Through the analysis of the PCU non-linear phenomenon in the space environment, the environmental factors that influence the PCU stability can be identified, and the weak links of the PCU can be highlighted, providing a theoretical basis for further improving its stability and reliability.

Author Contributions

Conceptualization, D.Z. and Z.L.; methodology, Y.M. and D.Z.; validation, Y.M.; resources, C.W. and L.Z.; data curation, Y.M.; writing—original draft preparation, Y.M.; writing—review and editing, Y.M. and A.L.; supervision, Z.L. All authors have read and agreed to the published version of the manuscript.

Funding

This research was funded by the National Nature Science Foundation of China, grant number 51777041 and the Shenzhen Science and Technology Project, grant number JSG20190823144607320.

Acknowledgments

We thank for the support of the fund for Joint Laboratory of spacecraft power supply and distribution system evaluation technology of Beijing Institute of Spacecraft System Engineering.

Conflicts of Interest

The authors declare no conflict of interest.

Abbreviations

The following abbreviations and nomenclature are used in this manuscript:
VbusBus Voltage
VMEAMain Error Amplifier (MEA) Voltage
VHystHysteresis Wide of Hysteresis Comparison
ΔVbusBus Voltage Ripple
ISASolar Array Current
CbusBus Output Capacitance
fmaxMaximum Switching Frequency
IphPhotogenerated Current
RsSeries Resistance
RshShunt Resistance
VcellSolar Cell Voltage
IcellSolar Cell Current
GLight Intensity
ISCShort Circuit Current
CSASolar Array Parasitic Capacitance
ΔIUnexpected Current of Solar Array
ΔVbus_DSFMaximum Bus Voltage Ripple
IRSolar Array Rated Current
VRSolar Array Rated Voltage
PSASolar Array Power
RRContact Resistance of SADA Slip Ring
PCUPower Conditioning Unit
S3RSequential Switching Shunt Regulator
BDRBattery Discharge Regulator
BCRBattery Charge Regulator
MEAMain Error Amplifier
SADASolar Array Drive Assembly
SASolar Array
SRShunt Regulator
ESDElectrostatic Discharges
GEOGeostationary Earth Orbit

References

  1. Osullivan, D.; Weinberg, G. The sequential switching shunt regulator(S3R). Proc. Rec. ESTEC Spacecr. Power Cond. Seminar. 1977, 123–131. [Google Scholar]
  2. Cao, Y.; Cao, D.; Wei, J.; Huang, W. Modeling for solar array drive assembly system and compensating for the rotating speed fluctuation. Aerosp. Sci. Technol. 2018, 84, 131–142. [Google Scholar] [CrossRef]
  3. Yun, S.-T.; Kong, S.-H. Forecasting Methods of Battery Charge and Discharge Current Profile for LEO Satellites. Electronics 2021, 10, 2999. [Google Scholar] [CrossRef]
  4. Chen, J.; Wang, X.; Wang, T.; Wang, T. Analysis on Energy System Safety in GEO Satellite Complex Eclipse. In Proceedings of the 7th China Satellite Navigation Conference (CSNC 2016), Changsha, China, 18–20 May 2016. [Google Scholar]
  5. Yan, L.; Wang, C.; Song, S. Development of the Design and Analysis System for the Solar Array Drive Mechanism. In Proceedings of the 6th International Conference on Intelligent Human-Machine Systems & Cybernetics, Hangzhou, China, 26–27 August 2014; pp. 253–256. [Google Scholar]
  6. Avino, F.; Gaffinet, B.; Bommottet, D.; Howling, A.; Furno, I. Slip Ring Test Assembly with Increased Breakdown Voltage Limit for High-Voltage Bus Satellites. IEEE Aerosp. Electron. Syst. Mag. 2020, 35, 32–36. [Google Scholar] [CrossRef]
  7. Khan, A.R.; Minh, N.D.; Toyoda, K.; Cho, M. Electrostatic Discharge Threshold on Coverglass Used to Protect Solar Cells in the Low Earth Orbit. IEEE Trans. Plasma Sci. 2018, 47, 1445–1452. [Google Scholar] [CrossRef]
  8. Plis, E.A.; Engelhart, D.P.; Murray, V.J.; Sokolovskiy, A.N.; Barton, D.A.; Ferguson, D.C.; Hoffman, R.C. Effect of Simulated GEO Environment on the Properties of Solar Panel Coverglasses. IEEE Trans. Plasma Sci. 2021, 49, 1679–1685. [Google Scholar] [CrossRef]
  9. Fukushige, S.; Akahoshi, Y.; Watanabe, K.; Nagasaki, T.; Sugawara, K.; Koura, T.; Cho, M. Solar-Array Arcing Due to Plasma Created by Space-Debris Impact. IEEE Trans. Plasma Sci. 2008, 36, 2434–2439. [Google Scholar] [CrossRef]
  10. Tang, E.; Gao, G.; Liu, M.; Han, Y. Research on the Discharge and Mitigation Created by Ultra-high Velocity Impact on Solar Array With Applied Power Supply. IEEE Trans. Plasma Sci. 2018, 46, 3100–3108. [Google Scholar] [CrossRef]
  11. Goebel, D.M.; Filimonova, O.S. High Voltage Solar Array Development for Space and Thruster-Plume Plasma Environments. IEEE Trans. Plasma Sci. 2022, 50, 721–730. [Google Scholar] [CrossRef]
  12. Ose, T.; Sanmaru, Y.; Kitamura, T.; Hosoda, S.; Cho, M. Emission spectral analysis of arc plasma on solar array in GEO environment. In Proceedings of the 2006 International Symposium on Discharges and Electrical Insulation in Vacuum, Matsue, Japan, 25–29 September 2006. [Google Scholar]
  13. Meng, Y.; Zhang, D.; Zhu, H. Negative Effects of Unexpected Energy on Sequential Switching Shunt Regulator and Suppression Methods for High-Power Satellite. IEEE Trans. Aerosp. Electron. Syst. 2021, 1. [Google Scholar] [CrossRef]
  14. Ji, X.-Y.; Li, Y.-Z.; Liu, G.-Q.; Wang, J.; Xiang, S.-H.; Yang, X.-N.; Bi, Y.-Q. A brief review of ground and flight failures of Chinese spacecraft. Prog. Aerosp. Sci. 2019, 107, 19–29. [Google Scholar] [CrossRef]
  15. Shen, L.; Wang, X.; Wang, Y.; Jing, G.; Li, C. Vacuum Arc Discharge Test of Aerospace Disc Slip Ring with Metallic Wear Debris. Spacecr. Environ. Eng. 2019, 36, 463–467. [Google Scholar]
  16. Lundin, B.T. Report of the Seasat Failure Review Board. NASA Tech. Rep. Serv. 1978, 1–98. [Google Scholar]
  17. Wang, X.; Min, D.; Pan, S.; Zheng, S.; Hou, X.; Wang, L.; Li, S. Coupling Effect of Electron Irradiation and Operating Voltage on the Deep Dielectric Charging Characteristics of Solar Array Drive Assembly. IEEE Trans. Nucl. Sci. 2021, 68, 1399–1406. [Google Scholar] [CrossRef]
  18. Jing, G.; Shen, L.; Wang, X.; Wang, Y.; Li, C.; Li, W. Experimental study of vacuum charge and discharge of the slip ring in spacecraft solar array drive mechanism. Spacecr. Environ. Eng. 2021, 38, 166–170. [Google Scholar]
  19. Sun, Y.; Wang, Y.; Sun, X.; Liu, X.; Yu, J. Research on failure modeling and process optimization of transmission conductive slip ring for aerospace. J. Mech. Eng. 2020, 56, 1–12. [Google Scholar]
  20. Wang, J.; Liu, R.; Xiao, R.; Ping, A.; Liu, J.; Zhang, M.; Li, Q. Optimized Design of Slip Ring Assembly for Aerospace to Reduce Deep Dielectric Charging. IEEE Trans. Nucl. Sci. 2022, 69, 915–924. [Google Scholar] [CrossRef]
  21. Khan, O.; El Moursi, M.; Zeineldin, H.; Khadkikar, V.; Al Hosani, M. Comprehensive design and control methodology for DC-powered satellite electrical subsystem based on PV and battery. IET Renew. Power Gener. 2020, 14, 2202–2210. [Google Scholar] [CrossRef]
  22. Parthasarathy, V.; Ferguson, P. Modelling and simulation of the power subsystem of a low earth orbit CubeSat. Aerosp. Syst. 2020, 3, 139–146. [Google Scholar] [CrossRef]
  23. Cao, Z.; Ding, H. Analysis of the Primary Power Supply System of a GSO Satellite in Eclipse Seasons. J. Spacecr. TTC Technol. 2013, 32, 27–31. [Google Scholar]
  24. Langer, M.; Bouwmeester, J. Reliability of CubeSats-statistical data, developers’ Beliefs and the way forward. In Proceedings of the 30th Annual AIAA/USU Conference on Small Satellites, Logan, UT, USA, 6–11 August 2016. [Google Scholar]
  25. Zhu, H.; Zhang, D. Influence of multijunction Ga/As solar array in usage in S3R and solving methods for high-power applications. IEEE Trans. Power Electron. 2014, 29, 179–190. [Google Scholar] [CrossRef]
  26. Zhu, H.; Zhang, D. Design Considerations of Sequential Switching Shunt Regulator for High-Power Applications. IEEE Trans. Ind. Electron. 2019, 67, 9358–9369. [Google Scholar] [CrossRef]
  27. Benghanem, M.S.; Alamri, S.N. Modeling of photovoltaic module and experimental determination of serial resistance. J. Taibah Univ. Sci. 2009, 2, 94–105. [Google Scholar] [CrossRef]
  28. Subramanian, V.; Indragandhi, V.; Kuppusamy, R.; Teekaraman, Y. Modeling and Analysis of PV System with Fuzzy Logic MPPT Technique for a DC Microgrid under Variable Atmospheric Conditions. Electronics 2021, 10, 2541. [Google Scholar] [CrossRef]
  29. Zhang, K.; Zhang, Q.M.; Long, R.R. The Experiment Study on Flash Spectrum Produced by Hypervelocity Impact. Appl. Mech. Mater. 2015, 782, 197–203. [Google Scholar] [CrossRef]
  30. Fang, L.; You, X.; Yan, L. Control loop design of sequential switching shunt regulator considering the influence of double section functioning. IET Power Electron. 2014, 7, 998–1007. [Google Scholar]
  31. Li, H.; Wang, S.; Lu, J.; You, X.; Yu, X. Stability Analysis of the Shunt Regulator with Nonlinear Controller in PCU Based on Describing Function Method. IEEE Trans. Ind. Electron. 2016, 64, 2044–2053. [Google Scholar] [CrossRef]
  32. Feng, W.; Han, G.; Liu, Y.; Wang, Z.; Xu, Y.; Yu, D. Spacecraft EPDS Arc Short Circuit Failure and Prevention. Spacecr. Eng. 2013, 22, 65–70. [Google Scholar]
  33. Fixler, Z.S. Umbra and penumbra eclipse factors for satellite orbits. AIAA J. 2015, 2, 1455–1457. [Google Scholar] [CrossRef]
Figure 1. Schematic diagram of PCU.
Electronics 11 01756 g001
Figure 2. Schematic diagram of satellite system [3].
Electronics 11 01756 g002
Figure 3. Relationship between VMEA and the load current.
Electronics 11 01756 g003
Figure 4. Shunt regulator (SR) topology.
Electronics 11 01756 g004
Figure 5. Solar cell equivalent circuit.
Electronics 11 01756 g005
Figure 6. U-I characteristic curves of solar array under different light intensity.
Electronics 11 01756 g006
Figure 7. Waveform of output current changing with light intensity.
Electronics 11 01756 g007
Figure 8. Switching mode of MOSFET.
Electronics 11 01756 g008
Figure 9. Disc slip ring structure diagram [15].
Electronics 11 01756 g009
Figure 10. Arc waveforms. (a) Arc current waveform; (b) Arc voltage waveform.
Electronics 11 01756 g010
Figure 11. Arc contact resistance waveform.
Electronics 11 01756 g011
Figure 12. Shunt switch working points. (a) U-I characteristic; (b) U-P characteristic.
Electronics 11 01756 g012
Figure 13. Shunt regulator operation modes. (a) Bus feeding mode; (b) Shunt mode.
Electronics 11 01756 g013
Figure 14. Umbra and penumbra area of an Earth eclipse.
Electronics 11 01756 g014
Figure 15. The relationship of ISA and light intensity during satellite exiting the earth eclipse.
Electronics 11 01756 g015
Figure 16. Satellite loads. (a) Constant power load; (b) Variable power load; (c) Variable power load that switches between two powers over time.
Electronics 11 01756 g016
Figure 17. Three-domain control principle of PCU.
Electronics 11 01756 g017
Figure 18. Waveforms of PCU with constant power load during Earth eclipse period.
Electronics 11 01756 g018
Figure 19. ΔI is injected during the on-time of MOSFET.
Electronics 11 01756 g019
Figure 20. ΔI is injected during the off-time of MOSFET.
Electronics 11 01756 g020
Figure 21. Comparison of conduction loss of MOSFET.
Electronics 11 01756 g021
Figure 22. Comparison of turn-off loss of MOSFET.
Electronics 11 01756 g022
Figure 23. “Double sectioning” waveform.
Electronics 11 01756 g023
Figure 24. Influence of arc on SA working point; (a) Stable arc in switching mode; (b) Intermittent arcs in switching mode; (c) Stable arc in bus feeding mode; (d) Stable arc in shunt mode.
Electronics 11 01756 g024
Figure 25. Arc pictures. (a) Short arcs and sparks; (b) Arc in shunt mode.
Electronics 11 01756 g025
Figure 26. Influence of arc on SR operation mode. (a) Switch between two operation modes when stable arc occurs in SR-2 (switching mode); (b) Switch between two operation modes when intermittent arc occurs in SR-2 (bus feeding mode); (c) Switch between two operation modes when stable arc occurs in SR-2 (bus feeding mode); (d) Switch among three operation modes when arc occur at random in two SRs.
Electronics 11 01756 g026aElectronics 11 01756 g026b
Figure 27. Waveforms of PCU with 30 kW constant power load during the earth eclipse period.
Electronics 11 01756 g027
Figure 28. Waveforms of PCU with 20–30 kW pulsed load during the earth eclipse period. (a) Normal pulse load. (b) Pulse loads with switching fast speed of 40 A/μs.
Electronics 11 01756 g028
Table 1. Parameters of Platform.
ParameterValue
Bus voltage100 V
Bus voltage ripple600 mv
Solar array sections18 A × 2 sections
Harness inductance LH28 mu H
Power inductor L160 mu H
The sampling resistor Rsen2.5 m Ω
Bus capacitance3.0 mF
MEA voltage divider K0.064
MEA: R12.35 kΩ
MEA: R2103.75 kΩ
MEA: C110 nF
Publisher’s Note: MDPI stays neutral with regard to jurisdictional claims in published maps and institutional affiliations.

