Article

Attentive Part-Based Alignment Network for Vehicle Re-Identification

The School of Electronics and Information Technology, Sun Yat-sen University, Guangzhou 510006, China
*
Author to whom correspondence should be addressed.
Electronics 2022, 11(10), 1617; https://doi.org/10.3390/electronics11101617
Submission received: 6 April 2022 / Revised: 13 May 2022 / Accepted: 14 May 2022 / Published: 19 May 2022
(This article belongs to the Special Issue Convolutional Neural Networks and Vision Applications, Volume II)

Abstract

:
Vehicle Re-identification (Re-ID) has become a research hotspot along with the rapid development of video surveillance. Attention mechanisms are utilized in vehicle Re-ID networks but often miss the attention alignment across views. In this paper, we propose a novel Attentive Part-based Alignment Network (APANet) to learn robust, diverse, and discriminative features for vehicle Re-ID. To be specific, in order to enhance the discrimination of part features, two part-level alignment mechanisms are proposed in APANet, consisting of Part-level Orthogonality Loss (POL) and Part-level Attention Alignment Loss (PAAL). Furthermore, POL aims to maximize the diversity of part features via an orthogonal penalty among parts whilst PAAL learns view-invariant features by means of realizing attention alignment in a part-level fashion. Moreover, we propose a Multi-receptive-field Attention (MA) module to adopt an efficient and cost-effective pyramid structure. The pyramid structure is capable of employing more fine-grained and heterogeneous-scale spatial attention information through multi-receptive-field streams. In addition, the improved TriHard loss and Inter-group Feature Centroid Loss (IFCL) function are utilized to optimize both the inter-group and intra-group distance. Extensive experiments demonstrate the superiority of our model over multiple existing state-of-the-art approaches on two popular vehicle Re-ID benchmarks.

1. Introduction

Vehicle Re-identification (Re-ID), a challenging task in computer vision, aims at identifying a vehicle of query by matching vehicle pictures captured from non-overlapping surveillance cameras. Indeed, it plays a crucial role in a broad range of surveillance applications, including the analysis of vehicle trajectory [1], handling traffic jams [2], and multi-camera tracking [3].
Currently, Re-ID is becoming increasingly attractive to researchers, enterprises, and the government, but it still remains unsolved due to two main reasons. First, diversified and complicated circumstances pose challenges, and illuminations and resolutions can vary widely in disjoint cameras. Second, vehicles of the same type and color also cause considerable difficulties in identifying the target vehicle. In consequence, the distinctions among vehicles are subtle, thus increasing the difficulty of distinguishing identities.
To capture the discriminative cues in feature learning, many part-based methods are proposed to aggregate part features and then formulate a combined representation for each vehicle image. Among them, Parsing-guided Cross-part Reasoning Network (PCRNet) [4], a strong part feature learning baseline, adopts a partition strategy to acquire the semantic segmentation-divided part features. Despite some remarkable achievements, these methods tend to treat all parts equally in the final representation and place too little emphasis on the salient part. Furthermore, they are ignorant of the importance of cross-camera consistency, thus being vulnerable to occlusions and background clutter.
Notably, considerable efforts [5,6,7,8,9,10,11,12,13] have been devoted to investigating attention mechanisms in Re-ID, which can effectively focus on vehicle-related features and meanwhile reduce background clutter. The most popular solution is to adopt a parallel arrangement for spatial and channel attention modules, taking advantage of exploiting two kinds of attention information. However, existing soft attention modules tend to extract different kinds of attention information independently, neglecting their crucial complementary effects. In addition, the authors of [7] exploit simple and homogeneous-scale spatial attention, thus only employing coarse-grained attention information. To sum up, there is still much room for improvement in the existing attention Re-ID models.
To fill the research gap, in this paper, we propose a novel Attentive Part-based Alignment Network (APANet) to tackle the above problems concurrently. It seamlessly integrates part-based alignment mechanisms and attention modules throughout the entire network. The features extracted from APANet are more robust, diverse, and discriminative, which is of great significance for correct matching. In addition, in APANet, the intra-class and inter-class distances are optimized simultaneously for better classification. In brief, APANet gains a benefit toward higher accuracy.
Our contributions can be mainly summarized as follows:
(1) With the purpose of enhancing the discrimination capacity of part feature representations, we adopt two part-level alignment mechanisms encompassing Part-level Orthogonality Loss (POL) and Part-level Attention Alignment Loss (PAAL). To begin with, a novel POL is formulated to learn diverse part-uncorrelated features via an orthogonal regulation among parts. We argue that the diversity of part features can fully realize the potential of final feature representations, thereby bringing a considerable performance boost. Furthermore, an effective PAAL is designed to perform attention alignment in a part-level manner, which facilitates modeling while exploiting camera-invariant features.
(2) In order to learn more discriminative features, a new Multi-receptive-field Attention (MA) module is proposed to exploit heterogeneous-scale pyramid attention information with multi-receptive-field streams. Notably, we intend to reduce the size of the module parameter as well as computational cost by adopting an efficient pyramid structure, therefore making up for the deficiency of multi-receptive-field streams. Additionally, the MA module cascades channel and spatial attention parts in series, bringing the complementary benefits of two kinds of attention information. In addition, the MA module adopts a unique embedded structure which places attention modules and residual blocks in parallel.
(3) To optimize the extracted features during the training stage, an improved TriHard loss and a Inter-group Feature Centroid Loss (IFCL) function are formulated to simultaneously optimize the intra-group and inter-group distances, respectively. For the former, an extra loss item is added to place more constraints on intra-class distances. As to the latter, inter-group distances among groups are calculated and optimized in a centroid-based fashion.
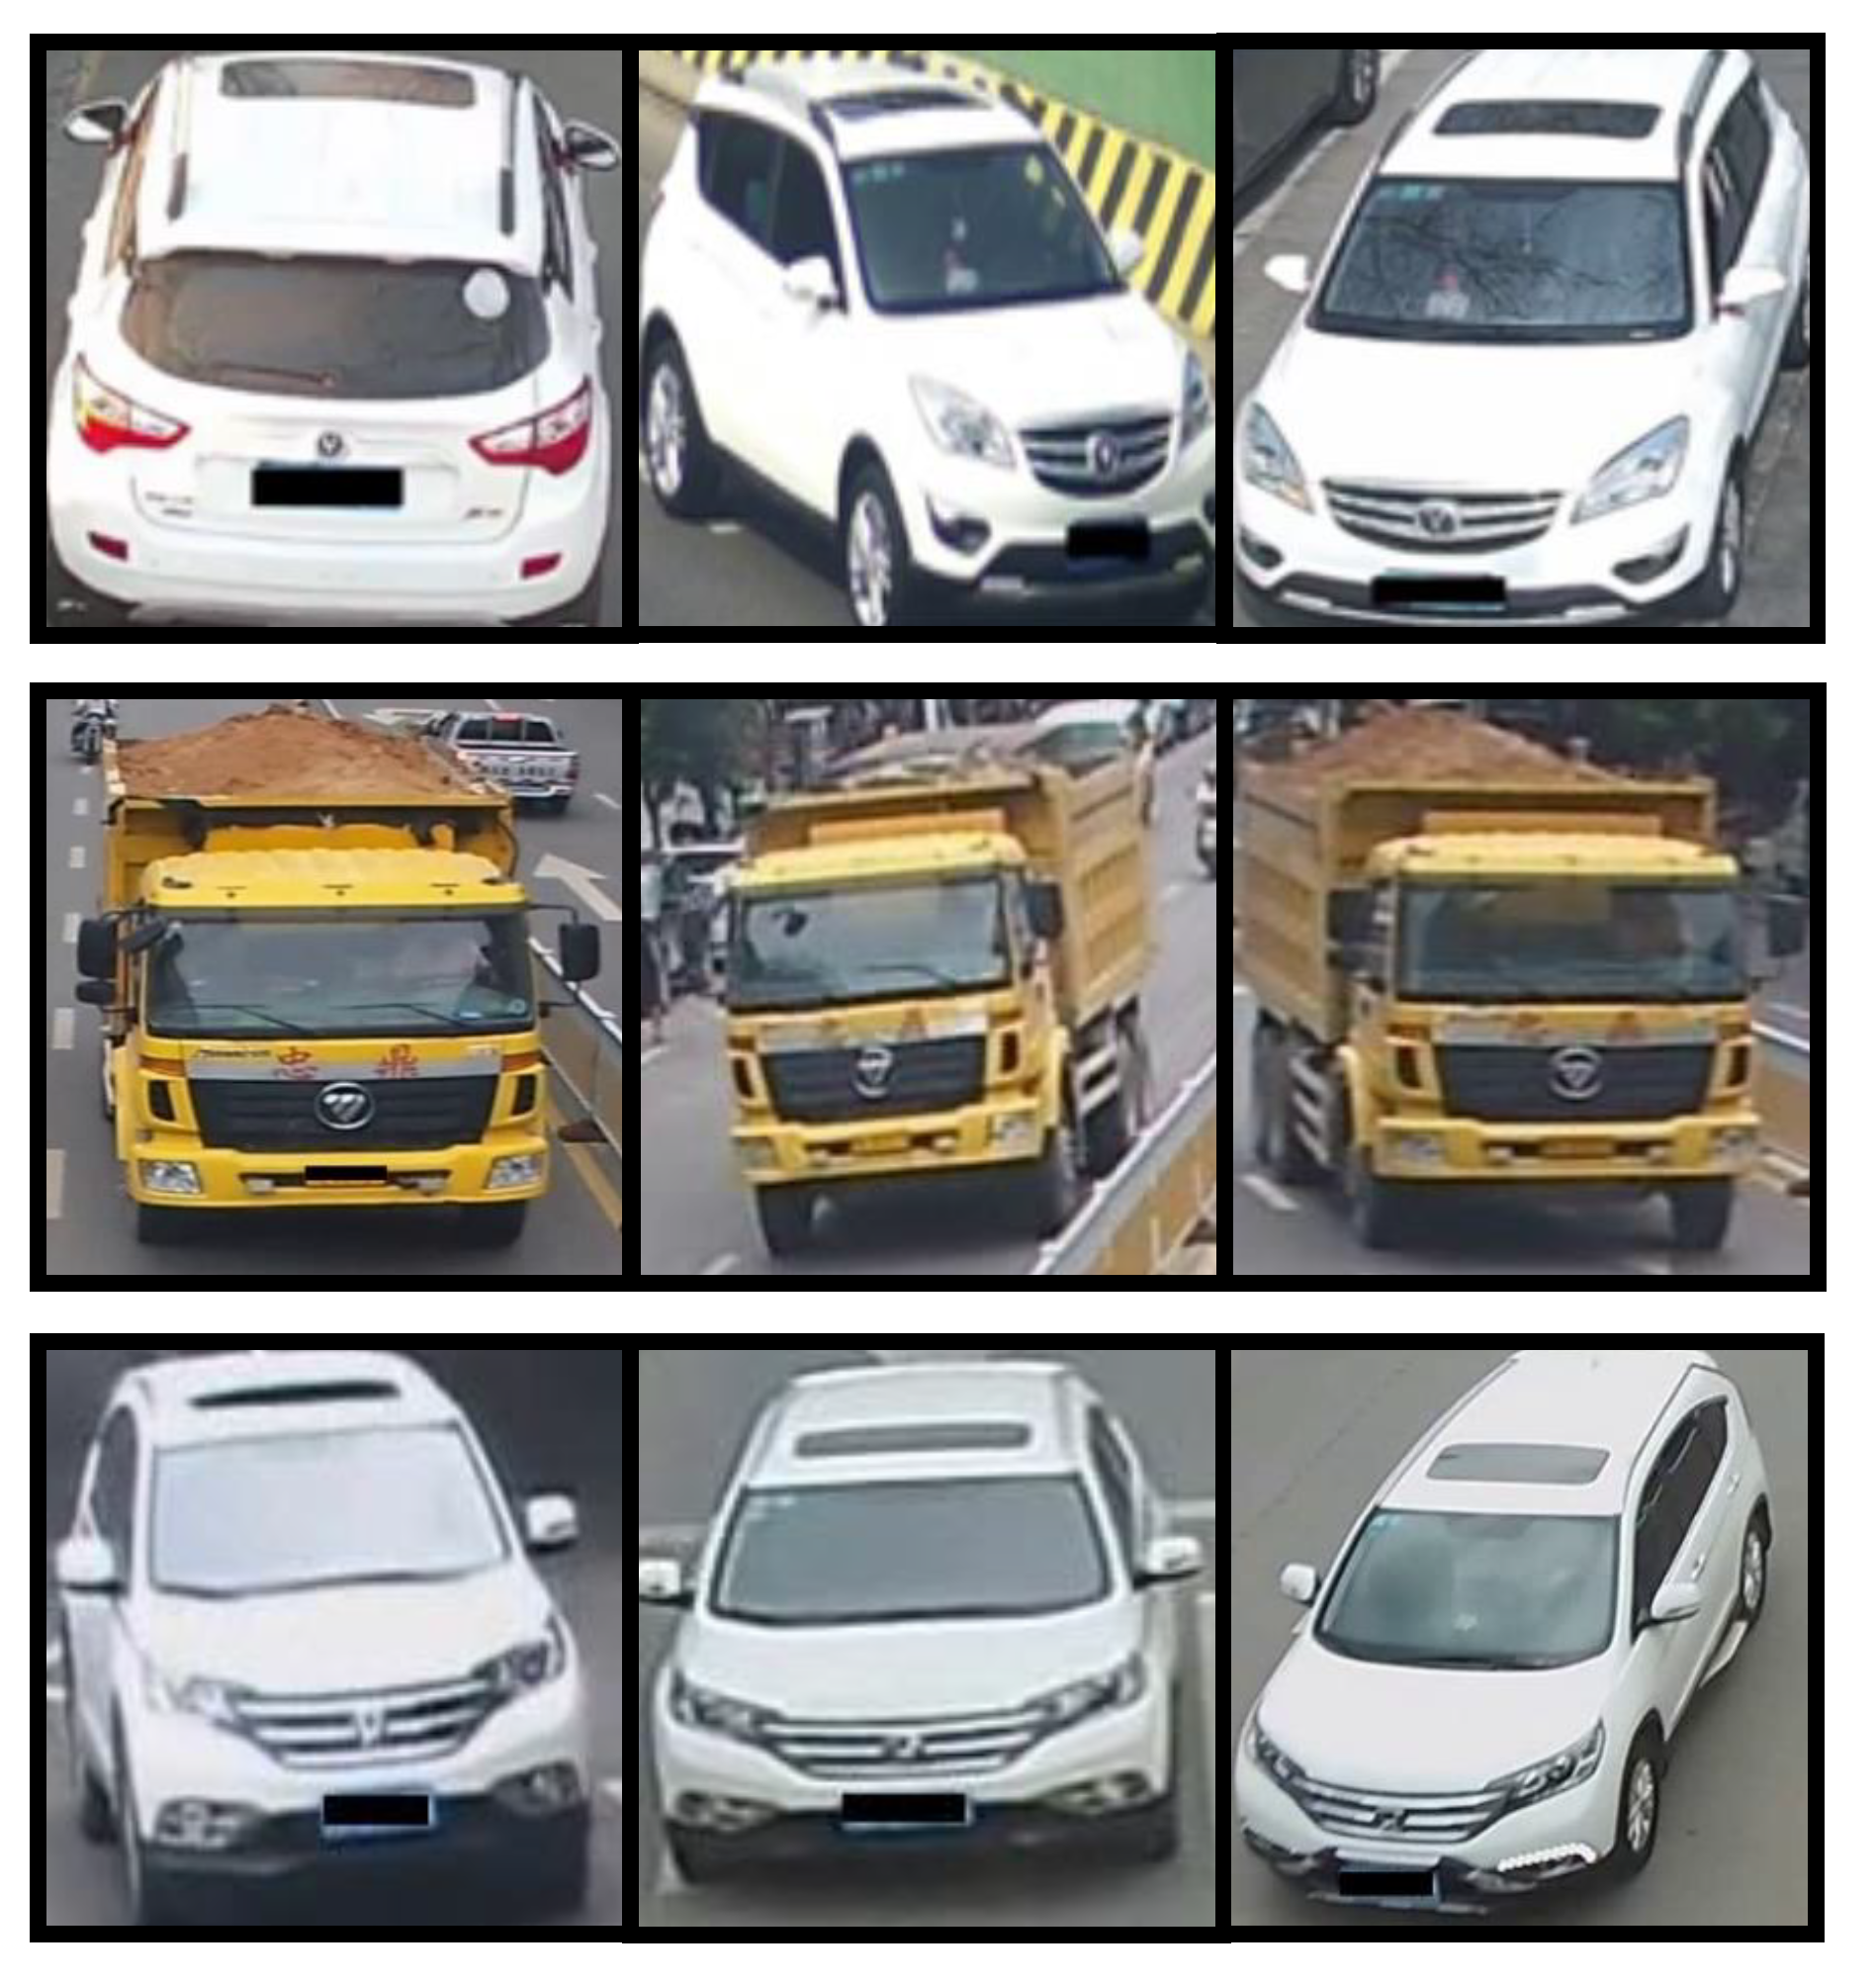
(4) To confirm the effectiveness of APANet, we conduct extensive experiments on two large vehicle Re-ID datasets. One is a large-scale benchmark dataset for vehicle Re-ID in the real-world urban surveillance scenario, named VeRi-776 [3,14,15] which is shown in Figure 1. Another dataset is called VERI-Wild [16] which is to promote the research of vehicle Re-ID in the wild. According to the experiment results, APANet achieves rank-1 accuracy of 96.4% on VeRi-776 and 89.2% on VERI-Wild (Small), surpassing multiple existing state-of-the-art Re-ID models.
The rest of this paper is organized as follows. Section 2 introduces related work with respect to vehicle Re-ID. Section 3 describes the details of our proposed approach. Section 4 presents the experiments and addresses some qualitative analysis. Section 5 offers the concluding remarks.

2. Related Work

2.1. Part-Based Re-ID Models

It is universally acknowledged that most state-of-the-art Re-ID methods adopt deep learning techniques to acquire discriminative feature representations. Here, our discussion will emphasize part-based Re-ID models which have gained progressive achievements to date. These approaches can be mainly categorized into two groups based on the strategy of generating vehicle part features.
The first group heavily relies on extra vehicle parsing techniques which provide semantically meaningful parts. By virtue of more accurate vehicle part segmentation, well-aligned part features are learned and greatly improve the model performance. In general, these part features are combined with holistic features to provide discriminative representations. Specifically, part-level similarity combination [17], multi-stage feature fusion [18], and multi-channel aggregation [19,20] methods are proposed to jointly learn both local and global features. In addition, some other methods aim to strengthen the robustness of the model and reduce the adverse impact of background clutter, by proposing a part-guided attention module [10], adopting orientation-driven matching [12], and achieving semantic part alignment [21]. However, the inadequacies of these methods should also be recognized. For one thing, an extra parsing model or part segmentation is demanded for aligning part features. For another, these methods are prone to noisy parsing and part detections. To sum up, their remarkable performances are subject to the accuracy of the additional pre-trained parsing models.
The second group tends to obtain the part feature by pixel-level segmentation. Meng et al. propose an effective Parsing-based View-aware Embedding Network (PVEN) [22] which is based on a parsing network to parse a vehicle into four different views. Furthermore, Deng et al. [23] aim to find the shortest path between two sets of parts with an efficient dynamic programming, eventually achieving feature alignment. Although these rough-divided methods are more flexible, they are not robust, being more sensitive to occlusions and background clutter. Additionally, part features are weighted equally in final representations, which is imprecise and requires refinement. Consequently, part-level feature representations still need to be discussed in theory and improved in practice.

2.2. Attention Mechanism

An attention mechanism is utilized to learn more expressive feature representations. It is widely applied in computer vision tasks and not limited to vehicle Re-ID. For example, Zhou et al. [24] proposed a Motion-attentive Transition (MATNet) attention framework motivated by human visual attention behavior for semantic segmentation tasks. To solve the problem of insufficient ground-truth datasets, a novel group-wise learning framework for weakly supervised semantic segmentation was proposed [25]. The attention mechanism can also address the task of detecting and recognizing Human–Object Interactions (HOIs) in images [26]. For the vehicle Re-ID field on the whole, it mainly falls into two types: spatial attention [6,7,11,12,13] and channel attention [5,10]. To be specific, spatial attention is commonly utilized to recognize the most important areas and then enlarge the weight of these salient regions whilst channel attention considers intrinsic interaction among different channels.
To exploit the complementary effect of these two kinds of attention, Teng et al. [27] construct the soft attention modules, further improving model performance. Zheng et al. [9] propose a jointly learning framework of employing multiple attention information, significantly enhancing the compatibility between the attention mechanism and feature representation. Moreover, Huang et al. [28] exploit channel and spatial information simultaneously by extracting a three-dimensional attention map and also construct a special transmissible structure for attention modules. To capture high-order statistics of attention information, Li et al. [8] came up with a interpretable attention module which exploits the richness of attention information. Others [6] utilize a self-attention mechanism to compute correlations across multiple scales from a multi-scale feature pyramid. They correspondingly construct a pyramid attention module for image restoration, which is capable of capturing long-range feature correspondences. More specifically, pixel–region correspondences are captured over an entire feature pyramid.
However, we emphasize that existing attention models are still insufficiently rich to capture subtle differences among vehicles or address the problem of highly similar backgrounds. In our proposed MA module, a multi-receptive-field spatial attention mechanism is proposed in a pyramid structure to exploit more comprehensive spatial attention information efficiently. Additionally, the MA module cascades channel and spatial parts in series, and adopts a unique attention concatenation arrangement. In addition, the necessary attention alignment among various images of same identity, often forgotten in the design of attention modules, is also taken into account by means of PAAL.

3. Proposed Approach

Attention mechanisms are widely utilized in vehicle Re-ID networks but often miss the attention alignment across views. Our work is meticulously proposed to learn part features that are robust, diverse, and discriminative. It can not only adopt part-level alignment mechanisms which allocate more attention towards the most discriminative part and realize cross-view attention consistency, but also learn discriminative features by exploiting multi-receptive-field attention information in an efficient pyramid structure. In addition, the MA module concatenates channel and spatial parts in series, thereby exploiting complementary benefits of two kinds of attention information. In this section, we firstly give a brief introduction to Attentive Part-based Alignment (APANet) in Section 3.1. The formulations of Part-level Orthogonality Loss (POL) and Part-level Attention Alignment Loss (PAAL) are elaborated in Section 3.2 and Section 3.3, respectively. The construction of the Multi-receptive-field Attention (MA) module and its attention mechanism are presented in Section 3.4. Finally, the classification module with multiple loss functions is introduced in Section 3.5.

3.1. Attentive Part-Based Alignment (APANet) and Network Structure

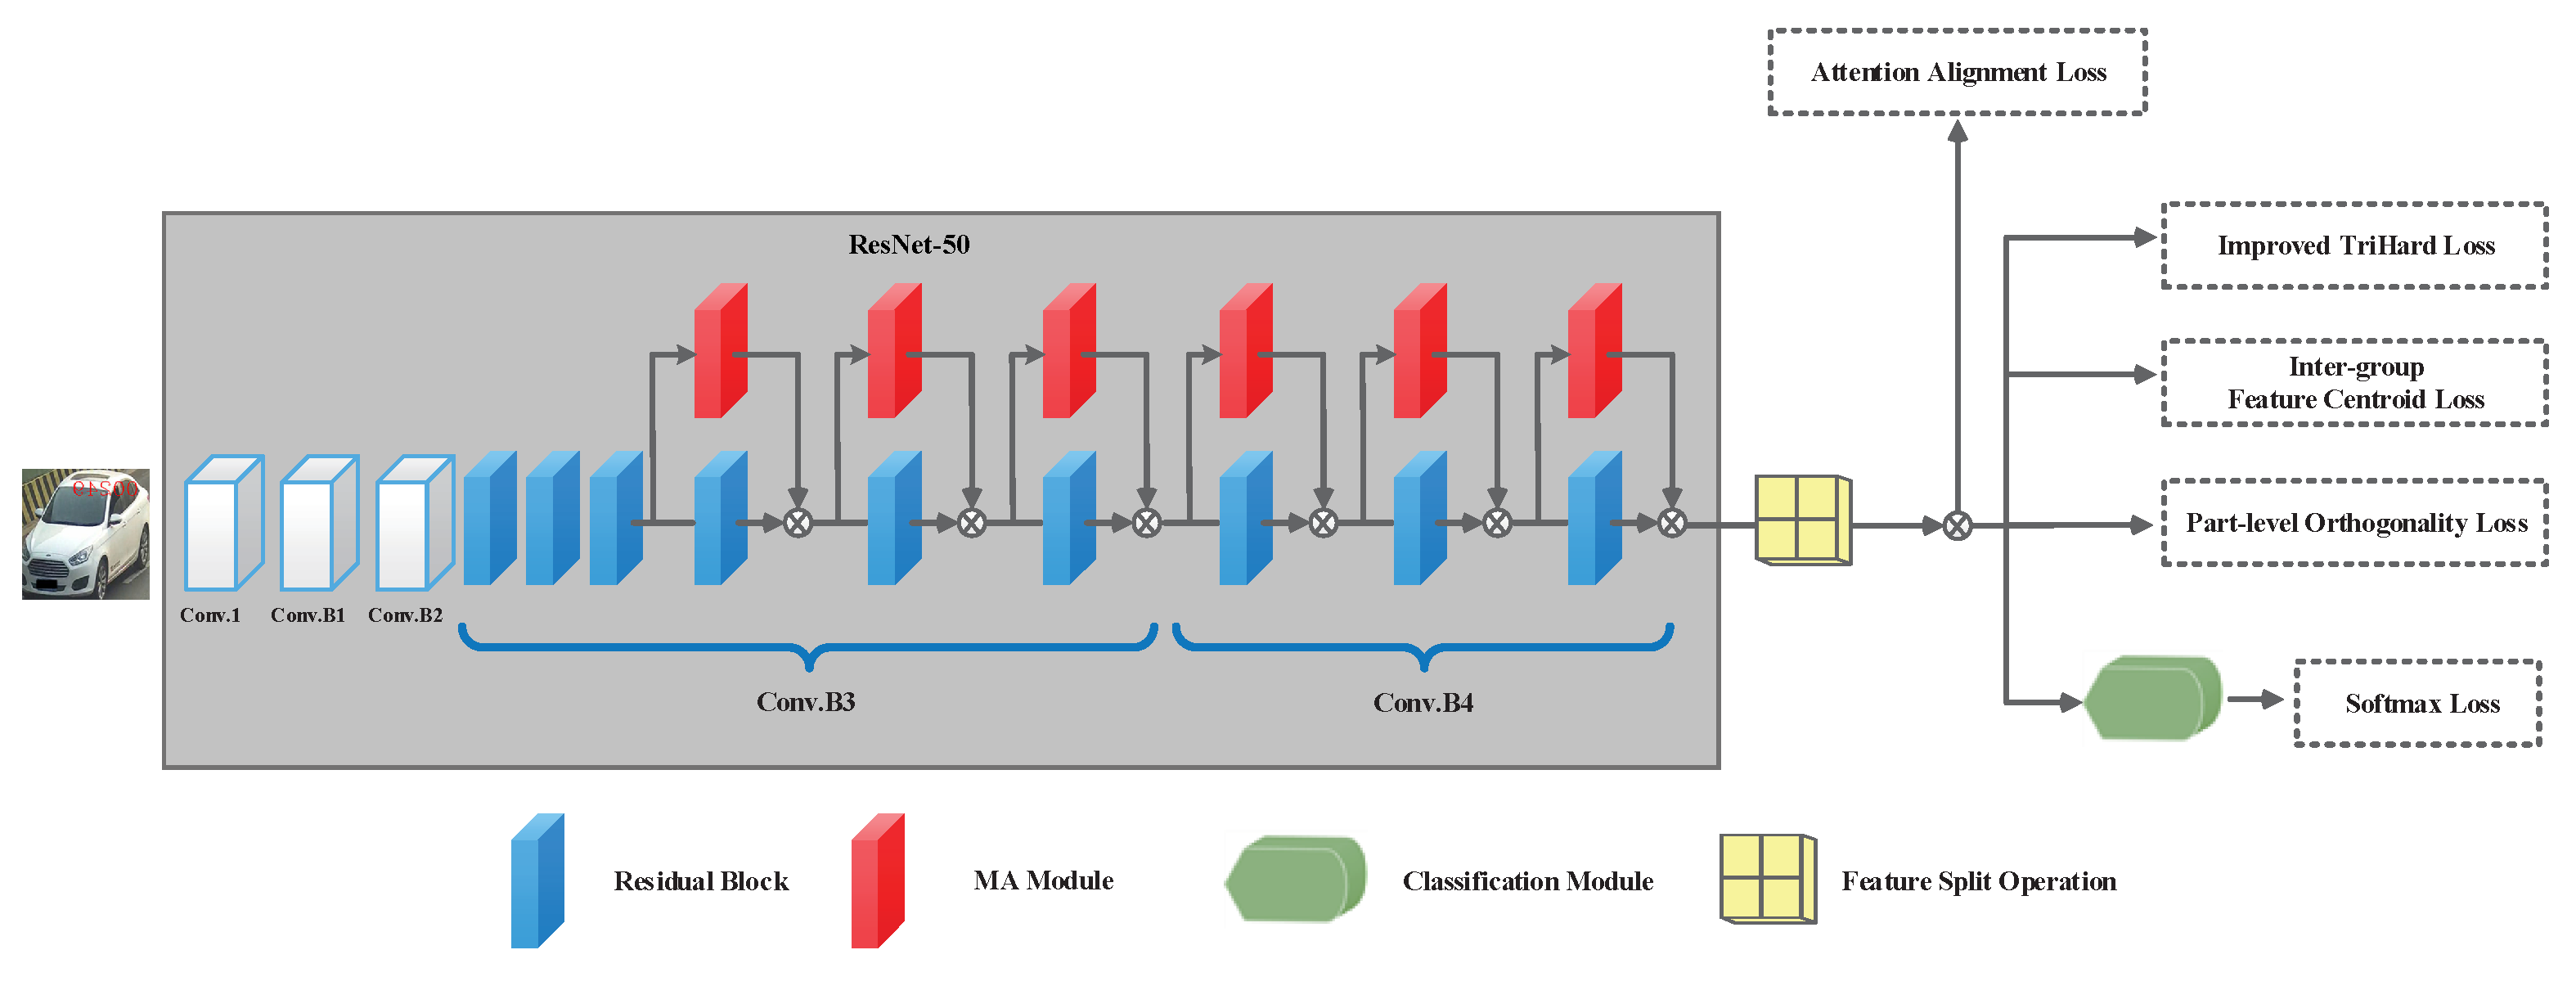
We firstly describe the backbone network of APANet, which is clearly illustrated in Figure 2. ResNet-50 is a 50-layer deep residual neural network proposed by He et al. [29]. Without loss of generality, all convolutional layers in ResNet-50 [29] are utilized as the backbone network. For a clearer illustration, we divide these convolutional layers into five parts, which are Conv.1 (i.e., the 1st layer), Conv.B1, Conv.B2, Conv.B3, and Conv.B4. In detail, there are 3, 4, 6, 3 residual blocks in the last four parts, respectively, and three convolutional layers are stacked for feature extraction in each residual block.
In the following, we intend to elaborate the design idea of the APANet framework. As aforementioned, APANet aims to obtain discriminative and robust presentations and enhance the discrimination of part features. Consequently, three requirements need to be satisfied in the network design.
To begin with, our proposed network should adopt a part-level alignment mechanism which is capable of enhancing the discrimination of part features and realizing attention alignment. The part features are generated through feature split operation. The number of part features N p is determined by the experiment detailed in Section 4.6.2. Correspondingly, we propose two effective loss functions, namely, Part-level Orthogonality Loss (POL) and Part-level Attention Alignment Loss (PAAL), to enhance the representations of part features. The former aims to enforce diversity among parts via orthogonality regulations whilst the latter focuses on achieving the cross-view consistency of part-level attention. Secondly, APANet is expected to adopt powerful attention modules which are crucial components in extracting part-based discriminative features. Finally, both the intra-class and inter-class distance of part features are expected to be meticulously optimized. In particular, we firstly add an extra constraint on intra-distance to improve triplet loss. Then, we propose a Inter-group Feature Centroid Loss (IFCL) to reduce inter-group distance. More details are elaborated in the following subsections.

3.2. Part-Level Orthogonality Loss (POL)

In particular, we propose a novel Part-level Orthogonality Loss (POL) to promote discrimination of part features. Sun et al. [30] drew the conclusion that correlations among feature embeddings would significantly degrade the final matching performance. Intuitively, the attention mechanism tends to learn discriminative features in a more compact subspace, therefore bringing higher feature correlations. To this end, POL maximizes part-level diversity via an orthogonality regulation loss item, advocating lower correlations among part features. Specifically, we intend to regard cosine similarity as an orthogonality metric so as to reduce feature correlations, which is beneficial to correct matching. Given two arbitrary vectors V 1 , V 2 , we give the definition of cosine similarity as:
S ( V 1 , V 2 ) = V 1 T V 2 | | V 1 | | · | | V 2 | |
where | | · | | is L2-norm and S stands for cosine similarity.
When it comes to the implementation details of cosine similarity, a simple yet effective linear function is meticulously introduced to provide a non-negative similarity value. Then, for each targeted image j with N p part features, it can be obtained that
P O L = 1 N j = 1 N a = 1 N p b = a + 1 N p S ( F ( j , a ) , F ( j , b ) ) + 1 2
where N denotes the number of images in a training batch and F ( j , a ) stands for the a-th part feature for the targeted vehicle image j and S stands for cosine similarity.

3.3. Part-Level Attention Alignment Loss (PAAL)

As aforementioned, the MA module is responsible for eliminating background clusters by employing comprehensive attention information. However, we argue that attention alignment, often neglected in designing attention modules, is significant for learning view-invariant and robust features.
Motivated by this idea, Part-level Attention Alignment Loss (PAAL) is meticulously proposed to reduce the adverse impact of cross-view variations and realize cross-camera consistency. Our intuition is that the shared regions of same-vehicle images across various cameras are crucial for correct matching and should be supervised during end-to-end training. Here, cosine distance D c is utilized to express the vector dissimilarity between two non-zero vectors, and is considered as the metric of attention consistency.
D c ( V 1 , V 2 ) = 1 S ( V 1 , V 2 ) .
We obtained a part-attention feature M R C o u t × N p × 1 , where C o u t denotes the output channel of features. Thereafter, the cross-channel global average pooling is introduced and defined as:
M ¯ = 1 C o u t c = 1 C o u t M c , 1 : N p , 1 : 1
where M ¯ R N p × 1 represents the flattened part-level attention map. This specific cross-channel pooling is reasonable since all channels share the identical part-level spatial attention map.
To cope with the potential misalignment issue among vehicles, we further improve PAA by introducing a soft threshold parameter T (experimentally set to be 0.2 in our implementation) to eliminate the background clutter. A part-level spatial attention map can be more precisely cropped so as to select salient foreground parts and reduce background clutter. Afterwards, all attention vectors are resized to have the same dimensions via interpolation operations.
Furthermore, based on cosine distance, PAAL is designed to supervise attention consistency in a part-level fashion. Formally, for every targeted vehicle i ( i = 1 , 2 , , P ) and its randomly sampled K images, PAAL can be written as:
PAAL = 1 K 2 i = 1 P a = 1 K b = a + 1 K D c ( M a i ¯ , M b i ¯ )
where K 2 denotes the number of combinations of K images taking 2 images at a time. P is the number of vehicle identities in a batch, and each vehicle has K images.
By virtue of PAAL, the part-level attention maps can be vertically aligned among various images of the same targeted vehicle i, which facilitates APANet to learn more view-invariant features.

3.4. Multi-Receptive-Field Attention (MA)

There have been numerous tentative efforts [31,32,33,34] in exploiting this spatial attention map by virtue of convolution. However, most of them employ homogeneous-scale spatial attention, and therefore are confined to mining coarse and simple spatial information.
With the purpose of improving the attention mechanism, we propose a Multi-receptive-field Attention (MA) module which manages to extract pyramid attention maps with multi-receptive-field streams, thereby enhancing the feature representation. Compared with existing attention modules, the main advantage of the MA module is employing more comprehensive attention information in an efficient pyramid structure which only involves relatively small parameters and requires a low extra computational cost. To the best of our knowledge, current existing methods mainly adopt a multi-scale mechanism in learning features and it is unusual in Re-ID to apply a multi-scale mechanism in designing attention modules.

3.4.1. Embedded Structure

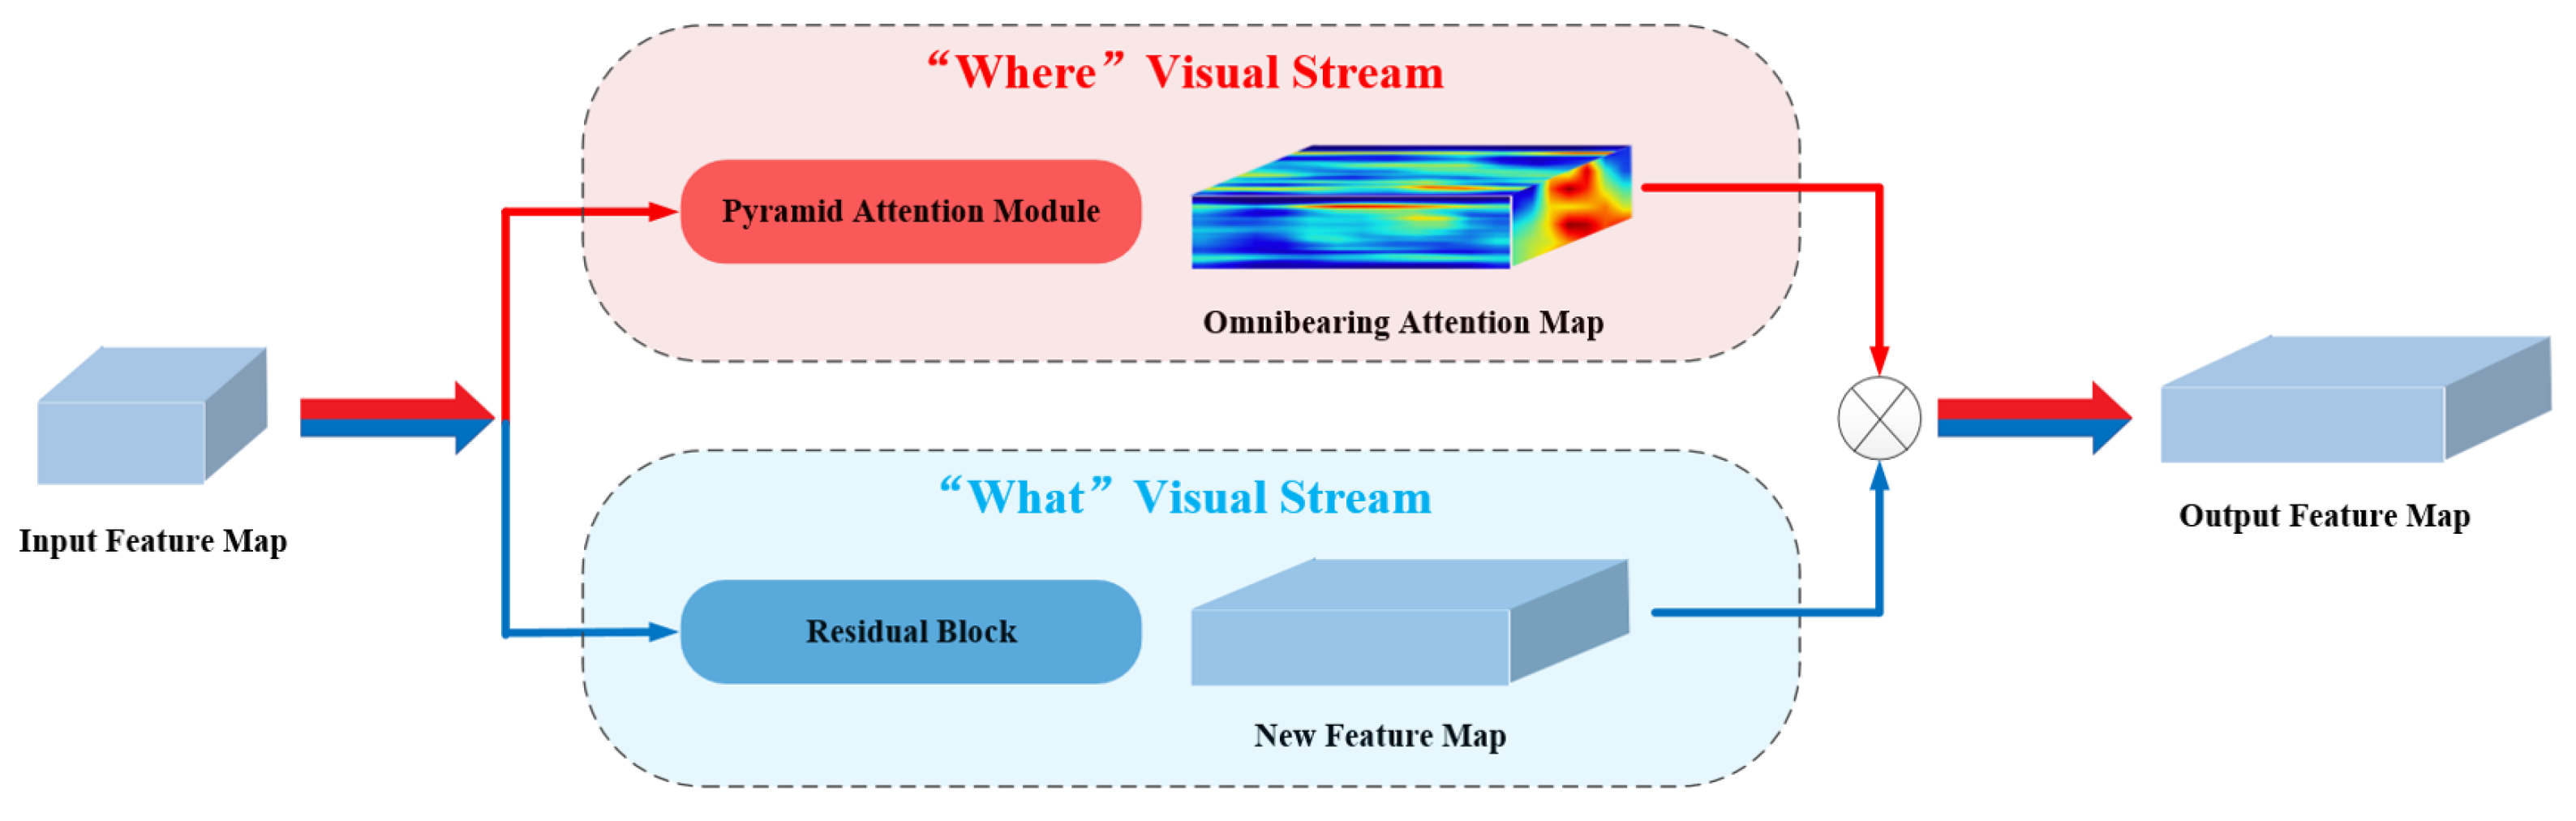
To begin with, we propose a unique embedded structure in pursuit of the best attention effect. Inspired by the two-stream hypothesis theory of the human visual system [35], we aim to construct a “what” visual stream (i.e., residual module) and a “where” visual stream (i.e., attention module) in two independent branches. Specifically, as presented in Figure 3, MA modules are in a parallel concatenation with residual blocks, whilst conventional Re-ID attention networks place them in series.
Formally, we define the input to an MA module as a three-dimension tensor F i n R C i n × H × W where C i n , H, and W stand for the number of input channels, height, and width. The corresponding output feature strengthened by the MA module can be written as:
F o u t = f ( F i n , W ) A
where F o u t R C o u t × H × W is the output feature map, the final omnibearing attention map obtained from the MA module is denoted by A R C o u t × H × W , ⊗ denotes the Hadamard product, and the function f ( F i n , W ) represents the specific parallel residual block in ResNet-50.
Remarks. Our proposed MA module is conceptually similar to the Convolutional Block Attention Module (CBAM) [32] since both of them employ the spatial and channel attention information. However, there are significant distinctions between them which can summarized as: (1) Concatenation arrangement. MA modules are placed in parallel with residual blocks retrieved from ResNet-50. On the contrary, the CBAM tends to concatenate them in series. Motivated by the two-stream hypothesis theory of the vehicle visual system, our intuition is to transmit the attention information continuously. Otherwise, the transmission channel of attention flow tends to be blocked by residual block. (2) Improvement of attention mechanism. We further improve the attention mechanism in an efficient and cost-effective pyramid structure. With exploiting heterogeneous-scale spatial attention, the MA module can explicitly guide the model to learn more discriminative features.
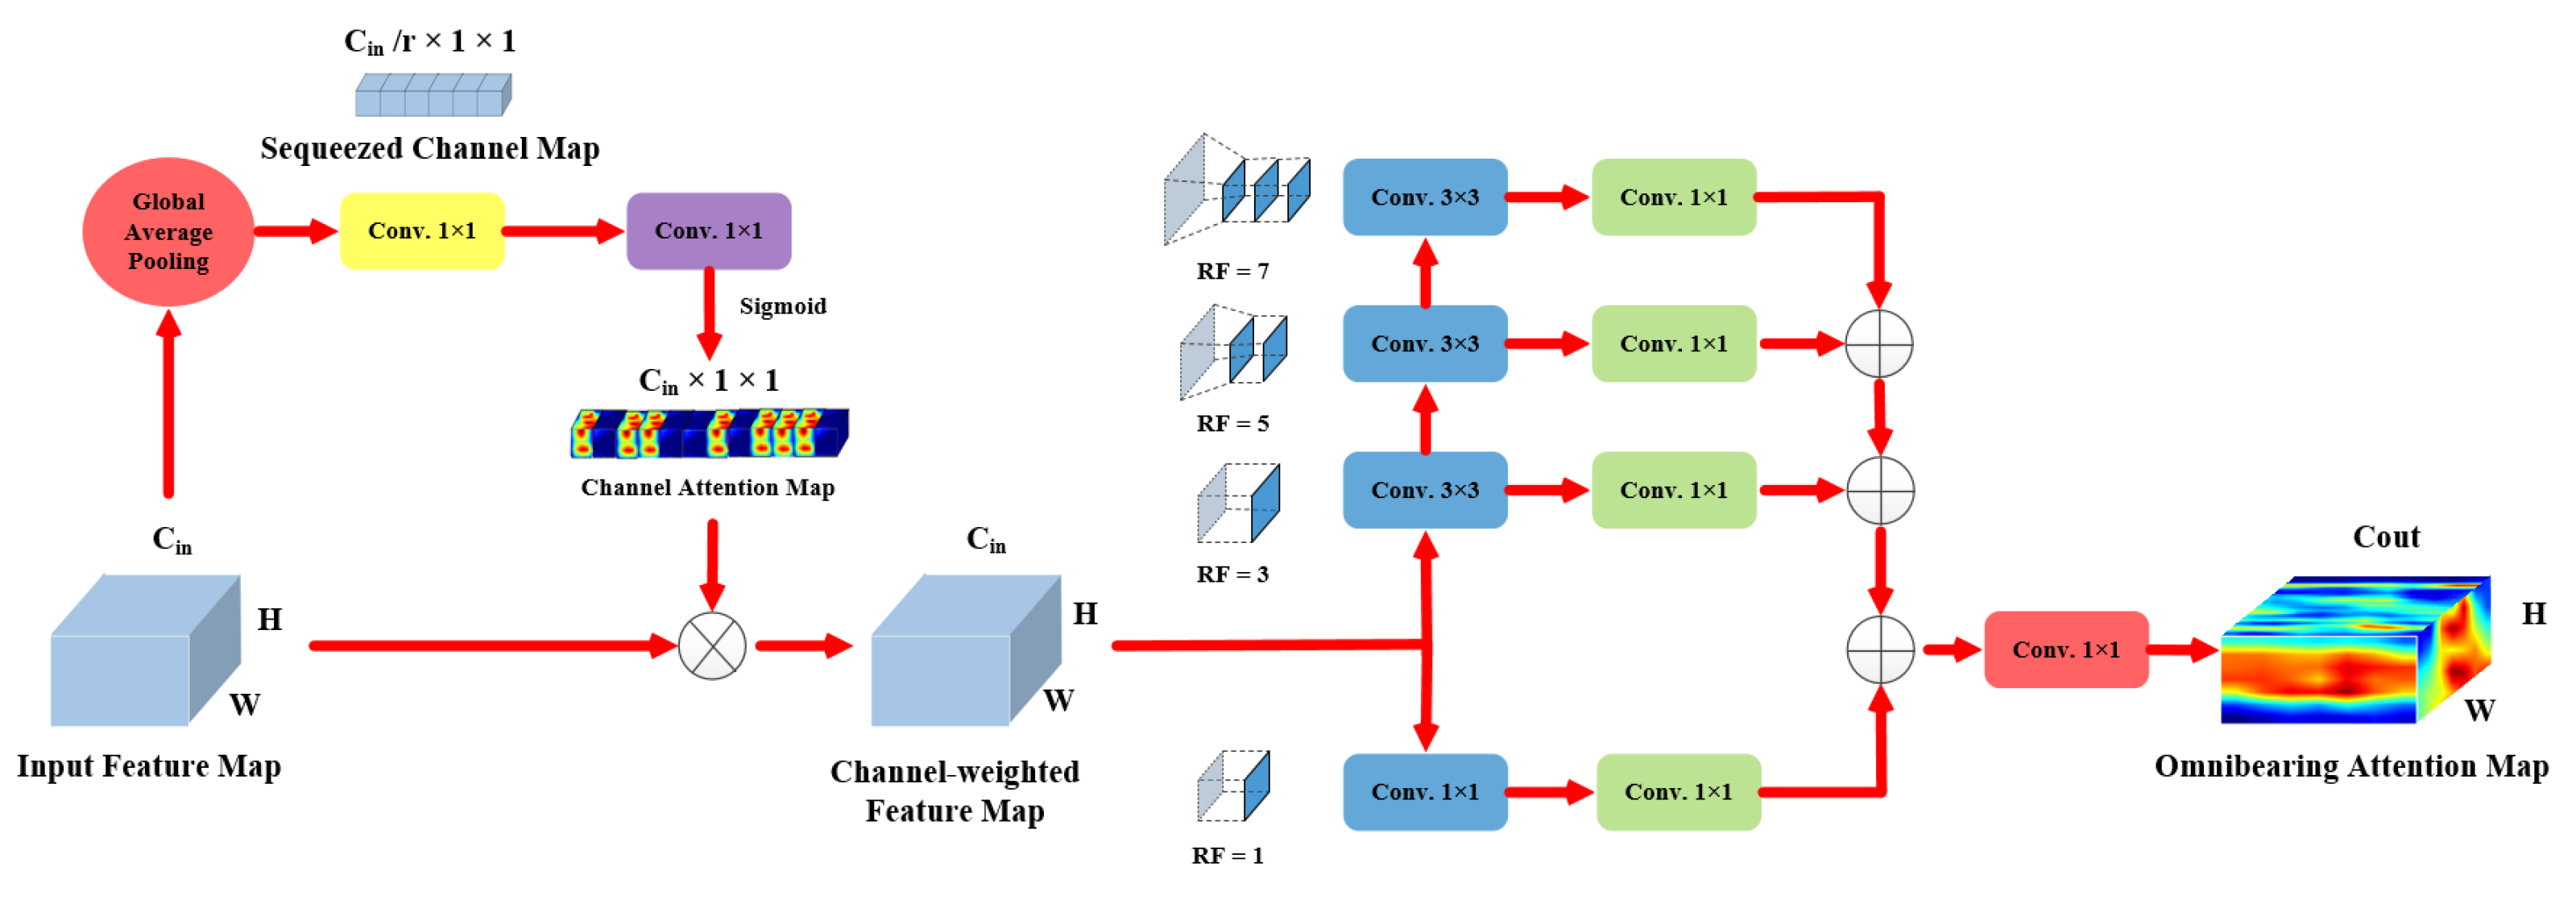
Once the embedded structure is proposed, we then elaborate the detailed scheme of our proposed MA module. As shown in Figure 4, the MA module cascades channel and spatial attention in series. The serial concatenation employs the benefits of channel and spatial attention information, and more importantly, provides a crucial complementary effect, since spatial pyramid attention maps are extracted from the previous channel-weighted feature.

3.4.2. Channel Attention

Inspired by Squeeze and Excitation networks (SE block) [36], we firstly apply channel attention to exploit intrinsic interaction among channels, laying a solid foundation for later pyramid spatial attention. The channel-weighted feature, F c , strengthened by channel attention can be written as:
F c = σ { ReLU [ W 2 × ReLU ( W 1 × GAP ( F i n ) ) ] } F i n
where F i n is the input feature. W 1 R C i n r × C i n ( C i n 2 r parameters) and W 2 R C i n × C i n r ( C i n 2 r parameters) represent the parameter matrix of 1 × 1 convolutional layers in sequence. Here, r (experimentally set to be 8 in our implementation) denotes the channel reduction rate. σ is the sigmoid function which normalizes the channel attention map within [ 0 , 1 ] .

3.4.3. Spatial Attention

As for the spatial attention part, multi-receptive-field streams are proposed to mine multi-scale spatial attention information. More specifically, there are four branches with receptive fields of 1 × 1 , 3 × 3 , 5 × 5 , and 7 × 7 in the spatial attention part. Following the successful practices of Simonyan et al. [37], who argue that the stack of two 3 × 3 convolution layers has an equivalent receptive field of a 5 × 5 convolution layer, we employ this strategy in our pyramid spatial attention to reduce computation overheads as well as parameter size, e.g., a 7 × 7 convolution filter is replaced by a stack of three convolution layers in series. In this way, the MA module is efficient and cost-effective with the pyramid structure introduced.
To provide a more intuitive insight into its advantage of light weight, we intend to compare the pyramid structure with a parallel structure. Assume that there are also four multi-receptive-field branches in a parallel structure. The space complexity (number of parameters) of the parallel structure is calculated as follows:
( 1 2 + 3 2 + 5 2 + 7 2 ) · C i n / r = 84 · C i n / r .
The C i n denotes the input channel number and r is the channel reduction rate which has an impact on model inference time. The space complexity of the pyramid structure is calculated as follows:
( 1 2 · C i n / r ) + 3 2 · ( C i n / r + C i n / 2 r + C i n / 3 r ) = 17.5 · C i n / r .
Compared with the parallel structure, the pyramid structure obtains a noticeable reduction in parameters of 17.5 · C i n / r 84 · C i n / r = 20.8 % . Obviously, the MA module applied with the pyramid structure has lower complexity, being computationally lightweight.
In the following, the scheme of the MA module is illustrated in more detail. Firstly, in the branch of 1 × 1 receptive field size, the channel-weighted feature map of H × W × C i n is convoluted by a 1 × 1 convolutional layer which reduces the number of channels from C i n to C i n r (the value of r is experimentally assigned as 8 for optimal results). Note that the channel number, height, and width of the input channel-weighted feature are denoted by C i n , H, and W, respectively. In terms of the other three streams, three convolutional layers with kernel size of 3 × 3 are utilized to construct the streams of the 3 × 3 , 5 × 5 , 7 × 7 receptive fields. More specifically, the detailed parameters of three convolutional layers can be denoted as { C i n r , 3 × 3 , 1 , 1 } , { C i n 2 r , 3 × 3 , 1 , 1 } , and { C i n 3 r , 3 × 3 , 1 , 1 } . Note that the four items in the brackets are filter number, filter size, stride, and padding, respectively.
Afterward, in every stream, a convolutional layer of { C o u t , 1 × 1 , 1 , 0 } is introduced for the expansion in channel dimension. In this way, the channel size of the attention map can be matched with that of the output feature from the specific parallel residual block. Moreover, four multi-receptive-field streams are incorporated to retain more attention information. Furthermore, another 1 × 1 convolutional layer of { C o u t , 1 × 1 , 1 , 0 } is adopted in the main stream so as to achieve a better integration among attention information of different spatial scales. At the end, the extracted attention map is normalized in the range of [ 0 , 1 ] with a sigmoid function.
Remark 1.
Res2Net is a new multi-scale backbone architecture proposed by Gao et al. [38] There are significant distinctions between the spatial part and Res2Net [38] module which can be summarized as the following three aspects: (1) Design purpose: the MA module is aims to exploit multi-scale attention information whereas the Res2Net module utilizes the strategy of multi-scale to learn omni-scale features. More generally, the former is equivalent to the extraction of a comprehensive spatial attention map with multi-receptive-field streams whilst the latter can be interpreted as fine-grained feature extraction or learning multi-scale representations. (2) Concatenation arrangement: MA modules are placed in parallel with residual blocks retrieved from ResNet-50. In contrast, the Res2Net module is an alternative architecture for residual blocks with learning of stronger multi-scale features. In each revised residual block, the original 3 × 3 convolution layer is replaced with smaller groups of convolutional filters. (3) Specific design: The MA module exploits heterogeneous-scale spatial attention in an efficient and cost-effective pyramid structure. The Res2Net module intends to split the feature maps into several feature map subsets which are further processed in a multi-scale fashion with four branches. Additionally, in the MA module, channel reduction is introduced in every receptive field branch to reduce module parameters and computational overheads.

3.5. Classification Module

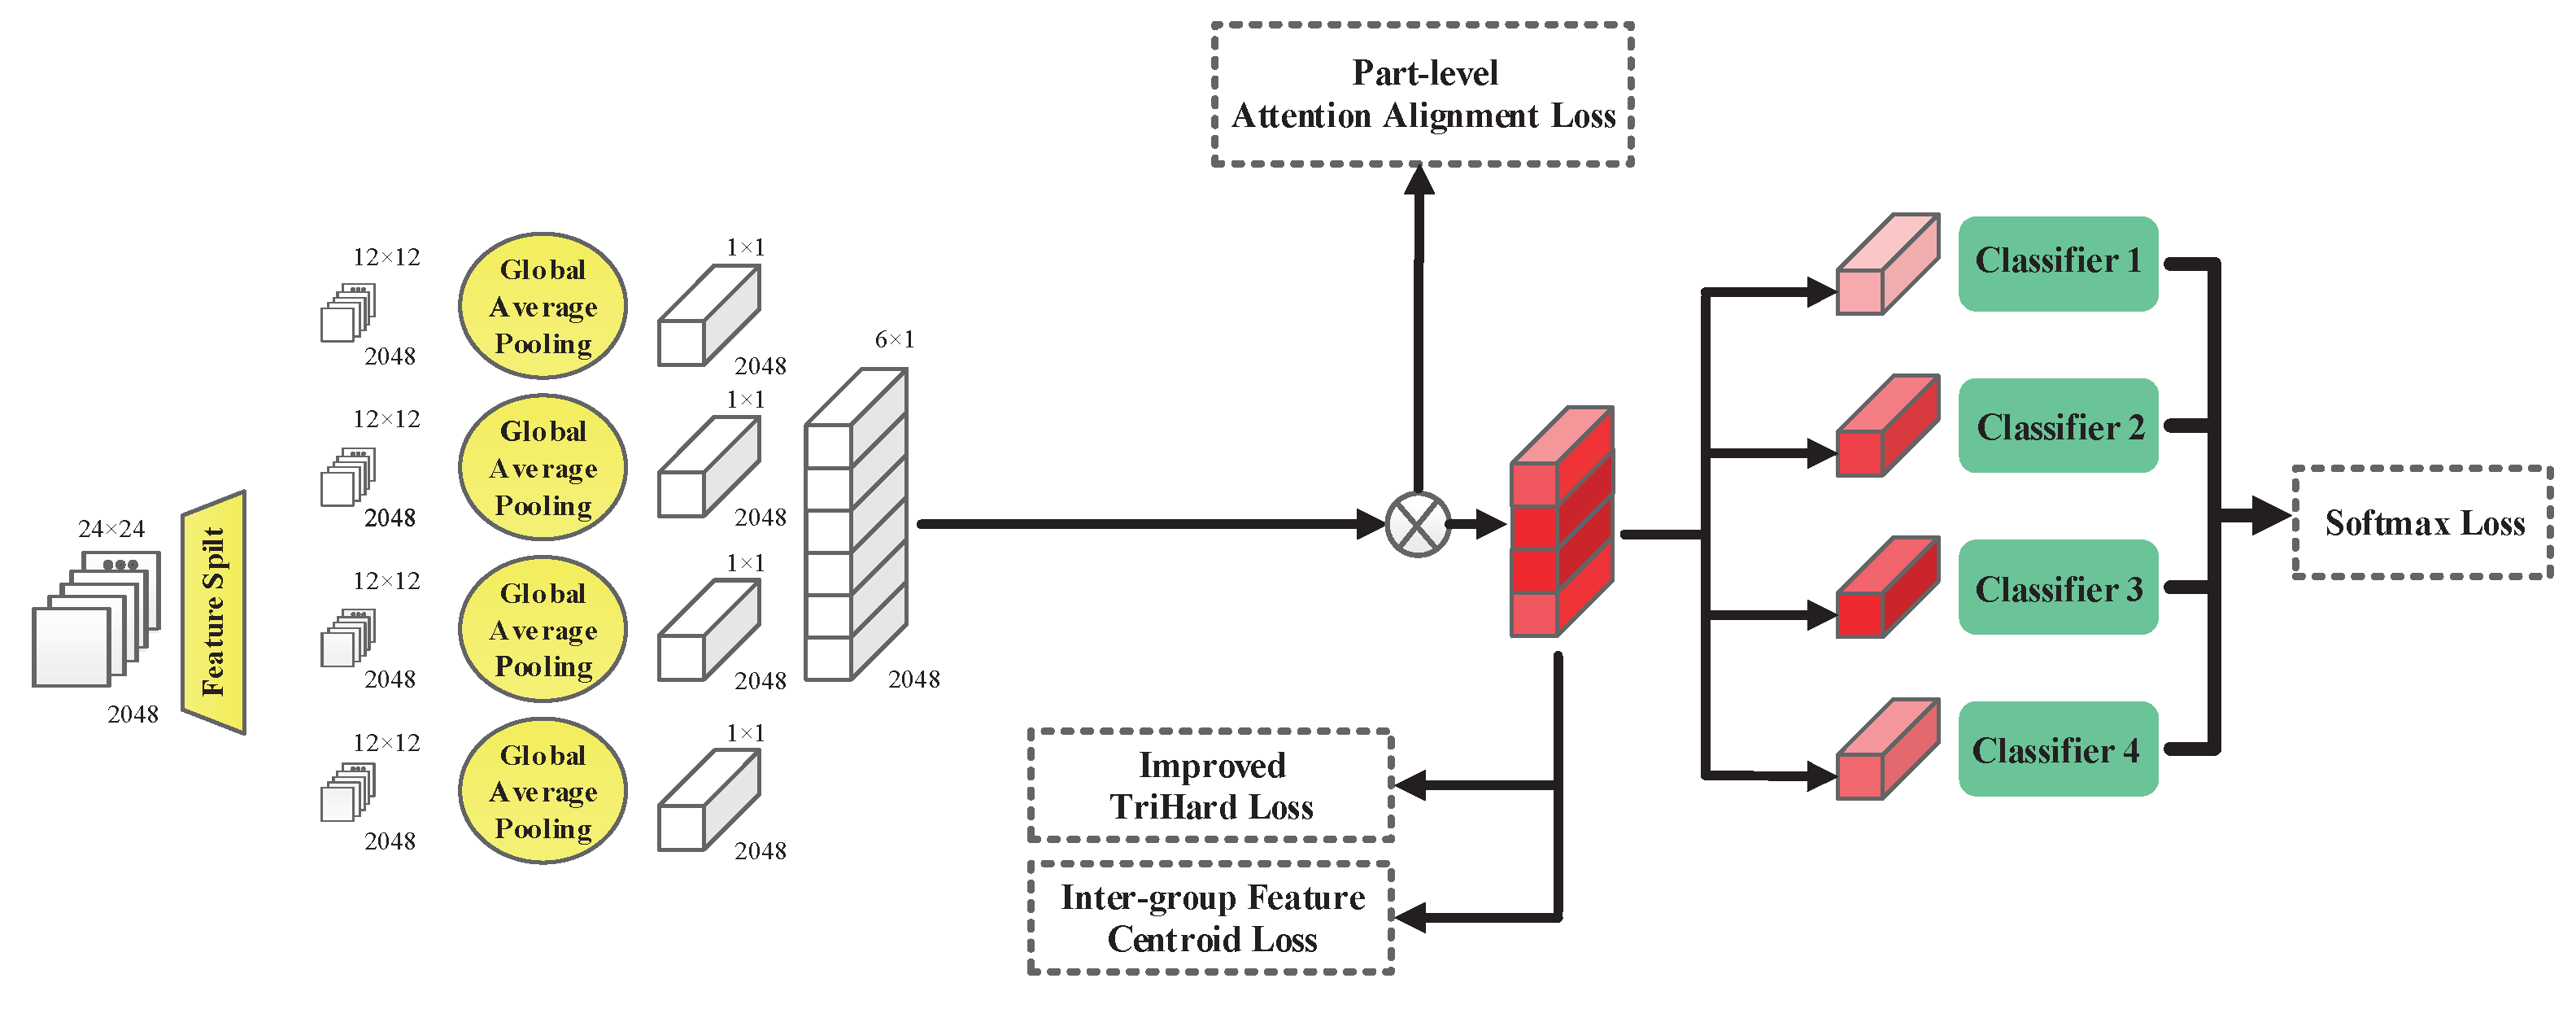
In every mini-batch of the training stage, P classes (vehicle identities) and K images of each identity are randomly sampled. Given a set of images I j j = 1 N = I 1 , I 2 , , I j , , I N encompassing N = P × K images in a training batch, we obtain N p part feature maps for each image I j . As shown in Figure 5, each part feature map will be further fed into a classifier which is implemented with a Fully Connected (FC) layer and a sequential softmax layer. Each identity classifier predicts the identity of the input image and is supervised by softmax loss:
L Softmax = 1 N z = 1 N p j = 1 N log e y j ( z ) l = 1 N l e y l ( z )
where N l denotes the number of vehicle labels in each training batch, z is the index of extracted features in N p part-based branches, and y j ( z ) represents the prediction result of the j-th input image I j in the z-th part branch.
Moreover, we utilize the improved Triplet Loss with Hard Mining (TriHard) which places extra constraints on intra-class distance. In particular, an extra constraint is designed to further improve the effect of TriHard loss. Formally, for a specific feature anchor F a i belonging to vehicle i, the positive point F p i is expected to be pulled closer compared with the arbitrary negative point F p j of the j identity. In particular, in every training batch, the hardest positive and negative samples will be selected for supervision. The improved TriHard loss can be defined as:
L TriHard = 1 P K i = 1 P a = 1 K max p = 1 K D e F a i , F p i + [ m + max p = 1 K D e F a i , F p i min j = 1 P n = 1 K j i D e F a i , F n j ] +
where m is margin (experimentally set to be 0.3 in our implementation), i = 1 P a = 1 K stand for all the anchor images of batch. [ f ] + represents the function of max ( f , 0 ) and D e ( · ) denotes the Euclidean distance.
Furthermore, we propose a straightforward Inter-group Feature Centroid Loss (IFCL) function to further maximize the inter-group distance in a centroid-based fashion. We firstly calculate the centroid of the output feature maps, C i , within group i as:
C i = 1 K i = 1 K F t i ,
where K means the total number of images in group i, and F t i denotes the feature map of the t-th image in group i,
Then, for P groups in a training batch, the IFCL function can be written as:
L IFC = 1 K 2 i = 1 P j = i + 1 P S ( C i , C j ) + 1 2 .
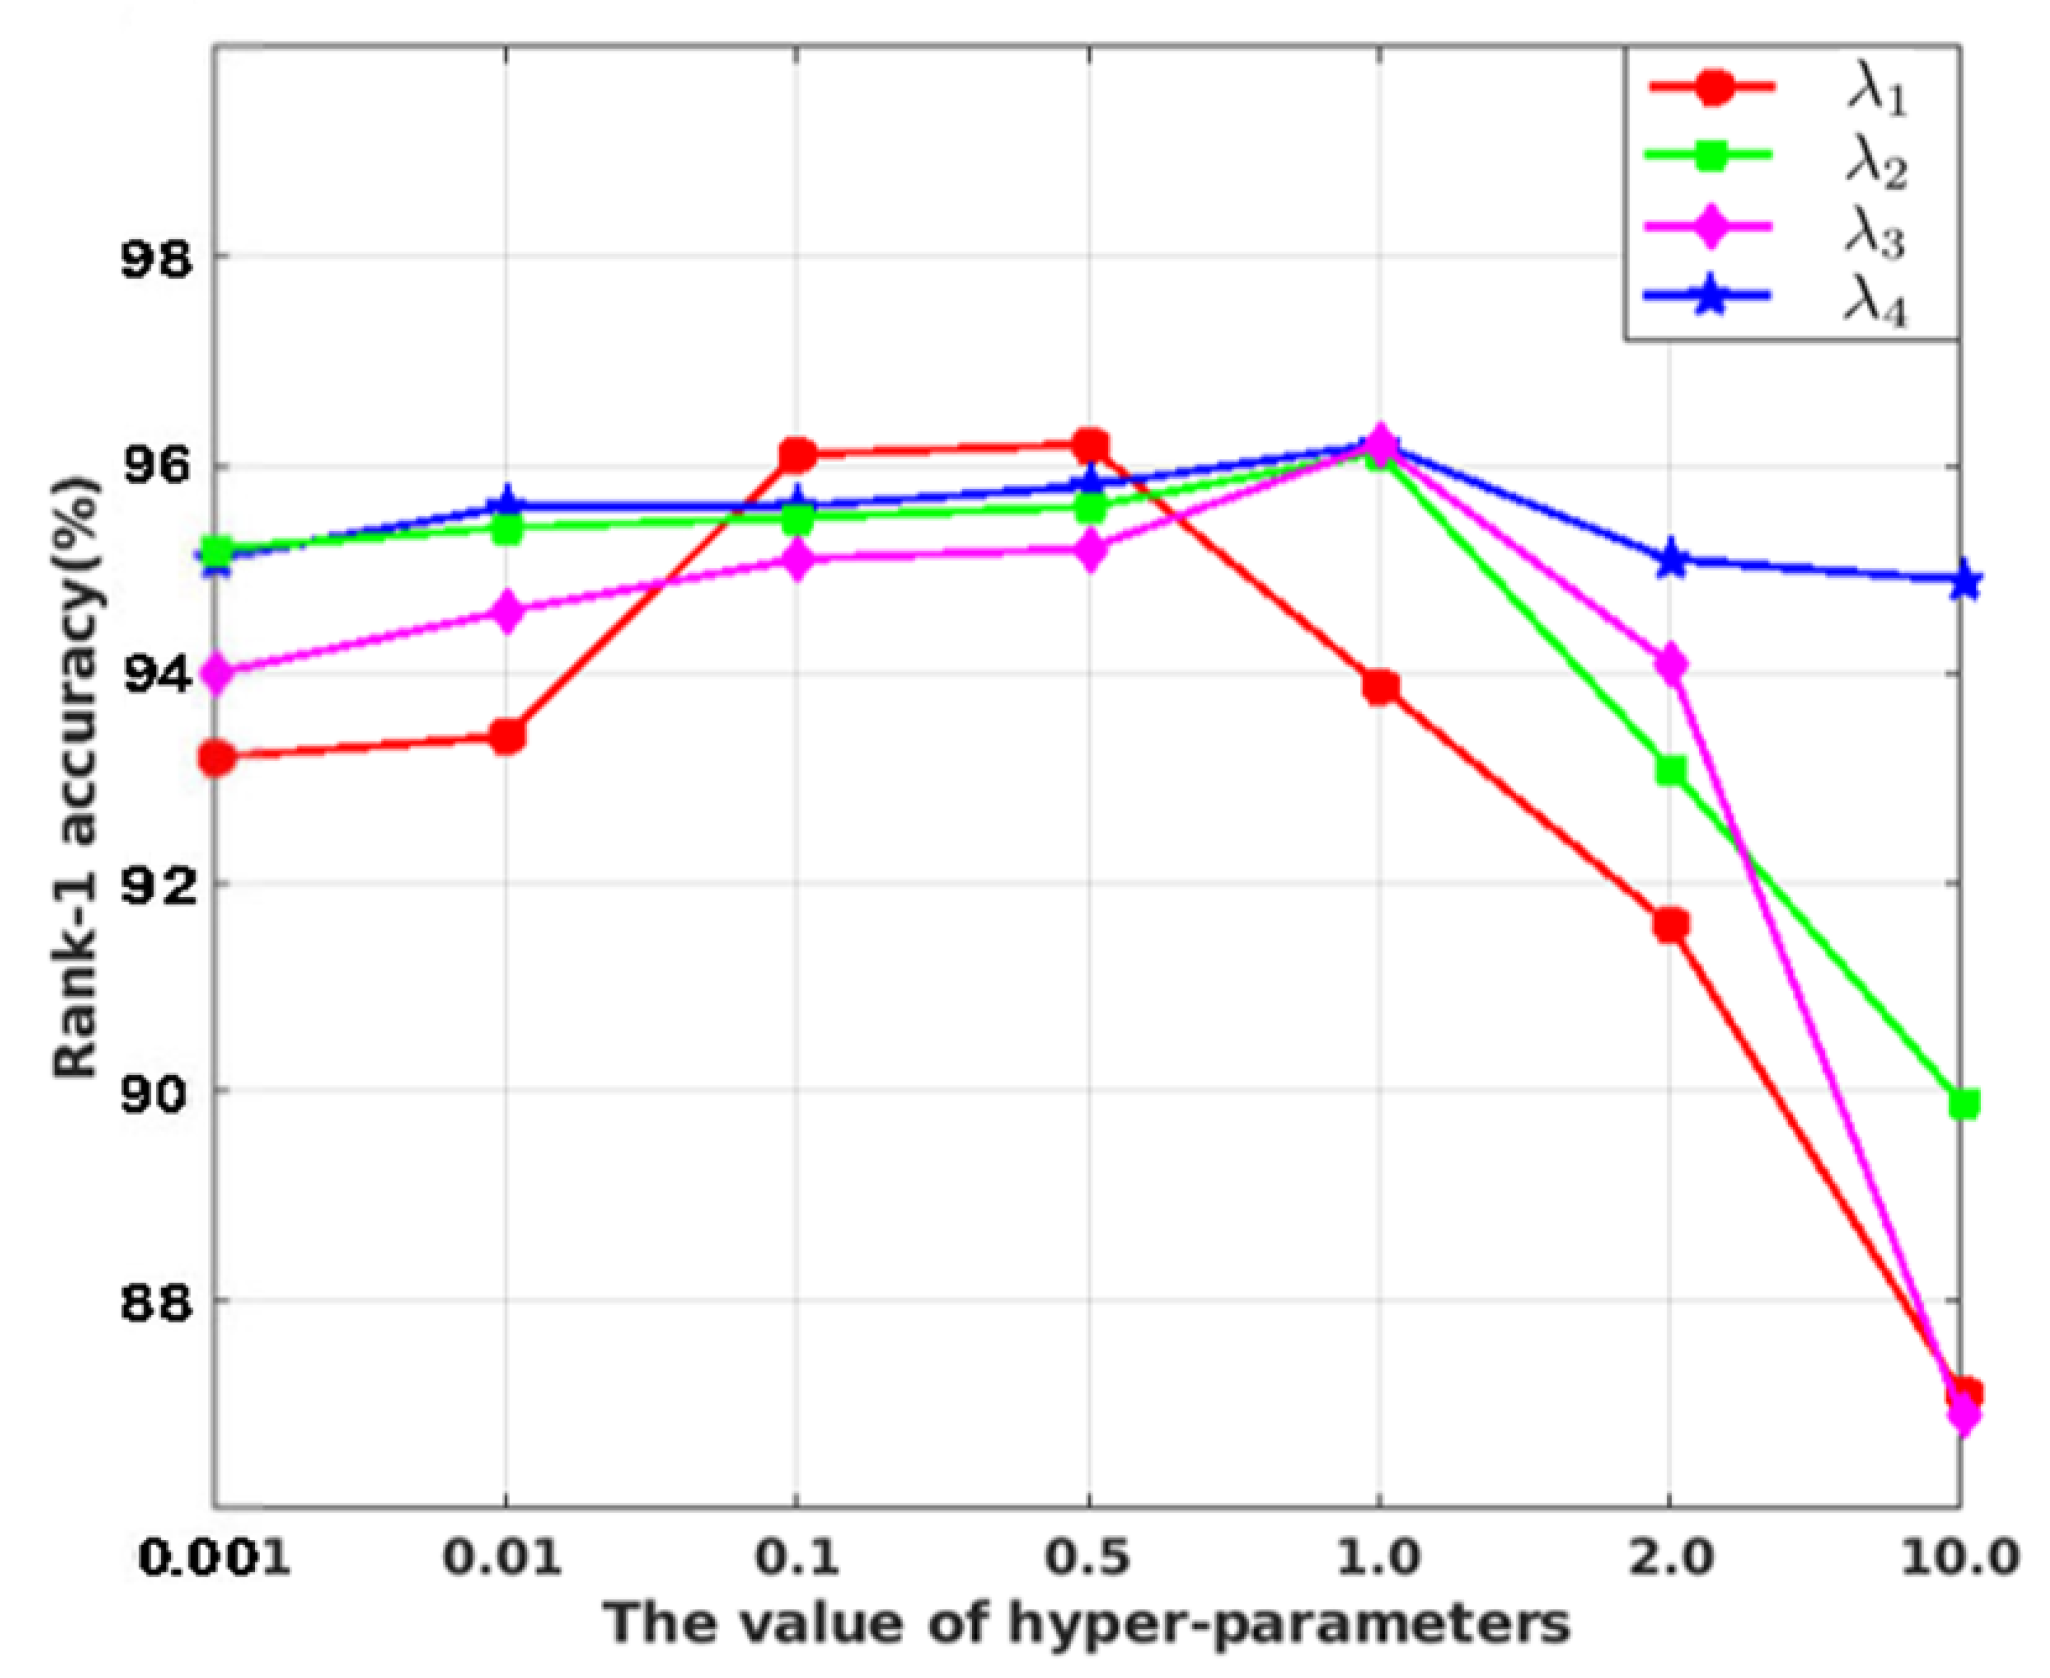
With the combination of the aforementioned supervised losses, the final objective function in APANet can be given as:
L = L Softmax + λ 1 · POL + λ 2 · PAAL + λ 3 · L TriHard + λ 4 · L IFC
where λ i ( i = 1 , 2 , 3 , 4 ) are hyper-parameters for different loss items. When hyper-parameters are all set to the optimal value, the final objective function is capable of learning discriminative and robust features.
Altogether, these five loss items are mutually integrated with one another. Softmax loss concentrates on the classification of vehicles and POL aims to learn diverse part-level representations by virtue of orthogonal regulations. Moreover, the PAAL loss item is beneficial to perform attention consistency in a part-level fashion. When it comes to the optimization of embedding space, the improved TriHard loss and the proposed IFCL complement each other. More specifically, the former concentrates on minimizing intra-group distance whilst the latter intends to maximize inter-group distance based on centroid features of different identities in a batch.

4. Experiments

4.1. Datasets and Settings

With the purpose of justifying the superiority of APANet, we conduct extensive experiments on two popular vehicle Re-ID datasets. One is a large-scale benchmark dataset for vehicle Re-ID in the real-world urban surveillance scenario, named VeRi-776 [3,14,15]. Another dataset is called VERI-Wild [16] which is to promote the research of vehicle Re-ID in the wild. Table 1 presents a comprehensive introduction to them. The vehicle pictures are taken by non-overlapping surveillance cameras and each picture is denoted by a specific vehicle label. In the following experiment results, the rank-1 accuracy and mean average precision (mAP) will be reported.

4.2. Implementation Details

4.2.1. Baseline Network

For a fair comparison, the same backbone network (i.e., ResNet-50) is adopted in a Baseline (BL) model. Different from APANet, in the BL model, there are also six branches each independently supervised by a softmax loss. In addition, MA modules are removed, and POL, PAAL, IFCL, and the improved TriHard losses are no longer utilized as the supervised loss function in the BL model.

4.2.2. Training Settings

APANet is a convolutional neural network implemented by the Pytorch Deep learning framework. Specific software versions include Torch 1.3.0, CUDNN 7.6.1, and CUDA 10.2. The original input pictures are all resized to 384 × 384 . The data augmentation strategies of random erasing [39] and horizontal flipping are utilized to avoid overfitting. The batch size in the training stage is 30 where P = 10 and K = 3 . In the improved TriHard loss, we assign the value of margin m = 0.3 . Considering the results from extensive experiments in parameter analysis, the hyper-parameters in the final objective function are set to λ 1 = 0.2 and λ 2 = λ 3 = λ 4 = 1 , accordingly. More parameter analyses are given in Section 4.6. The optimizer of Stochastic Gradient Descent (SGD) with momentum is utilized for model optimization. The total training epochs are 120, 150 for VeRi-776 [3], VERI-Wild [16], respectively.

4.2.3. Testing Settings

As aforementioned, there are N p part features, which indicate that 2048 × N p dimensional combined features are utilized for the classification in APANet. The similarity score between two arbitrary pictures is calculated by the cosine distance. The testing batch size is set to 60 and the re-ranking strategy is not utilized in the testing process. Here, we only report the experiment results under the single-shot and single-query mode.

4.3. Ablation Study

To reveal the impact of each component on the final performance, the comparative experiments are meticulously conducted, as summarized in Table 2.
According to the results in the first six rows in Table 2 on VeRi-776 [3], one can clearly observe that every component brings a improvement in performance alone. Obviously, the MA module is undoubtedly the biggest contributor to the performance gains of 4.2% and 10.4% for rank-1 accuracy and mAP, which convincingly verifies its effectiveness. The second biggest contributor is POL which brings a noticeable improvement in performance of 1.9% and 2.9% for rank-1 accuracy and mAP, respectively.
Furthermore, we compare these two contributors in the next four rows. As the results in 10th row indicate, MA+POL gives a further performance boost of 5.2% and 1.6% for rank-1 accuracy and mAP. Based on the discriminative features exploited by the MA module, POL is capable of facilitating the model to learn diverse part-level representations via an orthogonal penalty. Additionally, the comparisons among the 1st, 2nd, 3rd, and 7th row demonstrate the complementary effect between the improved TriHard loss function and IFCL, and the combination of them gives the performance gains of 13.3% and 1.4% for mAP and rank-1 accuracy. in addition, as shown in the 6th and 11th row, PAAL has also proven to be beneficial to model performance.
Clearly, there is a progressive improvement in recognition performance from BL to APANet. Taking the above results and analysis into consideration, we can safely draw the conclusion that our proposed modules are all effective and using all components (i.e., APANet) gains the best performance.

4.4. Qualitative Analysis

We further carry out more detailed comparative experiments for qualitative evaluation. For fair comparisons, in all comparative experiments, when we observe the effect of a specific component, other components in APANet are all fixed, with the same implementation setting for training/testing.

4.4.1. Configuration Analysis of MA Modules

To determine the optimal placement of MA modules, exhaustive comparative experiments of variant placements are conducted. Specifically, MA modules are placed in different positions in the backbone network but with the same embedded structure. From Table 3, one can obviously observe that it brings little improvement over the baseline setting when the MA module is placed in parallel with Conv.B2, and the performance even became worse if the MA module is in Conv.B1. On the contrary, a noticeable performance boost is shown when MA modules are placed in parallel with Conv.B3 and Conv.B4. As the results indicate, MA modules are more suitable for placing with Conv.B3 and Conv.B4. Moreover, to find the optimal number of MA modules, we further conduct the quantitative experiments of MA modules, which are given in Section 4.6.

4.4.2. Effectiveness of the Improved Triplet Loss and IFCL

To clearly demonstrate the efficacy of IFCL and the improved triplet loss, in particular, we randomly choose 24 samples from the test set of VeRi-776 [3] and utilize them to visualize the feature distribution with t-SNE. As presented in Figure 6a, there is large overlap between the intra- and inter-class distance distributions. By comparing Figure 6a,b, we can clearly learn that the improved TriHard loss can minimize the intra-group distance and maximize inter-group distance effectively. Moreover, as presented in Figure 6b,c, IFCL manages to pull closer the images of same identity in feature representations. Obviously, the visualization results justify the effectiveness of both the improved TriHard loss and IFCL.
In addition, we also conduct a comparative experiment between the original TriHard loss and the improved TriHard loss. Experimental results are shown in Table 4 from which we obviously learn that the improved Trihard loss is superior to the original one. In conclusion, the improved Trihard loss function places extra constraints on the intra-class distance and gains better experiment results.

4.5. Visualization Results of Attention Mechanism

As shown in Figure 7, by virtue of the proposed MA module, APANet learns more discriminative and robust attention maps which focus more on salient vehicle-related regions and suppress the background interferences. That further confirms that the learned features in APANet show high robustness to background clusters.
In order to capture more comprehensive and diverse visual cues for Re-ID, we expect that different parts obtained from APANet can activate different discriminative image regions. As aforementioned in Section 3.5, there are N p local feature maps utilized for classification. Correspondingly, as clearly shown in Figure 8, we further visualize all attention maps obtained from N p part feature maps. Based on the results, we observe that different local features are able to place unequal emphasis on different vehicle part regions. Additionally, these features are robust to the background clutter. To sum up, POL has been proven to be effective in learning diverse and part-orthogonal representations.

4.6. Parameter Analysis

To reveal the specific impact of different parameters, we carry out extensive comparative experiments of APANet on the VeRi-776 [3] dataset as quantitative analysis.

4.6.1. Effect of the Number of MA Modules

According to the results in Section 4.4.1, we further carry out quantitative experiments of the number of MA modules. As shown in Table 5, with the increase in the number of MA modules, the performance of the model gradually improves at first and reaches the peak when six MA modules are embedded in APANet. The results are quite reasonable and understandable. If too few MA modules are embedded in APANet, the learned feature representations tend to remain coarse-grained, since the discrimination of features is still not fully enhanced. On the contrary, when excessive MA modules are adopted in APANet, the performance is also degraded with a noticeable drop, and it also involves an unnecessary cost of computing and extra parameters. Indeed, the manipulation of the number of MA modules ought to balance the trade-off between the efficacy and computational overheads. From Table 5, it can be easily learned that the configuration of six MA modules is most recommended and cost-effective. Hence, there are six MA modules embedded in our proposed APANet.

4.6.2. Effect of the Number of Part Features

As presented in Table 6, we vary N p as: 1, 2 (Horizontal, Vertical), 4, 9. Intuitively, N p determines the granularity of the part features. When N p = 1 , the learned feature reduces to the global descriptor. As N p increases, accuracy does not always increase with N p . Obviously, when N p = 9 , performance drops dramatically. This can be mainly attributed to the fact that some of the refined parts are very similar to others and some may even collapse to an empty part. In fact, the number of discriminative visual cues of vehicle image is finite. Hence, a very large N p tends to compromise the discriminative ability of the part features. According to Table 6, the APANet achieves the best mAP and rank-1 performance when N p reaches 4 on VeRi-776 [3]. Consequently, we use N p = 4 parts in our implementation.

4.6.3. Effect of Hyper-Parameters in Loss Function

Here, we conduct comparative experiments to evaluate the impact of the λ i ( i = 1 , 2 , 3 , 4 ) parameters that control the balance between the five loss items in Equation (14). By default, when we evaluate the effect of one selected parameter, the values of other parameters are fixed. The quantitative results are reported in Figure 9 where we only report rank-1 accuracy for simplicity.
In the first place, for λ 1 which represents the weight of POL loss item, we observe that a low value tends to degrade part diversity learning with a slight performance drop whilst a large value (i.e., λ 1 > 1 ) seems to have a profoundly negative impact on performance. Indeed, the softmax loss function plays a crucial role in multi-class classification which will be severely affected if the value of λ 1 is too large. Likewise, the high value of λ i ( i = 2 , 3 , 4 ) also induces a dramatic drop in performance. Moreover, it is clearly shown that, on the whole, λ i ( i = 2 , 3 , 4 ) are not very sensitive to the choice of parameters in the range [ 0.001 , 1.0 ] . It can be easily learned from the trend of the change in Figure 9 that the performance reaches the peak when λ i ( i = 2 , 3 , 4 ) = 1.0 . Consequently, from Figure 9, we observe that when λ 1 = 0.2 and λ 2 = λ 3 = λ 4 = 1.0 , APANet reaches the peak performance. With an optimal value of λ i ( i = 1 , 2 , 3 , 4 ) , the final objective function manages to completely realize the potential of all five loss items, with learning more discriminative, diverse, and robust representations.

4.7. Comparison with State-of-the-Art Methods

This section presents the comparison results between the proposed APANet and state-of-the-art methods on two mainstream vehicle Re-ID datasets. The comparison methods are divided into three categories: global feature-based methods, part feature-based methods, and attention mechanism-based methods, which are abbreviated as GF-based, PF-based, and AM-based methods, respectively. The GF-based methods contain a Hierarchical Spatial Structural Graph Convolutional Network (HSS-GCN [40]), Dual Domain Multi-task (DDM [41]), Embedding Adversarial Learning Network (EALN [42]), Multi-label-based Similarity Learning (MLSL [43]), Group–Group Loss-based Global–Regional Feature Learning (GGL [44]), Support Neighbor (SN [45]) network, Uncertainty-aware Multi-shot Teacher–Student (UMTS [46]), Context-aware Graph Convolution Network (CAGCN [47]), Viewpoint-aware Re-ID (VARID [48]), and Vehicle–Orientation–Camera (VOC-ReID [49]). The PF-based methods contain Part-regularized Near-duplicate (PRN [17]), Parsing-guided Cross-part Reasoning Network (PCRNet [4]), Distance-based Global and Partial Multi-regional Feature Learning (DGPM [50]), Parsing-based View-aware Embedding Network (PVEN [22]), and Three-branch Embedding Network (TBE-Net [51]). The AM-based methods include: Viewpoint-aware Attentive Multi-view Inference (VAMI [52]), Structured Graph Attention (SGAT [5]) network, Semantics-guided Part Attention Network (SPAN [12]), Multi-view Attention Network (MVAN [7]), Part-guided Attention Network (PGAN [10]), and Self-supervised Attention for Vehicle Re-identification (SAVER [6]).

4.7.1. Evaluations on Veri-776 Dataset

We compare our proposed APANet with current existing methods in Section 4.2.3 and settings in Table 7. Experimental results show that APANet outperforms all of those compared methods with the 96.4% and 79.8% accuracy in rank-1 and mAP on the VeRi-776 [3] dataset. We observe that the results of APANet are better than the second best model by a margin of 0.1% in mAP on VeRi-776 [3]. When compared with PF-based approaches, the APANet surpasses all other models with a noticeable lead of 0.2% and 0.3% in rank-1 and mAP. The performance results convincingly validate the efficacy of our approach and further indicate that MA modules are capable of exploiting heterogeneous-scale pyramid attention information, therefore learning discriminative features.

4.7.2. Evaluations on VERI-Wild Dataset

We further evaluate APANet on VERI-Wild [16] which is a large and popular Re-ID dataset. The compared methods contain Group-sensitive Triplet Embedding (GSTE [53]), Feature Distance Adversarial Network (FDA-Net [16]), MLSL [43], Adaptive Attention Model for Vehicle Re-identification (AAVER [13]), Triplet Embedding [54], UMTS [46], and VARID [48]. Clearly, from Table 8, it can be easily learned that APANet achieves quite competitive performance on VERI-Wild [16], advancing beyond most state-of-the-art methods with a lead by a margin of 3.2% and 4.1% in terms of rank-1 and mAP. The results on this more challenging and complex dataset further justify the effectiveness of our proposed APANet.

4.7.3. Discussion

In the following, APANet will be compared with AM-based, PF-based, and GF-based methods, so as to to verify its superiority.
In the first place, we compare APANet with the other existing models on two vehicle Re-ID datasets. According to the results in Table 7, we observe that the worst results are obtained by the Hierarchical Spatial Structural Graph Convolutional Network (HSS-GCN [40]), and for the mAP the best performances are achieved by our proposed APANet. APANet outperforms all other GF-based methods. For example, on the VeRi-776 [3] dataset, APANet beat Vehicle Orientation Camera Network (VOC-ReID [49]), the second best, by 0.1% in terms of rank-1 accuracy and 0.1% in terms of mAP. The fact that APANet obtains such results can be mainly summarized as these two aspects: (1) With the help of the complementary effect between channel attention and pyramid spatial attention, the MA module succeeds in helping the model with learning more discriminative representations. (2) Most of these GF-based modules neither solve the problem of cross-view inconsistency nor allocate appropriate attention towards part features. Instead, we propose a part-level attention loss to allocate more attention towards the most discriminative part. In addition, PAAL is further utilized to perform attention alignment in a part-level manner with view-invariant features. As for the VARID [48], it can achieve the best performance on rank-5 accuracy, because VARID utilizes the unsupervised clustering view labels. The view labels incorporate view information into deep metric learning to tackle the viewpoint variation problem, but the online unsupervised clustering requires extra calculation during the training process. However the proposed APANet still exceeds this method in rank-1 and mAP results.
Moreover, when compared with AM-based methods, APANet still achieves leading performance on the VeRi-776 [3] dataset. We also notice that some AM-based methods achieve competitive performance by integrating vehicle semantic parsing information, which is generated by SPAN [12]. However, an extra vehicle semantic parsing model not only increases the computation overheads and model parameter size but also needs to be pre-trained with other annotations. In addition, the underlying gap between vehicle parsing/pose estimation and Re-ID datasets remains a problem when directly adopting these parsing/pose methods in an off-the-shelf manner. In fact, their performances are considerably vulnerable to the accuracy of the extra pre-trained model. Notably, Khorramshahi et al. [6] utilized a self-supervised cascaded clustering method to generate the pseudo-labels of vehicle parts and achieve the parsing alignment. Additionally, PGAN [10] considers the relations between different parts and outperforms our method on VeRi-776 [3] by 0.1% in terms of rank-1. Different from them, APANet aims to improve part feature representation from a new perspective. In APANet, POL is meticulously proposed to pursue more comprehensive and diverse part-level features by means of decreasing correlations among parts.
In addition, we notice that APANet significantly outperforms most PF-based methods, encompassing the methods exploiting semantically aligned features [22], building a part-neighboring graph [4], proposing an end-to-end three-branch network [51], calculating part-regularized local constraints [17], and other methods [50]. These comparative results demonstrate the fact that APANet is entirely effective and superior, advancing the existing PF-based methods.
Our future work will focus on applying our method to other scenarios and different kinds of Re-ID tasks, including: (1) Validating the proposed APAnet based on the ResNet-50 backbone implementation on Unmanned Aerial Vehicle (UAV) Re-ID datasets [55] and tunnel scene vehicle Re-ID [56] tasks. (2) Improving the proposed attention mechanism in order to avoid the effects of occlusion situations on cross-view Re-ID tasks, e.g., geographic target localization and building Re-ID [57].

5. Conclusions

In this paper, we propose a novel Attentive Part-based Alignment Network (APANet) which fulfills our purpose of obtaining discriminative, diverse, and robust part features. We firstly improve the part-level feature representations by a Part-level Orthogonality Loss (POL) which aims to learn diverse part-uncorrelated features via an orthogonal penalty. Moreover, in order to handle the problem of significant view variations, we propose a Part-level Attention Alignment Loss (PAAL) to achieve attention alignment in a part-level manner. Afterwards, we propose a powerful Multi-receptive-field Attention (MA) module to exploit comprehensive attention information to reduce the background clutter and obtain discriminative features. Furthermore, we improve the triplet loss by adding a special constraint for intra-group distance and propose a novel Inter-group Feature Centroid Loss (IFCL) to reduce inter-group distance, improving feature representation from the perspective of optimizing distance. The detailed ablation analysis and exhaustive comparative experiments convincingly validate the effectiveness of APANet and its components. Although the APANet can achieve competitive performance, there are still some limitations. To be specific, the pyramid structure of APANet reduces 79.2% of the parameters compared to the common parallel structure, but the proposed APANet increases the model parameters compared with baseline. In addition, in order to obtain fine-gained part features, the time and computation complexity should be increased during the model inference phase.

Author Contributions

Conceptualization, Y.L. and H.H.; methodology, Y.L. and H.H.; software, Y.L.; validation, Y.L. and H.H.; formal analysis, Y.L. and H.H.; investigation, Y.L. and H.H.; resources, D.C.; data curation, Y.L.; writing—original draft preparation, Y.L.; writing—review and editing, H.H. and D.C.; visualization, Y.L.; supervision, H.H. and D.C.; project administration, H.H. and D.C.; funding acquisition, D.C. All authors have read and agreed to the published version of the manuscript.

Funding

This research was funded by the Science and Technology Program of Guangdong Province under Grant No. 2021B1101270007 and Grant No. 2019B010140002.

Conflicts of Interest

The authors declare no conflict of interest.

References

  1. Liu, H.; Tian, Y.; Yang, Y.; Pang, L.; Huang, T. Deep relative distance learning: Tell the difference between similar vehicles. In Proceedings of the IEEE Conference on Computer Vision and Pattern Recognition, Honolulu, HI, USA, 21–26 July 2016; pp. 2167–2175. [Google Scholar]
  2. Liu, X.; Ma, H.; Fu, H.; Zhou, M. Vehicle retrieval and trajectory inference in urban traffic surveillance scene. In Proceedings of the International Conference on Distributed Smart Cameras, Venice, Italy, 4–7 November 2014; pp. 1–6. [Google Scholar]
  3. Liu, X.; Liu, W.; Mei, T.; Ma, H. Provid: Progressive and multimodal vehicle reidentification for large-scale urban surveillance. IEEE Trans. Multimed. 2017, 20, 645–658. [Google Scholar] [CrossRef]
  4. Liu, X.; Liu, W.; Zheng, J.; Yan, C.; Mei, T. Beyond the parts: Learning multi-view cross-part correlation for vehicle re-identification. In Proceedings of the 28th ACM International Conference on Multimedia, Seattle, WA, USA, 12–16 October 2020; pp. 907–915. [Google Scholar]
  5. Zhu, Y.; Zha, Z.J.; Zhang, T.; Liu, J.; Luo, J. A structured graph attention network for vehicle re-identification. In Proceedings of the 28th ACM International Conference on Multimedia, Seattle, WA, USA, 12–16 October 2020; pp. 646–654. [Google Scholar]
  6. Khorramshahi, P.; Peri, N.; Chen, J.C.; Chellappa, R. The devil is in the details: Self-supervised attention for vehicle re-identification. In Proceedings of the European Conference on Computer Vision, Glasgow, UK, 23–28 August 2020; Springer: Berlin/Heidelberg, Germany, 2020; pp. 369–386. [Google Scholar]
  7. Teng, S.; Zhang, S.; Huang, Q.; Sebe, N. Multi-view spatial attention embedding for vehicle re-identification. IEEE Trans. Circuits Syst. Video Technol. 2020, 31, 816–827. [Google Scholar] [CrossRef]
  8. Li, M.; Huang, X.; Zhang, Z. Self-Supervised Geometric Features Discovery via Interpretable Attention for Vehicle Re-Identification and Beyond. In Proceedings of the IEEE/CVF International Conference on Computer Vision, Montreal, BC, Canada, 11–17 October 2021; pp. 194–204. [Google Scholar]
  9. Zheng, A.; Lin, X.; Dong, J.; Wang, W.; Tang, J.; Luo, B. Multi-scale attention vehicle re-identification. Neural Comput. Appl. 2020, 32, 17489–17503. [Google Scholar] [CrossRef]
  10. Zhang, X.; Zhang, R.; Cao, J.; Gong, D.; You, M.; Shen, C. Part-guided attention learning for vehicle instance retrieval. IEEE Trans. Intell. Transp. Syst. 2020, 23, 3048–3060. [Google Scholar] [CrossRef]
  11. Khorramshahi, P.; Peri, N.; Kumar, A.; Shah, A.; Chellappa, R. Attention Driven Vehicle Re-identification and Unsupervised Anomaly Detection for Traffic Understanding. In Proceedings of the CVPR Workshops, Long Beach, CA, USA, 15 November 2019; pp. 239–246. [Google Scholar]
  12. Chen, T.S.; Liu, C.T.; Wu, C.W.; Chien, S.Y. Orientation-aware vehicle re-identification with semantics-guided part attention network. In Proceedings of the European Conference on Computer Vision, Glasgow, UK, 23–28 August 2020; Springer: Berlin/Heidelberg, Germany, 2020; pp. 330–346. [Google Scholar]
  13. Khorramshahi, P.; Kumar, A.; Peri, N.; Rambhatla, S.S.; Chen, J.C.; Chellappa, R. A dual-path model with adaptive attention for vehicle re-identification. In Proceedings of the IEEE/CVF International Conference on Computer Vision, Seoul, Korea, 27–28 October 2019; pp. 6132–6141. [Google Scholar]
  14. Liu, X.; Liu, W.; Mei, T.; Ma, H. A deep learning-based approach to progressive vehicle re-identification for urban surveillance. In Proceedings of the European Conference on Computer Vision, Munich, Germany, 8–14 September 2016; Springer: Berlin/Heidelberg, Germany, 2016; pp. 869–884. [Google Scholar]
  15. Liu, X.; Liu, W.; Ma, H.; Fu, H. Large-scale vehicle re-identification in urban surveillance videos. In Proceedings of the 2016 IEEE International Conference on Multimedia and Expo (ICME), Seattle, WA, USA, 11–15 July 2016; IEEE: Piscataway, NJ, USA, 2016; pp. 1–6. [Google Scholar]
  16. Lou, Y.; Bai, Y.; Liu, J.; Wang, S.; Duan, L. Veri-wild: A large dataset and a new method for vehicle re-identification in the wild. In Proceedings of the IEEE/CVF Conference on Computer Vision and Pattern Recognition, Long Beach, CA, USA, 15–20 June 2019; pp. 3235–3243. [Google Scholar]
  17. He, B.; Li, J.; Zhao, Y.; Tian, Y. Part-regularized near-duplicate vehicle re-identification. In Proceedings of the IEEE/CVF Conference on Computer Vision and Pattern Recognition, Long Beach, CA, USA, 15–20 June 2019; pp. 3997–4005. [Google Scholar]
  18. Cheng, Y.; Zhang, C.; Gu, K.; Qi, L.; Gan, Z.; Zhang, W. Multi-scale deep feature fusion for vehicle re-identification. In Proceedings of the ICASSP 2020–2020 IEEE International Conference on Acoustics, Speech and Signal Processing (ICASSP), Barcelona, Spain, 4–8 May 2020; IEEE: Piscataway, NJ, USA, 2020; pp. 1928–1932. [Google Scholar]
  19. Wang, Y.; Gong, B.; Wei, Y.; Ma, R.; Wang, L. Video-based vehicle re-identification via channel decomposition saliency region network. Appl. Intell. 2022, 1–21. [Google Scholar] [CrossRef]
  20. Chen, T.S.; Lee, M.Y.; Liu, C.T.; Chien, S.Y. Aware channel-wise attentive network for vehicle re-identification. In Proceedings of the IEEE/CVF Conference on Computer Vision and Pattern Recognition Workshops, Seattle, WA, USA, 14–19 June 2020; pp. 574–575. [Google Scholar]
  21. Chen, Y.; Ma, B.; Chang, H. Part alignment network for vehicle re-identification. Neurocomputing 2020, 418, 114–125. [Google Scholar] [CrossRef]
  22. Meng, D.; Li, L.; Liu, X.; Li, Y.; Yang, S.; Zha, Z.J.; Gao, X.; Wang, S.; Huang, Q. Parsing-based view-aware embedding network for vehicle re-identification. In Proceedings of the IEEE/CVF Conference on Computer Vision and Pattern Recognition, Seattle, WA, USA, 14–19 June 2020; pp. 7103–7112. [Google Scholar]
  23. Deng, Y.; Xu, J.; Song, Y.; Zhang, C.; Chen, S.; Lai, J. An Improved Dynamic Alignment Method for Vehicle Re-Identification. In Proceedings of the 2019 IEEE International Conference on Robotics and Biomimetics (ROBIO), Dali, China, 6–8 December 2019; IEEE: Piscataway, NJ, USA, 2019; pp. 3059–3064. [Google Scholar]
  24. Zhou, T.; Li, J.; Wang, S.; Tao, R.; Shen, J. Matnet: Motion-attentive transition network for zero-shot video object segmentation. IEEE Trans. Image Process. 2020, 29, 8326–8338. [Google Scholar] [CrossRef]
  25. Zhou, T.; Li, L.; Li, X.; Feng, C.M.; Li, J.; Shao, L. Group-Wise Learning for Weakly Supervised Semantic Segmentation. IEEE Trans. Image Process. 2021, 31, 799–811. [Google Scholar] [CrossRef]
  26. Zhou, T.; Qi, S.; Wang, W.; Shen, J.; Zhu, S.C. Cascaded parsing of human-object interaction recognition. IEEE Trans. Pattern Anal. Mach. Intell. 2021, 4, 2827–2840. [Google Scholar] [CrossRef]
  27. Teng, S.; Liu, X.; Zhang, S.; Huang, Q. Scan: Spatial and channel attention network for vehicle re-identification. In Proceedings of the Pacific Rim Conference on Multimedia, Hefei, China, 21–22 September 2018; Springer: Berlin/Heidelberg, Germany, 2018; pp. 350–361. [Google Scholar]
  28. Huang, Y.; Lian, S.; Zhang, S.; Hu, H.; Chen, D.; Su, T. Three-dimension transmissible attention network for person re-identification. IEEE Trans. Circuits Syst. Video Technol. 2020, 30, 4540–4553. [Google Scholar] [CrossRef]
  29. He, K.; Zhang, X.; Ren, S.; Sun, J. Deep residual learning for image recognition. In Proceedings of the IEEE Conference on Computer Vision and Pattern Recognition (CVPR), Las Vegas, NV, USA, 27–30 June 2016; pp. 770–778. [Google Scholar]
  30. Sun, Y.; Zheng, L.; Deng, W.; Wang, S. SVDNet for Pedestrian Retrieval. In Proceedings of the 2017 IEEE International Conference on Computer Vision (ICCV), Venice, Italy, 22–29 October 2017; pp. 3820–3828. [Google Scholar]
  31. Chen, L.; Zhang, H.; Xiao, J.; Nie, L.; Shao, J.; Liu, W.; Chua, T.S. Sca-cnn: Spatial and channel-wise attention in convolutional networks for image captioning. In Proceedings of the IEEE Conference on Computer Vision and Pattern Recognition (CVPR), Honolulu, HI, USA, 21–26 July 2017; pp. 5659–5667. [Google Scholar]
  32. Woo, S.; Park, J.; Lee, J.Y.; Kweon, I.S. Cbam: Convolutional block attention module. In Proceedings of the European Conference on Computer Vision (ECCV), Munich, Germany, 8–14 September 2018; pp. 3–19. [Google Scholar]
  33. Li, W.; Zhu, X.; Gong, S. Harmonious attention network for person re-identification. In Proceedings of the IEEE Conference on Computer Vision and Pattern Recognition (CVPR), Salt Lake City, UT, USA, 18–23 June 2018; pp. 2285–2294. [Google Scholar]
  34. Chen, X.; Fu, C.; Zhao, Y.; Zheng, F.; Song, J.; Ji, R.; Yang, Y. Salience-Guided Cascaded Suppression Network for Person Re-Identification. In Proceedings of the IEEE Conference on Computer Vision and Pattern Recognition (CVPR), Seattle, DC, USA, 16–18 June 2020. [Google Scholar]
  35. Goodale, M.A.; Milner, A.D. Separate visual pathways for perception and action. Trends Neurosci. 1992, 15, 20–25. [Google Scholar] [CrossRef]
  36. Hu, J.; Shen, L.; Sun, G. Squeeze-and-excitation networks. In Proceedings of the IEEE Conference on Computer Vision and Pattern Recognition (CVPR), Salt Lake City, UT, USA, 18–23 June 2018; pp. 7132–7141. [Google Scholar]
  37. Simonyan, K.; Zisserman, A. Very deep convolutional networks for large-scale image recognition. arXiv 2014, arXiv:1409.1556. [Google Scholar]
  38. Gao, S.; Cheng, M.; Zhao, K.; Zhang, X.; Yang, M.; Torr, P.H.S. Res2Net: A New Multi-scale Backbone Architecture. IEEE Trans. Pattern Anal. Mach. Intell. 2019, 43, 652–662. [Google Scholar] [CrossRef] [PubMed] [Green Version]
  39. Zhang, X.; Luo, H.; Fan, X.; Xiang, W.; Sun, Y.; Xiao, Q.; Jiang, W.; Zhang, C.; Sun, J. Alignedreid: Surpassing human-level performance in person re-identification. arXiv 2017, arXiv:1711.08184. [Google Scholar]
  40. Xu, Z.; Wei, L.; Lang, C.; Feng, S.; Wang, T.; Bors, A.G. HSS-GCN: A Hierarchical Spatial Structural Graph Convolutional Network for Vehicle Re-identification. In Proceedings of the International Conference on Pattern Recognition, Bangkok, Thailand, 28–30 July 2021; Springer: Berlin/Heidelberg, Germany, 2021; pp. 356–364. [Google Scholar]
  41. Huang, Y.; Liang, B.; Xie, W.; Liao, Y.; Kuang, Z.; Zhuang, Y.; Ding, X. Dual domain multi-task model for vehicle re-identification. IEEE Trans. Intell. Transp. Syst. 2020, 23, 2991–2999. [Google Scholar] [CrossRef]
  42. Lou, Y.; Bai, Y.; Liu, J.; Wang, S.; Duan, L.Y. Embedding adversarial learning for vehicle re-identification. IEEE Trans. Image Process. 2019, 28, 3794–3807. [Google Scholar] [CrossRef]
  43. Alfasly, S.; Hu, Y.; Li, H.; Liang, T.; Jin, X.; Liu, B.; Zhao, Q. Multi-label-based similarity learning for vehicle re-identification. IEEE Access 2019, 7, 162605–162616. [Google Scholar] [CrossRef]
  44. Liu, X.; Zhang, S.; Wang, X.; Hong, R.; Tian, Q. Group-group loss-based global-regional feature learning for vehicle re-identification. IEEE Trans. Image Process. 2019, 29, 2638–2652. [Google Scholar] [CrossRef]
  45. Li, K.; Ding, Z.; Li, K.; Zhang, Y.; Fu, Y. Vehicle and Person Re-Identification With Support Neighbor Loss. IEEE Trans. Neural Networks Learn. Syst. 2020, 33, 826–838. [Google Scholar] [CrossRef]
  46. Jin, X.; Lan, C.; Zeng, W.; Chen, Z. Uncertainty-aware multi-shot knowledge distillation for image-based object re-identification. In Proceedings of the AAAI Conference on Artificial Intelligence, New York, NY, USA, 7–12 February 2020; Volume 34, pp. 11165–11172. [Google Scholar]
  47. Ji, D.; Wang, H.; Hu, H.; Gan, W.; Wu, W.; Yan, J. Context-aware graph convolution network for target re-identification. arXiv 2020, arXiv:2012.04298. [Google Scholar]
  48. Li, Y.; Liu, K.; Jin, Y.; Wang, T.; Lin, W. VARID: Viewpoint-aware re-identification of vehicle based on triplet loss. IEEE Trans. Intell. Transp. Syst. 2020, 23, 1381–1390. [Google Scholar] [CrossRef]
  49. Zhu, X.; Luo, Z.; Fu, P.; Ji, X. VOC-ReID: Vehicle re-identification based on vehicle-orientation-camera. In Proceedings of the IEEE/CVF Conference on Computer Vision and Pattern Recognition Workshops, Seattle, WA, USA, 14–19 June 2020; pp. 602–603. [Google Scholar]
  50. Chen, X.; Sui, H.; Fang, J.; Feng, W.; Zhou, M. Vehicle Re-Identification Using Distance-Based Global and Partial Multi-Regional Feature Learning. IEEE Trans. Intell. Transp. Syst. 2020, 22, 1276–1286. [Google Scholar] [CrossRef]
  51. Sun, W.; Dai, G.; Zhang, X.; He, X.; Chen, X. TBE-Net: A Three-Branch Embedding Network With Part-Aware Ability and Feature Complementary Learning for Vehicle Re-Identification. IEEE Trans. Intell. Transp. Syst. 2021. [Google Scholar] [CrossRef]
  52. Zhou, Y.; Shao, L. Aware attentive multi-view inference for vehicle re-identification. In Proceedings of the IEEE Conference on Computer Vision and Pattern Recognition, Salt Lake City, UT, USA, 18–22 June 2018; pp. 6489–6498. [Google Scholar]
  53. Bai, Y.; Lou, Y.; Gao, F.; Wang, S.; Wu, Y.; Duan, L.Y. Group-sensitive triplet embedding for vehicle reidentification. IEEE Trans. Multimed. 2018, 20, 2385–2399. [Google Scholar] [CrossRef]
  54. Kuma, R.; Weill, E.; Aghdasi, F.; Sriram, P. Vehicle re-identification: An efficient baseline using triplet embedding. In Proceedings of the 2019 International Joint Conference on Neural Networks (IJCNN), Budapest, Hungary, 14–19 July 2019; IEEE: Piscataway, NJ, USA, 2019; pp. 1–9. [Google Scholar]
  55. Wang, P.; Jiao, B.; Yang, L.; Yang, Y.; Zhang, S.; Wei, W.; Zhang, Y. Vehicle re-identification in aerial imagery: Dataset and approach. In Proceedings of the IEEE/CVF International Conference on Computer Vision, Seoul, Korea, 27–28 October 2019; pp. 460–469. [Google Scholar]
  56. Zhu, R.; Fang, J.; Li, S.; Wang, Q.; Xu, H.; Xue, J.; Yu, H. Vehicle re-identification in tunnel scenes via synergistically cascade forests. Neurocomputing 2020, 381, 227–239. [Google Scholar] [CrossRef]
  57. Wang, T.; Zheng, Z.; Yan, C.; Zhang, J.; Sun, Y.; Zheng, B.; Yang, Y. Each part matters: Local patterns facilitate cross-view geo-localization. IEEE Trans. Circuits Syst. Video Technol. 2021, 32, 867–879. [Google Scholar] [CrossRef]
Figure 1. A large-scale benchmark dataset for vehicle Re-ID in the real-world urban surveillance scenario, named VeRi-776 [3] dataset. The three vehicle images in the first row are from the same vehicle, but captured under different surveillance cameras with various viewpoints, the second and third rows illustrate different vehicles but have the same type and color in similar viewpoints.
Electronics 11 01617 g001
Figure 2. The overview model architecture of APANet. Based on the backbone network (i.e., ResNet-50), APANet firstly leverages MA modules to extract discriminative features. Afterwards, the informative features are further split into N _ p parts for more fine-grained part-level representations with the help of POL and PAAL loss functions.
Electronics 11 01617 g002
Figure 3. Overview of the embedded structure of Multi-receptive-field Attention (MA) module. As is illustrated, MA module is placed in parallel with a residual block in ResNet-50.
Electronics 11 01617 g003
Figure 4. Illustration of Multi-receptive-field Attention (MA) module. Here, RF is the abbreviation for receptive field.
Electronics 11 01617 g004
Figure 5. Structure of classification module. Here, we take the example of N p = 4 for demonstration. The left parts clearly illustrate feature dimension change in the feature split operation module.
Electronics 11 01617 g005
Figure 6. The t-distributed Stochastic Neighbor Embedding (t-SNE) visualization results of feature distributions on the VeRi-776 [3] test set. (a) APANet without L TriHard and L IFC ; (b) APANet without L IFC ; (c) APANet.
Electronics 11 01617 g006
Figure 7. Comparisons of visualization results between baseline model and APANet. (a) Original images; (b) baseline; (c) APANet.
Electronics 11 01617 g007
Figure 8. Visualization of results in our proposed APANet. The original vehicle images and their attention maps of N p = 4 local features.
Electronics 11 01617 g008
Figure 9. Parameter analysis on VeRi-776 [3]. Sensitivity to the λ i ( i = 1 , 2 , 3 , 4 ) parameters in the final objective function.
Electronics 11 01617 g009
Table 1. Detailed introduction to two mainstream vehicle Re-ID datasets.
DatasetsTrainingTesting
IDsImagesQueryGallery
IDsImagesIDsImages
VeRi-776 [3]57637,778200167820011,579
VERI-Wild [16] (Small)30,671277,79730003000300038,861
VERI-Wild [16] (Medium)30,671277,79750005000500064,389
VERI-Wild [16] (Large)30,671277,79710,00010,00010,000128,517
Table 2. Quantitative ablation study of APANet on the final performance. BL: Baseline model; MA: Multi-receptive-field Attention; POL: Part-level Orthogonality Loss; PAAL: Part-level Attention Alignment Loss; IFCL: Inter-group Feature Centroid Loss; ITriHard: Improved Triplet Loss with Hard Mining.
No.BLITriHardIFCLMAPOLPAALVeRi-776
Rank-1mAP
1 89.163.1
2 90.265.5
3 89.664.0
4 93.373.5
5 91.067.5
6 91.566.0
7 90.576.4
8 94.375.4
9 91.468.7
10 95.778.0
1196.479.8
Table 3. Qualitative analysis of MA modules on VeRi-776 [3] in terms of model size, computation complexity, and performance. PN: Parameter Number. FLOPs: Floating-point Operations.
MethodNumber of MAsPN (M)FLOPs (G)Rank-1mAP
Baseline (without MA modules)030.09.289.163.1
MA–Conv.B1330.210.389.062.7
MA–Conv.B2431.711.489.764.1
MA–Conv.B3640.912.492.269.5
MA–Conv.B4348.713.992.670.6
MA–Conv.B3, 4654.815.493.373.5
Table 4. Comparison of rank and mAP for original TriHard loss and improved TriHard loss on VeRi-776 [3], where other model’s components and experiment settings remain unchanged.
MethodRank-1Rank-5mAP
Original TriHard95.998.479.2
Improved TriHard96.498.779.8
Table 5. The impact of the number of MA modules on VeRi-776 [3] dataset.
Number of MA ModulesRank-1mAP
188.462.1
288.862.3
389.062.7
489.764.1
590.968.2
693.373.5
792.672.2
892.270.9
991.570.2
1091.369.6
Table 6. The impact of the number of part features N p on VeRi-776 [3] dataset.
Number of MA ModulesRank-1mAP
194.875.6
2 (Horizontal)95.978.8
2 (Vertical)95.878.8
496.479.8
993.674.1
Table 7. Comparison results with state-of-the-art methods on VeRi-776 [3] in terms of rank and mAP. ‘-’ indicates the result is not reported. Note that the best performance is marked in bold and the second best accuracy is underscored.
MethodVeRi-776
Rank-1Rank-5mAP
GF-basedHSS-GCN (2021) [40]64.486.144.8
DDM (2020) [41]72.886.453.6
EALN (2019) [42]84.494.157.4
MLSL (2019) [43]90.096.061.1
GGL (2020) [44]89.495.061.7
SN (2022) [45]95.198.175.7
UMTS (2020) [46]95.8-75.9
CAGCN (2021) [47]95.2-79.2
VARID (2022) [48]96.099.279.3
VOC-ReID (2020) [49]96.3-79.7
PF-basedPRN (2019) [17]94.398.774.3
PCRNet (2020) [4]95.498.478.6
DGPM (2021) [50]96.298.179.4
PVEN (2020) [22]95.698.479.5
TBE-Net (2021) [51]96.098.579.5
AM-basedVAMI (2018) [52]77.090.850.1
SGAT (2020) [5]89.7-65.7
SPAN (2020) [12]94.097.668.9
MVAN (2021) [7]92.697.972.5
PGAN (2020) [10]96.598.379.3
SAVER (2020) [6]96.498.679.6
APANet96.498.779.8
Table 8. Comparison results with state-of-the-art methods on VERI-Wild [16] in terms of rank and mAP. ‘-’ indicates the result is not reported. Note that the best performance is marked in bold and the second best accuracy is underscored.
MethodVERI-Wild (Small)
Rank-1Rank-5mAP
GSTE (2018) [53]60.5-31.4
FDA-Net (2019) [16]64.0-35.1
MLSL (2019) [43]86.093.546.3
AAVER (2019) [13]75.8-62.2
Triplet Embedding (2019) [54]84.2-70.5
UMTS (2020) [46]84.5-72.7
VARID (2022) [48]75.395.275.4
APANet89.294.779.5
Publisher’s Note: MDPI stays neutral with regard to jurisdictional claims in published maps and institutional affiliations.

