Article

Statistical Analysis of the Effectiveness of Wearable Robot

1
Department of Defense System Engineering, Korea Army Academy at Yeongcheon, Yeongcheon-si 38900, Korea
2
Department of Drone-Robot Engineering, The University of Pai Chai, Daejeon 35345, Korea
*
Author to whom correspondence should be addressed.
Electronics 2021, 10(9), 1006; https://doi.org/10.3390/electronics10091006
Submission received: 6 March 2021 / Revised: 17 April 2021 / Accepted: 19 April 2021 / Published: 23 April 2021
(This article belongs to the Section Systems & Control Engineering)

Abstract

:
In this paper, we present a new statistical approach for evaluating the time-dependent effectiveness of wearable robots without real work. In total, 10 subjects participated in three phases of the experiment; not equipped with a wearable robot without any load, not equipped with the wearable robot with a 15 kg load, equipped with the wearable robot with a 15 kg load. A higher limb wearable robot called LEXO-W was utilized. We measured the time taken to complete a 10 m round trip 10 times as a lap time, and each participant was measured multiple times under all conditions. An increasing number of round trips causes an increment in lap times. In particular, the load-carrying group showed a rapid upward trend in lap time over the number of round trips. However, the robot-assisted group showed a slightly upward trend of lap time over the number of round trips. This study statistically shows that the LEXO-W helps reduce physical fatigue by using repeated measure ANOVA analysis. Furthermore, we employed the generalized additive model(GAM) model to predict and evaluate the effectiveness of the wearable robot.

1. Introduction

Over the last few decades, wearable robots have been presented for assisting people [1,2,3,4,5,6,7,8,9,10]. Wearable robots are mechanical devices that allow a wearer to work without using force or with force reduction [11]. There are higher limb wearable robots and lower limb wearable robots. Higher limb wearable robots help people who work using their arms and lower limb wearable robots help the wearer walk conveniently, or enable some people who have walking problems to walk. In particular, recently, higher limb wearable robots are being commercialized and utilized in various areas, such as in factories and logistics plants, for the purpose of reducing the fatigue of the wearer and preventing injuries. Exosquelett supports the load of a tool during work on a factory floor, the modular agile exoskeleton (MAX) supports the wearer in challengeable industrial environments, and PAEXO-BACK helps the wearer to carry a load in logistics plants [12,13,14,15]. Meanwhile, while research interest in wearable robots in the industrial field is extended, a rigorous performance evaluation, in terms of assistance to the workers, has not been attempted yet. Pesenti et al. categorized the evaluation of wearable robots into three types of analysis: a feasibility analysis to examine suitability for work with a certain task; an effectiveness analysis is a qualitative or quantitative analysis of the device (in other words, it is used to evaluate the amount of assistance provided to the wearer); a user-acceptance analysis is the subjective evaluation of the wearer [16]. Most of the studies focus on effectiveness analysis, with several evaluation criteria and metrics. The criteria and metrics applied in many studies can be divided into four domains, as follows: EMG-based analysis in change of muscle activity; force/torque; measurement of the metabolic cost or metabolic rate, and functional performance, such as measurements of kinematics, performance time, velocity, posture holing time and walking distance. Kao et al. tried to evaluate the activation of muscle, Jackson and Collins utilized muscular activation, and Lee et al. tried to evaluate the reduction of metabolic cost [17,18,19]. Chris McGibbon et al. tried to evaluate physical performance with/without the wearable robot, Stefano Toxiri et al. evaluated the effectiveness of the wearable robot as regards how much the structures and physical attachments transfer force or toque to the wearer, Antonio Di Lallo et al. tried to evaluate mechanical impedance, high back drivability, and high torque, Mona Bar et al. evaluated physical stress and strain, and Homed Jabbari Asl et al. tried to evaluate the tracking accuracy and the smoothness of the system [20,21,22,23,24]. However, these approaches evaluate only one or two wearers at the time of development by comparing parameters including metabolic cost, muscle activity, physical performance, structures, etc. However, it is not easy to evaluate the effectiveness of wearable robots over the long term in factories or logistics plants under real working conditions. Additionally, wearable robots are customized for one or two wearers at the evaluation, and so the result is specific to one or two wearers.
In this paper, we present a new statistical approach for evaluating the wearer-dependent effectiveness of wearable robots under real working conditions. We present the recent research related to effectiveness analysis. In total, 10 subjects participated and a higher limb wearable robot called LEXO-W was utilized. We used performance time in the functional domain as the criteria and metrics to evaluate the effectiveness of the wearable robot. For the within-subject design, each participant completed a 10-meter walk test (10MWT) multiple times under all conditions. The within-subject experimental design has advantages including more statistical power, the reduction of the effect of individual variation, etc. The 10MWT is used to assess walking speed in meters/second over a short distance. We applied the generalized additive model (GAM) to identify and predict the wearer-dependent effectiveness of the wearable robot.
This paper provides the following two main contributions to the analysis of the effectiveness of the wearable robot. First, 10 subjects wearing a higher limb wearable robot participated, and we measured multiple times under all conditions. Second, as a result, we identified and predicted the wearer-dependent effectiveness of the higher limb wearable robot over a long time, without real work, using a statistical method.
This paper is divided into three parts. In Section 2, we introduce the methods, including participants, materials, experimental procedure, experiment variables and statistical analysis. In Section 3, we provide the results, including descriptive statistics and a comparison of groups of statistical differences, and the prediction of the effectiveness of the wearable robot using the generalized additive model (GAM). In Section 4, we discuss the results and future works.

2. Methods

2.1. Participants

In total, 10 healthy subjects with ages of 21.7 years old (mean value) volunteered to participate in this study. Table 1 shows the subjects’ body parameters. The subjects did not have postural problems and gave informed consent. The mean height of the subjects and the mean weight of subjects were 1.768 m and 72 kg, respectively.

2.2. Materials

Figure 1 shows the LEXO-W utilized in this paper. LEXO-W is the commercialized higher limb wearable robot designed by LIG Nex1. The higher limb wearable robot enables the wearer to carry a load easily. The weight of the LEXO-W is 5.9 kg, and the size is 400 (W) × 330 (D) × 790 (H) mm. The wearer adjusts the size of the LEXO-W for their height. As a result, all subjects equipped the LEXO-W independently, and participated in the experiment. The LEXO-W is a passive mechanism designed to support the wearer. A cable-driven mechanism is used, and the LEXO-W supports up to a 55 kg load. The subject equipped with the LEXO-W carries a load easier than the subject not equipped with the LEXO-W.

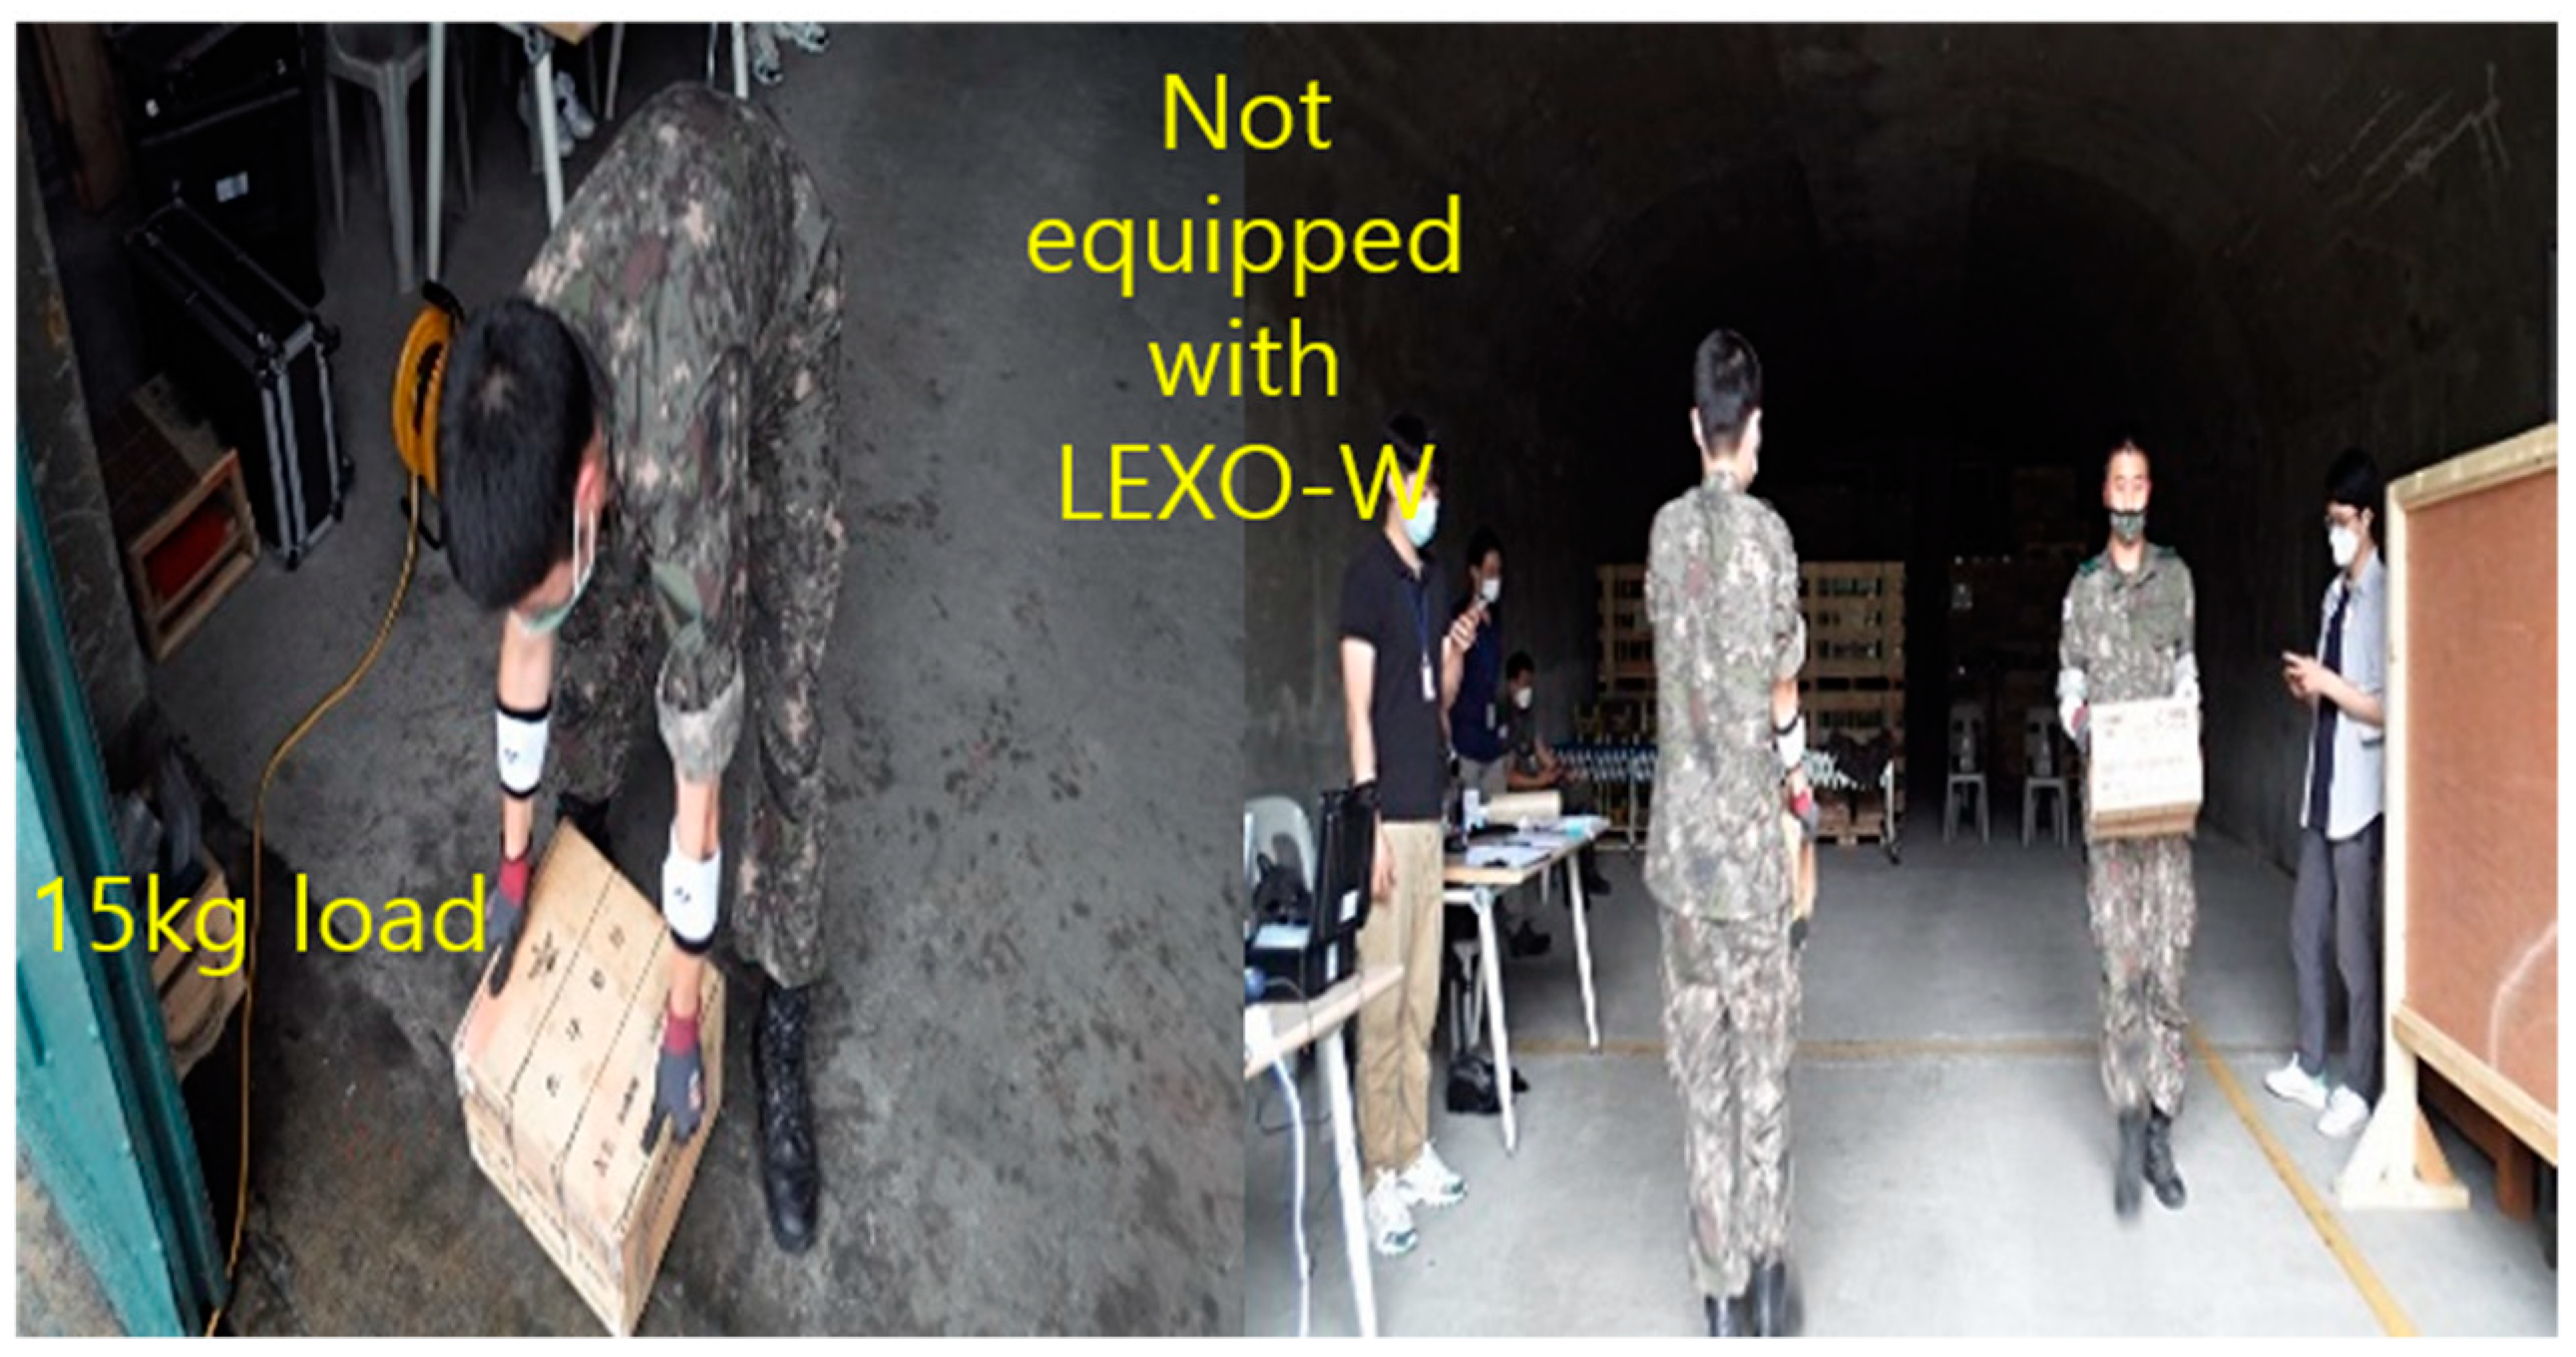
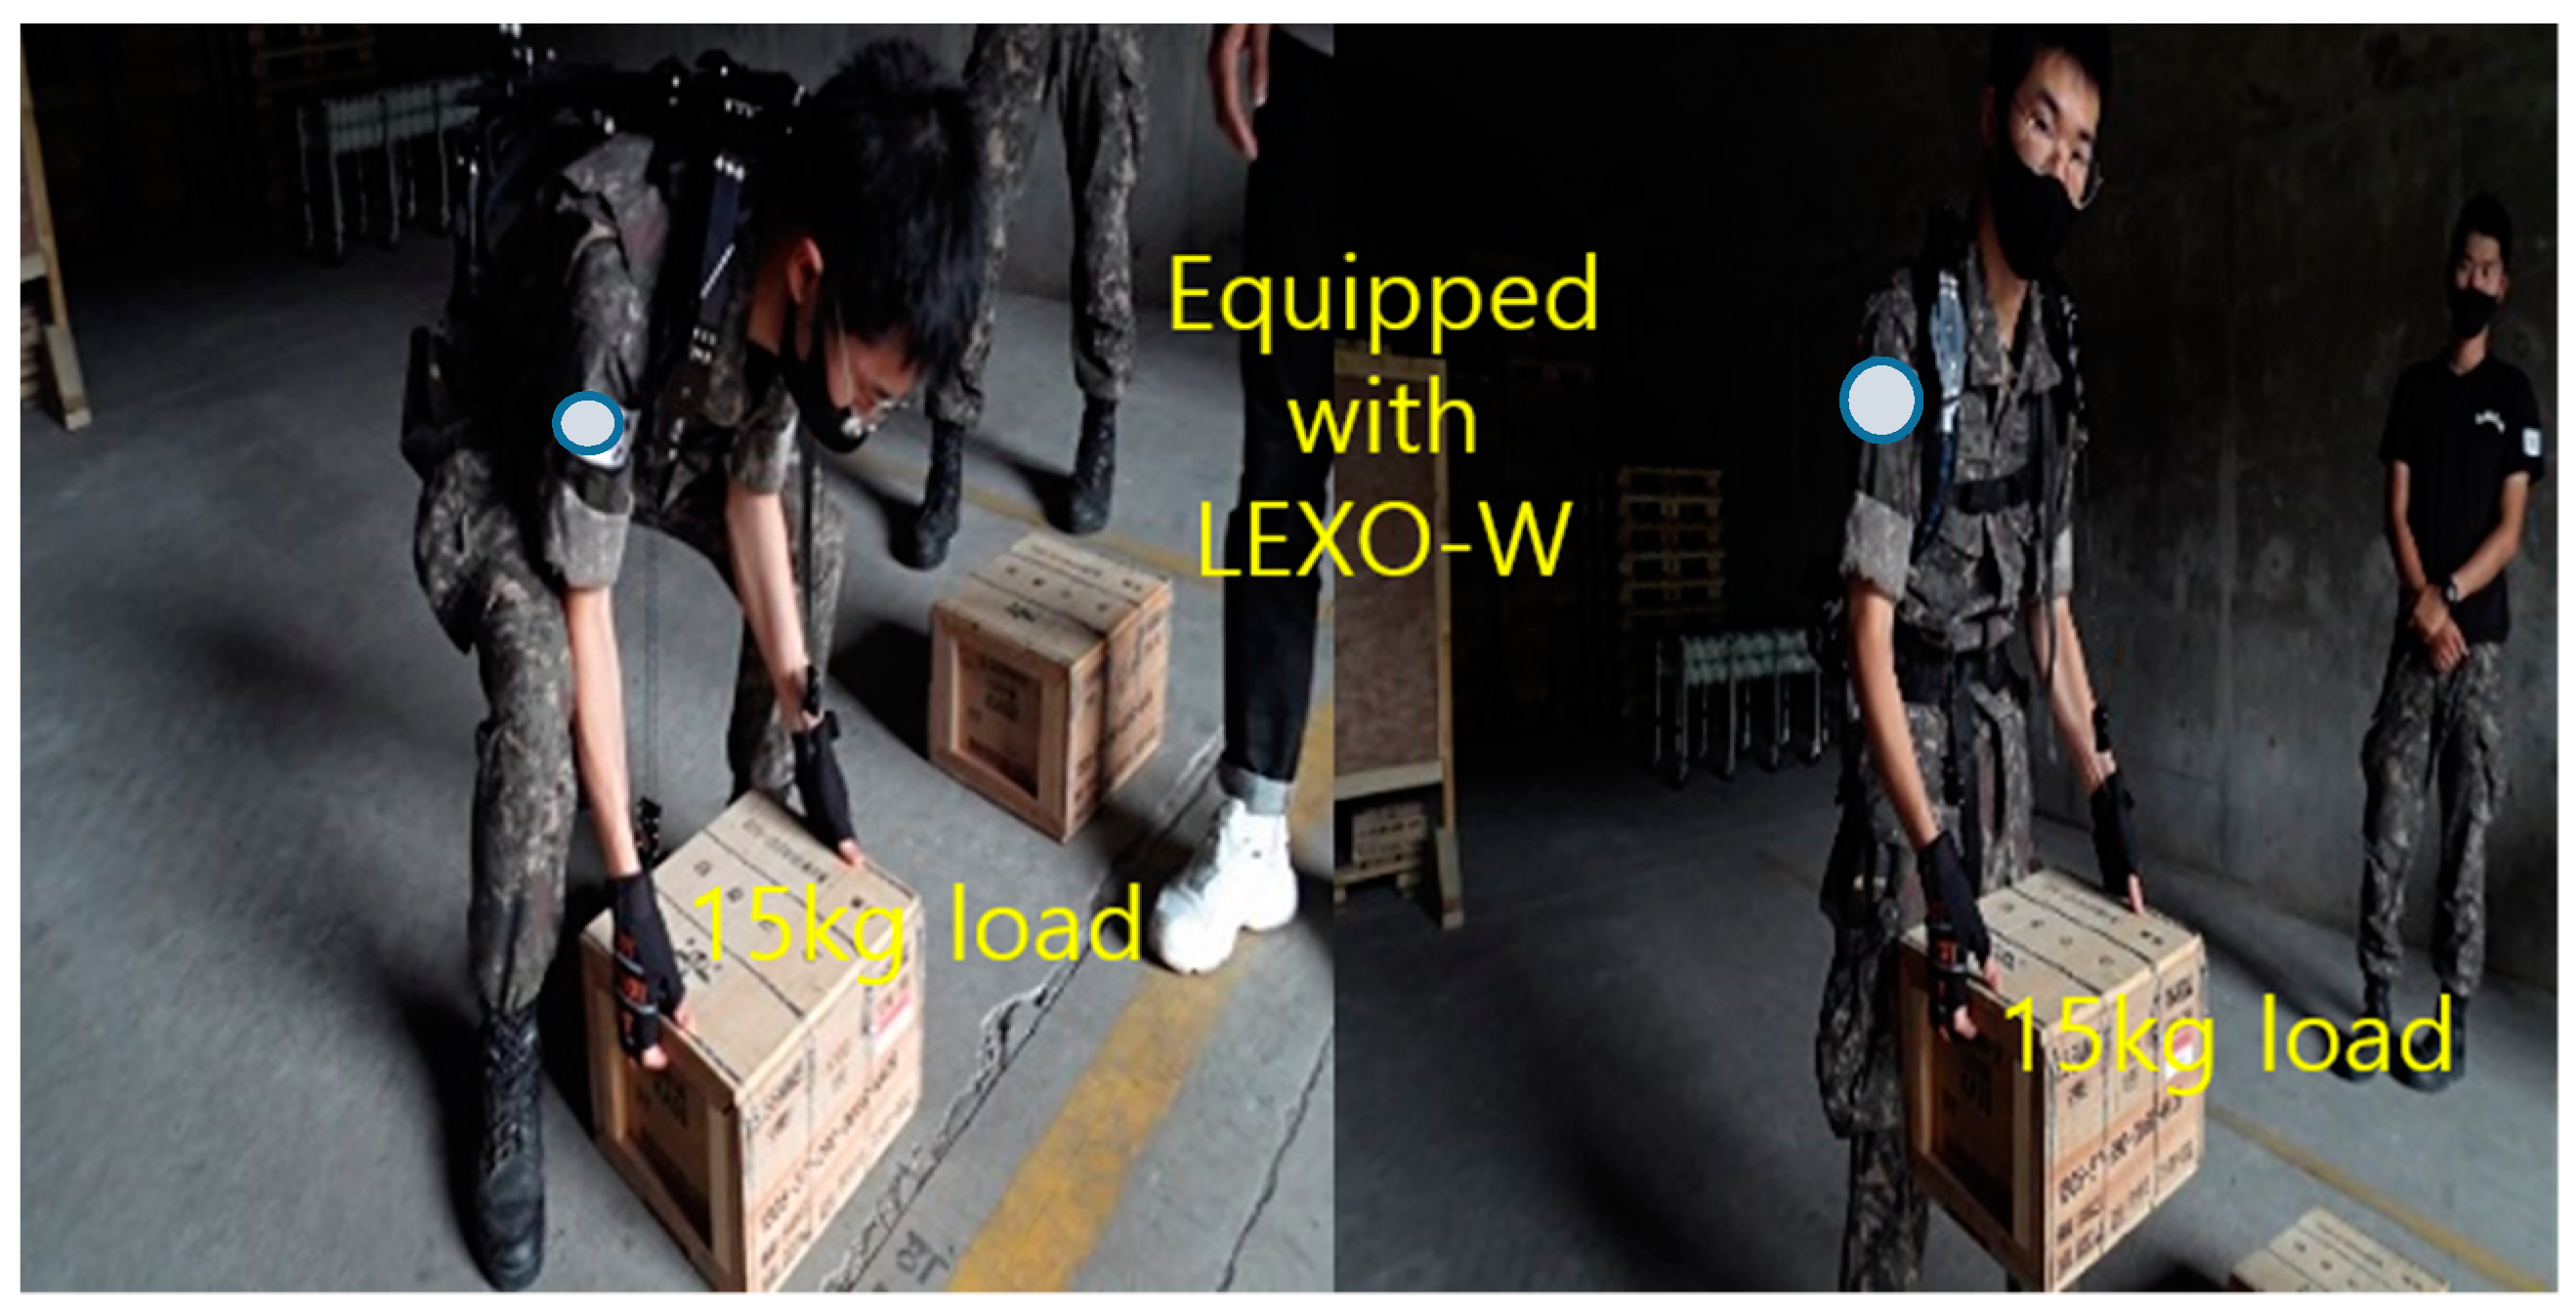
2.3. Experimental Procedure

There were 3 phases of the experiment. First, each subject not equipped with the LEXO-W walked a 10 m round trip at their preferred step velocity without any load 10 times, as shown in Figure 2. Second, each of the subjects not equipped with the LEXO-W walked a 10 m round trip at their preferred step velocity with a 15 kg load 10 times, as shown in Figure 3. Lastly, each of the subjects equipped with the LEXO-W walked a 10 m round trip at their preferred step velocity with a 15 kg load 10 times, as shown in Figure 4. Each of the subjects adjusted the size of the LEXO-W for the height of the wearer. At every phase, we measured the round trip time as a lap time.

2.4. Experiment Variables and Satistical Analysis

The independent variables of this study are the number of round trips and the experimental condition, which contained three groups (baseline group, load-carrying group, robot-assisted group): not equipped with the LEXO-W without any load, not equipped with the LEXO-W with a 15 kg load, equipped with the LEXO-X with a 15 kg load. The number of round trips can be easily converted into distance. As for the dependent variables, the lap time and the effectiveness were employed. The lap time was measured in seconds per round trip. We focused on assessing the wearable robotics’ performance. Although there are different types of performance measures such as rehabilitation, electromyography, velocity, etc., in our study, velocity was considered. The dependent variable, the effectiveness of the wearable robot, is defined as follows:
y i = v i ,   r o b o t v i ,   l o a d
where v i , r o b o t and   v i , l o a d are the ith the average speed of a round trip in the load carrying group and the robot-assisted group. The average speed,   v , is calculated by dividing the distance traveled by the lap time.
The statistical analysis can be subdivided into two parts: descriptive statistics and inferential statistics. The descriptive data analysis is performed to provide simple summaries of the experimental data. It presents the descriptive statistics in tables or graphs and helps us to understand the characteristics of the experimental result. After having calculated the descriptive statistics, we employed inferential statistical analyses to compare three groups carrying out different numbers of round trips. In general, the independent sample t-test was used to compare observations from two groups. When each subject is measured twice, resulting in pairs of observations, the paired sample t-test is used. Likewise, for comparing more than two groups, ANOVA or repeated ANOVA are appropriate statistical methods [26,27,28]. In our experiment, each subject was assessed for lap time over 10 round trips within three different groups (baseline, load-carrying, robot-assisted). Therefore, the repeated ANOVA model was used. The dependent variable was “lap time”, while the two factors were the “group” and “the number of round trips”. However, the ANOVA model is limited to showing the effectiveness of the wearable robot over time in our study. We have predicted the effectiveness over distance with the generalized additive model (GAM) and evaluated the effectiveness of the wearable robot. Since the scatter plot between the effectiveness and the moving distance shows a nonlinear relationship, we have considered the generalized additive model (GAM), introduced in [26], to explore the nonlinear relationship. The GAM is helpful for modeling non-linear variables, and is widely used in practice [27,28,29]. The GAM is generally specified as follows:
g ( E ( y ) ) = β 0 + j = 1 p f j ( x j )
where g ( · ) is the link function, while f j is the unknown smooth functions and is represented via the linear combination of basis functions with coefficients. The GAM framework controls the smoothness of the predictor functions in order to prevent overfitting with the smoothing parameter. To fit the GAM with smoothing splines, we use the mgcv package in the R program. The package provides the mechanism to build the models whilst automatically estimating the smoothers via criteria such as generalized cross-validation [30,31].

3. Results

3.1. Descriptive Statisticts

Table 2 summarizes the experimental results over 10 subjects. The mean and standard deviation (SD) values for lap times are given in Table 2. To compare the lap times of three groups over the number of round trips, it displays the three groups in the rows, and the number of round trips in the columns. In other words, the two factors of group and number of round trips are crossed, and we derive the mean and SD of 10 observations from each group in each number of round trips. The findings are as follows. First, the baseline group has a lower mean and less variation than the other two groups. This shows that load carriage causes a reduction in performance. Second, the performance of the load-carrying group was affected by the number of round trips, unlike the other groups. The heavy load reduced mobility and increased fatigue. Finally, the performance of the robot-assisted group was not good, but it hardly changed over the number of round trips.
To discuss the experimental results in more detail, we have provided a box and whisker plot in Figure 5, which is helpful in interpreting the distributional characteristics of the data. Figure 5 includes three plots for different groups. All plots include trends and variability in lap times over the number of round trips. The working performance of participants is assessed as the time taken to walk a predetermined distance (10 m). The increasing number of round trips causes muscle fatigue (tiredness, lack of energy and feeling of exhaustion) and poor performance. The plots show upward trends over the number of round trips. Furthermore, individuals may feel different levels of fatigue under the same conditions. This is why variability increases with the number of round trips. Despite these common features, there are differences among plots. Since an easy walk at a comfortable pace without a load is low-intensity exercise, the participants in the baseline group feel slightly fatigued. Therefore, in Figure 5a, the change in lap times over the number of round trips remains nearly constant, and within a relatively narrow range. Figure 5b shows upward trends and increases in variability over the number of round trips. The participants’ muscles during loaded walking need to work harder to sustain the load and balance their joints. This causes physical fatigue and reduced maneuverability. However, the effect depends on personal physical capability, which increases the variability in Figure 5b. The average lap time in Figure 5c is higher than that in Figure 5a,b. Additionally, there is a slightly upward trend in lap time and a large variance, as seen in Figure 5a,b. This suggest that the wearable robot, the LEXO-W, helps to reduce physical fatigue, while it does not fully fulfill the requirement for providing comfort and smooth interaction with each human user.

3.2. Comparing Groups for Statistical Differences

The results of the two-way repeated measured ANOVA in Table 3 show that lap time is significantly affected by group (F (2,18) = 33.34, p < 0.001) and number of round trips (F (9,81) = 30.59, p < 0.001). Additionally, there is a statistically significant interaction between group and the number of round trips (F (18,162) = 7.960, p < 0.001). However, ANOVA result does not identify which specific groups between pairs of means (baseline, carrying load, robot-assisted) are significant.
To highlight exactly where these differences occur and provide any deeper insights, the effect of the group variable should be analyzed for each number of round trips by using post hoc tests. There are several tests for post hoc multiple comparison, such as Tukey HSD, LSD, Bonferroni, etc. [32,33,34,35,36,37]. In this study, we ran the Bonferroni test, which divides our significance level α by the number of comparisons. Although it is conservative, a direct application of other post hoc tests is difficult due to the within-experimental unit dependency [33]. Figure 6 gives the result of post hoc comparisons, and depicts where exactly the significant statistical differences occurred. In this figure, the bar and the error bar indicate the mean value and standard deviation of several lap times under each condition (group, the number of round trips). To easily describe the results of the statistical comparison, we have added p-values (ns: p > 0.05; *: p ≤ 0.05; **: p < 0.001; ***: p < 0.0001) to the graph. In the first and second round trips, there was no significant gap between the baseline group and the load-carrying group. However, in the third round trip, the lap time differences between two groups increased, with statistical significance. Statistically, this means load-carrying causes fatigue and reduces the personal speed of movement. The mean time of the robot-assisted group was the highest among the three groups in every round trip, but the gap between the load-carrying group and the robot-assisted group diminished with the increasing number of round trips. In the 9th and 10th round trips, there was not also significant difference between the load-carrying group and the robot-assisting group. It is evident that the wearable robot helps a person carry loads with less fatigue.

3.3. Prediction of Work Efficiency with the Wearable Robot using the Generalized Additive Model (GAM)

A descriptive analysis and summary of ANOVA statistics provides the insight that walking with loads negatively affects walking performance over time. However, when walking equipped with a robot, there are no significantly negative effects of loads over time, in spite of physical discomfort while wearing the robot. These results are not enough to show the effectiveness of the wearable robot over time. Therefore, in this section, we predict the effectiveness over moving distance by using a generalized additive model (GAM). To evaluate the performance of the GAM, we have run a simple linear regression and used it as a baseline. Table 4 shows the results of the comparison between two models based on the adjusted R- square, GCV, and root mean square error (RMSE). In addition, we randomly split the dataset into a training and a testing set, and then computed the RMSE. The lower values of RMSE and GCV indicate the better goodness-of-fit of the model. Conversely, the larger value of adjusted R-square indicates a better fit. In conclusion, the GAM performed well.
Figure 7 shows the results of the optimal generalized additive model predicting the effectiveness of the wearable robot over distances. The red solid line gives the expected values, while the blue dashed lines show the confidence interval for the expected value. The model explains the nonlinear relationship between the effectiveness and walking distance. Furthermore, the beginning of the curve indicates that the effectiveness is less than 1 and grows very slowly over distance, yet the effectiveness in the latter part of the curve is accelerating. This clearly shows the performance of the higher limb wearable robot over a long time in workplaces such as logistics plants.

4. Discussion and Conclusions

In an effort to contribute to the performance evaluation of the wearable robot, this paper has conducted experiments to compare lap time differences among three groups (baseline group, load-carrying group, robot-assisted group). In total, 10 subjects participated in the experiment, and multiple lap times for each participant were measured under all conditions. A higher limb wearable robot called a LEXO-W was utilized. Additionally, this study presents statistical approaches suitable for analyzing the performances of wearable robots and evaluating the wearer-dependent effectiveness of the wearable robot. First, we used the descriptive analysis and the repeated measure ANOVA analysis for the comparison of three groups. Second, we employed the GAM model to predict and evaluate the effectiveness of the wearable robot. The major findings from this study are as follows:
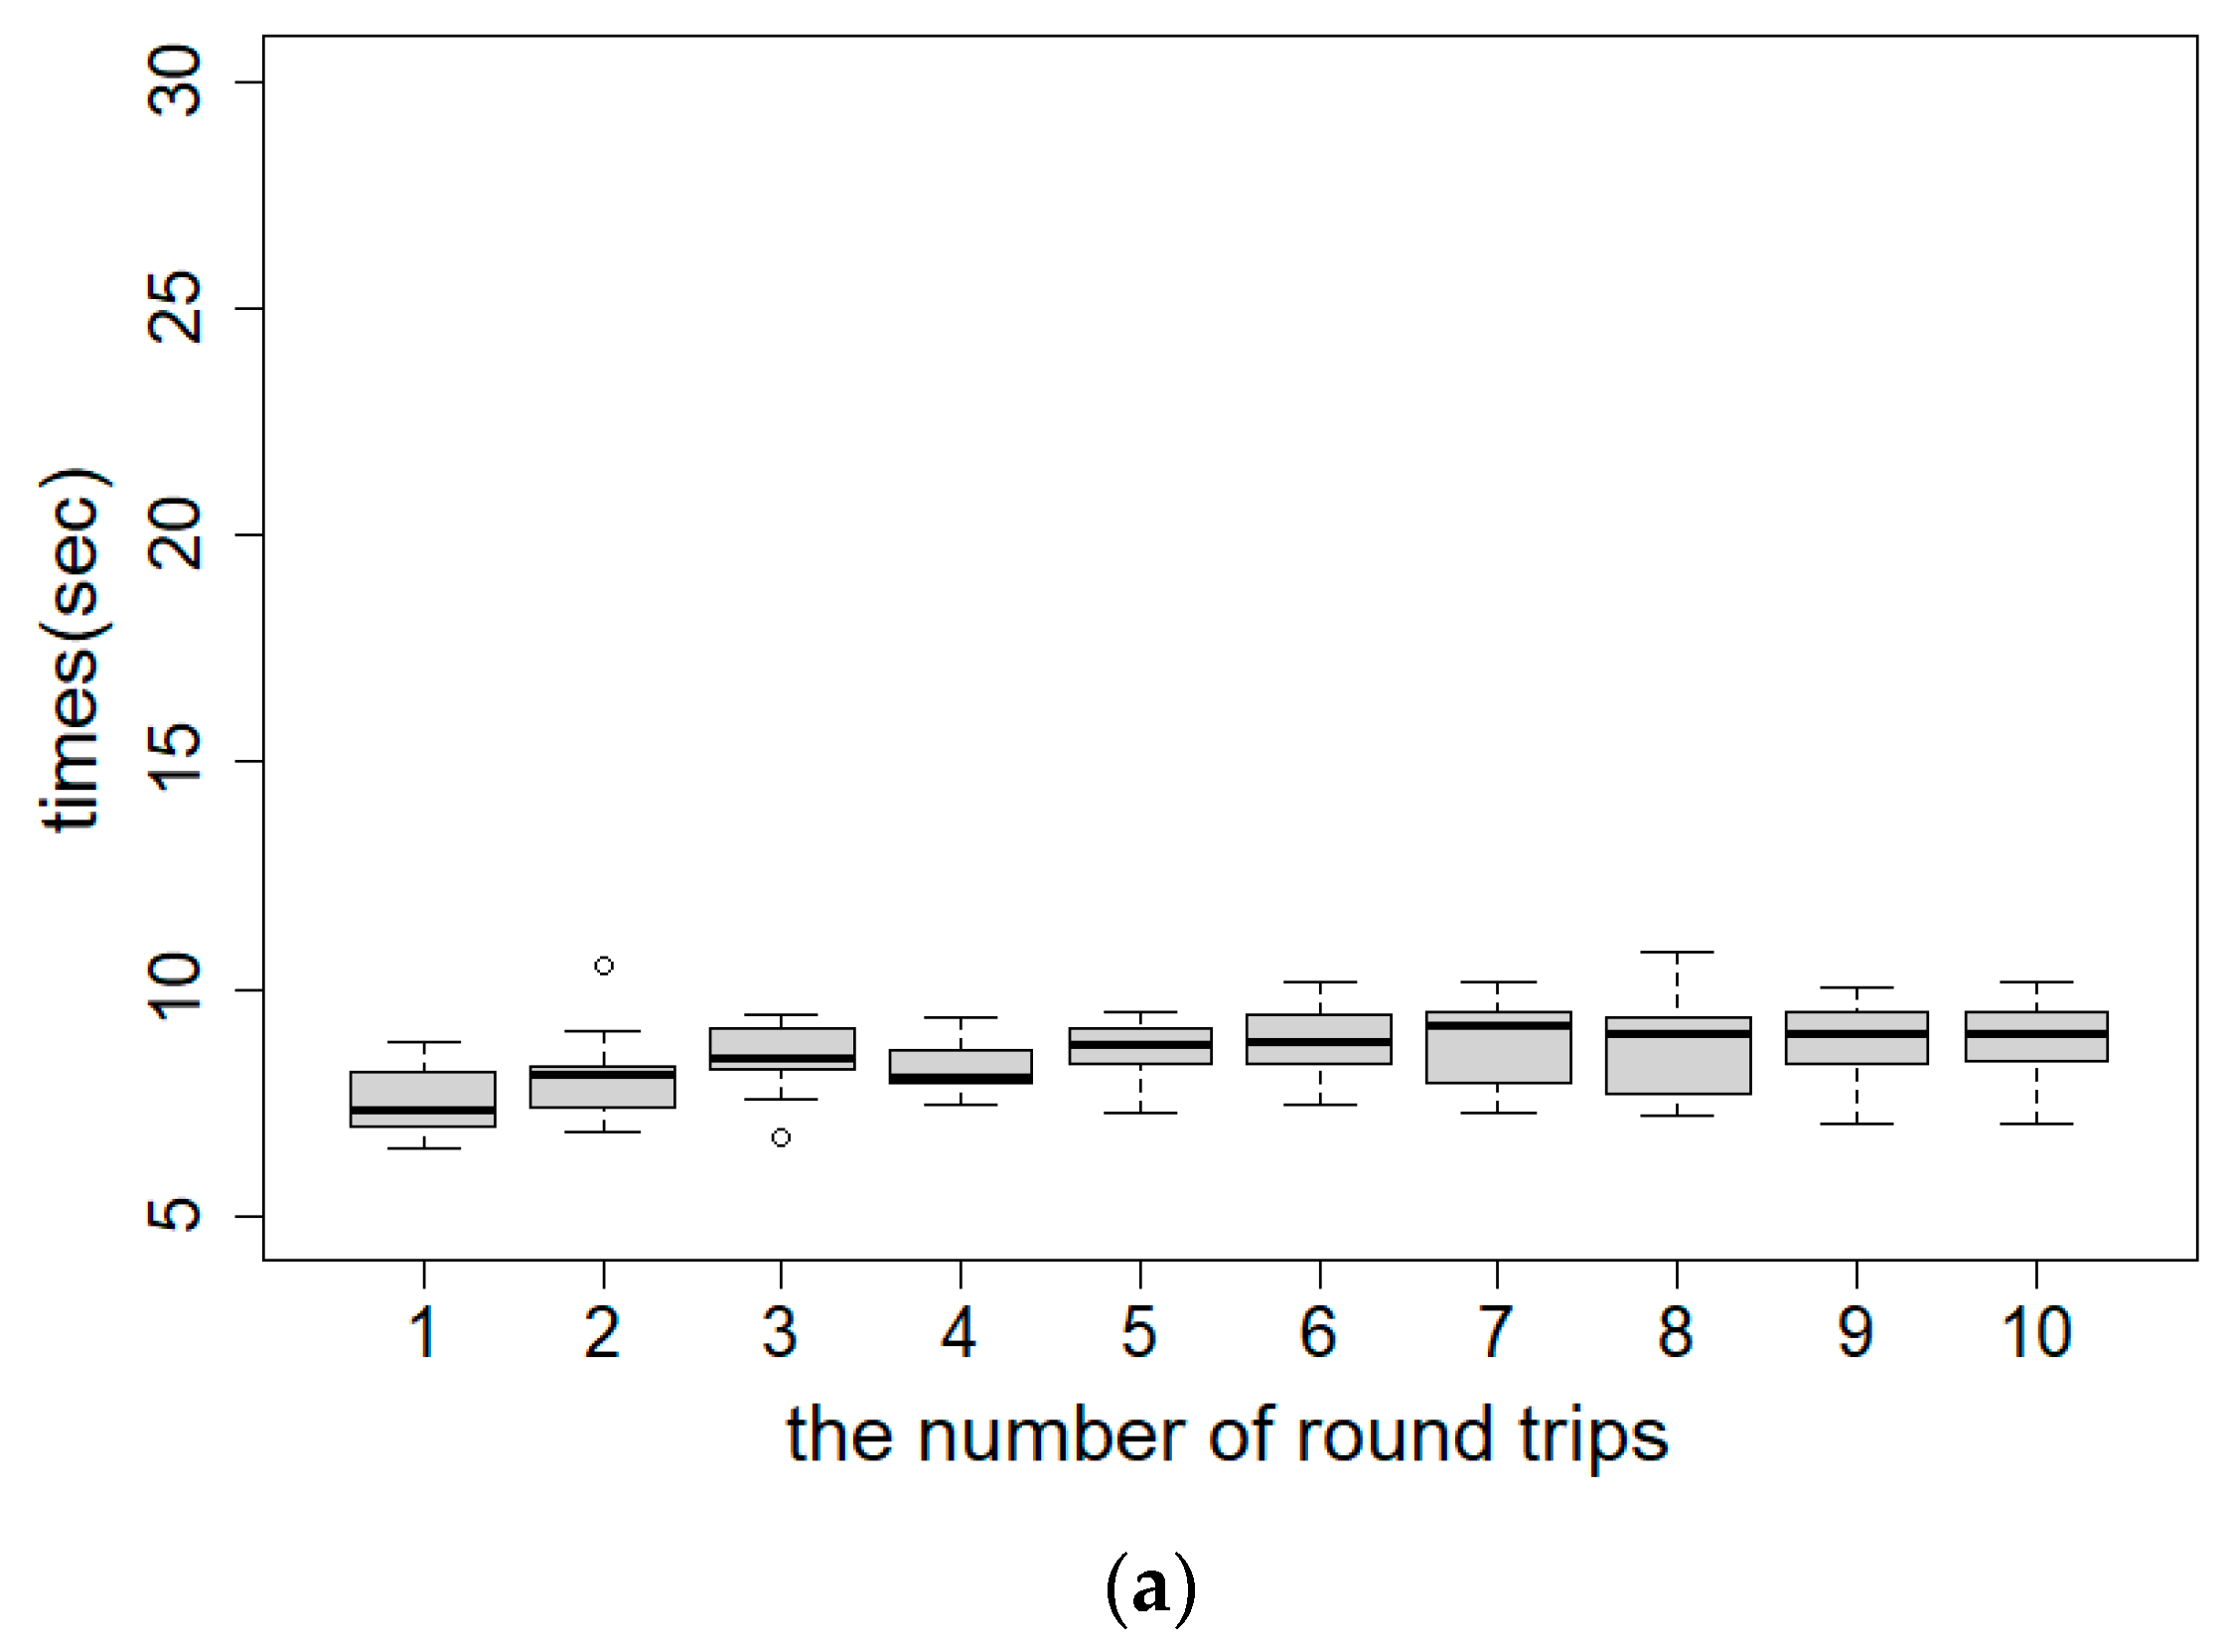
  • In general, the increasing number of round trips causes an increment in lap time. Particularly, the load-carrying group shows a rapidly upward trend in lap time over the number of round trips. This proves that walking with a 15 kg load causes more fatigue;
  • An unexpected result was that the robot-assisted group showed a slightly upward trend in lap time over the number of round trips. The reason is that the wearable robot helps in the reduction of physical fatigue;
  • The average lap time in the robot-assisted group is higher than in the other groups. This is evidence that the wearable robot does not fully fulfill the requirement for providing comfort and smooth interaction with each human user. It shows that the appropriate ergonomic design of a wearable robot should be considered;
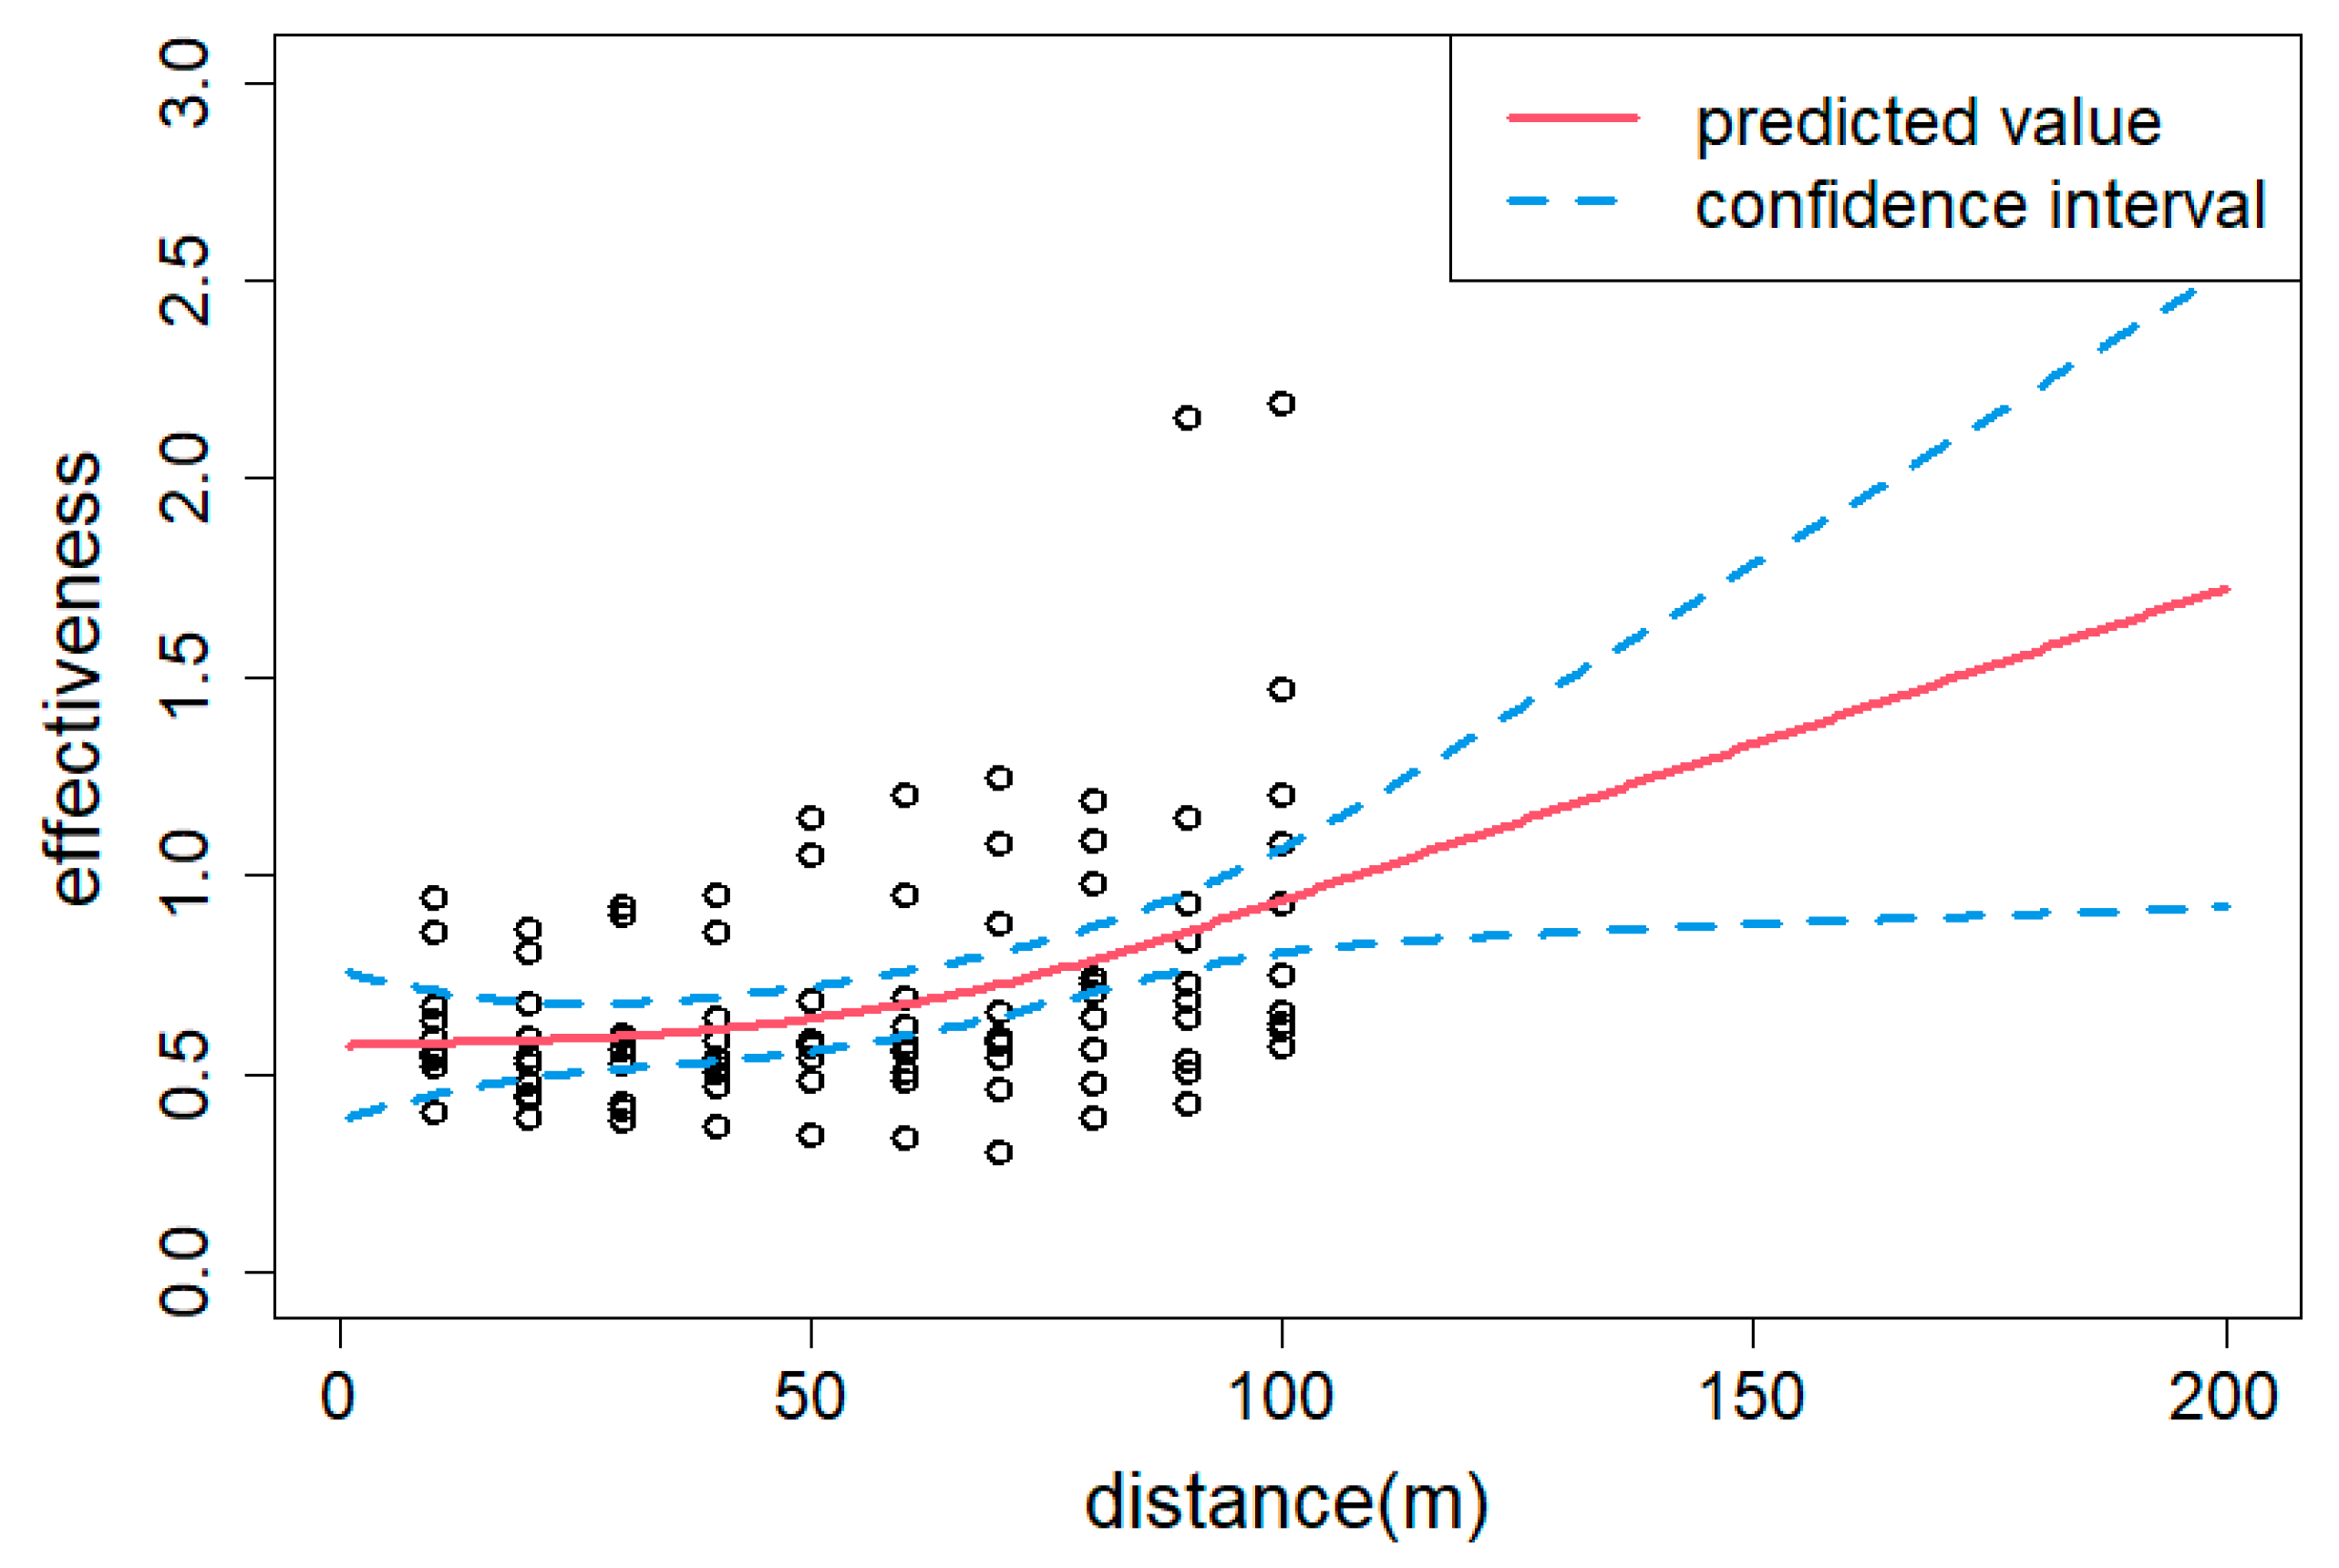
  • The result based on the repeated measure ANOVA analysis is not enough to prove that the robot-assisted group achieves the best performance. Since our experimental condition is 10 round trips, it is difficult to test the effectiveness of the wearable robot when one is consistently equipped with the wearable robot. Therefore, we have predicted the effectiveness over distance using the GAM model and evaluated the effectiveness. The effectiveness has increased as the moving distance increased (the number of round trips). The wearable robot works well to reduce physical fatigue in spite of the poor ergonomics of the design.
Finally, some limitations of this study are acknowledged here, along with future research ideas. The first limitation is the small number of participants with similar physical features. It is not sufficient to explain the impact of personal characteristics on the effectiveness of the wearable robot. In any future study, we need to develop a new statistical model including physical features based on numerous participants. Second, we have only considered the velocity ratio when examining the effectiveness of the wearable robot. Performance measurement is an urgent issue in wearable robots. Any future study in this field should include a variety of performance measurements, such as electromyography and motion capture. Third, we were not able to study ergonomic factors related to the higher lap time of robot-assisted group. Future works will study ergonomics factors, and we will study mechanical design factors to improve them.

Author Contributions

Conceptualization, D.C.; methodology, G.L., D.C.; software, G.L.; validation, G.L., D.C.; formal analysis, G.L.; investigation, G.L., D.C.; resources, G.L., D.C.; data curation, G.L., D.C.; writing—original draft preparation, D.C.; writing—review and editing, G.L., D.C.; visualization, G.L., D.C.; supervision, D.C.; project administration, D.C.; funding acquisition, D.C. Both authors have read and agreed to the published version of the manuscript.

Funding

This work was supported by the research grant of Pai Chai University in 2021.

Conflicts of Interest

The authors declare no conflict of interest.

References

  1. Dhand, S.; Ashish, S.; Gurvinder, S.V. A brief review on human-powered lower-limb exoskeletons. In Proceedings of the Conference on Mechanical Engineering and Technology (COMET-2016), Varanasi, India, 15–17 January 2016; pp. 116–122. [Google Scholar]
  2. Ferris, D.P.; Bryan, R.S. Robotic devices to enhance human movement performance. Kinesiol. Rev. 2017, 6, 70–77. [Google Scholar] [CrossRef]
  3. Cha, D.; Kim, K.I. A lower limb exoskeleton based on recognition of lower limb walking intention. Trans. Can. Soc. Mech. 2019, 43, 102–111. [Google Scholar] [CrossRef]
  4. Gallagher, S.; Pollard, J.; Porter, W.L. Electromyography of the thigh muscles during lifting tasks in kneeling and squatting postures. Ergonomics 2011, 54, 91–102. [Google Scholar] [CrossRef] [PubMed]
  5. González-Vargas, J.; Ibánez, J.; Contreras-Vidal, J.L.; van der Kooij, H.; Pons, J.L. Wearable robotics: Challenges and trends. In Proceedings of the 2nd International Symposium on Wearable Robotics, WeRob2016, Segovia, Spain, 18–21 October 2016. [Google Scholar]
  6. Schiele, A. An explicit model to predict and interpret constraint force creation in phri with exoskeletons. In Proceedings of the 2008 IEEE International Conference on Robotics and Automation, Pasadena, CA, USA, 19–23 May 2008; pp. 1324–1330. [Google Scholar]
  7. Millard, M.; Sreenivasa, M.; Mombaur, K. Predicting the motions and forces of wearable robotic systems using optimal control. Front. Robot. AI 2017, 4, 41. [Google Scholar] [CrossRef] [Green Version]
  8. Bonilla, B.L.; Asada, H.H. A robot on the shoulder: Coordinated human-wearable robot control using coloured petri nets and partial least squares predictions. In Proceedings of the 2014 IEEE International Conference on Robotics and Automation (ICRA), Hong Kong, China, 31 May–7 June 2014; pp. 119–125. [Google Scholar]
  9. Song, G.; Huang, R.; Qiu, J.; Cheng, H.; Fan, S. Model-based control with interaction predicting for human-coupled lower exoskeleton systems. J. Intell. Robot. Syst. 2020, 100, 389–400. [Google Scholar] [CrossRef]
  10. Wu, G.; Wang, C.; Wu, X.; Wang, Z.; Ma, Y.; Zhang, T. Gait phase prediction for lower limb exoskeleton robots. In Proceedings of the 2016 IEEE International Conference on Information and Automation (ICIA), Ningbo, China, 1–3 August 2016; pp. 19–24. [Google Scholar]
  11. Dollar, M.; Herr, H. Lower Extremity Exoskeletons and Active Orthoses; Challenges and State-of-the-Art. IEEE Trans. Robot. 2008, 24, 144–158. [Google Scholar] [CrossRef]
  12. Olivier. Shiva Exo: Le Premier Exo-Squelette 100% Français Utilisé par Airbus Helicopters. 2019. Available online: https://www.journaldugeek.com/2019/04/13/shiva-exo-premier-exo-squelette-100-francais-sera-utilise-airbus-helicopters/ (accessed on 21 December 2020).
  13. SuitX. MAX (Modular Agile eXoskeleton). Available online: https://www.suitx.com/shoulderx (accessed on 5 January 2021).
  14. Ottobock. Paexo Back Exoskelett–Entlastung des Rückens–Ottobock Industrials. Available online: https://paexo.com/paexo-back/?lang=en (accessed on 5 January 2021).
  15. Ottobock. Support for the Logistics Sector: New Exoskeleton Offers Relief for the Back. Available online: https://www.ottobock.com/en/newsroom/news/paexo-back.html (accessed on 5 January 2021).
  16. Pesenti, M.; Antoneitti, A.; Gandolla, M.; Pedorocchi, A. Towards a functional performance validation standard for industrial low-back exoskeletons: State of the art review. Sensors 2021, 21, 808. [Google Scholar] [CrossRef] [PubMed]
  17. Kao, P.C.; Lewis, C.L.; Ferris, D.P. Invariant ankle moment patterns when walking with and without a robotic ankle exoskeleton. J. Biomech. 2009, 43, 203–209. [Google Scholar] [CrossRef] [PubMed] [Green Version]
  18. Jackson, R.W.; Collins, S.H. An experimental comparison of the relative benefits of work and torque assistance in ankle exoskeleton. J. Appl. Physiol. 2015, 119, 541–557. [Google Scholar] [CrossRef] [PubMed] [Green Version]
  19. Lee, J.; Seo, K.; Lim, B.; Jang, J.; Kim, K.; Choi, H. Effects of assistance timing on metabolic cost, assistance power, and gait parameters for a hip type exoskeleton. In Proceedings of the 2017 International Conference on Rehabilitation Robotics (ICORR), London, UK, 17–20 July 2017; pp. 498–504. [Google Scholar]
  20. McGibbon, C.; Sexton, A.; Jayaraman, A.; Deems-Dluhy, S.; Fabara, E.; Adans-Dester, C.; Bonato, P.; Marquis, F.; Turmel, S.; Belzile, E. Evaluation of a Lower-Extremity Robotic Exoskeleton for People with Knee Osteoarthritis. Assist. Technol. 2021. [Google Scholar] [CrossRef] [PubMed]
  21. Toxiri, S.; Näf, M.B.; Lazzaroni, M.; Fernández, J.; Sposito, M.; Poliero, T.; Monica, L.; Anastasi, S.; Caldwell, D.G.; Ortiz, J. Back-Support Exoskeletons for Occupational Use: An Overview of Technological Advances and Trends. IISE Trans. Occup. Ergon. Hum. Factors 2019, 7, 237–249. [Google Scholar] [CrossRef] [Green Version]
  22. Di Lallo, A.; Yu, S.; Huang, T.-H.; Bulea, T.C.; Su, H. High-performance soft wearable robots for human augmentation and gait rehabilitation. Soft Robot. Rehabil. 2021, 1–38. [Google Scholar] [CrossRef]
  23. Bär, M.; Steinhilber, B.; Rieger, M.A.; Luger, T. The influence of using exoskeletons during occupational tasks on acute physical stress and strain compared to no exoskeleton—A systematic review and meta-analysis. Appl. Ergon. 2021, 94, 103385. [Google Scholar] [CrossRef] [PubMed]
  24. Asl, H.J.; Katagiri, K.; Narikiyo, T.; Yamashita, M.; Kawanishi, M. Augmenting human power by assistive robots: Application of adaptive neural networks. Control Eng. Pract. 2021, 110, 104769. [Google Scholar] [CrossRef]
  25. KSME. LEXO-WLhwp. Available online: ksme.or.kr (accessed on 5 January 2021).
  26. Hastie, T.; Tibshirani, R. Generalized additive models. Stat. Sci. 1986, 1, 297–310. [Google Scholar] [CrossRef]
  27. Ruppert, D.; Wand, M.P.; Carroll, R.J. Semiparametric Regression; Cambridge University Press: New York, NY, USA, 2003. [Google Scholar]
  28. Fahrmeir, L.; Kneib, T.; Lang, S.; Marx, B. Regression Models; Springer: New York, NY, USA, 2013. [Google Scholar]
  29. Wood, S. Generalized Additive Models: An Introduction with R, 2nd ed.; Chapman and Hall/CRC Press: Boca Raton, FL, USA, 2017. [Google Scholar]
  30. Wood, S. Fast stable restricted maximum likelihood and marginal likelihood estimation of semiparametric generalized linear models. J. R. Stat. Soc. Ser. B Stat. Methodol. 2011, 73, 3–36. [Google Scholar] [CrossRef] [Green Version]
  31. Wood, S. Mixed GAM Computation Vehicle with GCV/AIC/REML Smoothness Estimation. R Package Version, 1.8-35. Available online: https://cran.r-project.org/web/packages/mgcv (accessed on 22 February 2021).
  32. Vonesh, E.F.; Chinchilli, V.M. Linear and Nonlinear Models for the Analysis of Repeated Measurements; CRC Press: Boca Raton, FL, USA, 1997. [Google Scholar]
  33. Sullivan, L.; Weinberg, J.; Keaney, J. Common Statistical Pitfalls in Basic Science Research. J. Am. Heart Assoc. 2016, 5, e004142. [Google Scholar] [CrossRef] [PubMed]
  34. Hand, D.; Taylor, C. Multivariate Analysis of Variance and Repeated Measures; Chapman and Hall: London, UK, 1987. [Google Scholar]
  35. Crowder, M.J.; Hand, D. Analysis of Repeated Measures; Chapman and Hall: London, UK, 1990. [Google Scholar]
  36. Liu, C.; Cripe, T.P.; Kim, M.O. Statistical issues in longitudinal data analysis for treatment efficacy studies in the biomedical sciences. Am. Soc. Gene Cell Ther. 2010, 18, 1724–1730. [Google Scholar] [CrossRef] [PubMed]
  37. Hirotsu, C. An Approach to Comparing Treatments Based on Repeated Measures. Biometrika 1991, 78, 583–594. [Google Scholar] [CrossRef]
Figure 1. LEXO-W [25]. Reprinted with permission from ref. [25]. Copyright 2021 LIG Nex1.
Electronics 10 01006 g001
Figure 2. Not equipped with the LEXO-W without any load.
Electronics 10 01006 g002
Figure 3. Not equipped with the LEXO-W with a 15 kg load.
Electronics 10 01006 g003
Figure 4. Equipped with the LEXO-W with a 15 kg load.
Electronics 10 01006 g004
Figure 5. Box and whisker plots (median, first and third percentiles, range) display the lap times over the number of round trips in three groups. (a) Not equipped with the LEXO-W without a 15 kg load (baseline group); (b) not equipped with the LEXO-W with a 15 kg load (load-carrying group); (c) equipped with the LEXO-W with a 15 kg load (robot-assisted group).
Electronics 10 01006 g005aElectronics 10 01006 g005b
Figure 6. Result of post hoc comparisons. p-values (ns: *:p > 0.05; **: p ≤ 0.05; ***: p < 0.001; ****: p < 0.0001).
Electronics 10 01006 g006
Figure 7. Scatterplot and fitted line plot with confidence intervals.
Electronics 10 01006 g007
Table 1. General characteristics of the subjects.
AgesHeight (cm)Weight (kg)BMI (kg/m2)
Mean21.7176.872.023.03
SD1.063.619.722.81
Min201736119.3
Max231839227.5
Table 2. Descriptive statistics: mean and standard deviation (SD) values of lap times.
GroupThe Number of Round TripsTotals
12345678910
baseline group7.6
(0.77)
8.2
(1.04)
8.4
(0.81)
8.3
(0.63)
8.7
(0.65)
8.8
(0.85)
8.9
(0.94)
8.8
(1.06)
8.8
(0.98)
8.8
(0.99)
8.52
(0.94)
load-carrying group8.3
(1.44)
9.03
(1.14)
9.67
(1.25)
10.1
(1.46)
11.0
(1.69)
11.5
(1.86)
12.0
(2.37)
13.4
(2.80)
14.8
(4.80)
18.6
(5.30)
11.7
(3.78)
Robot-assisted group13.6
(1.58)
16.4
(3.21)
17.3
(3.37)
17.9
(2.82)
17.7
(3.43)
18.6
(3.78)
18.9
(4.17)
18.8
(3.33)
19.0
(4.17)
18.9
(4.63)
17.7
(3.73)
Table 3. The results of two-way repeated measured ANOVA.
SourceSSDFMSFp-Value
group433322166.333.740.000 ***
number633.1970.3430.590.000 ***
Group × number354.41819.6877.960.000 ***
*** significant with alpha 0.001.
Table 4. Statistical fit by root mean square error (RMSE), generalized cross-validation (GCV), and adjusted R-square error.
SourceRMSEGCVR2adj
Simple Linear Regression1.0070.1000.111
Generalized Additive Model0.9780.0980.131
Publisher’s Note: MDPI stays neutral with regard to jurisdictional claims in published maps and institutional affiliations.

