Article

A Distributed Edge-Based Scheduling Technique with Low-Latency and High-Bandwidth for Existing Driver Profiling Algorithms

Department of Electronic Engineering, Inha University, Incheon 22212, Korea
*
Author to whom correspondence should be addressed.
Electronics 2021, 10(8), 972; https://doi.org/10.3390/electronics10080972
Submission received: 15 March 2021 / Revised: 8 April 2021 / Accepted: 16 April 2021 / Published: 19 April 2021
(This article belongs to the Special Issue Real-Time Control of Embedded Systems)

Abstract

:
The gradual increase in latency-sensitive, real-time applications for embedded systems encourages users to share sensor data simultaneously. Streamed sensor data have deficient performance. In this paper, we propose a new edge-based scheduling method with high-bandwidth for decreasing driver-profiling latency. The proposed multi-level memory scheduling method places data in a key-value storage, flushes sensor data when the edge memory is full, and reduces the number of I/O operations, network latency, and the number of REST API calls in the edge cloud. As a result, the proposed method provides significant read/write performance enhancement for real-time embedded systems. In fact, the proposed application improves the number of requests per second by 3.5, 5, and 4 times, respectively, compared with existing light-weight FCN-LSTM, FCN-LSTM, and DeepConvRNN Attention solutions. The proposed application also improves the bandwidth by 5.89, 5.58, and 4.16 times respectively, compared with existing light-weight FCN-LSTM, FCN-LSTM, and DeepConvRNN Attention solutions.

1. Introduction

Over the years, deep learning algorithms have revolutionized the autonomous car industry by achieving higher accuracy and performance for the comfort of people. However, there is an end-to-end latency issue owing to the need for a higher level of computational resources when autonomous cars simultaneously request driver profiling. Edge computing enables driver-profiling services to reduce the end-to-end latency by providing services to users closer their vicinity. If resources are exhausted in edge computing, service migration must be performed seamlessly to fulfill requirements of the user. However, the ultimate answer will be offloading such services using edge-based solutions. In this paper, we propose a new in-memory data scheduling technique to provide locality awareness for real time execution and fulfillment of users/client (embedded systems) requirements. The data scheduling technique is aimed at decreasing end-to-end latency. In addition, a novel architecture is proposed to deploy a deep learning framework for driver profiling inside the edge server with lower latency, despite a higher number of responses to requests.
The following are the key contributions of this study:
  • We present a new architecture for driver-profiling with deep learning techniques in cars with embedded system.
  • We achieve a greater number of responses from a driver profiling service.
  • We successfully re-implement all the algorithms in an edge server environment.
  • We conduct extensive experiments to confirm the advantages of our approach.
The remainder of the paper is structured as follows. We review background information and related work in Section 2. Section 3 presents driver profiling fundamentals. Section 4 presents detailed experimental results from our approach. We provide conclusions in Section 5.

2. Related Work

Driver behavior profiling using driving features is an emerging trend for multiple markets, such as traffic safety, user-based insurance, and monitoring. In this regard, it is one of the fertile areas of research containing ample studies. In this section, we describe the existing research in two major categories: machine learning models and applied platforms.

2.1. Existing Driver-Profiling Deep Learning Models

Studies dealing with the modeling of individual driver activities use many state-of-the-art machine learning algorithms. These include statistical classification techniques such as the decision tree, random forest, K-nearest neighbors [1], hidden Markov model [2], Gaussian mixture model [3], K-means [4,5], support vector machine (SVM) [5], and many others. However, many of them have various shortcomings, such as data dependence and working under only specific conditions, which are overcome by the vigorous nature of deep learning algorithms [6] having a more significant advantage in feature learning. Scalar data from driving information can be considered a spatiotemporal task because it involves feature extraction per sample (spatial features) as well as includes temporal information, such as the relationships of the samples over time. However, in some studies, a convolutional neural network (CNN) was employed in individual time series to capture local dependencies along temporal dimensions of sensor signals for similar applications, such as action recognition [7]. However, state-of-the-art research offered promising results by using the combination of a CNN (for spatial feature extraction) and long short-term memory (for temporal feature extraction) for driver identification [6,8] and behavior analysis [9,10]. In this research, we compared the proposed architecture with state-of-the-art deep learning algorithms for driver identification, such as the DeepConvRNN [6], and FCN-LSTM [8]. The proposed architecture uses a lightweight FCN-LSTM [11] model with network pruning and offers sparse learning for new classes.

2.2. Applied Embedded Deep Learning Platforms

To deploy driver behavior-profiling models for real-time applications, there are various options, such as a smartphone integrated with the vehicle (e.g., Automotive Grade Linux (AGL) [8,12]), in-vehicle dedicated embedded computers, such as an Advanced Driver-Assistance System (ADAS) [13], cloud- or edge-based services in connected car ecosystems [14], etc. There are many dedicated embedded system solutions available in the market providing energy-efficiency and low -power profile, such as Intel Movidius (Neural Compute Stick -I, -II), Raspberry Pi 3+, and the NVIDIA Jetson series (e.g., Nano, TX1, TX2, and Xavier) replete with high-speed GPUs. Among these, the NVIDIA Jetson series is most favorable because it offers a wide range of developer kits (CudaToolkit, CuDNN) with various specifications. Jetson series provides energy efficiency (low power consumption), less weight, a compact form factor, high performance per watt, and low-power GPU cores [15]. As per comparative studies [16], the Jetson series offers higher peak performance than Raspberry Pi 3+ and Intel Movidius. In this regard, we opted for the Jetson series, implementing the proposed driver behavior identification on a Jetson nano as a client.
In Figure 1, we illustrated the existing EDPA architecture including an interaction diagram, a client and server communication model, and two detailed client and server latency charts. Moreover, Algorithm 1 shows the pseudo-code of the traditional EDPA predicting the driver class using client and server functions. On Lines 1-5, the EDPA-client( ) function first initializes the configurations, reads data from sensors, and then stores data in memory ( d a t a [ K ] ). Then, the client EDPA function calls a deep learning service named EDPA-server( ), which is initialized by the allocated sensor data, d a t a [ K ] , in memory. As a result, the EDPA-server( ) function returns the driver class, the execution time, and the accuracy of the driver profiling as a prediction on Line 4. Finally, on Line 5, the EDPA-client( ) function visualizes the prediction data in the embedded car interface. To be more specific, the EDPA-server( ) function is described on Lines 7–12, where it configures TensorFlow for predictions, and re-allocates sensor data on Lines 7–8. Consequently, the EDPA-server( ) function loads the trained model into TensorFlow on Line 10.
Algorithm 1: The traditional EDPA [6,8,11]
Electronics 10 00972 i001
Table 1 lists the parameters used in this paper, along with their symbols, representations, and ranges of usage. The end-to-end prediction latency in the proposed EDPA, E D P A l a t e n c y , is as follows:
EDPA l a t e n c y = T S 2 + T S 4 + T S 5 + T S + T S 3 ,   a n d   T S > T S 2 > T S 4 > T S 3 > T S 5
The total prediction latency in the proposed EDPA using the EDPA-server() function, T S , is as follows:
T S = T S 5 + T S 4 + T S 6 ,   a n d   T S 4 > T S 5 > T S 6

3. Edge-Based Data Scheduling for FCN-LSTM Driver Profiling

In this study, we only focused on edge-based solutions in order to provide uninterrupted services when the number of requests increases at the edge server. In this scenario, the client will call the driver-profiling API service and will exit accordingly. In the traditional platforms, for every API call, all the deep learning libraries (TensorFlow, etc.) and models (driver profiling model file h 5 , frozen graphs, etc.), will be loaded beforehand in order to execute particular deep learning applications. In the proposed platform, driver-profiling calls are separately managed, and the loading and pre-processing time will be consumed for every single call. In addition, a traditional solution is also computationally expensive, such that it consumes resources that cost the users embedded resource-sensitive computations every time for loading the necessary dependencies and deep learning models for inferences.
The computation power of edge computing services has been revolutionized along with a very high capacity for computations, databases, and flexible services. In our proposed architecture, deep learning services are handled using a distributed architecture based on in-memory caching for sensor data. In this regard, we used the proposed edge-based data scheduling architecture, as shown in Figure 2.
Algorithm 2 shows the pseudo-code of the proposed EDPA for predicting the driver class using distributed client/server functions. First, each E D P A c l i e n t ( ) function initializes the configurations and checks the server, and, if the server function was already activated, it is passed to the next line. In contrast, if the server function was not activated, the client will activate the server function using a REST API call. In the next step, iteratively on Lines 4–10, the client function reads data from the sensors and stores the data in memory as j o b d a t a . Then, the client function saves j o b d a t a to in-memory cache on Line 6. Later, after a fixed delay, the client function calls EDPA-server( ), which is initialized by the allocated sensor data, j o b i d , on Line 8. As a result, EDPA-server( ) returns the driver class, the execution time, and the accuracy of driver profiling as prediction on Line 8. Finally, EDPA-client( ) visualizes the prediction data in the embedded car interface on Line 9 for the given time series-based data sensors. The proposed distributed EDPA-server( ) function is described on Lines 12–23, where EDPA_server( ) initializes the configurations of TensorFlow for the prediction, and then loads the in-memory data scheduler on Line 14. Consequently, EDPA-server( ) loads the trained model only once for each Node.js worker in TensorFlow on Line 15. In the next step, iteratively on Lines 4–10, the server function reads data by requesting the prediction job from in-memory cache and stores the data in j o b d a t a . Then, the driver profiling function updates the prediction data for the given j o b i d by calling the u p d a t e _ p r e d i c t i o n function developed for in-memory cache on Line 19. Finally, the EDPA-server( ) call calculates the statistics of the prediction data for the given embedded car interface on Line 21 and updates the statistical data of the in-memory cache on Line 22.
Algorithm 2: The proposed EDPA
Electronics 10 00972 i002
The end-to-end prediction latency in the proposed EDPA, E D P A l a t e n c y , is as follows:
E D P A l a t e n c y = T S 1 + T S 2 + T S + T S 3 ,   a n d   T S > T S 1 > T S 3 > T S 2
The total prediction latency in the traditional EDPA using the EDPA-server() function, T S , is as follows:
T S = T S 1 + T S 2 + T S 3 + T S 4 ,   a n d   T S 2 > T S 3 > T S 4 > T S 1

In-Memory Data Scheduler

Key-value (KV) stores are suitable for latency-sensitive internet services, and they have been widely used in large-scale data-intensive internet applications [17]. High demand from users has increased the need for fast read/write performance in accessing databases [18,19,20]. Sensor-based key-value data consist of many small files, which create a latency bottleneck from low I/O performance in the system [17,21].
As shown in Figure 3 and Algorithm 3, the proposed in-memory data scheduler provides multi-level buffering (MLB) and a flushing flowing-down mechanism, which incurs significant write performance enhancement and makes the KV items move much faster by performing the pipelining process at the edge level. The proposed in-memory data scheduler is suitable for both put-intensive workloads and scan-intensive data analysis workloads and, thus, can be used as the back-end storage engine for edge storage systems. A three-level memtable architecture was designed for the proposed in-memory data scheduler. Memtables and key-value sensor data are constructed using two of linked list (1) and linked list (2) data structures.
In Algorithm 3, F l u s h ( ) function applies on KV items which are sequenced in advance. KV items are copied at certain intervals (the flush size) to each memtable level. KV items are queued in sequence (flush size = MAX). Each KV item’s related meta information is stored in MTMemtable, describing how sensor data are stored in the memtable. A recovery mechanism is needed when the system suffers a sudden power-off, losing all the in-buffer KV items. Therefore, data stored in memtables are flushed to the Cassandra database at each checkpoint. Based on the methods described in [22,23,24], in-memory schedulers such as Redis have a much lower read write latency compared to the other KV database such as Cassandra and Leveldb. Therefore, in the proposed in-memory scheduler, linked list(1) and (2) in-memory structures play the role of the cache system, which accelerates the read and write performs and sharply reduces the latency of the data scheduler.
Algorithm 3: Data scheduling in Insert_cache function
Electronics 10 00972 i003

4. Experimental Results

In this section, we evaluate the performance of the proposed low-latency distributed driver behavior-detection system. The system detects five types of driving behaviors through multi-class classification. We used an array unison shuffle technique to randomly shuffle samples of all five classes. Then, we divided the dataset into two non-overlapping sets, including 75% for a training set and 25% for a test set. We experimented with various CNN configurations, including different filter sizes, numbers of convolutional layers, and numbers of filters, to achieve a simple yet efficient network. Moreover, we experimented with a CNN configuration to achieve a model with low computational costs and high efficiency, which is appropriate for embedded applications.
The proposed edge-based driver profiling application (EDPA) was compared to existing EDPAs in terms of the deep learning algorithm (DA), the data scheduling technique (DST), the service architecture type (SAT), the request-handling level (RHL), the scalability level (SL), and end-to-end latency (EEL), as shown in Table 2.

4.1. Data Sources

Driving features can be extracted using various sources, mainly using in-vehicle sensor data and smartphone sensor data. In [1,4,6,8,25,26], the authors exploited CAN-Bus data for identification of drivers using footprint. CAN-BUS (OBD-II protocol) communication data include parameters related to (1) the engine (coolant temperature, friction torque, etc.), (2) fuel (long-term fuel trim bank, fuel consumption, etc.), and (3) the transmission (wheel velocity, transmission oil temperature, etc.). Similarly, in other studies, [27,28,29], smartphone sensor data is used for driver behavior profiling and various other applications [30]. Smartphones can provide speed, acceleration, rotation rates, and other parameters for driver behavior profiling. Conversely, some researchers exploit hybrid approaches by combining vision (cameras) and other sensors (LiDAR, GPS, IMU, etc.) for driver profiling [9,10,31]. Besides, few studies included physiological sensor data to classify distracted drivers [32]. CAN-BUS is the most favorable and reliable candidate among the data sources mentioned above [4]. Among various CAN-BUS datasets, a security dataset [1] provides up to 51 features captured from CAN-BUS, and has been used by several researchers recently for driver identification [6,8,11]. The authors of [1] further shortlisted 15 features out of 51 features of CAN bus using InfoGainAttributeEval evaluation method, previously implemented by Weka [33], which is one of the ranker search methods. These 15 features include “Long Term Fuel Trim Bank1”, “Intake air pressure”,“Accelerator Pedal value”, “Fuel consumption”, “Torque of friction”, “Maximum indicated engine torque, Engine torque”, “Calculated LOAD value, Activation of Air compressor”, “Engine coolant temperature, Transmission oil temperature”, “Wheel velocity front left-hand”, “Wheel velocity front right-hand”, “Wheel velocity rear left-hand”, and “Torque converter speed”. In this paper, we targeted the same set of aforementioned features, previously utilized by several researchers for driver identification [1,6,8,11]. In this regard, our input size of time series is 15 (features) × 60 (Window size Wx, as mentioned in Table 2). Subsequently, Algo1 receives multivariate time-series data while Algo2 and Algo3 further process both uni-variate and multivariate time series data by shuffling the dimensions, as depicted in Figure 4a,b.

4.2. Hardware Settings

The specifications of the Jetson Nano client used in embedded systems in cars and the edge server (such as the domain, platform, hardware specifications, and implementation details) are shown in Table 3. In addition, we illustrate the proposed distributed EDPA prototype in Figure 5. As shown in Figure 5, the proposed EDPA Edge Server can connect to four embedded systems in cars and, at the same time, uses four Node.js workers. This is because, edge server run the Node.js Application has multiple limitation such as the number of CPU cores, the number of thread, the size of memory, and the number of Node.js workers. Based on our edge server specification described in Table 3, we can support only four Node.js workers but, if, we use an edge server with higher number of the cores and memory size, we might be able to achieve a higher number of Node.js workers and autonomous cars. The performance of proposed EDPA for each autonomous cars does not depend on the number of workers because of we dedicate to each Node.js worker one autonomous car. Furthermore, if the number of worker increases or decreases we can dedicate less or more autonomous cars into edge server. However, the average overall performance may increase or decrease for a higher or lower number of dedicated autonomous cars.

4.3. Evaluation of Driver Profiling

We performed extensive experiments on the driver profiling algorithms, comparing specifications such as accuracy, FLOPs(floating-point operations per second), memory usage, feature engineering, and windowing size, while training models for Algo1, Algo2, and Algo3 in Table 4. We performed the experiment for the proposed EDPA using three mentioned driver profiling algorithms [6,8,11]. Algo1 and Algo2 algorithms require feature engineering using moving standard deviation, mean, and median, whereas Algo3 algorithm directly normalizes raw features correspondingly. In Table 4, Wx denotes as time series size, and dx denotes as the shift between consecutive sliding window. In addition, the existing driver profiling algorithms require a 60 s window (time steps) for inferring the driver identity. Table 4 proves that the traditional and proposed EDPA architecture similar accuracy, FLOPSs and memory consumption for three driver profiling algorithms, while we tried to improve the latency and bandwidth in the proposed EDPA. Driver profiling latency and the number of requests per second are listed in Table 5. The traditional and the proposed E D P A B W for the existing driver profiling algorithms are listed in Table 6. The proposed EDPA uses applied to the three existing driver profiling algorithms [6,8,11] to train the models in the proposed EDPA. To increase the number of requests per second, we implemented the lightweight FCN_LSTM, which employs sparse learning. Each request defines as a driver profiling classification call. The number Node.js worker handing the driver profiling requests may increases if we use an edge server with higher number of the cores and memory size. The average E D P A l a t e n c y is calculated using the following formula:
A v e r a g e E D P A l a t e n c y = T o t a l E D P A l a t e n c y T h e n u m b e r o f r e q u e s t s p e r s e c o n d ( R e q / S e c )
Moreover, the average bandwidth E D P B W is calculated using the following formula for n input data frames and k clients:
A v e r a g e E D P A B W = i = 1 k j = 1 n ( S i z e o f i n p u t d a t a f r a m e ) + ( S i z e o f t h e p r e d i c t i o n d a t a ) T o t a l E D P A l a t e n c y
The advantages of the proposed EDPA based on the experimental results are highlighted as follows:
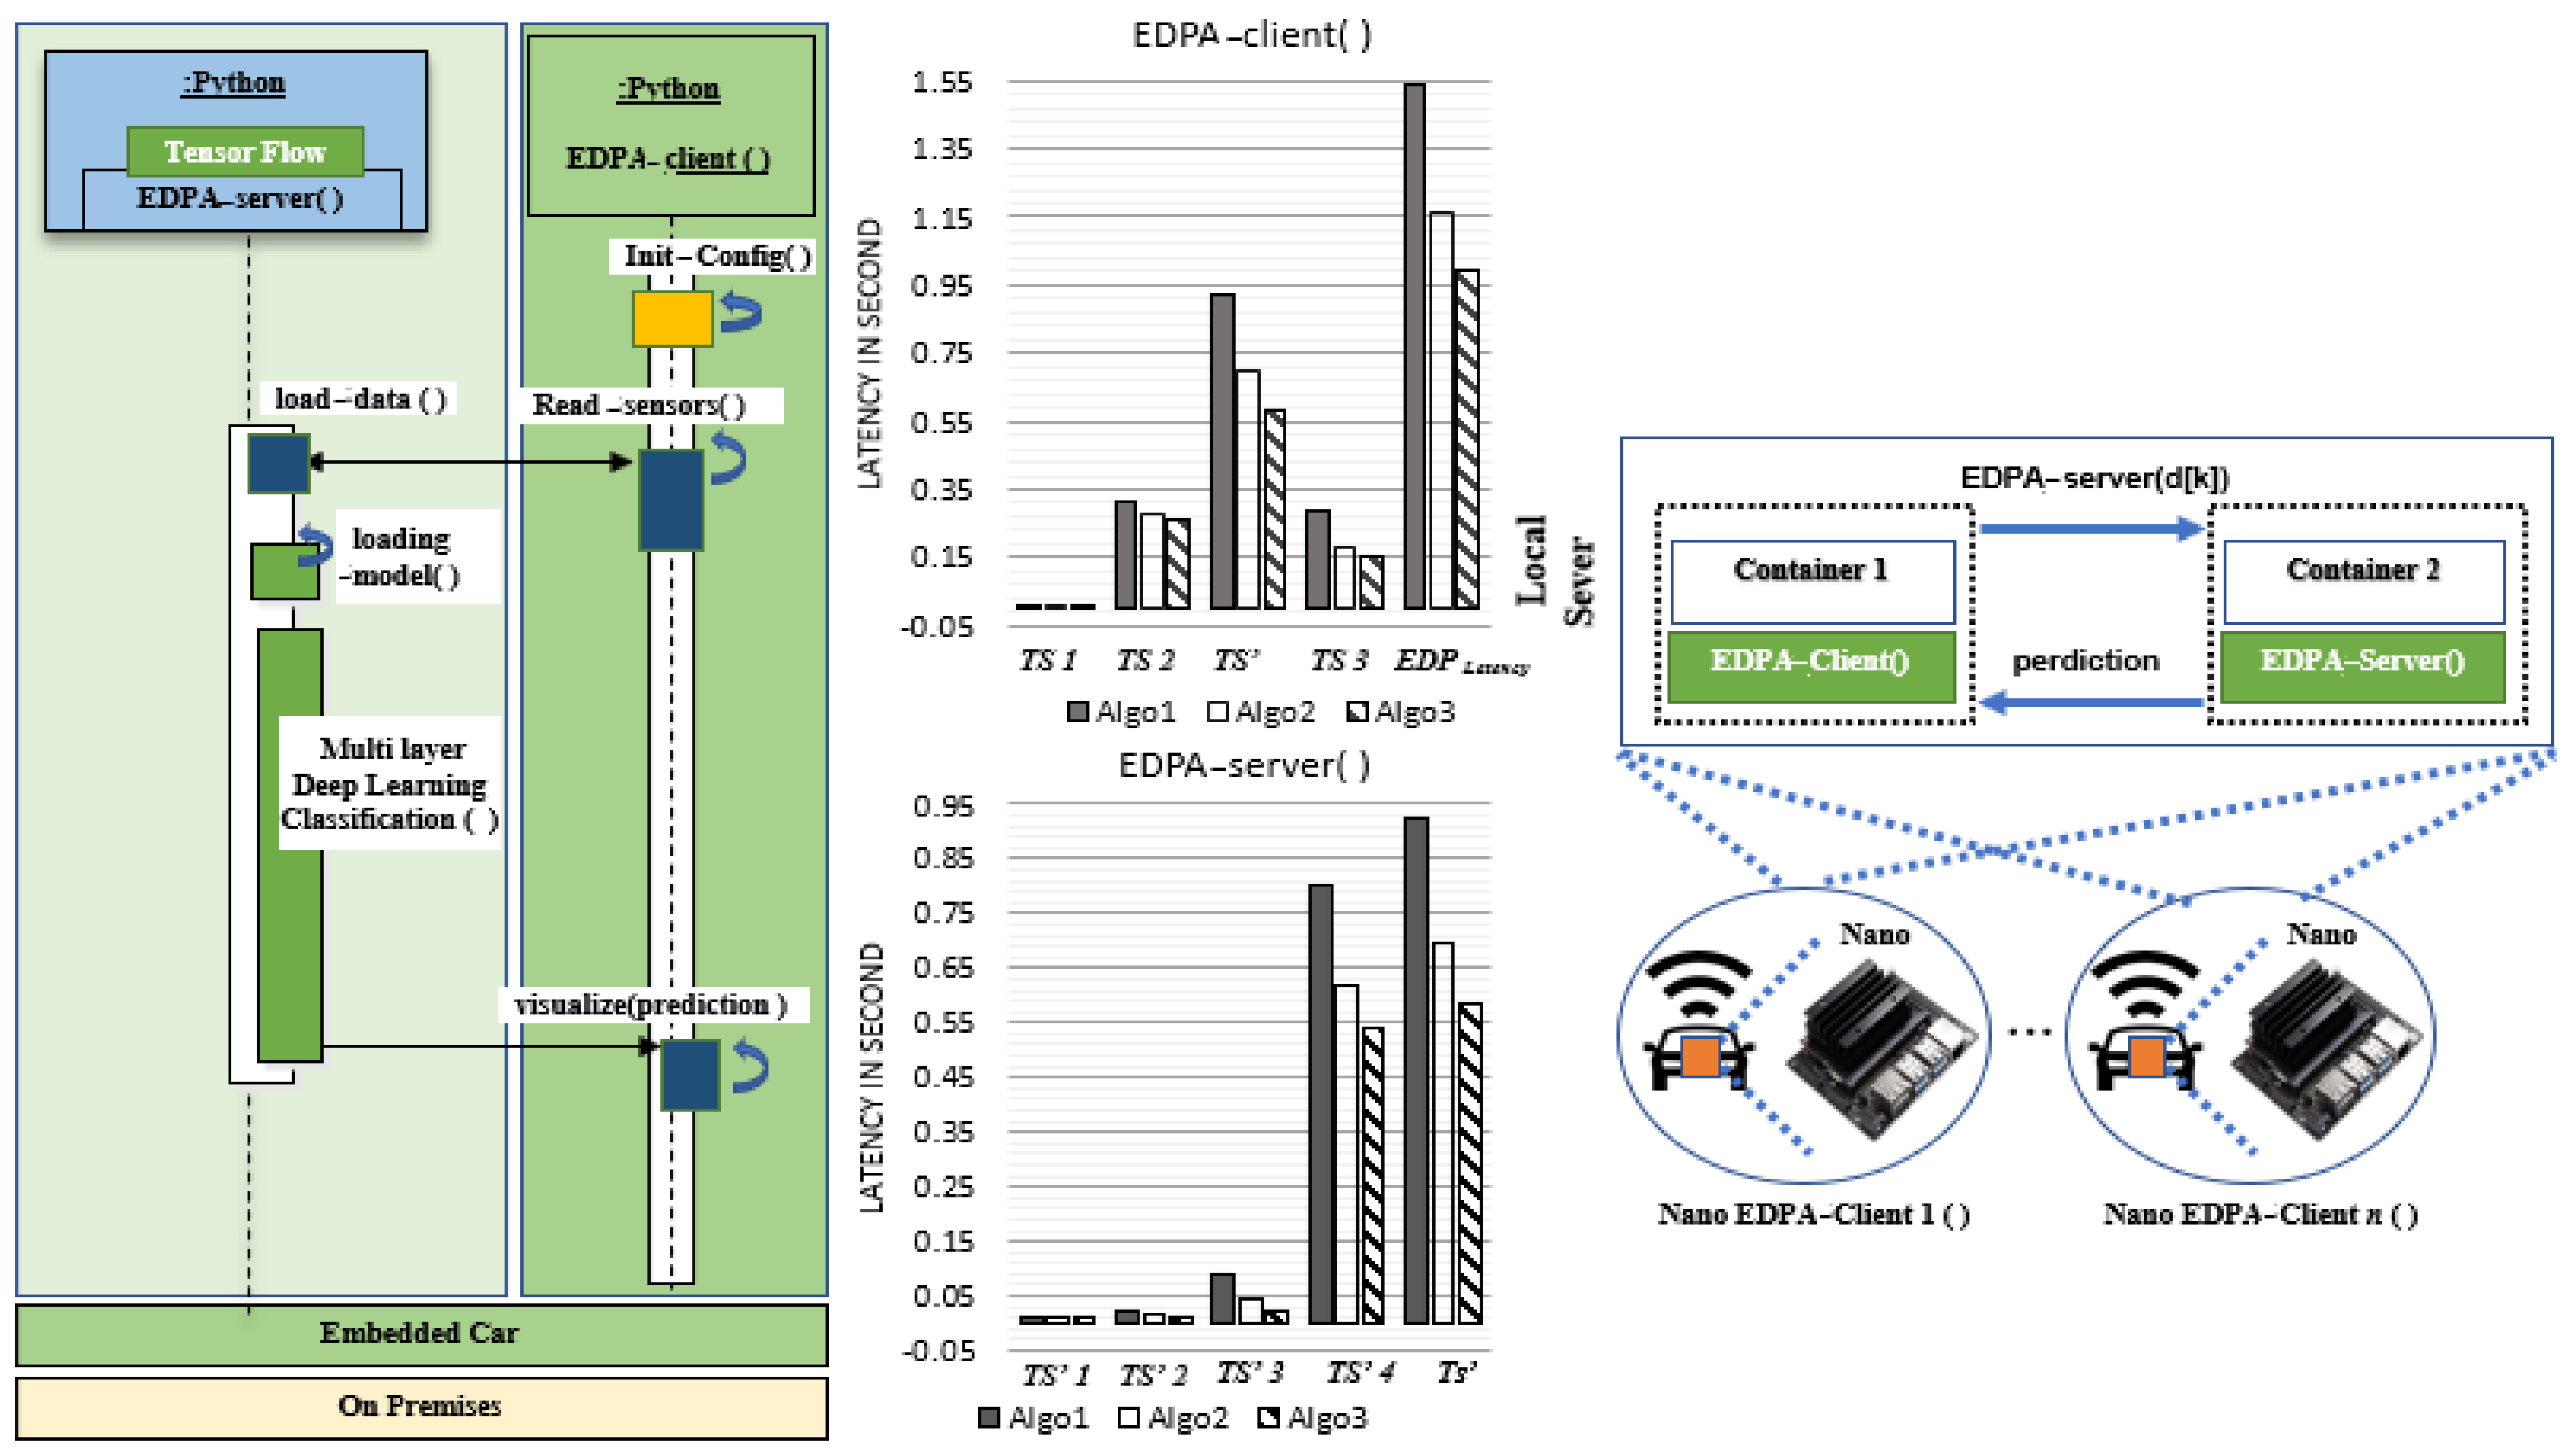
  • In the traditional EDPA, EDPA-Client( ) and EDPA-Server( ) are located in different containers inside each Embedded Nano board, which clearly shows they have a 1:1 relationship. Therefore, in the traditional EDPA, Algorithm 1 does not have a loop structure in client/server, but Algorithm 2 does. In the proposed EDPA, Algorithm 2, EDPA-Server( ) uses Node.js applications which employ multiple workers in parallel which clearly show they are having 1:4 relationship. Besides, we can scale the number of Node.js applications using the load balancer. In the proposed EDPA-server function, initialization latency T S 1 , memory allocation latency T S 2 , and trained model loading latency T S 3 are excluded from end-to-end latency E D P A l a t e n c y , which results in improving and reducing the average E D P A l a t e n c y of the EDPA system.
  • The function driver_profiling employs the light-weight FCN-LSTM, which execute five requests per second.
  • The proposed EDPA-server function connects four embedded cars via the in-memory scheduler, and at the same time uses four Node.js workers.
  • The proposed EDPA-server function operates four Node.js workers in parallel.
  • Each proposed EDPA-client activates a Nodejs worker using the check_server REST API.
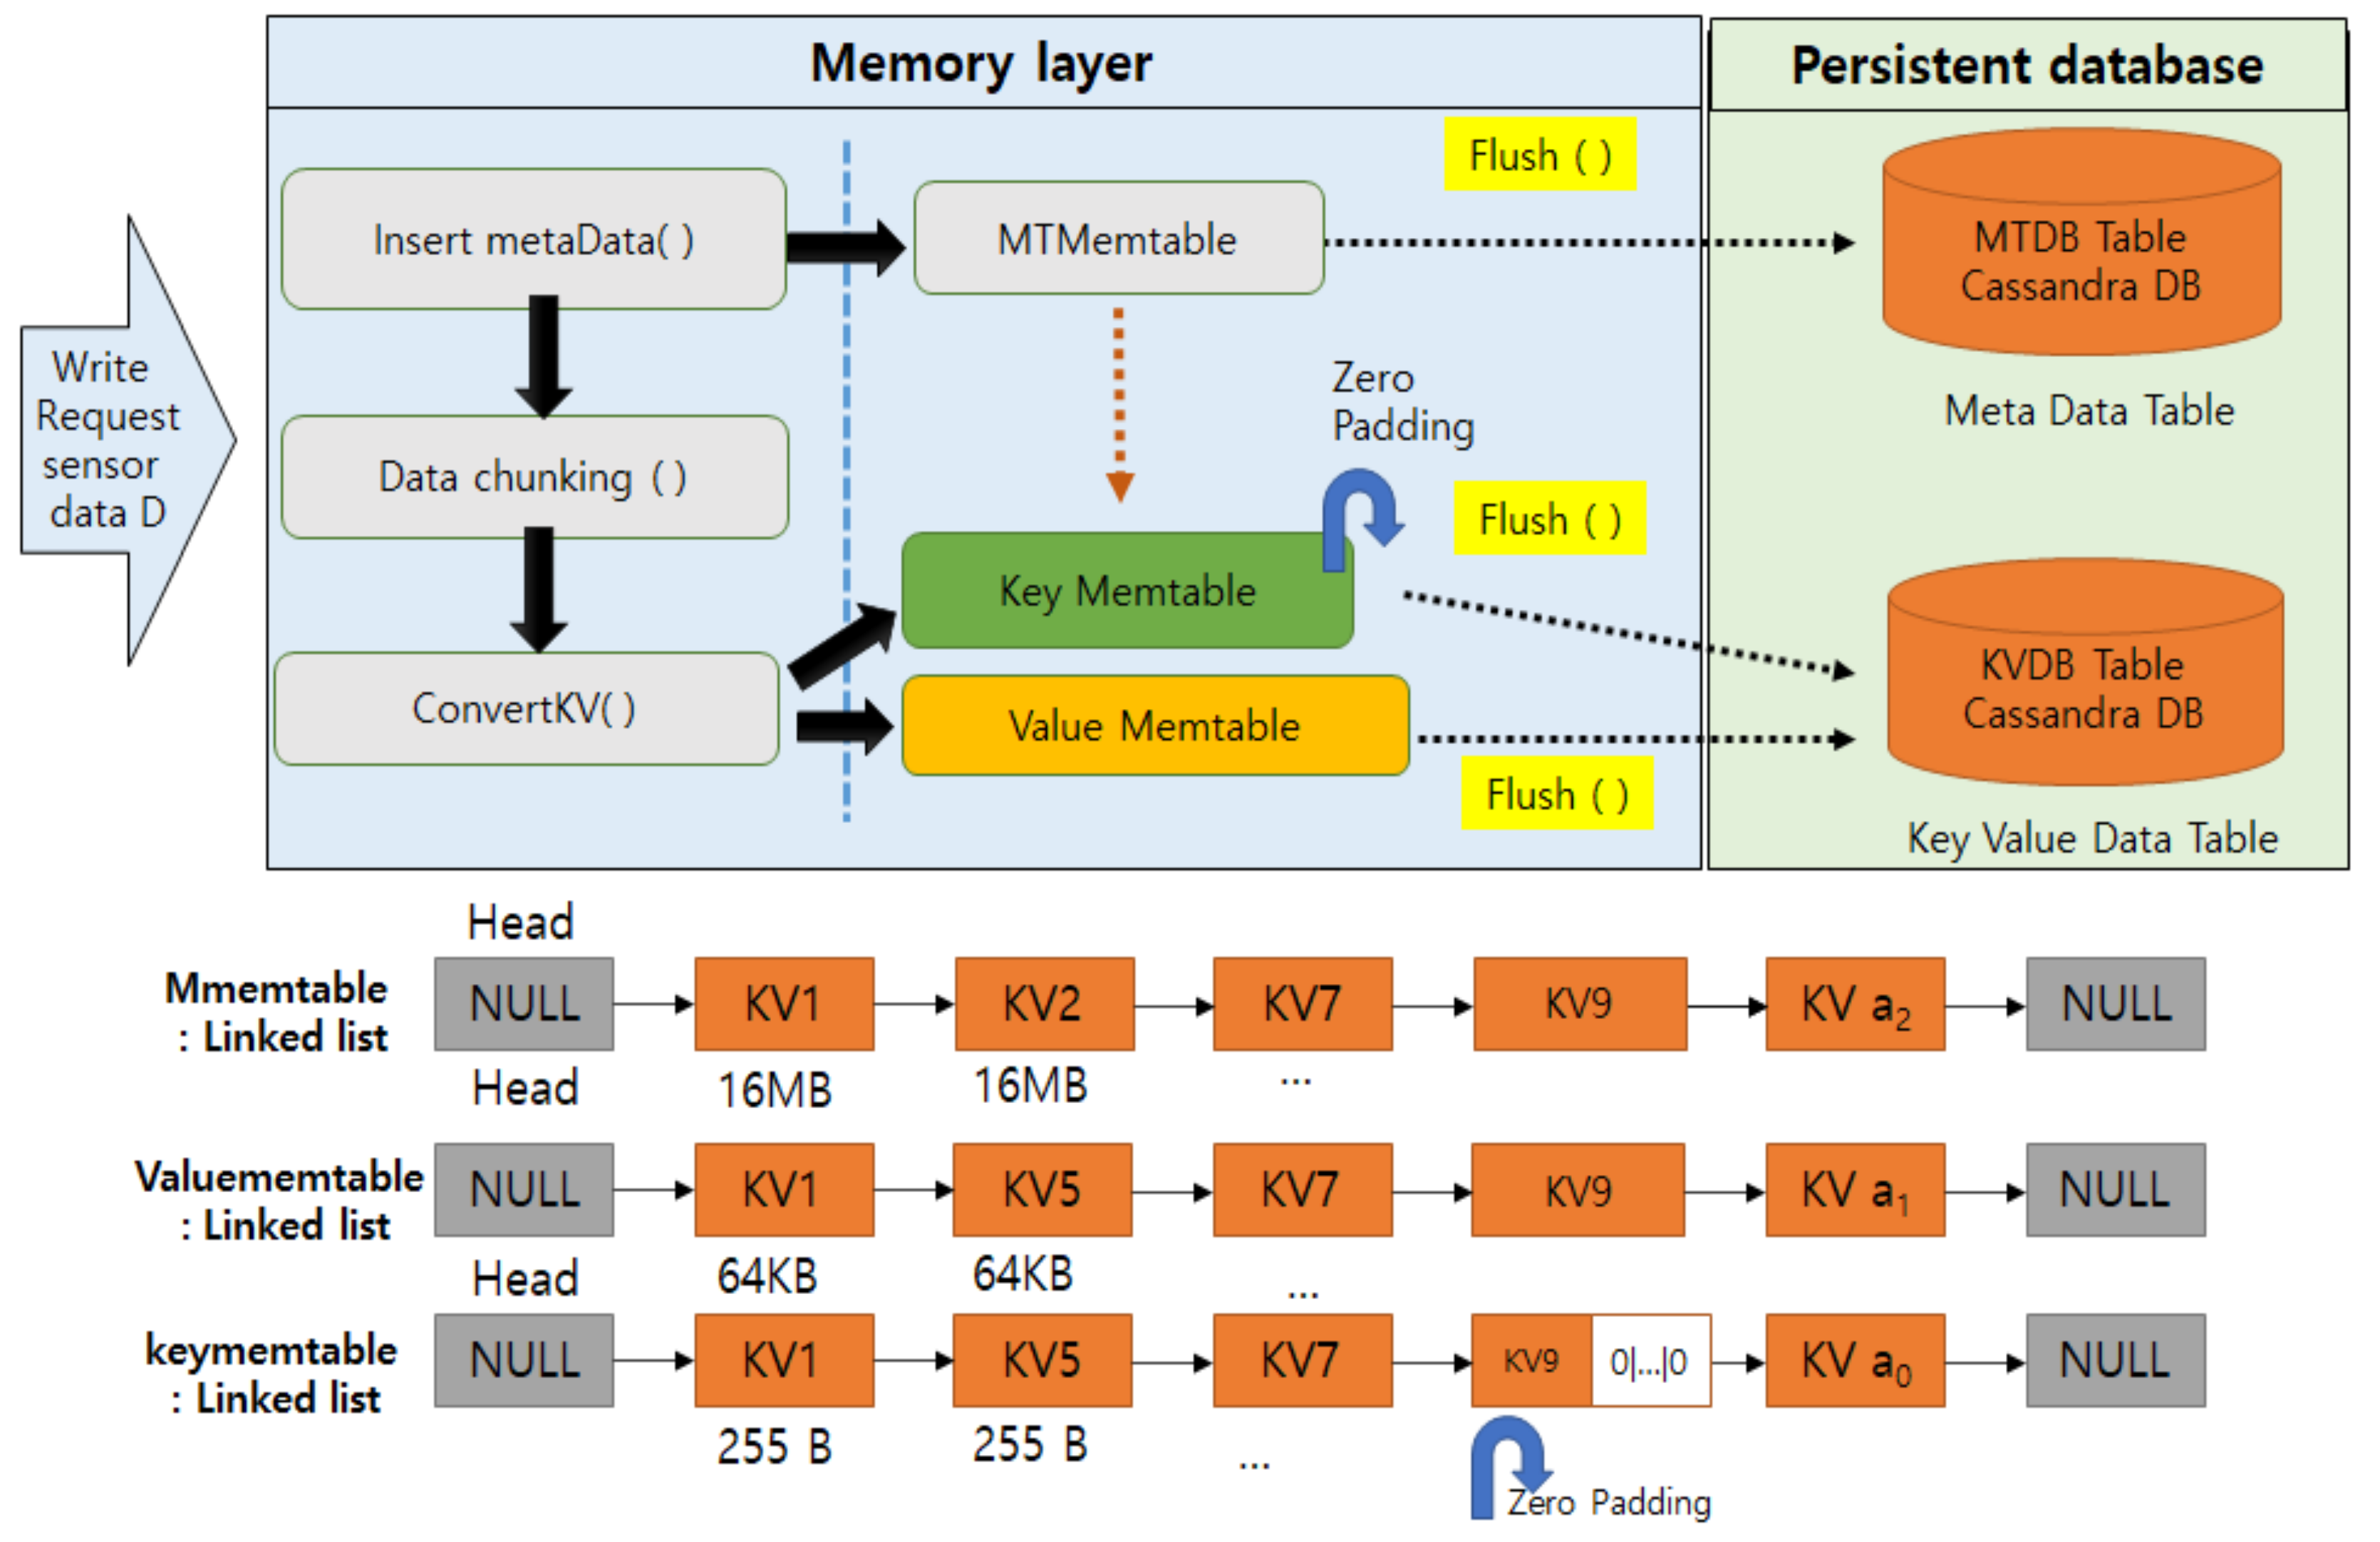
  • Each in-memory scheduler thread allocates key, value, and meta information related to each data sensor file using a linked-list structure in parallel.

5. Conclusions

In this study, we proposed a new method for put-intensive, edge-based data scheduling to decrease driver profiling end-to-end latency. The proposed in-memory scheduling stores sensor data in a key-value storage cache. The proposed memory scheduling reduces the number of I/O operations in the edge server by merging sensor data in memory using a linked-list structure. We achieved a greater number of responses for the driver profiling service. We successfully re-implemented all the algorithms in the edge server and conducted multiple experiments to verify the advantages of the proposed EDPA. The proposed application improves end-to-end latency and bandwidth significantly compared with traditional EDPA using the lightweight FCN-LSTM, DeepConvRNN, and FCN-LSTM deep learning algorithms.

Author Contributions

Conceptualization, M.P.; methodology, M.P.; software, M.P., S.U.; validation, M.P., S.U.; formal analysis, M.P., S.U.; investigation, M.P., D.-H.K.; resources, M.P., S.U.; data curation, M.P., S.U.; writing—original draft preparation, M.P.; writing—review and editing, M.P., S.U.; visualization, M.P.; supervision, M.P.; project administration, M.P., D.-H.K. All authors have read and agreed to the published version of the manuscript

Funding

This research was supported in part by Basic Science Research Program through the National Research Foundation of Korea (NRF) funded by the Ministry of Education (2020R1I1A1A 01053724) and in part by Basic Science Research Program through the National Research Foundation of Korea (NRF) funded by the Ministry of Education (2018R1D1A1B07042602) and in part by Institute for Information & communications Technology Promotion (IITP) grant funded by the Korea government (MSIT) (No.2019-0-00064, Intelligent Mobile Edge Cloud Solution for Connected Car).

Conflicts of Interest

The authors declare no conflict of interest.

References

  1. Kwak, B.I.; Woo, J.; Kim, H.K. Know your master: Driver profiling-based anti-theft method. In Proceedings of the 2016 14th Annual Conference on Privacy, Security and Trust (PST), Auckland, New Zealand, 12–14 December 2016; pp. 211–218. [Google Scholar]
  2. Zhang, X.; Zhao, X.; Rong, J. A study of individual characteristics of driving behavior based on hidden markov model. Sens. Transducers 2014, 167, 194–202. [Google Scholar]
  3. Miyajima, C.; Nishiwaki, Y.; Ozawa, K.; Wakita, T.; Itou, K.; Takeda, K.; Itakura, F. Driver modeling based on driving behavior and its evaluation in driver identification. Proc. IEEE 2007, 95, 427–437. [Google Scholar] [CrossRef]
  4. Fugiglando, U.; Massaro, E.; Santi, P.; Milardo, S.; Abida, K.; Stahlmann, R.; Netter, F.; Ratti, C. Driving behavior analysis through CAN bus data in an uncontrolled environment. IEEE Trans. Intell. Transp. Syst. 2018, 20, 737–748. [Google Scholar] [CrossRef] [Green Version]
  5. Van Ly, M.; Martin, S.; Trivedi, M.M. Driver classification and driving style recognition using inertial sensors. In Proceedings of the 2013 IEEE Intelligent Vehicles Symposium (IV), Gold Coast City, Australia, 23–26 June 2013; pp. 1040–1045. [Google Scholar]
  6. Zhang, J.; Wu, Z.; Li, F.; Xie, C.; Ren, T.; Chen, J.; Liu, L. A deep learning framework for driving behavior identification on in-vehicle CAN-BUS sensor data. Sensors 2019, 19, 1356. [Google Scholar] [CrossRef] [PubMed] [Green Version]
  7. Ha, S.; Choi, S. Convolutional neural networks for human activity recognition using multiple accelerometer and gyroscope sensors. In Proceedings of the 2016 International Joint Conference on Neural Networks (IJCNN), Vancouver, BC, Canada, 24–29 July 2016; pp. 381–388. [Google Scholar]
  8. El Mekki, A.; Bouhoute, A.; Berrada, I. Improving Driver Identification for the Next-Generation of In-Vehicle Software Systems. IEEE Trans. Veh. Technol. 2019, 68, 7406–7415. [Google Scholar] [CrossRef]
  9. Li, M.G.; Jiang, B.; Che, Z.; Shi, X.; Liu, M.; Meng, Y.; Ye, J.; Liu, Y. DBUS: Human Driving Behavior Understanding System. In Proceedings of the IEEE International Conference on Computer Vision Workshops, Seoul, Korea, 27–28 October 2019. [Google Scholar]
  10. Ramanishka, V.; Chen, Y.T.; Misu, T.; Saenko, K. Toward driving scene understanding: A dataset for learning driver behavior and causal reasoning. In Proceedings of the IEEE Conference on Computer Vision and Pattern Recognition, Salt Lake City, UT, USA, 18–23 June 2018; pp. 7699–7707. [Google Scholar]
  11. Ullah, S.; Kim, D.-H. Lightweight Driver Behavior Identification Model with Sparse Learning on In-Vehicle CAN-BUS Sensor Data. Sensors 2020, 20, 5030. [Google Scholar] [CrossRef] [PubMed]
  12. Automotive Grade Linux. 2020. Available online: https://www.automotivelinux.org/ (accessed on 18 April 2020).
  13. Brookhuis, K.A.; De Waard, D.; Janssen, W.H. Behavioural impacts of advanced driver assistance systems—An overview. Eur. J. Transp. Infrastruct. Res. 2001, 1. [Google Scholar] [CrossRef]
  14. Curry, E.; Sheth, A. Next-generation smart environments: From system of systems to data ecosystems. IEEE Intell. Syst. 2018, 33, 69–76. [Google Scholar] [CrossRef]
  15. Mittal, S. A Survey on optimized implementation of deep learning models on the NVIDIA Jetson platform. J. Syst. Archit. 2019, 97, 428–442. [Google Scholar] [CrossRef]
  16. Kim, C.E.; Oghaz, M.M.; Fajtl, J.; Argyriou, V.; Remagnino, P. A comparison of embedded deep learning methods for person detection. arXiv 2018, arXiv:1812.03451. [Google Scholar]
  17. Tulkinbekov, K.; Pirahandeh, M.; Kim, D.-H. CLeveldb: Coalesced leveldb for small data. In Proceedings of the 2019 Eleventh International Conference on Ubiquitous and Future Networks (ICUFN), Zagreb, Croatia, 2–5 July 2019; pp. 567–569. [Google Scholar]
  18. Song, T.G.; Pirahandeh, M.; Ahn, C.J.; Kim, D.H. GPU-accelerated high-performance encoding and decoding of hierarchical RAID in virtual machines. J. Supercomput. 2018, 74, 5865–5888. [Google Scholar] [CrossRef]
  19. Pirahandeh, M.; Kim, D.-H. Energy-aware RAID scheduling methods in distributed storage applications. Clust. Comput. 2019, 22, 445–454. [Google Scholar] [CrossRef]
  20. Pirahandeh, M.; Kim, D.-H. EGE: A New Energy-Aware GPU Based Erasure Coding Scheduler for Cloud Storage Systems. In Proceedings of the 2018 Tenth International Conference on Ubiquitous and Future Networks (ICUFN), Prague, Czech Republic, 3–6 July 2018; pp. 619–621. [Google Scholar]
  21. Pirahandeh, M.; Kim, D.-H. High performance GPU-based parity computing scheduler in storage applications. Concurr. Comput. Pract. Exp. 2017, 29, e3889. [Google Scholar] [CrossRef]
  22. Diogo, M.; Cabral, B.; Bernardino, J. Consistency models of NoSQL databases. Future Internet 2019, 11, 43. [Google Scholar] [CrossRef] [Green Version]
  23. Gupta, A.; Tyagi, S.; Panwar, N.; Sachdeva, S.; Saxena, U. NoSQL databases: Critical analysis and comparison. In Proceedings of the 2017 International Conference on Computing and Communication Technologies for Smart Nation (IC3TSN), Gurgaon, India, 12–14 October 2017; pp. 293–299. [Google Scholar]
  24. Kabakus, A.T.; Kara, R. A performance evaluation of in-memory databases. J. King Saud Univ. Comput. Inf. Sci. 2017, 29, 520–525. [Google Scholar] [CrossRef]
  25. Kang, Y.G.; Park, K.H.; Kim, H.K. Automobile theft detection by clustering owner driver data. arXiv 2019, arXiv:1909.08929. [Google Scholar]
  26. Park, K.H.; Kim, H.K. This Car is Mine!: Automobile Theft Countermeasure Leveraging Driver Identification with Generative Adversarial Networks. arXiv 2019, arXiv:1911.09870. [Google Scholar]
  27. Castignani, G.; Derrmann, T.; Frank, R.; Engel, T. Driver behavior profiling using smartphones: A low-cost platform for driver monitoring. IEEE Intell. Transp. Syst. Mag. 2015, 7, 91–102. [Google Scholar] [CrossRef]
  28. Kashevnik, A.; Lashkov, I.; Gurtov, A. Methodology and Mobile Application for Driver Behavior Analysis and Accident Prevention. IEEE Trans. Intell. Transp. Syst. 2019, 21, 2427–2436. [Google Scholar] [CrossRef]
  29. Warren, J.; Lipkowitz, J.; Sokolov, V. Clusters of driving behavior from observational smartphone data. IEEE Intell. Transp. Syst. Mag. 2019, 11, 171–180. [Google Scholar] [CrossRef]
  30. Ferreira, J.; Carvalho, E.; Ferreira, B.V.; de Souza, C.; Suhara, Y.; Pentland, A.; Pessin, G. Driver behavior profiling: An investigation with different smartphone sensors and machine learning. PLoS ONE 2017, 12, e0174959. [Google Scholar] [CrossRef] [PubMed]
  31. Fridman, L.; Brown, D.E.; Glazer, M.; Angell, W.; Dodd, S.; Jenik, B.; Terwilliger, J.; Kindelsberger, J.; Ding, L.; Seaman, S.; et al. Mit autonomous vehicle technology study: Large-scale deep learning based analysis of driver behavior and interaction with automation. arXiv 2017, arXiv:1711.06976. [Google Scholar]
  32. Taamneh, S.; Tsiamyrtzis, P.; Dcosta, M.; Buddharaju, P.; Khatri, A.; Manser, M.; Ferris, T.; Wunderlich, R.; Pavlidis, I. A multimodal dataset for various forms of distracted driving. Sci. Data. 2017, 4, 170110. [Google Scholar] [CrossRef] [PubMed] [Green Version]
  33. Hall, M.; Frank, E.; Holmes, G.; Pfahringer, B.; Reutemann, P.; Witten, I.H. The WEKA data mining software: An update. ACM SIGKDD Explor. Newsl. 2009, 11, 10–18. [Google Scholar] [CrossRef]
  34. Karim, F.; Mujamdar, S.; Darabi, H.; Chen, S. LSTM fully convolutional networks for time series classification. IEEE Access 2017, 6, 1662–1669. [Google Scholar] [CrossRef]
Figure 1. Existing EDPA architecture [6,8,11].
Electronics 10 00972 g001
Figure 2. The proposed edge-based data scheduling architecture.
Electronics 10 00972 g002
Figure 3. In-memory data scheduling implemented as insert_cache().
Electronics 10 00972 g003
Figure 4. (a) Algo3, Depthconv-RNN, Reprinted from ref. [11]; (b) Algo2, FCN-LSTM [8], Reprinted from ref. [34] (initially proposed for time-series classification) and (c) Algo1, DeepConvRNN-Attention [6].
Electronics 10 00972 g004
Figure 5. The prototype, including hardware and software settings of the proposed distributed EDPA.
Electronics 10 00972 g005
Table 1. Parameter notations.
SymbolRepresentationApplied Function
T S 1 Initialization latencyEDPA-client( )
T S 2 Read latency from sensorsEDPA-client( )
T S 3 Visualization latencyEDPA-client( )
T S 4 Insert data to cacheEDPA-client( )
T S 5 DelayEDPA-client( )
T S 1 Initialization latencyEDPA-server( )
T S 2 Memory allocation latencyEDPA-server( )
T S 3 Trained model loading latencyEDPA-server( )
T S 4 Driver profiling latencyEDPA-server( )
T S 5 Latency when requesting a jobEDPA-server( )
T S 6 Latency when updating predictionEDPA-server( )
T S Total classification latencyEDPA-client( )
E D P A l a t e n c y End-to-end latencyEmbedded system
Table 2. A summary of the related EDPA research.
EDPA ReferenceDADSTSATRHLSLEEL
Algorithm 1 [6]DeepConvRNN-Attention-Sequential processingLowLowLow
Algorithm 2 [8]FCN-LSTM-Sequential processingLowLowLow
Algorithm 3 [11]light-weight FCN-LSTM-Sequential processingLowLowMedium
This workFCN-LSTM,
DeepConvRNN-Attention,
light-weight FCN-LSTM
YesDistributed-Parallel processingHighHighHigh
Table 3. Specifications of embedded devices and edge servers.
DomainPlatformHardware SpecificationsImplementation Details
Edge ServerDesktopCPU: Intel Core.i7, RAM: 4 GB, NVME: 128 GBAn edge-Server
for four clients
Embedded systemJetson NanoCPU: ARM Cortex-A57, RAM: 4 GB, HDD: 128 GBA local server for a client *
* Note that Jetson Nano is only used for a traditional EDPA as a server function.
Table 4. Driver identification algorithms with their specifications.
InputAlgorithmAccuracy (%)FLOPs *MemoryFeature EngineeringWindowing
60 × 45Algo1 in the proposed EDPA97.721.524 M7.53 MBYesWx = 60, dx = 6
60 × 45Algo2 in the proposed EDPA95.191.521 M7.53 MBYesWx = 60, dx = 6
60 × 15Algo3 in the proposed EDPA95.10.46 M3.09 MBNoWx = 60, dx = 10
60 × 45Algo1 in the traditional EDPA [6]97.831.624 M7.88 MBYesWx = 60, dx = 6
60 × 45Algo2 in the traditional EDPA [8]95.291.623 M7.88 MBYesWx = 60, dx = 6
60 × 15Algo3 in the traditional EDPA [11]94.90.56 M3.28 MBNoWx = 60, dx = 10
* Floating point operations per second (mega flop/s).
Table 5. End-to-end latency and the number of requests per second (Req/s).
AlgorithmReq/sTotal
EDPA latency
Average
EDPA latency
Traditional EDPA using Algo1 DeepConvRNN_Attention [6]10.7910 s0.7910 s
Traditional EDPA using Algo2 FCN-LSTM [8]10.7510 s0.7510 s
Traditional EDPA using Algo3 light-weight FCN-LSTM [11]21.096 s0.498 s
Proposed EDPA using Algo370.651 s0.142 s
Proposed EDPA using Algo250.851 s0.182 s
Proposed EDPA using Algo140.951 s0.242 s
Table 6. The E D P A B W for the driver profiling algorithms.
AlgorithmTotal Prediction
and Input Frames
Data Size
Average EDPA BW
Traditional EDPA using Algo1 DeepConvRNN_Attention [6]10 MB10.09 MB/s
Traditional EDPA using Algo2 FCN-LSTM [8]10 MB10.51 MB/s
Traditional EDPA using Algo3 light-weight FCN-LSTM [11]5 MB9.12 MB/s
Proposed EDPA using Algo35 MB53.76 MB/s
Proposed EDPA using Algo210 MB58.75 MB/s
Proposed EDPA using Algo110 MB42.06 MB/s
Publisher’s Note: MDPI stays neutral with regard to jurisdictional claims in published maps and institutional affiliations.

